Article

Distribution and Potential Risk of Heavy Metals in Sediments of the Three Gorges Reservoir: The Relationship to Environmental Variables

1
State Key Laboratory of Hydro-science and Engineering, Department of Hydraulic Engineering, Tsinghua University, Beijing 100084, China
2
State Key Laboratory of Lake Science and Environment, Nanjing 210008, China
3
Changjiang River Scientific Research Institute of Changjiang Water Resources Commission, Wuhan 430015, China
*
Authors to whom correspondence should be addressed.
Water 2018, 10(12), 1840; https://doi.org/10.3390/w10121840
Submission received: 11 November 2018 / Revised: 5 December 2018 / Accepted: 10 December 2018 / Published: 12 December 2018
(This article belongs to the Special Issue Water-Worked Bedload: Hydrodynamic and Mass Transport)

Abstract

:
In this study, surface sediment samples were taken from the Three Gorges Reservoir (TGR) in June 2015 to estimate the spatial distribution and potential risk of Cu, Zn, Cd, Pb, Cr, and Ni (34 sites from the mainstream and 9 sites from the major tributaries), and correlations with environmental variables were analyzed (e.g., median sediment size, water depth, turbidity, dissolved oxygen of the bottom water samples, and total organic carbon, total nitrogen, and total phosphorus of the surface sediment samples). Results show that the heavy metal concentrations in the sediments have increased over the last few decades, especially for Cd and Pb; and the sites in the downstream area, e.g., Badong (BD) and Wushan (WS), have had greater increments of heavy metal concentrations. The sampling sites from S6 to S12-WS are identified as hot spots for heavy metal distribution and have relatively high heavy metal concentrations, and there are also high values for the sites affected by urban cities (e.g., the concentrations of Zn, Cd, Cr and Ni for the site S12-WS). Overall, the heavy metal concentrations increased slightly along the mainstream due to pollutants discharged along the Yangtze River and sediment sorting in the reservoir, and the values in the mainstream were greater than those in the tributaries. Meanwhile, the heavy metal concentrations were generally positively correlated with water depth (especially for Ni), while negatively correlated with dissolved oxygen, turbidity, and median sediment size. These environmental variables have a great impact on the partition of heavy metals between the sediment and overlying water. According to the risk assessment, the heavy metals in the surface sediments of TGR give a low to moderate level of pollution.

1. Introduction

Heavy metals exert significant negative impacts on the environment due to their abundance, persistence, and toxicity, which have been widely concerned by researchers [1,2,3]. Sediment particles, especially fine sediment particles, have a strong affinity to heavy metals in natural waters due to their specific surface area and surface active functional groups [4,5,6]. Thus, most heavy metal ions are adsorbed by sediments and transported in the particulate phase, with only a small portion remaining dissolved in the water column [7,8]. The accumulation of heavy metals at the bed surface, together with sediment, would result in a major source of heavy metals, which may be released into the overlying water under certain disturbances, posing a potential risk to the safety of the aquatic system [9,10]. Therefore, it is necessary to accurately assess the distribution and potential risk of heavy metals in the sediments.
The distribution of heavy metals in the sediments is affected by factors such as pollutant emissions, hydrodynamic conditions, sediment transport, and other physical and chemical processes [2,11,12]. Recently, human activities have exerted significant impacts on river systems. Firstly, pollutant effluents have greatly increased with the development of social economy, resulting in more heavy metals released into the aqueous systems [13]. Meanwhile, it is worth noting that many reservoirs have been built in rivers worldwide during the last decades [14], which operate to support a variety of social, economic, and ecological purposes. However, a reservoir operation would also alter the hydrological regime [15], accelerate sediment deposition and sorting along the main channel [16,17], and accordingly affect the occurrence and distribution of sediment-associated heavy metals [18], i.e., influencing the sediment and heavy metal balances in the river system [19,20,21]. Thus, the relationship between heavy metal distribution and environmental variables should be further studied due to human activities such as reservoir operation.
In this study, the distribution and potential risk of heavy metals (Cu, Zn, Cd, Pb, Cr, and Ni, which are the major heavy metals of concern) in the sediments of Three Gorges Reservoir (TGR, the largest hydraulic project in the world) is studied as an example, and the relationship to environmental variables is discussed. There have been some studies focusing on heavy metal distribution in sediments of the mainstream or tributaries of the TGR [22,23,24,25,26,27], and Zhao et al. [28] reviewed the available literature published on the heavy metal concentrations of the TGR sediments. However, only a few sampling sites were adopted by these studies, and the sampling sites were mostly localized or predominantly distributed in certain tributaries (e.g., the Daning River, Meixi River and Xiangxi River), which cannot characterize the heavy metal distribution in sediments of the whole reservoir well. Meanwhile, the relationship between heavy metal distribution and environmental variables have been generally lacking. Thus, a comprehensive sampling and analysis are conducted in this study, including 34 sites from the mainstream and 9 sites from the major tributaries, which is expected to provide a reference for the management of TGR and other similar reservoirs.

2. Materials and Methods
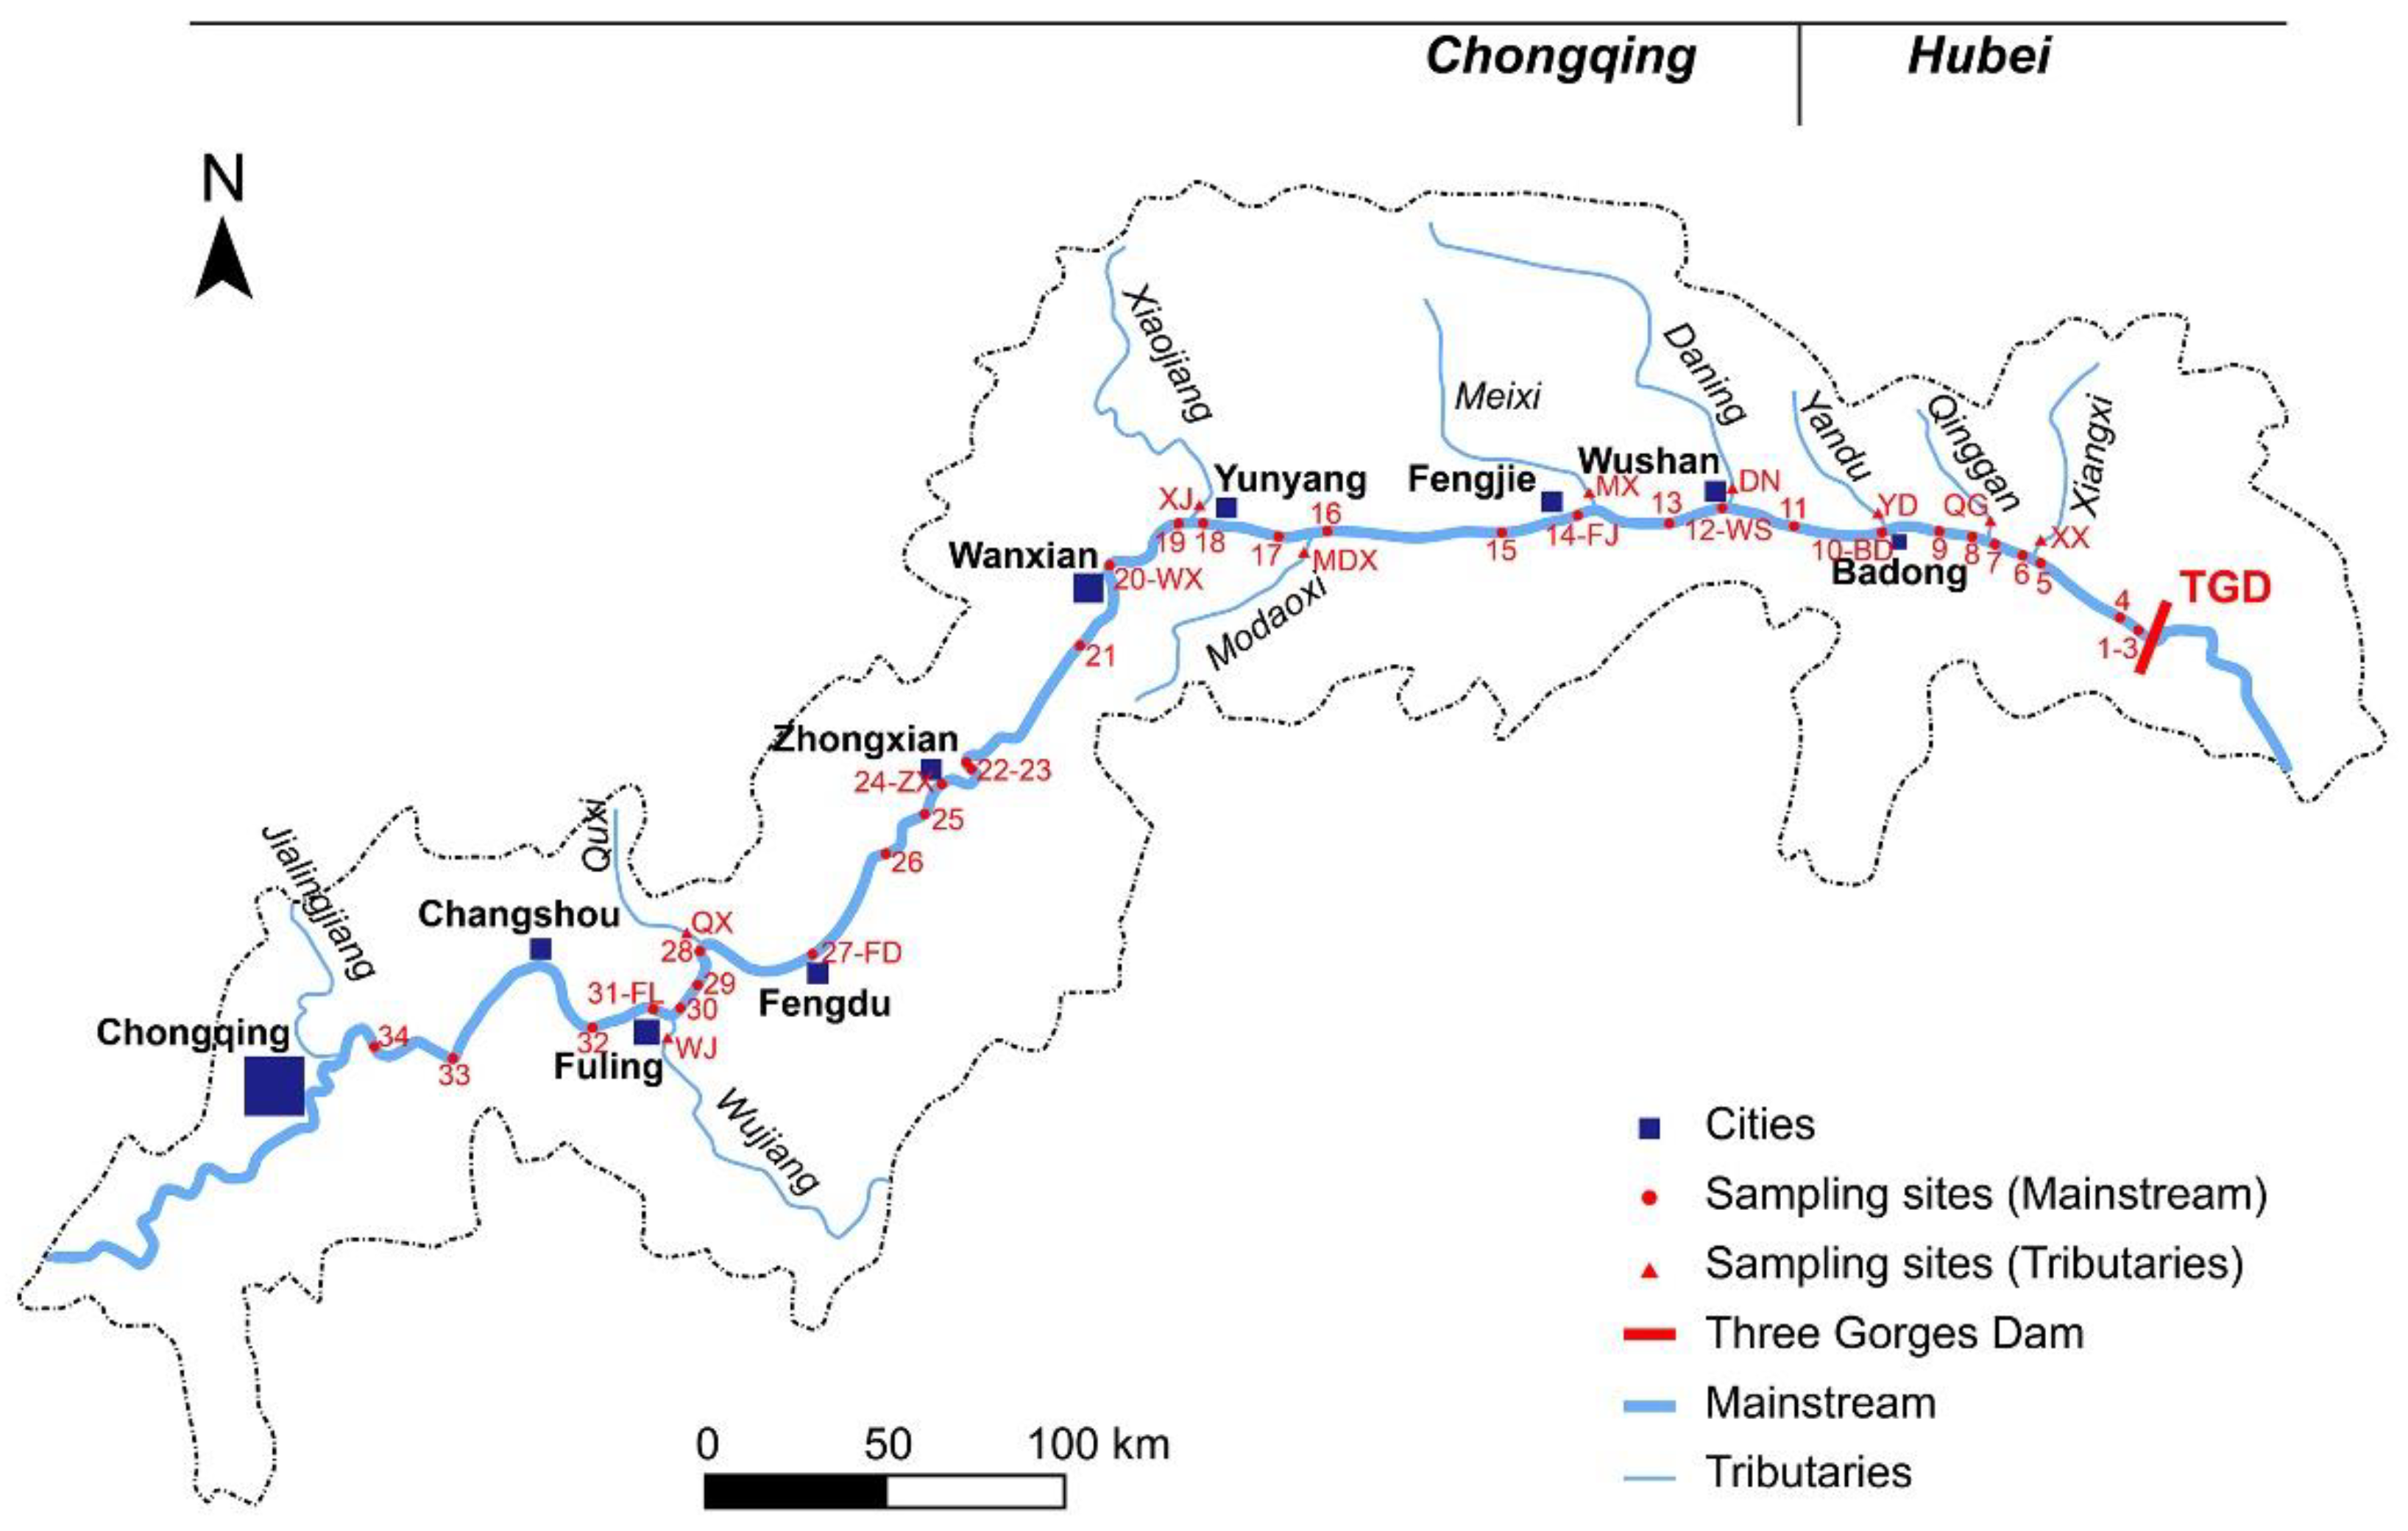
2.1. Study Area

Three Gorges Reservoir is located in the upstream Yangtze River, as shown in Figure 1. It started impoundment in June of 2003, and the fore-bay water level first reached its normal pool level (NPL) of 175 m in October, 2010. The total capacity of the reservoir is 393 × 108 m3, with a flood control capacity of 221.5 × 10⁸ m3; and the surface area is 1084 km2 under the NPL [29]. The reservoir region belongs to the Chongqing city and Hubei province, including the counties of Changshou (CS), Fuling (FL), Fengdu (FD), Zhongxian (ZX), Wanxian (WX), Yunyang (YY), Fengjie (FJ), Wushan (WS), and Badong (BD). According to the environmental and ecological monitoring bulletins of the TGR area [13], the population in the TGR area was 14.65 million by the end of 2015, including 13.17 million in Chongqing and 1.48 million in Hubei. In 2015, the gross domestic product (GDP) of the whole area was close to 700 billion CNY (China Yuan), i.e., an increase of 11.1% compared with that in 2014. Correspondingly, there were 212 million tons of industrial wastewater, and 815 million tons of urban domestic sewage discharged in the TGR area. Moreover, about 410,000 hectares of land are used for agriculture, with pesticide use of 601.8 tons and chemical fertilizer use of 135,000 tons. The land use in the region of TGR is presented in Figure S1. There is still a certain amount of sewage discharged by ships. Meanwhile, increasing the water level due to the operation of TGR results in decreasing flow velocity and increasing sediment deposition in the reservoir. The average flow velocity decreased from 1.33 m/s in Chongqing to 0.22 m/s in Badong in 2015 [13]. The sediment delivery ratio of TGR was estimated to be 13.3% in 2015, with most sediment deposited during the period from June to September and in the wide valley segments; and the sediment delivery ratio from June 2003 to December 2015 was 24.2% [30].

2.2. Sampling

During the period of 5–13 June 2015, 43 surface sediment samples were collected using a grab sampler from the TGR, when the fore-bay water level varied from 150 to 151 m. Figure 1 shows the distribution of these sampling sites, and the detailed latitude and longitudes are listed in Table S1 (see Supplementary Materials). There are 34 sites distributed in the mainstream from the dam to Chongqing with an average interval of 15–20 km, which covers the whole reservoir of about 600 km. Here the sites affected by urban cities are specially annotated, e.g., S10-BD represents the site affected by Badong. There are 9 more sites distributed in the major tributaries, including Xiangxi (XX), Qinggan (QG), Yandu (YD), Daning (DN), Meixi (MX), Modaoxi (MDX), Xiaojiang (XJ), Quxi (QX), and Wujiang (WJ). As the heavy metal concentrations in the sediments of tributaries generally show an increasing trend along the flow direction [28], the sampling sites of these tributaries are arranged in the tributary estuaries, see Figure 1. The collected sediment samples were stored in clean polyethylene bags and treated immediately once returning to the laboratory. The sediment was air dried, ground, and the impurities were removed through a 100-size sieve. Meanwhile, the bottom water samples were also collected just above the bed surface using a column sampler for the measurement of environmental variables.

2.3. Analytical Methods

The total heavy metal concentrations of Cu, Zn, Cd, Pb, Cr, and Ni in the sediments were measured using inductively coupled plasma-mass spectrometry (ICP-MS) as suggested by Liu et al. [31], i.e., the sediment samples were digested using distilled HF + HNO3 solutions in screw-top Teflon beakers, and then used for the determination of heavy metal concentrations by ICP-MS. For more details, refer to Gao et al. [24]. Precision and accuracy were verified using standard reference material GBW07310 (GSD-10) purchased from the National Center of Reference Material (NCRM), and the average recoveries were 93–108%. Meanwhile, the chemical properties of sediments, including the total organic carbon (TOC), total nitrogen (TN), and total phosphorus (TP), were determined according to the standard methods for soil analysis [32], and the total polycyclic aromatic hydrocarbons (PAHs) and phthalic acid esters (PAEs) were determined using gas chromatography-mass spectrometry (GC-MS) analysis [33]. The grain size was measured by a laser scattering particle size distribution analyzer (LA-920, Horiba, Kyoto, Japan).
Moreover, the turbidity and dissolved oxygen (DO) of the bottom water samples were assessed in the field by the YSI meter (YSI Inc., Yellow Springs, OH, USA), and the corresponding concentrations of Cu, Zn, Cd, Pb, and Cr were assessed in the laboratory following the standard analytical methods [34]. The water depth, H, was detected with an ultrasonic wave detector.

2.4. Risk Assessment

The potential ecological risk was used to assess the heavy metal eco-risk in the sediments [35]:
E r i = T r i C f i ,
where T r i is the toxic response factor of each heavy metal, i.e., Cu = 5, Zn = 1, Cd = 30, Pb = 5, Cr = 2, and Ni = 5; C f i is calculated as C f i = C s i / C n i , where C s i is the measured metal concentration in the sediments, and C n i is the regional background value. Here the background value in the Yangtze River was used, i.e., 35, 78, 0.25, 27, 82, and 33 mg/kg for Cu, Zn, Cd, Pb, Cr, and Ni, respectively [28,36]. The ecological risk of each heavy metal was classified as low ( E r i < 40 ), moderate ( 40 E r i < 80 ), considerable ( 80 E r i < 160 ), high ( 160 E r i < 320 ), or very high ( E r i 320 ). The comprehensive index, R I , of potential ecological risk is expressed as
R I = i = 1 n E r i ,
and the ecological risk level of all heavy metals is defined as low ( R I < 150 ), moderate ( 150 R I < 300 ), considerable ( 300 R I < 600 ), or very high ( R I > 600 ).

2.5. Statistical Analysis

The principal component analysis (PCA), hierarchical cluster analysis (HACA), and Pearson correlation analysis (CA) were conducted using SPSS 20.0. The Kaiser-Meyer-Olkin (KMO) and Bartlett’s test were introduced to evaluate the validity of PCA [2]. Moreover, the redundancy analysis (RDA) was executed using Canoco 4.5 to analyze the interactions between the heavy metal distribution and the relevant environmental variables.

3. Results

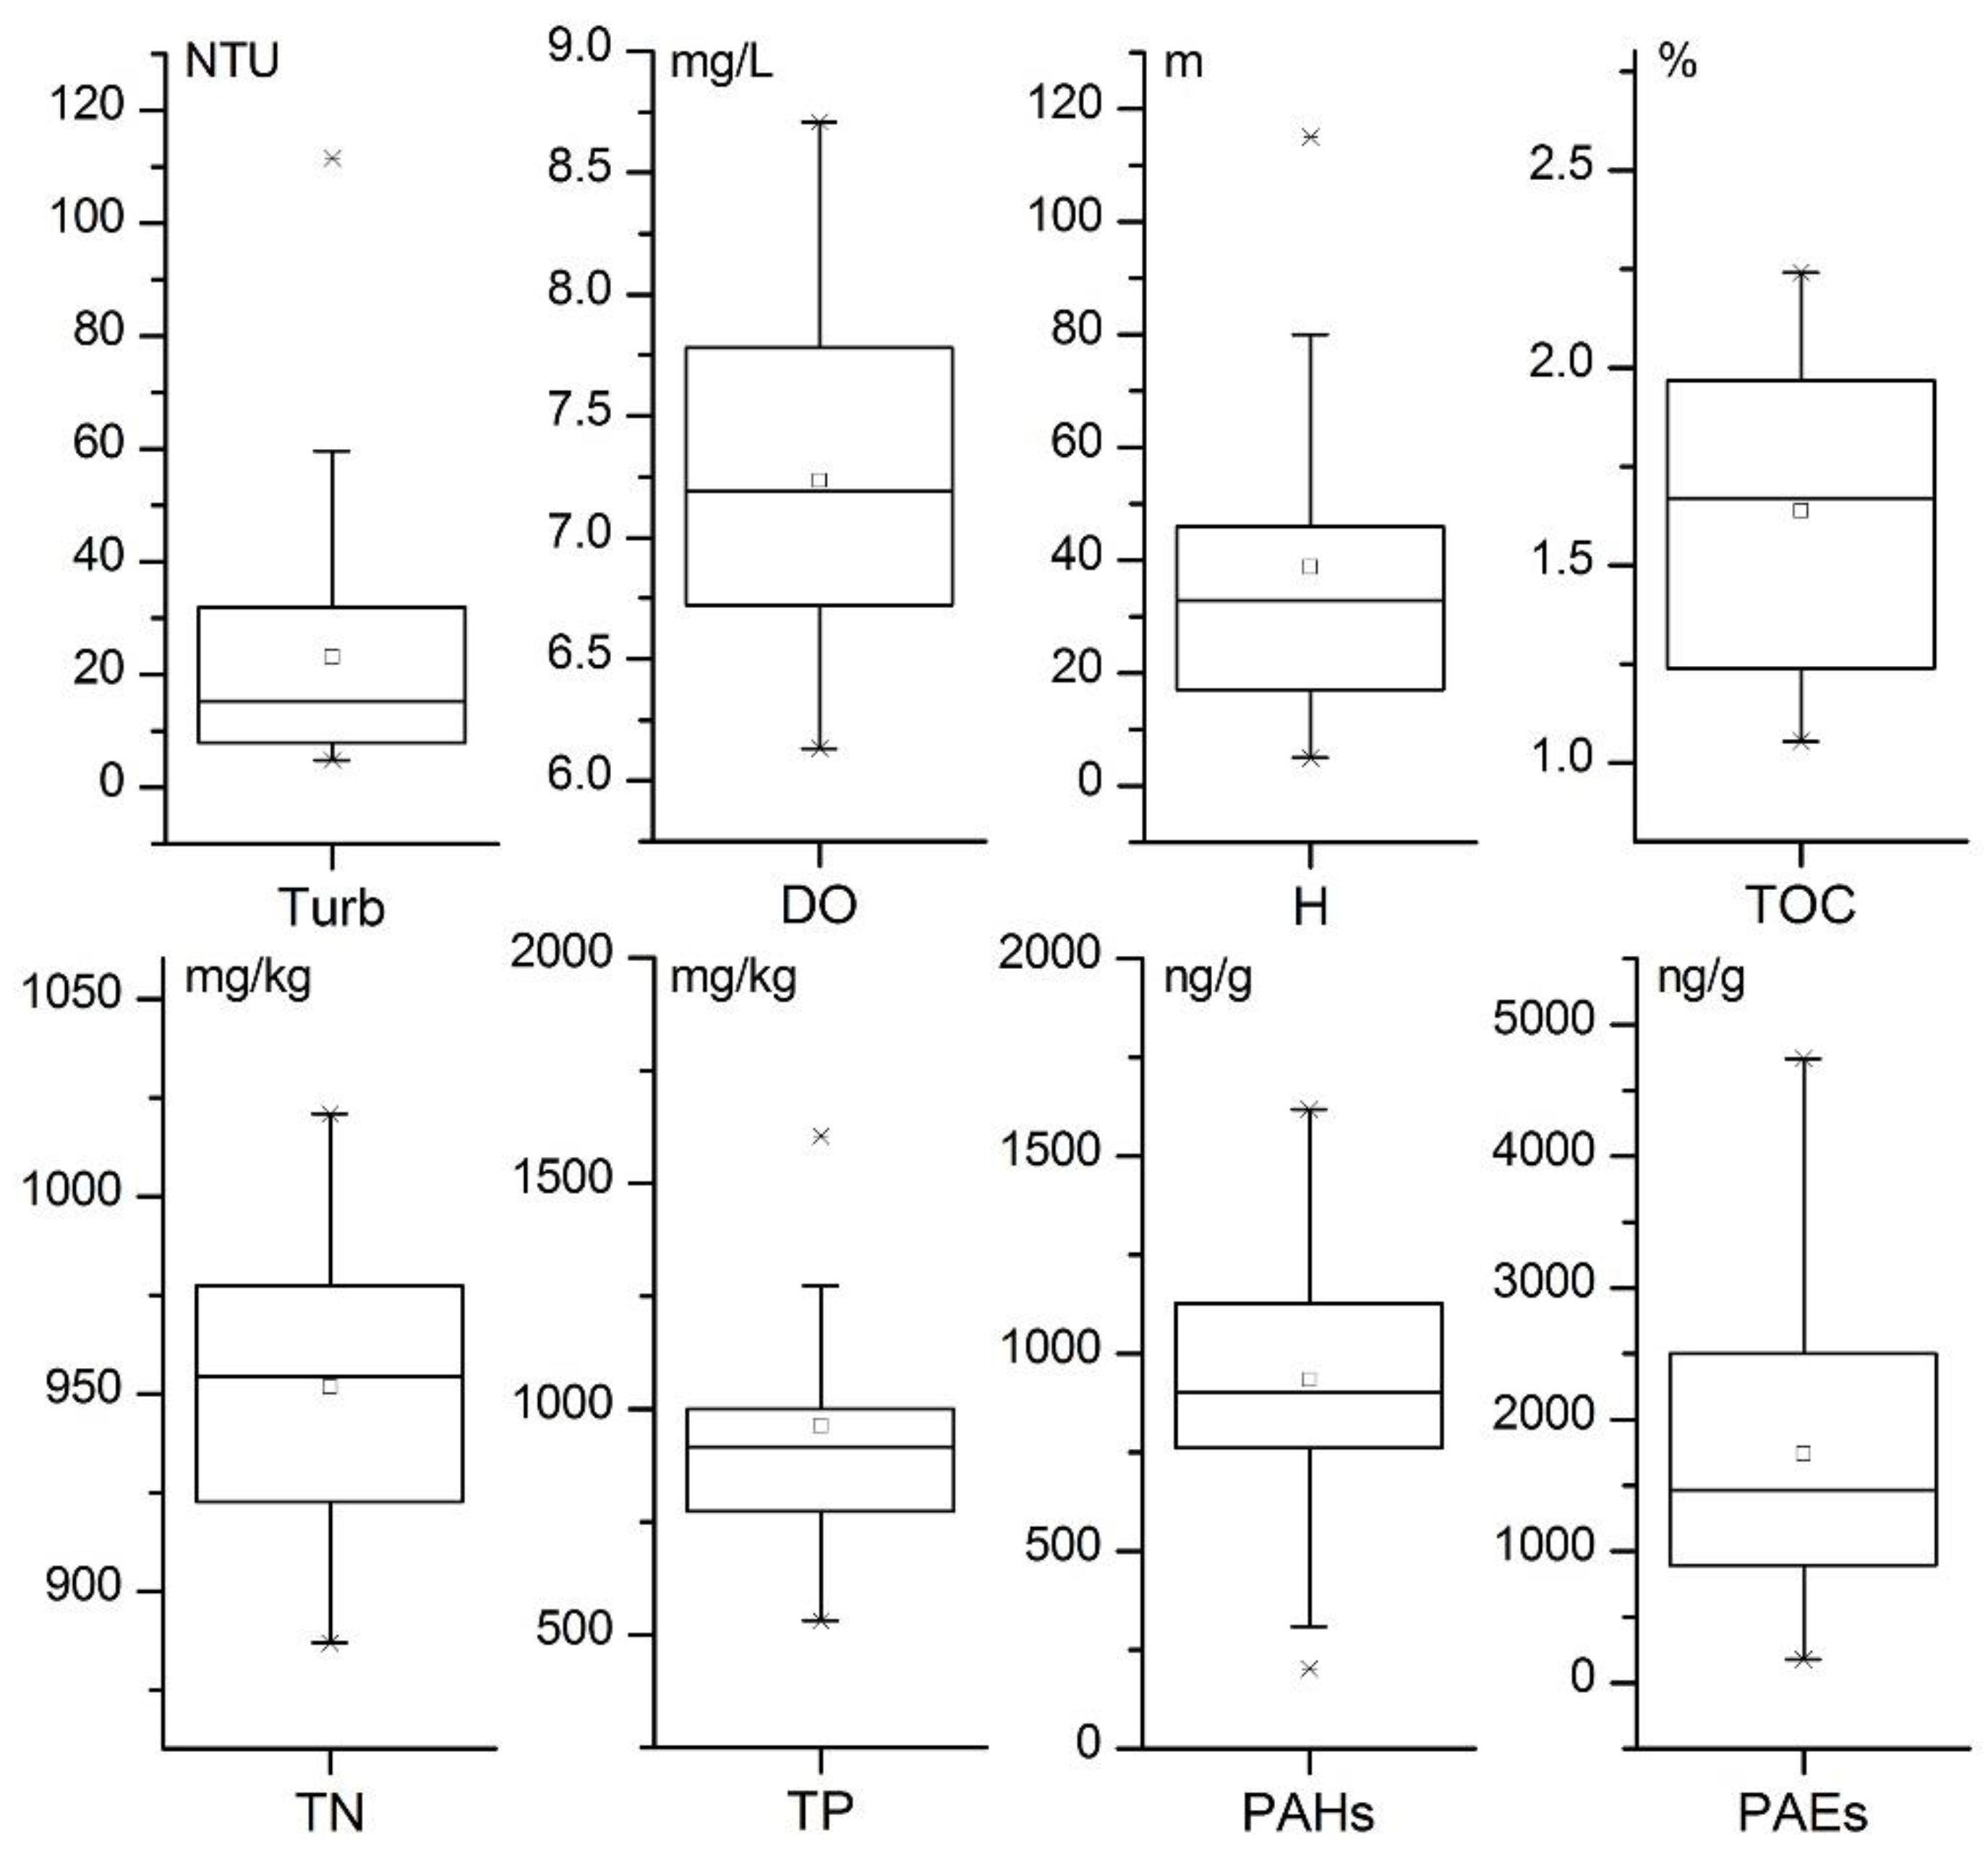
3.1. Environmental Variables

The physical and chemical parameters of the sampling sites are listed in Table S1, including the turbidity, DO of the bottom water samples, the water depth, median sediment size (D50), textural composition (i.e., clay: D ≤ 0.004 mm; silt: 0.004–0.062 mm; and sand: 0.062–2.0 mm), and the TOC, TN, TP, and total PAHs and PAEs of the surface sediment samples. Figure 2a presents the textural composition of the surface sediment samples, corresponding to a clay content of 25–50%, a silt content of 50–75%, and a sand content of 0–25%, which can be defined as clayey silt following Shepard [37]. Particularly, the sampling site S10-BD has a greater clay content of 57.01%, while S33 has a relatively greater sand content of 24.71%. Figure 2b shows the variation of median sediment size with distance to the dam. The overall range of D50 is from 0.004 to 0.020 mm, and there is a decreasing trend of D50 when approaching the dam (R2 = 0.68), indicating a significant sediment sorting along the main channel.
The box plots of other environmental variables are further presented in Figure 3. The average turbidity of these bottom water samples was 23.14 NTU. The measured DO concentration was 7.23 ± 0.62 mg/L (i.e., an oxidized status), implying that the TGR is an un-stratified reservoir with essentially uniform oxygen concentration from the water surface to the bed sediments, thus maintaining oxic conditions at the sediment surface [19,38]. The water depth ranges from 5 to 115 m, which can represent the different water depths in the reservoir well. The TOC, TN and TP indicate the trophic status of the sediment, and they were 1.64 ± 0.36%, 951.7 ± 34.1 mg/kg and 963.2 ± 273.0 mg/kg, respectively. The organic pollutants of the total PAHs and PAEs were estimated to be 935.9 ± 311.4 ng/g and 1740.6 ± 1181.5 ng/g, respectively. Apparently, the total PAEs exhibited a greater variability.

3.2. Heavy Metal Concentrations

The measured heavy metal concentrations in the surface sediment samples are listed in Table 1, where the results of the mainstream and tributaries are separately presented. Meanwhile, the measured values in previous studies of the TGR are also listed in Table 1. Overall, the heavy metal concentrations in the sediments of mainstream were relatively greater than those in the sediments of tributaries, which is consistent with Zhao et al. [28]. Tang [39] observed that the heavy metal concentration in the north bank of TGR was lower than that in the south bank due to the effects of tributaries, which also verifies that there are lower heavy metal concentrations in the tributaries than the mainstream. Meanwhile, the remarkable variation of Cd, i.e., 31.4% in the mainstream and 25.2% in the tributaries, reflects the influence of anthropogenic activity.
Compared with the previous results of the TGR before impoundment, i.e., TGR-1985 measured by Xu et al. [40], the average heavy metal concentrations has mostly increased over the last few decades. A more detailed comparison for the sites affected by urban cities are further presented in Table S2. There was a significant increase in heavy metal concentrations of these sites, especially for the heavy metals Cd and Pb; and the sites in the downstream area had greater increments of heavy metal concentrations, e.g., Badong and Wushan. Meanwhile, it is worth noting that the surface sediment samples in Xu et al. [40] were collected from the riverside, which is more likely to be affected by the urban cities. After impoundment, there was a tendency for the heavy metal concentrations to still slightly increase. Moreover, if compared with the soil standards (GB15618-1995) [41], most of these sites can be classified into category II, i.e., a low contamination.

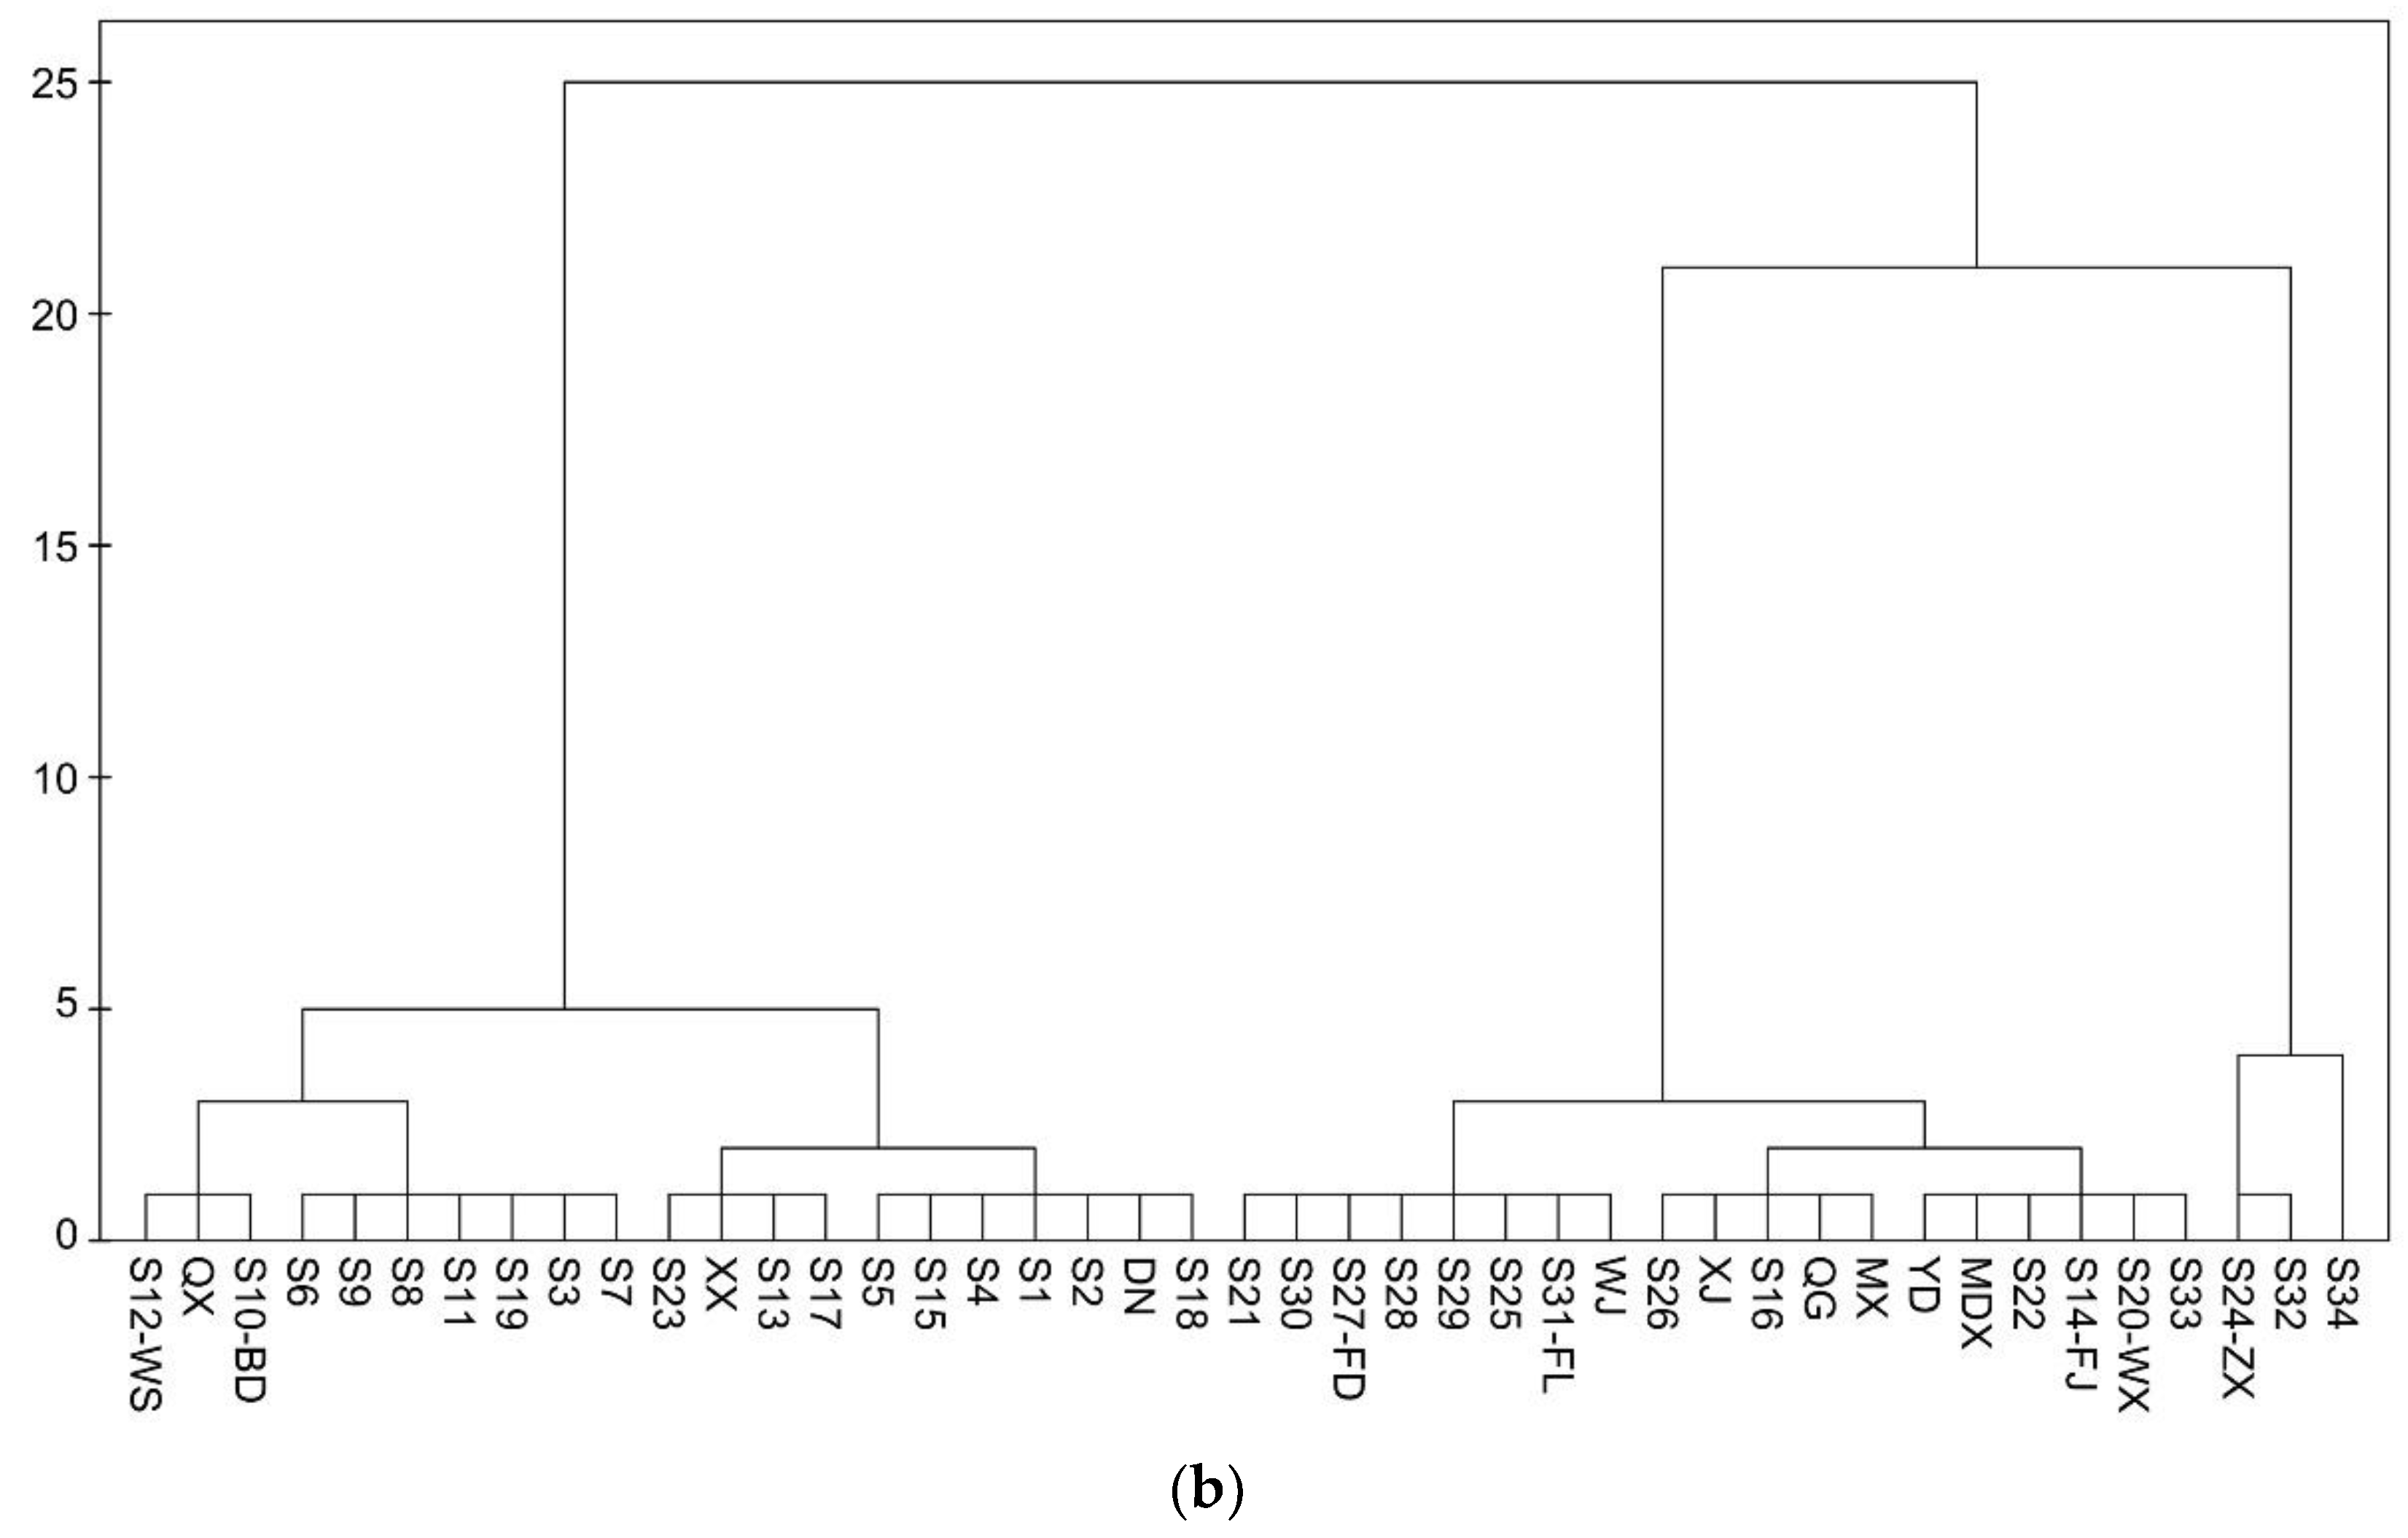
3.3. Spatial Distribution of Heavy Metals

Figure 4 shows the spatial distribution of Cu, Zn, Cd, Pb, Cr, and Ni in the TGR, and the sampling sites in the mainstream and tributaries are separately presented in each figure. The red lines represent the polynomial trend lines, and the white lines indicate the soil standard values of GB 15618-1995 (i.e., category I, II, or III). Overall, the heavy metal concentrations increased slightly along the mainstream, especially the concentration of Ni. Firstly, there are pollutants of point and non-point sources discharged gradually along the Yangtze River (see Figure S1), resulting in a higher heavy metal concentration in the downstream compared with that in the upstream. Secondly, the operation of TGR leads to sediment sorting along the main channel (Figure 2b), i.e., fine sediment deposits close to the dam, while coarse sediment deposits at the reservoir tail. So the strong affinity of fine sediment to the pollutants also results in a higher heavy metal concentration downstream.
Meanwhile, the sampling sites from S6 to S12-WS were found to have relatively high heavy metal concentrations, i.e., hot spots for the distribution of heavy metal concentration. Whereas, there was relatively lower heavy metal concentrations for the sampling sites from S25 to S30, indicating that local pollutant emissions have a great influence on the spatial distribution of heavy metal concentrations. Moreover, the sites affected by urban cities also have relatively high heavy metal concentrations. For example, the concentrations of Cd and Cr for the site S10-BD (Badong), the concentrations of Zn, Cd, Cr and Ni for the site S12-WS (Wushan), the concentration of Cr for the site S24-ZX (Zhongxian), and the concentrations of Zn, Cd, and Cr for the sites S34 (probably affected by the main urban districts of Chongqing) are much greater than other sites. However, the urban emission of pollutants can only affect a certain range, and the pollutants will then deposit onto the riverbed together with the sediment [44]. Similarly, the tributaries exhibited lower heavy metal concentrations than the mainstream, except for the site from Quxi, which had relatively high concentrations of all six heavy metals.
As compared with the soil standard values, the concentrations of most heavy metals can be classified into category II (i.e., a low contamination), while the Cd concentrations in eight sites belong to category III, that is close to the high contamination threshold value, including S4, S9, S10-BD, S12-WS, S32, S33, S34, and QX. The spatial distribution of Cd seems to be slightly different from other heavy metals, which will be further discussed in the following sections.

4. Discussion

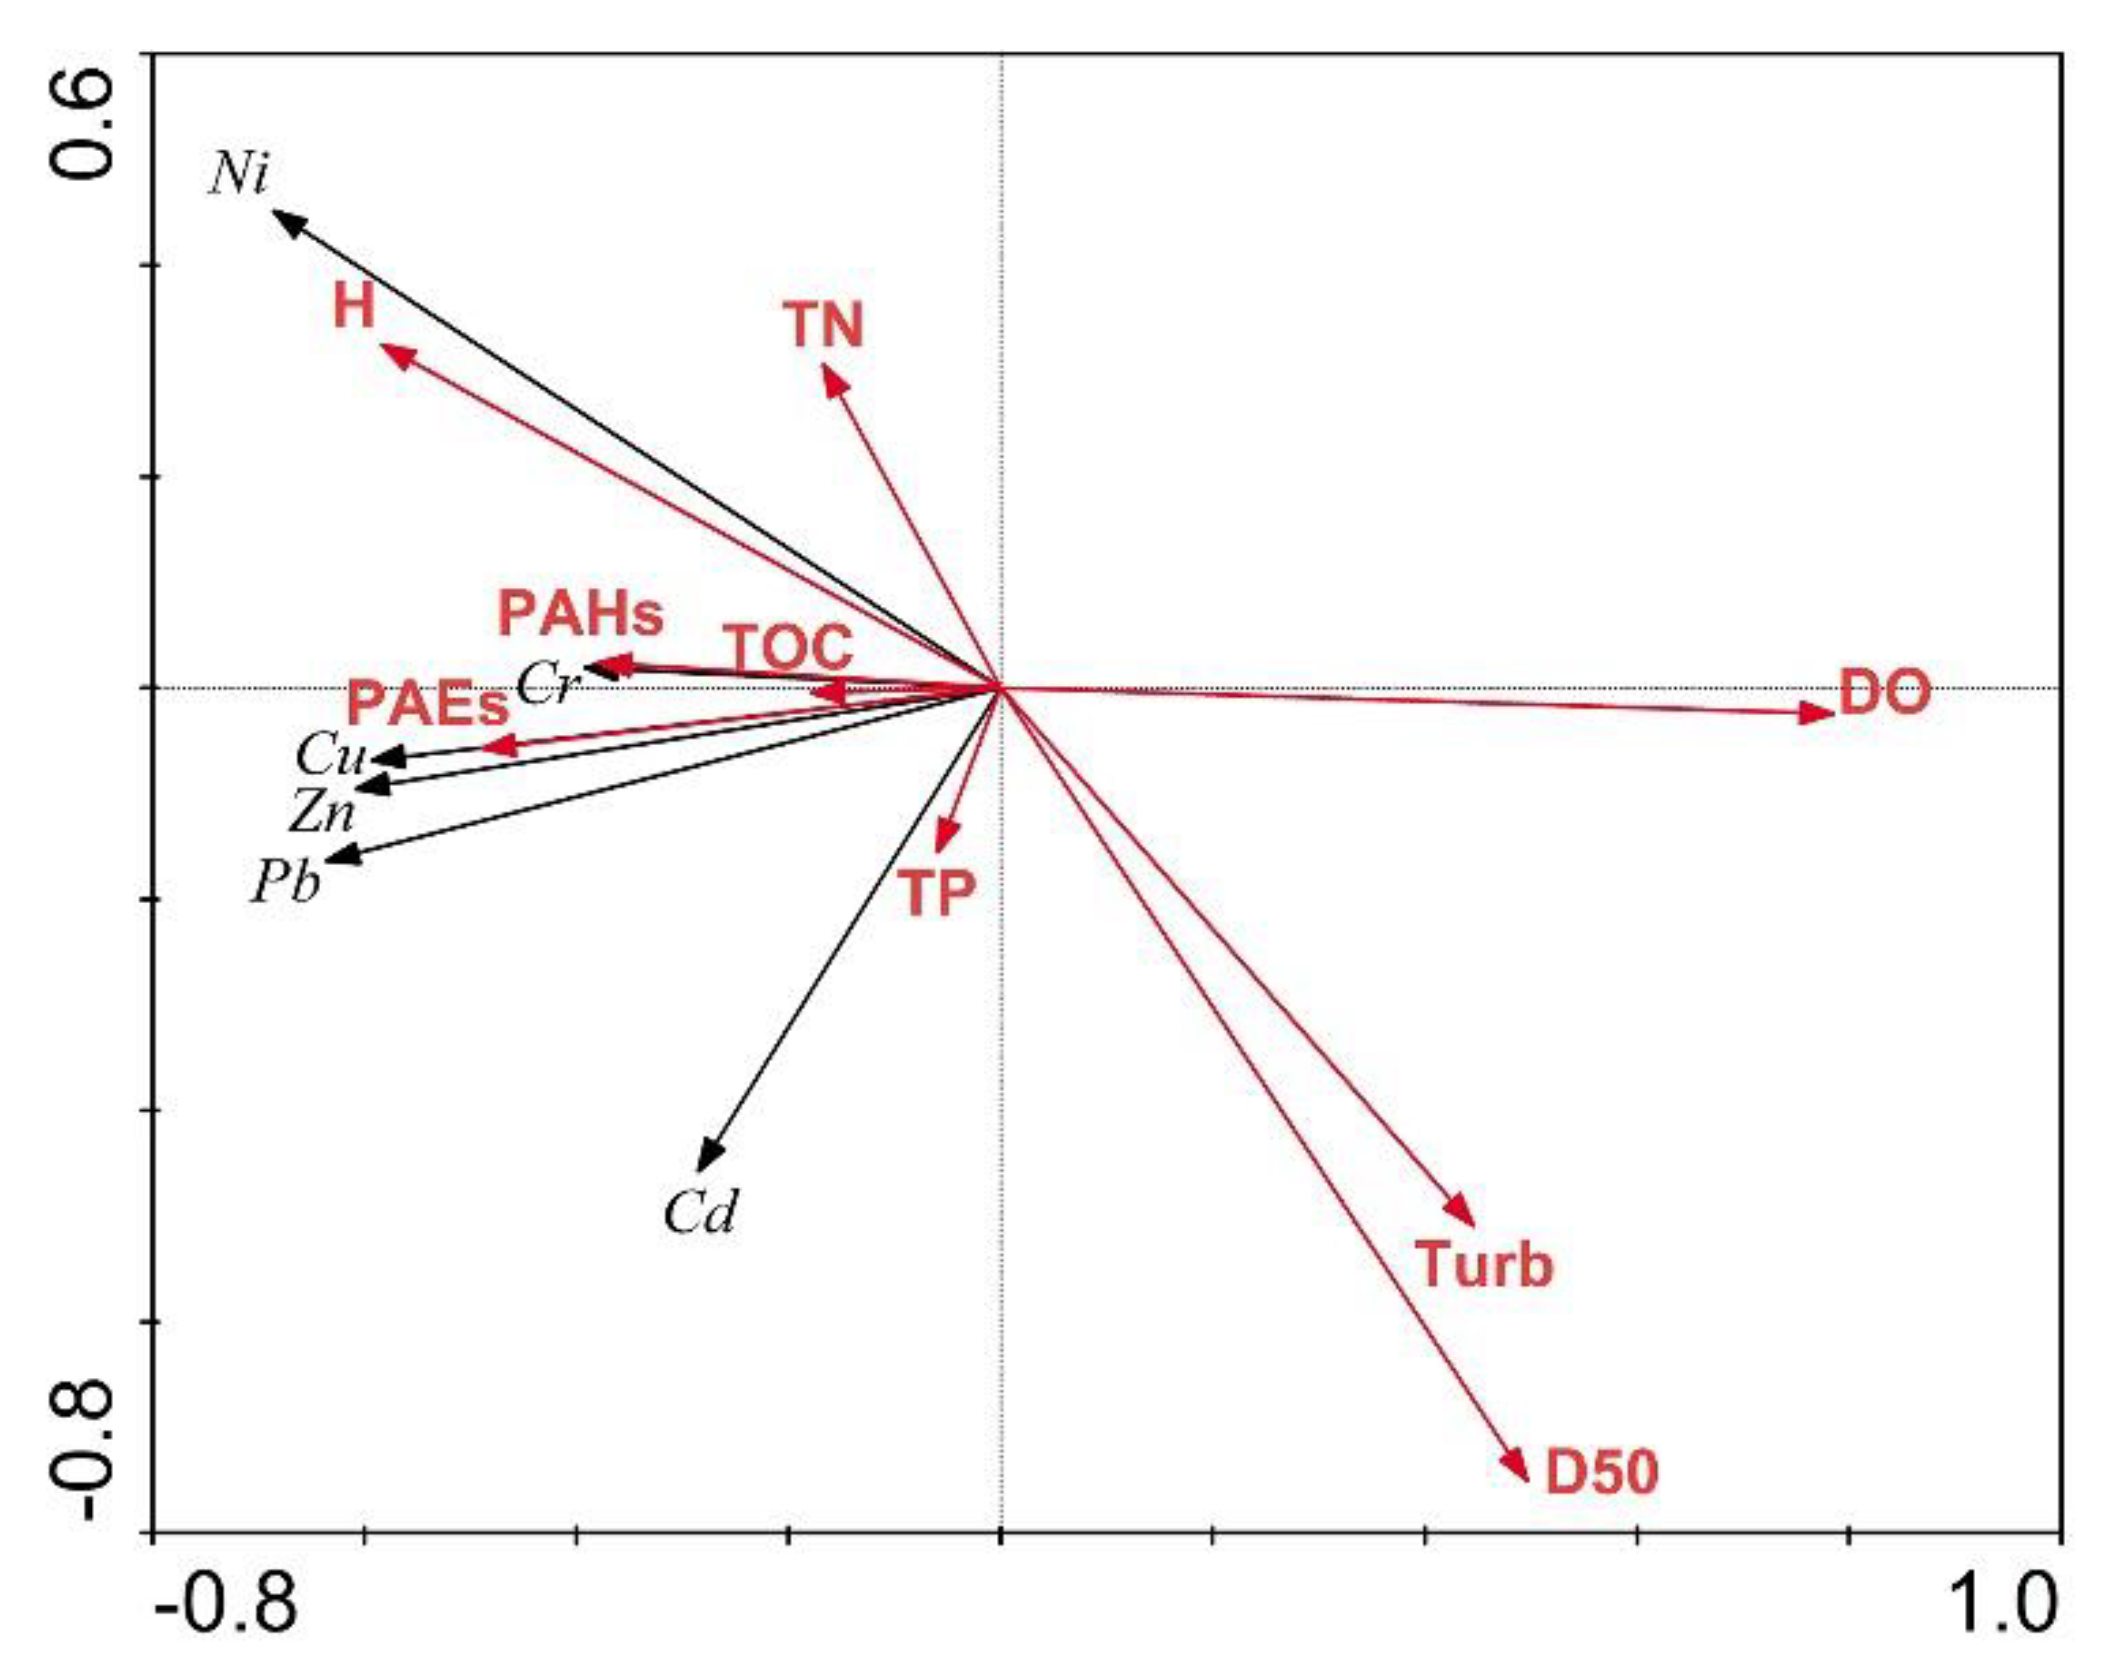
4.1. Source Identification

The PCA approach was performed to identify the characteristics (or sources) of the heavy metals in the sediments of TGR [45], and a > 0.5 of KMO (0.595) and significant Bartlett’s test (<0.001) demonstrated its validity. Figure 5 shows the relationships among these heavy metals. Two principal components are extracted with eigenvalues greater than 1, which can explain 82.8% of the total variance.
As shown in Figure 5, component 1 that explains 49.2% of the variance mainly represents the pollution of Ni, Cu, and Pb, while component 2 that explains 33.6% of the variance mainly represents the pollution of Cd. These results imply a similar source for the heavy metals Ni, Cu, and Pb, which is different from that of Cd. Based on the Pb isotope composition, Bing et al. [22] concluded that Pb in the sediments of TGR mainly originated from industrial discharge, domestic sewage, mining, smelting, and the shipping industry. However, Cd is an identification element of agricultural activities, i.e., the application of pesticides and fertilizers [25,46]. Liu et al. [47] stated that Cd is found predominantly in phosphate fertilizers as an impurity of phosphate rocks; and the amount of pesticides and fertilizers used in the TGR were 601.8 tons of 135,000 tons, respectively, in 2015 [13]. Meanwhile, there is also a high content of Cd in coal mines [48], and Liu et al. [49] concluded that Cd-rich coal mining activity may contribute to the high concentration of Cd in the Three Gorges region.
Moreover, the CA analysis was conducted based on the PCA results, as shown in Figure 6a. Accordingly, the sampling sites can be classified into three main groups: (1) PC1 < 0 and PC2 < 1 with a low pollution of these heavy metals, including S14-FJ, S16, S20-WX, S21, S22, S25, S26, S27-FD, S28, S29, S30, S31-FL, S33, and QG, YD, MX, MDX, XJ, WJ; (2) 0 < PC1 < 2 with different degrees of Ni, Cu, and Pb pollution, including S1, S2, S3, S4, S5, S6, S7, S8, S9, S10-BD, S11, S12-WS, S13, S15, S17, S18, S19, S23, and XX, DN, QX; and (3) PC2 > 1 mainly affected by Cd, including S24-ZX, S32, and S34, where the site S24-ZX also has a high content of Cr. For the mainstream, the sites are mainly classified following the locations, i.e., the upstream sites exhibit a lower pollution compared with the downstream sites, which is also shown in Figure 4. Among the downstream sites, S6, S8, S9, S11, and S19 exhibit relatively high pollution. Moreover, the sites from most tributaries are light polluted, except for the sites XX, DN, and QX which exhibit different degrees of Ni, Cu, and Pb pollution.
In Figure 6a, the groups 1 and 2 are further divided into several sub-groups according to the Hierarchical diagram (see Figure 6b). For example, the sites S21, S30, and WJ in group 1 are the least polluted, and S33 also exhibits a certain degree of Cd pollution; the sites S6, S9, and S19 in group 2 have relatively high concentrations of Ni, Cu, and Pb compared with other sites, and S10-BD, S12-WS, and QX have medium to high concentrations of all these heavy metals.

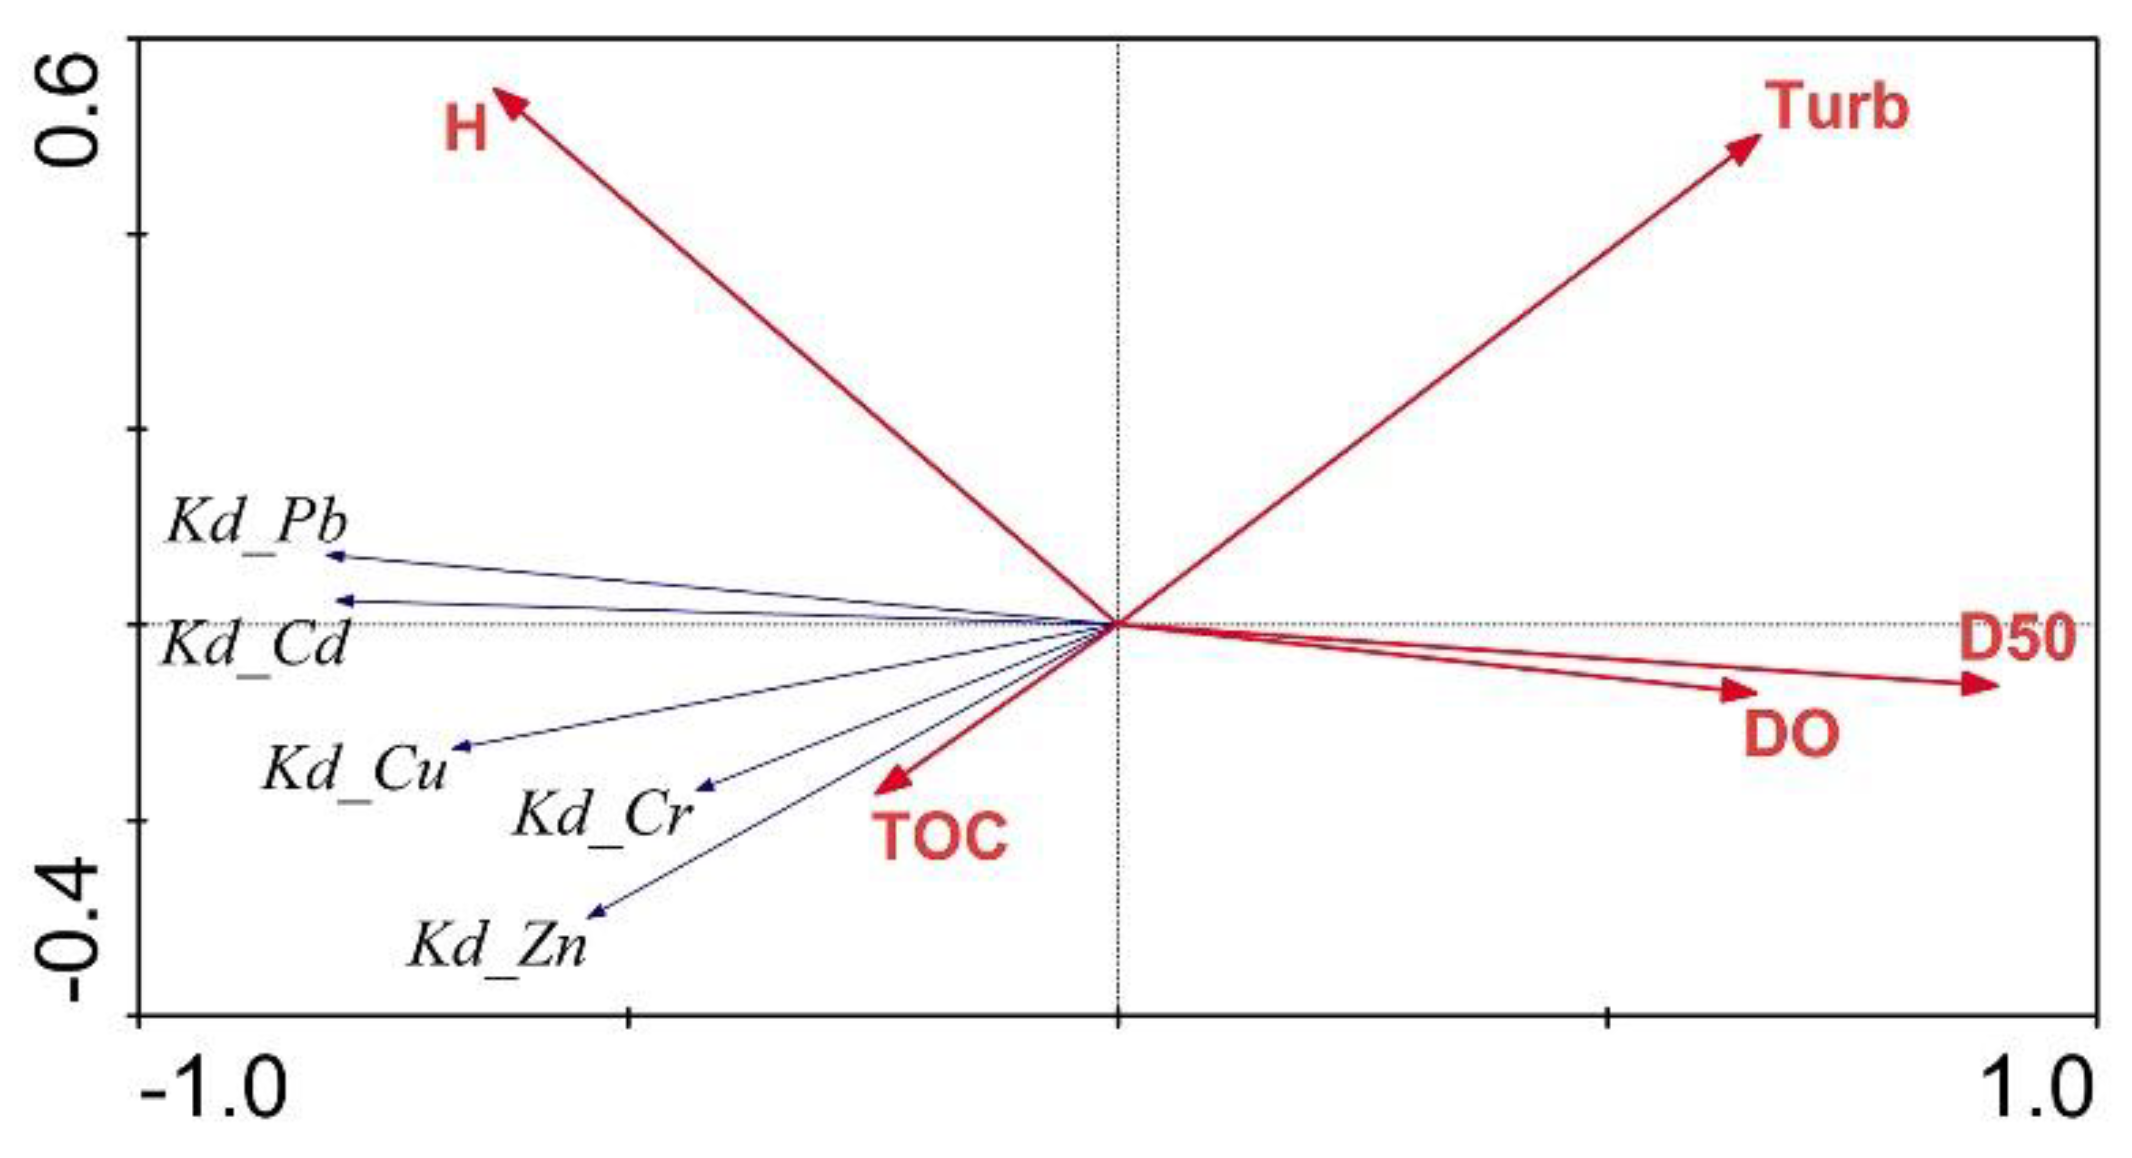
4.2. Impacts of Environmental Variables

Table 2 shows a correlation matrix between the six heavy metals and environmental variables described in Section 3.1. Overall, the heavy metal concentrations are negatively correlated with the D50, turbidity, and DO, while positively correlated with the water depth, H, and TOC. The redox condition can affect the solubility of heavy metals, which will be more likely fixed in the sediment under a reduction condition, i.e., a low DO condition [50]. Fine sediment particles have a higher affinity for the heavy metals. Xiao et al. [51] found that the sediment in Xiangxi is mainly comprised of chlorite, illite, and quartz, and the heavy metal concentration increases with decreasing sediment size and increasing content of chlorite and illite. Thus, in the region with a great water depth (e.g., the region close to the dam), a relatively low DO value and fine sediment size due to sediment sorting will lead to a greater heavy metal concentration in the sediment. Meanwhile, as organic matter can stabilize heavy metals in the sediment [50], the heavy metal concentrations are also positively correlated with the TOC values.
Particularly, there is a significant negative correlation between the heavy metal Ni and the D50, turbidity and DO, and a significant positive correlation between Ni and H (p < 0.01), i.e., the Ni concentration increases along the mainstream, implying that Ni mainly originates from upstream. Meanwhile, there are also significant negative correlations between DO and the heavy metals Cu, Zn and Pb (p < 0.01), and between D50 and Cu and Pb (p < 0.05), i.e., there is a similar source of Cu, Zn and Pb to that of Ni. However, a significant positive correlation is observed between D50 and Cd (p < 0.05), implying a relatively different source of Cd compared to other heavy metals, which is also shown in Figure 5. As previously stated, Cd generally serves as an impurity of phosphate rocks, so it is slightly positively correlated with the TP.
Moreover, the TN and TP are not significantly correlated with the heavy metals, implying different sources. However, total PAH is positively correlated with Cd (p < 0.01), and total PAE is also significantly correlated with Zn, Cd, Pb and Cr (p < 0.05), implying similar sources and transport characteristics.
The RDA analysis was conducted to further investigate the influences of environmental variables on heavy metal distributions, as shown in Figure 7. The lengths of the environmental variable arrows reflect the degree of relevance, and it can be found that there are greater correlations between the heavy metal concentrations and H, DO, turbidity, and D50, which can also be concluded from Table 2. Meanwhile, according to angles between these arrows (i.e., the projections), the heavy metal concentrations are positively correlated to the water depth, H, especially for Ni; while they are generally negatively correlated with DO, turbidity, and D50. In comparison, the TOC, TN, TP, and total PAEs and PAHs have slight influences on the heavy metal concentration.

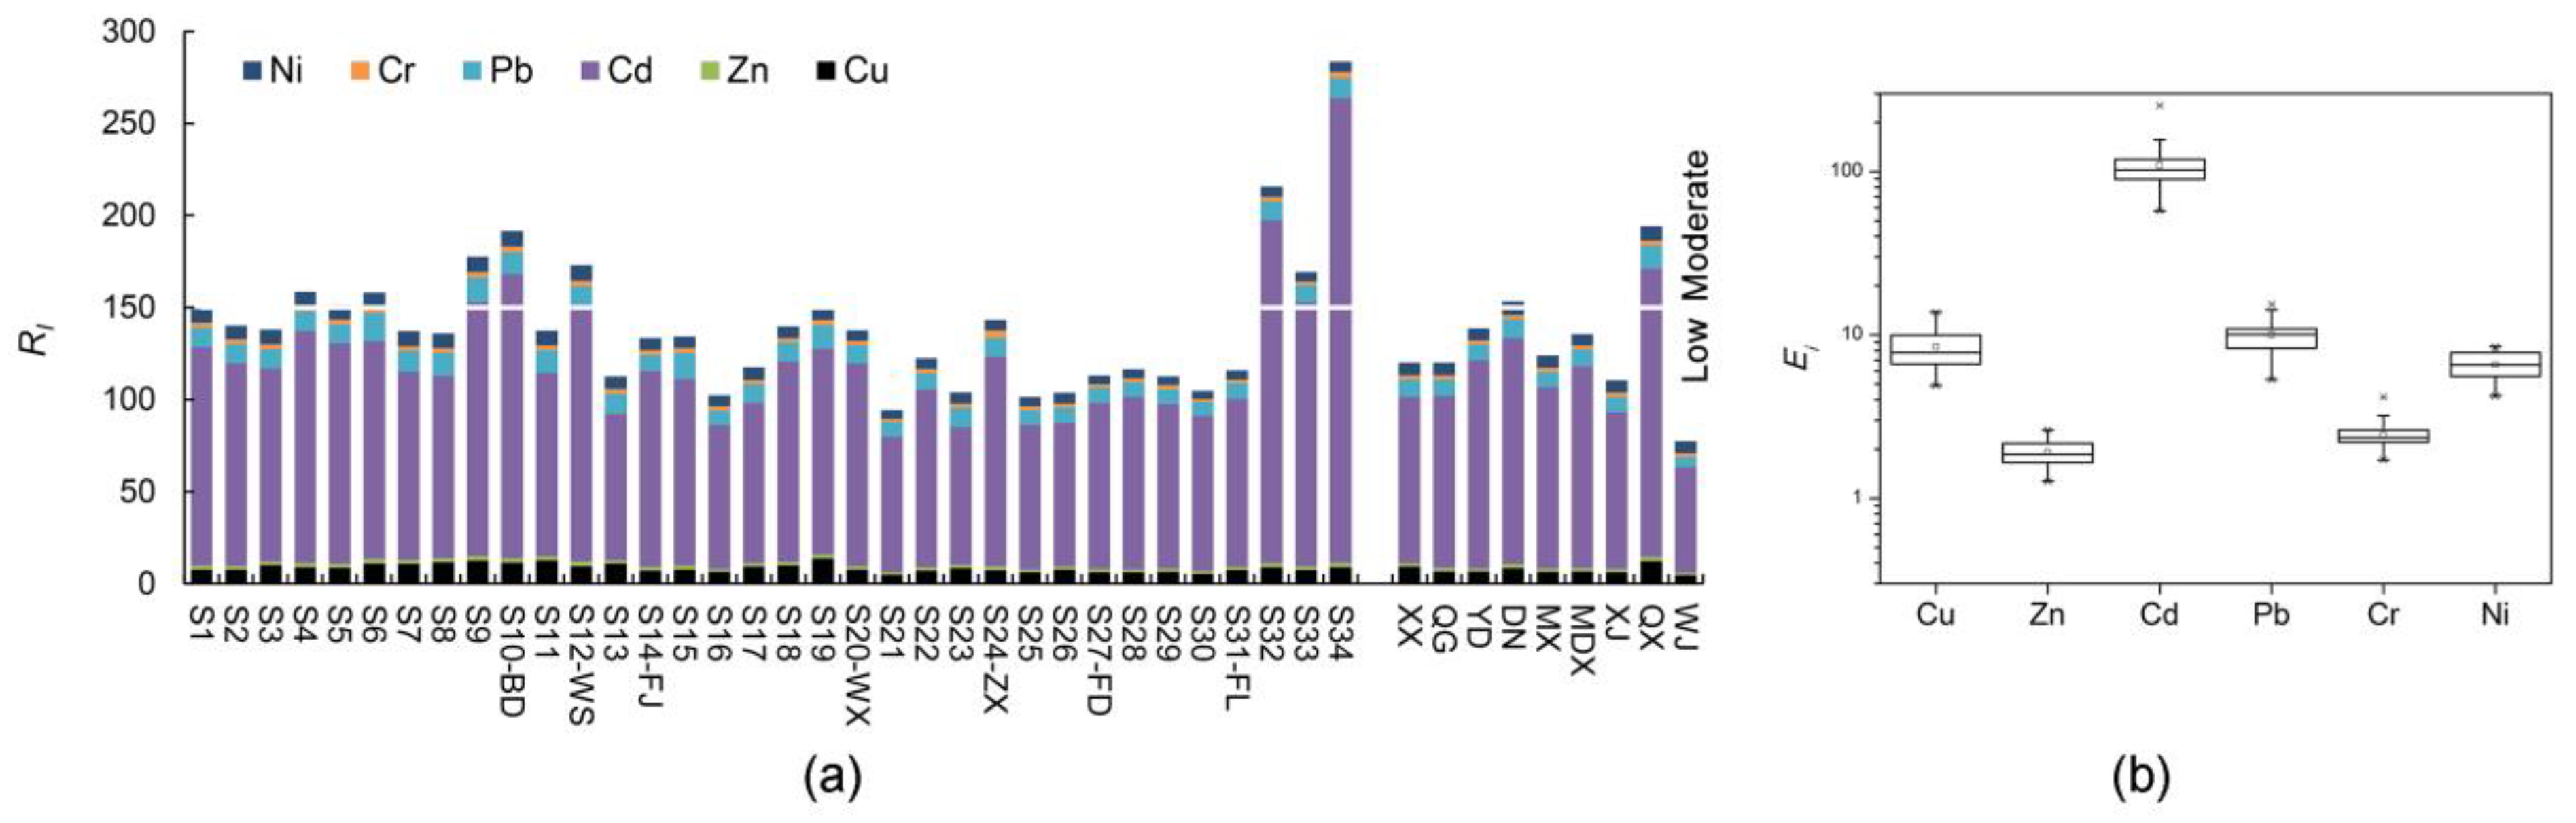
4.3. Risk Assessment

The risks of heavy metals in the sediments were assessed using the potential ecological risk index. According to the R I results, the sampling sites S4, S6, S9, S10-BD, S12-WS, S32, S33, S34, and DN and QX exhibit a moderate potential ecological risk (i.e., 150 R I < 300 ), and other sampling sites exhibit a low potential ecological risk, as shown in Figure 8a. The sampling site S34 had the largest value of R I . The mainstream poses a greater potential ecological risk of heavy metals than the tributary [24], i.e., 140.49 and 130.40 for the average value of R I , respectively. These results are in accordance with the metal distribution pattern in the sediment [2]. Moreover, the average E r i value of each heavy metal follows: Cd (109.02) > Pb (9.98) > Cu (8.47) > Ni (6.57) > Cr (2.43) > Zn (1.91), as shown in Figure 8b. Thus, Cd exhibits a considerable ecological risk, and other heavy metals exhibit low ecological risks. Overall, the heavy metals in the surface sediments of the TGR represent low to moderate pollution. The bioavailability of heavy metals (i.e., the different fractions) should be further analyzed for the risk analysis, to determine the direct threat to the surrounding environment [22,52].

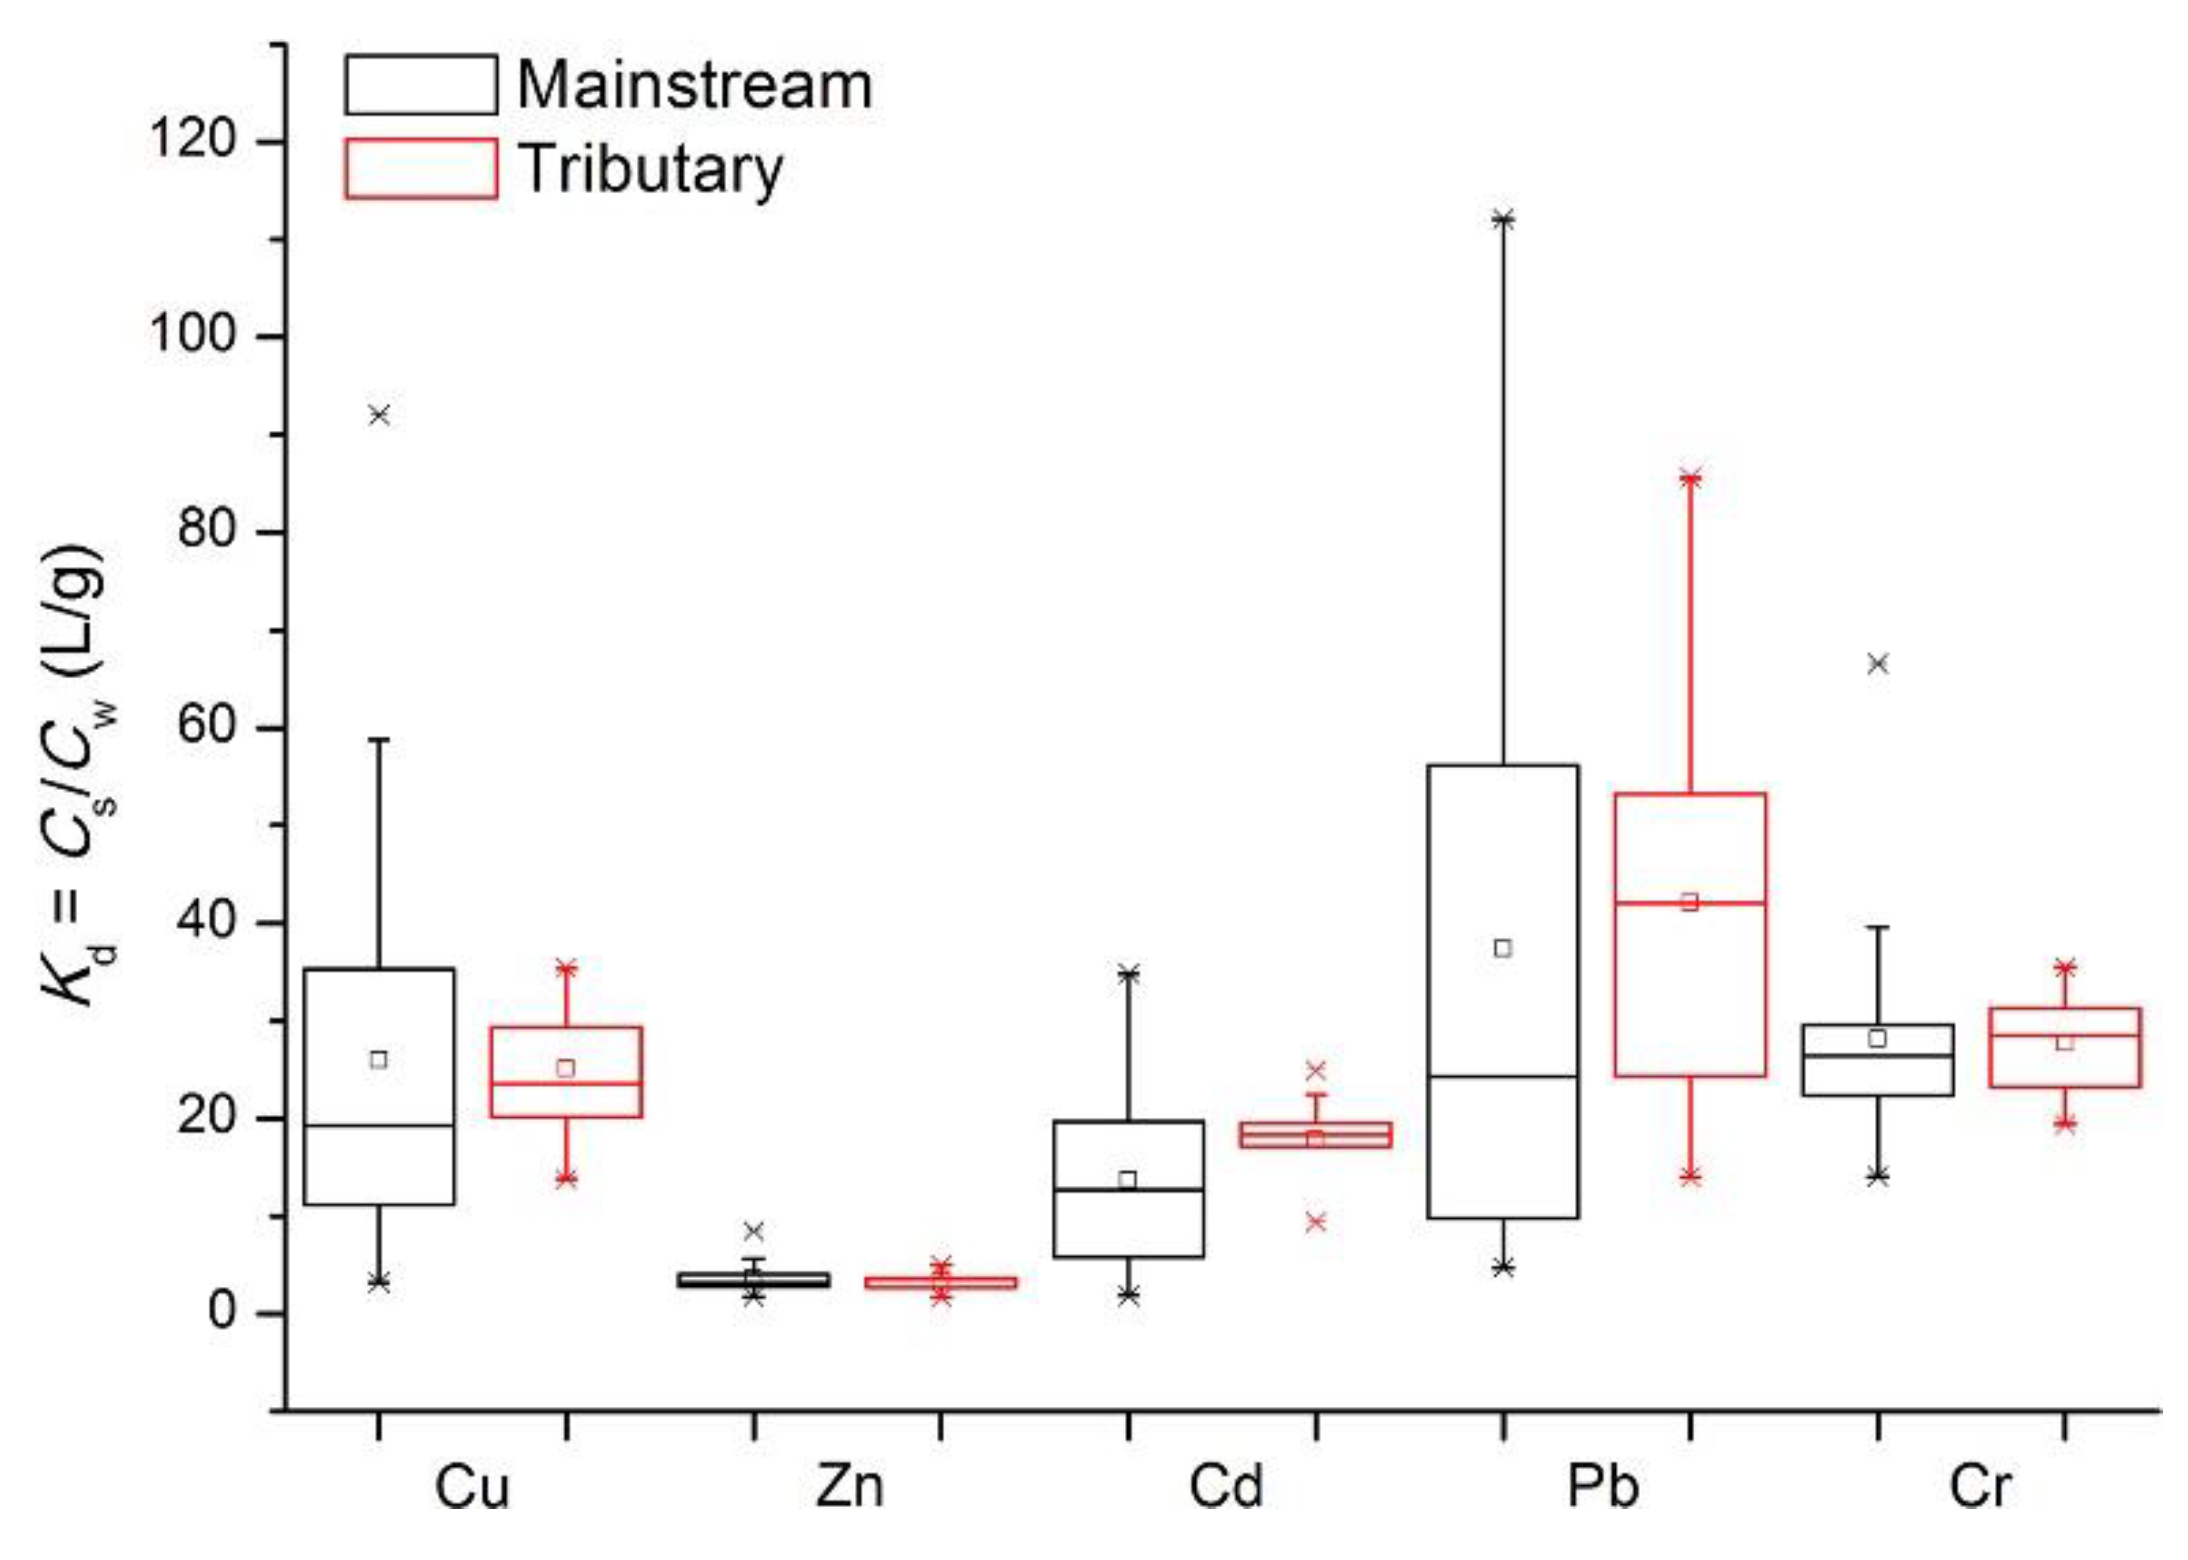
4.4. Partition of Heavy Metals

The heavy metal concentrations in the bottom water samples were measured for these sampling sites, and further analysis was conducted to compare the heavy metal concentration in the sediment and that in the overlying water. We define a variable of Kd = Cs/Cw that reflects the partition of heavy metal between the sediment and overlying water, where Cs and Cw are the total heavy metal concentrations in the surface sediment and bottom water samples, respectively. The statistics of Kd for Cu, Zn, Cd, Pb, and Cr are shown in Figure 9, with the results of the mainstream and tributary presented separately.
In Figure 9, different ranges of Kd values were obtained for different heavy metals. For comparison, there is a relatively small Kd for the heavy metal Zn, i.e., 3.59 ± 1.31; but the values for Pb, Cr, and Cu are relatively larger, i.e., 38.37 ± 32.31, 28.00 ± 9.18, 25.80 ± 19.11, respectively. Moreover, the median value of Kd for each heavy metal generally satisfies that: Tributary > Mainstream, i.e., the Kd values of the sampling sites in the tributaries bias toward a greater value (a distribution of right deviation). According to the definition, a greater Kd implies that there might be more pollutants existing in the sediment, while a smaller Kd represents relatively more pollutants in the overlying water.
Apparently, the Kd values exhibit significant variations for all heavy metals (especially in the mainstream with a coefficient of variation of 36–93%), indicating that it might be affected by the environmental variables, such as the D50, turbidity, DO, H, and TOC as described above. Similarly, a correlation analysis was conducted to investigate the influences of these environmental variables on the Kd values, as shown in Table 3 and Figure 10. It was found that there is a more significant correlation between the Kd values and environmental variables than that between the heavy metal concentration and environmental variables, as compared with Table 2, indicating that these environmental variables have a greater impact on the partition of heavy metals between the sediment and overlying water. Overall, the Kd values for these heavy metals are significantly negatively correlated with the D50, turbidity, and DO. The turbidity reflects the suspended sediment concentration in the overlying water, and a greater turbidity implies that there will be more heavy metals distributed in the overlying water, thus resulting in a smaller Kd value.

5. Conclusions

Heavy metals exert significant negative impacts on the aqueous environment due to their abundance, persistence and toxicity. The reservoir operation affects the distribution of heavy metals through changing the hydraulic regime of natural rivers, and causing sediment sorting and deposition in the reservoir, which leads to variations in water depth, median sediment size, dissolved oxygen and other environmental variables. In this study, the spatial distribution and potential risk of Cu, Zn, Cd, Pb, Cr, and Ni in the sediments of TGR were investigated as an example, which is also expected to provide references for the management of other similar reservoirs. The main conclusions are drawn as follows:
  • Heavy metal concentrations increase slightly along the mainstream due to pollutant emission and sediment sorting, and the sites from S6 to S12-WS are identified as hot spots for heavy metal distribution. Meanwhile, the heavy metal concentrations in the mainstream are relatively greater than those in the tributaries.
  • There is a similar source for the heavy metals Ni, Cu, and Pb, which is different from that of Cd. Meanwhile, the heavy metal concentrations are generally positively correlated to the water depth, H, while negatively correlated with DO, turbidity, and D50; and the environmental variables exert a greater impact on the heavy metal partition between the sediment and overlying water.
  • According to the risk assessment, the heavy metals in the surface sediments of TGR show a low to moderate pollution. The average Ei value of each heavy metal follows: Cd > Pb > Cu > Ni > Cr > Zn, where Cd exhibits a considerable ecological risk, and other heavy metals exhibit low ecological risks.

Supplementary Materials

The following are available online at https://www.mdpi.com/2073-4441/10/12/1840/s1, Figure S1: Land use in the region of Three Gorges Reservoir, Table S1: Location of the sampling sites and the measured environmental variables, Table S2: A more detailed comparison with the results of Xu et al. (1999) for the sites affected by urban cities.

Author Contributions

Conceptualization, H.F. and W.Y.; methodology, L.H. and W.Z.; formal analysis, G.H. and X.L.; investigation, L.H., K.N., W.Z. and Y.H.; writing—original draft preparation, L.H.; writing—review and editing, H.F.

Funding

This research was funded by the National Natural Science Foundation of China (91647210, 11802158, 51479213), 111 Project (No. B18031), National Key Research and Development Program of China (2016YFC0402506), Research Foundations of State Key Laboratory of Hydro-science and Engineering (2018-KY-03) and State Key Laboratory of Lake Science and Environment (2016SKL012), and Public Science and Technology Research Funds Projects of Ministry of Water Resources (No. 201501042).

Conflicts of Interest

The authors declare no conflicts of interest.

References

  1. Benson, N.U.; Udosen, E.D.; Essien, J.P.; Anake, W.U.; Adedapo, A.E.; Akintokun, O.A.; Fred-Ahmadu, O.H.; Olajire, A.A. Geochemical fractionation and ecological risks assessment of benthic sediment-bound heavy metals from coastal ecosystems off the Equatorial Atlantic Ocean. Int. J. Sediment Res. 2017, 32, 410–420. [Google Scholar] [CrossRef]
  2. Fu, J.; Zhao, C.P.; Luo, Y.P.; Liu, C.S.; Kyzas, G.Z.; Luo, Y.; Zhao, D.Y.; An, S.Q.; Zhu, H.L. Heavy metals in surface sediments of the Jialu River, China: Their relations to environmental factors. J. Hazard. Mater. 2014, 270, 102–109. [Google Scholar] [CrossRef] [PubMed]
  3. Lee, B.G.; Griscom, S.B.; Lee, J.S.; Choi, H.J.; Koh, C.H.; Luoma, S.N.; Fisher, N.S. Influence of dietary uptake and reactive sulfides on metal bioavailability from aquatic sediment. Science 2000, 287, 282–284. [Google Scholar] [CrossRef] [PubMed]
  4. Fang, H.W.; Chen, M.H.; Chen, Z.H.; Zhao, H.M.; He, G.J. Simulation of sediment particle surface morphology and element distribution by the concept of mathematical sand. J. Hydro-Environ. Res. 2014, 8, 186–193. [Google Scholar] [CrossRef]
  5. Huang, L.; Fang, H.W.; He, G.J.; Chen, M.H. Phosphorus adsorption on natural sediments with different pH incorporating surface morphology characterization. Environ. Sci. Pollut. Res. 2016, 23, 18883–18891. [Google Scholar] [CrossRef] [PubMed]
  6. Wang, Y.; Shen, Z.Y.; Niu, J.F.; Liu, R.M. Adsorption of phosphorus on sediments from the Three-Gorges Reservoir (China) and the relation with sediment compositions. J. Hazard. Mater. 2009, 162, 92–98. [Google Scholar] [CrossRef]
  7. Fang, H.W.; Huang, L.; Wang, J.Y.; He, G.J.; Reible, D. Environmental assessment of heavy metal transport and transformation in the Hangzhou Bay, China. J. Hazard. Mater. 2016, 302, 447–457. [Google Scholar] [CrossRef]
  8. Huang, S.L.; Wan, Z.H.; Smith, P. Numerical modeling of heavy metal pollutant transport-transformation in fluvial rivers. J. Hydraul. Res. 2007, 45, 451–461. [Google Scholar] [CrossRef]
  9. Liang, A.; Wang, Y.C.; Guo, H.T.; Bo, L.; Zhang, S.; Bai, Y.L. Assessment of pollution and identification of sources of heavy metals in the sediments of Changshou Lake in a branch of the Three Gorges Reservoir. Environ. Sci. Pollut. Res. 2015, 22, 16067–16076. [Google Scholar] [CrossRef]
  10. Wang, T.J.; Pan, J.; Liu, X.L. Characterization of heavy metal contamination in the soil and sediment of the Three Gorges Reservoir, China. J. Environ. Sci. Health A 2017, 52, 201–209. [Google Scholar] [CrossRef]
  11. Feng, C.H.; Zhao, S.; Wang, D.X.; Niu, J.F.; Shen, Z.Y. Sedimentary records of metal speciation in the Yangtze Estuary: Role of hydrological events. Chemosphere 2014, 107, 415–422. [Google Scholar] [CrossRef] [PubMed]
  12. Gao, L.; Gao, B.; Xu, D.Y.; Peng, W.Q.; Lu, J. Multiple assessments of trace metals in sediments and their response to the water level fluctuation in the Three Gorges Reservoir, China. Sci. Total Environ. 2019, 648, 197–205. [Google Scholar] [CrossRef] [PubMed]
  13. MEP (Ministry of Environmental Protection of PRC). The Environmental and Ecological Monitoring Bulletins of the Three Gorges Reservoir Area; 2016; Available online: http://www.cnemc.cn/jcbg/zjsxgcstyhjjcbg/ (accessed on 5 December 2018).
  14. Nilsson, C.; Reidy, C.A.; Dynesius, M.; Carman, R. Fragmentation and flow regulation of the world’s large river systems. Science 2005, 308, 405–408. [Google Scholar] [CrossRef] [PubMed]
  15. Mao, J.Q.; Jiang, D.G.; Dai, H.C. Spatial-temporal hydrodynamic and algal bloom modelling analysis of a reservoir tributary embayment. J. Hydro-Environ. Res. 2015, 9, 200–215. [Google Scholar] [CrossRef]
  16. Li, Q.F.; Yu, M.X.; Lu, G.B.; Cai, T.; Bai, X.; Xia, Z.Q. Impacts of the Gezhouba and Three Gorges reservoirs on the sediment regime in the Yangtze River, China. J. Hydrol. 2011, 403, 224–233. [Google Scholar] [CrossRef]
  17. Syvitski, J.P.M.; Vorosmarty, C.J.; Kettner, A.J.; Green, P. Impact of humans on the flux of terrestrial sediment to the global coastal ocean. Science 2005, 308, 376–380. [Google Scholar] [CrossRef] [PubMed]
  18. Song, Y.X.; Ji, J.F.; Mao, C.P.; Yang, Z.F.; Yuan, X.Y.; Ayoko, G.A.; Frost, R.L. Heavy metal contamination in suspended solids of Changjiang River—Environmental implications. Geoderma 2010, 159, 286–295. [Google Scholar] [CrossRef]
  19. Huang, L.; Fang, H.W.; Reible, D. Mathematical model for interactions and transport of phosphorus and sediment in the Three Gorges Reservoir. Water Res. 2015, 85, 393–403. [Google Scholar] [CrossRef]
  20. Huang, L.; Fang, H.W.; Xu, X.Y.; He, G.J.; Zhang, X.S.; Reible, D. Stochastic modeling of phosphorus transport in the Three Gorges Reservoir by incorporating variability associated with the phosphorus partition coefficient. Sci. Total Environ. 2017, 592, 649–661. [Google Scholar] [CrossRef]
  21. Stone, R. Three Gorges Dam: Into the unknown. Science 2008, 321, 628–632. [Google Scholar] [CrossRef]
  22. Bing, H.J.; Zhou, J.; Wu, Y.H.; Wang, X.X.; Sun, H.Y.; Li, R. Current state, sources, and potential risk of heavy metals in sediments of Three Gorges Reservoir, China. Environ. Pollut. 2016, 214, 485–496. [Google Scholar] [CrossRef] [PubMed]
  23. Gao, B.; Zhou, H.D.; Huang, Y.; Wang, Y.C.; Gao, J.J.; Liu, X.B. Characteristics of heavy metals and Pb isotopic composition in sediments collected from the tributaries in Three Gorges Reservoir, China. Sci. World J. 2014. [Google Scholar] [CrossRef] [PubMed]
  24. Gao, B.; Zhou, H.D.; Yang, Y.; Wang, Y.C. Occurrence, distribution, and risk assessment of the metals in sediments and fish from the largest reservoir in China. RSC Adv. 2015, 5, 60322–60329. [Google Scholar] [CrossRef]
  25. Gao, J.M.; Sun, X.Q.; Jiang, W.C.; Wei, Y.M.; Guo, J.S.; Liu, Y.Y.; Zhang, K. Heavy metals in sediments, soils, and aquatic plants from a secondary anabranch of the three gorges reservoir region, China. Environ. Sci. Pollut. Res. 2016, 23, 10415–10425. [Google Scholar] [CrossRef] [PubMed]
  26. Wang, L.J.; Tian, Z.B.; Li, H.; Cai, J.; Wang, S.J. Spatial and temporal variations of heavy metal pollution in sediments of Daning River under the scheduling of Three Gorges Reservoir. In Proceedings of the International Forum on Energy, Environment and Sustainable Development (IFEESD), Shenzhen, China, 16–17 April 2016. [Google Scholar]
  27. Wei, X.; Han, L.; Gao, B.; Zhou, H.; Lu, J.; Wan, X. Distribution, bioavailability, and potential risk assessment of the metals in tributary sediments of Three Gorges Reservoir: The impact of water impoundment. Ecol. Indic. 2016, 61, 667–675. [Google Scholar] [CrossRef]
  28. Zhao, X.; Gao, B.; Xu, D.; Gao, L.; Yin, S. Heavy metal pollution in sediments of the largest reservoir (Three Gorges Reservoir) in China: A review. Environ. Sci. Pollut. Res. 2017, 24, 20844–20858. [Google Scholar] [CrossRef]
  29. Li, X.; Wei, J.H.; Li, T.J.; Wang, G.Q.; Yeh, W.W.-G. A parallel dynamic programming algorithm for multi-reservoir system optimization. Adv. Water Resour. 2014, 67, 1–15. [Google Scholar] [CrossRef]
  30. CWRC (Changjiang Water Resource Committee). Bulletin of the Yangtze River Sediment; Changjiang Press: Wuhan, China, 2015. [Google Scholar]
  31. Liu, Y.; Liu, H.C.; Li, X.H. Simultaneous and precise determination of 40 trace elements in rock samples using ICP-MS. Geochimica 1996, 25, 552–558. [Google Scholar]
  32. Page, A.L. Methods of Soil Analysis, Part 2: Chemical and Microbiological Properties (Agronomy); American Society of Agronomy and Soil Science Society of America: Madison, WI, USA, 1982. [Google Scholar]
  33. Fu, J.; Sheng, S.; Wen, T.; Zhang, Z.M.; Wang, Q.; Hu, Q.X.; Li, Q.S.; An, S.Q.; Zhu, H.L. Polycyclic aromatic hydrocarbons in surface sediments of the Jialu River. Ecotoxicology 2011, 20, 940–950. [Google Scholar] [CrossRef]
  34. Clesceri, L.S.; Greenberg, A.E.; Eaton, A.D. Standard Methods for the Examination of Water and Wastewater, American Public Health Association; American Water Works Association and Water Environment Federation: Washington, DC, USA, 1998. [Google Scholar]
  35. Håkanson, L. An ecological risk index for aquatic pollution control—A sedimentological approach. Water Res. 1980, 14, 975–1001. [Google Scholar] [CrossRef]
  36. Chi, Q.; Yan, M. Handbook of Elemental Abundance for Applied Geochemistry; Geological Publishing House: Beijing, China, 2007. [Google Scholar]
  37. Shepard, F.P. Nomenclature based on sand-silt-clay ratios. J. Sediment. Petrol. 1954, 24, 151–158. [Google Scholar]
  38. Fang, T.; Xu, X.Q. Establishment of sediment quality criteria for metals in water of the Yangtze River using equilibrium partitioning approach. Resour. Environ. Yangtze Basin 2007, 16, 525–531. [Google Scholar]
  39. Tang, J. Study on the Regularity of Move, Enrichment, and Translation of Cadmium and Other Heavy Metals in the District of the Three Gorges Reservoir. Doctoral Dissertation, Chengdu University of Technology, Chengdu, China, 2005. [Google Scholar]
  40. Xu, X.Q.; Deng, G.Q.; Hui, J.Y.; Zhang, X.H.; Qiu, C.Q. The pollution characteristics of heavy metal in sediments in Three Gorges Reservoir. Acta Hydrobiol. Sin. 1999, 23, 1–9. [Google Scholar]
  41. CEPA (Chinese Environmental Protection Administration). Chinese Environmental Quality Standard for Soils (GB 15618-1995); 1995. Available online: http://kjs.mee.gov.cn/hjbhbz/bzwb/trhj/trhjzlbz/199603/t19960301_82028.shtml (accessed on 5 December 2018).
  42. Wang, X.X.; Bing, H.J.; Wu, Y.H.; Zhou, J.; Sun, H.Y. Distribution and potential eco-risk of chromium and nickel in sediments after impoundment of Three Gorges Reservoir, China. Hum. Ecol. Risk Assess. 2017, 23, 172–185. [Google Scholar] [CrossRef]
  43. Wang, J.K.; Gao, B.; Zhou, H.D.; Lu, J.; Wang, Y.C.; Yin, S.H.; Hao, H.; Yuan, H. Heavy metal pollution and its potential ecological risk of the sediment in Three Gorges Reservoir during its impounding period. Environ. Sci. 2012, 33, 1693–1699. [Google Scholar]
  44. Zhang, X.M.; Liu, Y.Y.; Guo, J.P.; Li, Y. Investigation and characterization of heavy metal pollution in sediment of Chongqing urban section of the Three Gorges Reservoir. J. Chongqing Technol. Bus. Univ. 2010, 27, 176–180. (In Chinese) [Google Scholar]
  45. Chen, H.Y.; Teng, Y.G.; Li, J.; Wu, J.; Wang, J.S. Source apportionment of trace metals in river sediments: A comparison of three methods. Environ. Pollut. 2016, 211, 28–37. [Google Scholar] [CrossRef]
  46. Feng, L.; Li, C.M.; Hu, B.Q.; Zhang, Y.; Huang, J.S.; Zhang, J. Analysis of pollution characteristics of surface sediments in Three Gorges Reservoir after normal impoundment. Res. Environ. Sci. 2016, 29, 353–359. (In Chinese) [Google Scholar]
  47. Liu, M.X.; Yang, Y.Y.; Yun, X.Y.; Zhang, M.M.; Li, Q.X.; Wang, J. Distribution and ecological assessment of heavy metals in surface sediments of the East Lake, China. Ecotoxicology 2014, 23, 92–101. [Google Scholar] [CrossRef]
  48. Ren, D.Y.; Zhao, F.H.; Wang, Y.Q.; Yang, S.J. Distributions of minor and trace elements in Chinese coals. Int. J. Coal Geol. 1999, 40, 109–118. [Google Scholar] [CrossRef]
  49. Liu, Y.Z.; Xiao, T.F.; Ning, Z.P.; Li, H.J.; Tang, J.; Zhou, G.Z. High cadmium concentration in soil in the Three Gorges region: Geogenic source and potential bioavailability. Appl. Geochem. 2013, 37, 149–156. [Google Scholar] [CrossRef]
  50. Zhang, C.; Yu, Z.G.; Zeng, G.M.; Jiang, M.; Yang, Z.Z.; Cui, F.; Zhu, M.Y.; Shen, L.Q.; Hu, L. Effects of sediment geochemical properties on heavy metal bioavailability. Environ. Int. 2014, 73, 270–281. [Google Scholar] [CrossRef] [PubMed]
  51. Xiao, S.B.; Liu, D.F.; Wang, Y.C.; Gao, B.; Wang, L.; Duan, Y.J. Characteristics of heavy metal pollution in sediments at the Xiangxi Bay of Three Gorges Reservoir. Resour. Environ. Yangtze Basin 2011, 20, 983–989. (In Chinese) [Google Scholar]
  52. Singh, K.P.; Mohan, D.; Singh, V.K.; Malik, A. Studies on distribution and fractionation of heavy metals in Gomati river sediments d a tributary of the Ganges, India. J. Hydrol. 2005, 312, 14–27. [Google Scholar] [CrossRef]
Figure 1. The study area and sampling sites in the Three Gorges Reservoir, including the sites in the mainstream and from the tributary estuaries (the size of square reflects the population of the city). BD—Badong, WS—Wushan, FJ—Fengjie, WX—Wanxian, ZX—Zhongxian, FD—Fengdu, FL—Fuling; and XX—Xiangxi, QG—Qinggan, YD—Yandu, DN—Daning, MX—Meixi, MDX—Modaoxi, XJ—Xiaojiang, QX—Quxi, WJ—Wujiang.
Water 10 01840 g001
Figure 2. (a) Textural composition of the surface sediment samples in the Three Gorges Reservoir (triangle diagram), and (b) the variation of median sediment size D50 with the distance to the dam.
Water 10 01840 g002
Figure 3. Box plots of the measured physical and chemical environmental variables, including the turbidity, dissolved oxygen (DO), and water depth (H) of the bottom water samples, and the total organic carbon (TOC), total nitrogen (TN), total phosphorus (TP), and the total polycyclic aromatic hydrocarbons (PAHs) and phthalic acid esters (PAEs) of the surface sediment samples.
Water 10 01840 g003
Figure 4. Spatial distribution of Cu, Zn, Cd, Pb, Cr, and Ni in the Three Gorges Reservoir. The white lines represent the standard values of the soil (GB 15618-1995).
Water 10 01840 g004
Figure 5. Plot of loading of two principal components in the rotated space.
Water 10 01840 g005
Figure 6. (a) Principal component analysis (PCA) results and (b) hierarchical diagram of the sampling sites.
Water 10 01840 g006aWater 10 01840 g006b
Figure 7. Redundancy analysis (RDA) of heavy metals and environment variables.
Water 10 01840 g007
Figure 8. Risk assessment of heavy metals in the sediments. (a) the comprehensive index R I of potential ecological risk (the white line represents the split line between the low and moderate ecological risk levels); and (b) the statistics of E r i for each heavy metal.
Water 10 01840 g008
Figure 9. Statistical analysis of the heavy metal partition between the surface sediment and bottom water samples, with the sites from the mainstream and tributaries separately presented.
Water 10 01840 g009
Figure 10. Redundancy analysis (RDA) analysis results of the Kd values and environment variables.
Water 10 01840 g010
Table 1. Comparison of heavy metal concentrations with previous studies (unit: mg/kg).
Sampling SitesCuZnCdPbCrNiReferences
MainstreamTGR-1985 (N = 17)62.5160.60.2725.7145.136.9[40]
TGR < 2005 (N = 126)53.52146.80.60550.8487.1537.11[39]
TGR-2014 (N = 24)54.21740.8785186.842.7[22,42]
A review60.82 ± 28.07148.11 ± 60.840.63 ± 0.8142.73 ± 21.73125.56 ± 71.9742.31 ± 7.43[28]
TributariesTGR-2008 (N =2 4)76.03137.630.7559.486.3146.81[43]
TGR-2010 (N = 73)56.4130.30.94484.945.7[24]
A review53.31 ± 25.88129.16 ± 75.920.72 ± 0.6742.93 ± 23.0679.28 ± 28.6042.45 ± 8.80[28]
Mainstream
(N = 34)
Mean ± SD61.00 ± 15.04 (24.7%) *151.63 ± 26.40 (17.4%)0.92 ± 0.29 (31.4%)55.38 ± 10.45 (18.9%)101.43 ± 18.99 (18.7%)43.00 ± 8.63 (20.1%)This study
Range35.26–96.34106.73–204.830.61–2.1040.90–83.0670.32–171.1227.88–55.89
Tributaries
(N = 9)
Mean ± SD52.92 ± 14.45 (27.3%)138.34 ± 20.37 (14.7%)0.86 ± 0.22 (25.2%)48.19 ± 9.85 (20.4%)92.98 ± 7.76 (8.4%)44.86 ± 3.03 (6.8%)
Range34.25–86.3799.08–180.060.48–1.3028.77–67.8184.39–111.4639.54–50.65
Soil standards (GB 15618–1995)I351000.2359040[41]
II (pH > 7.5)1003000.635035060
III4005001.0500400200
* the coefficient of variation (CV).
Table 2. Correlation analysis between the heavy metal concentration and environmental variables.
D50TurbDOHTOCTNTPPAHsPAEs
Cu−0.319 *−0.268−0.452 **0.2530.172−0.086−0.1560.2980.314
Zn−0.222−0.182−0.450 **0.351 *0.453−0.074−0.1200.3050.362 *
Cd0.318 *0.007−0.141−0.0100.1340.0020.1760.463 **0.437*
Pb−0.336 *−0.042−0.464 **0.333 *0.359−0.086−0.1160.3210.351 *
Cr−0.196−0.250−0.1900.171−0.2120.1580.1410.2510.351 *
Ni−0.664 **−0.542 **−0.559 **0.564 **0.491−0.178−0.4430.1080.221
* significant correlation at the 0.05 level (2-tailed); ** significant correlation at the 0.01 level (2-tailed).
Table 3. Correlation analysis between the Kd values and environmental variables.
D50TurbDOHTOC
Kd_Cu−0.511 **−0.425 **−0.397 **0.2950.124
Kd_Zn−0.417 **−0.375 *−0.483 **0.1260.284
Kd_Cd−0.642 **−0.497 **−0.539 **0.520 **0.372
Kd_Pb−0.613 **−0.422 **−0.509 **0.493 **0.433
Kd_Cr−0.332 *−0.325 *−0.1540.103−0.366
* significant correlation at the 0.05 level (2-tailed); ** significant correlation at the 0.01 level (2-tailed).

