Sensitivity of Model-Based Water Balance to Low Impact Development Parameters


Institute of Urban Water Management and Landscape Water Engineering, Graz University of Technology, Stremayrgasse 10/I, 8010 Graz, Austria
*
Author to whom correspondence should be addressed.
Water 2018, 10(12), 1838; https://doi.org/10.3390/w10121838
Submission received: 24 October 2018
/
Revised: 5 December 2018
/
Accepted: 10 December 2018
/
Published: 12 December 2018
(This article belongs to the Special Issue Water Sensitive Urban Design)
Abstract
:Low impact development (LID) strategies aim to mitigate the adverse impacts of urbanization, like the increase of runoff and the decrease of evapotranspiration. Hydrological simulation is a reasonable option to evaluate the LID performance with respect to the complete water balance. The sensitivity of water balance components to LID parameters is important for the modeling and planning process of LIDs. This contribution presents the results of a global sensitivity analysis of model-based water balance components (runoff volume, evapotranspiration, groundwater recharge/storage change) using the US Environmental Protection Agency Storm Water Management Model to the parameters (e.g., soil thickness, porosity) of a green roof, an infiltration trench, and a bio-retention cell. All results are based on long-term simulations. The water balance and sensitivity analyses are evaluated for the long-term as well as single storm events. The identification of non-influential and most influential LID parameters for the water balance components is the main outcome of this work. Additionally, the influence of the storm event characteristics precipitation depth and antecedent dry period on the sensitivity of water balance components to LID parameters is shown.
1. Introduction
Urbanization implies an increasing imperviousness of surfaces. This process considerably affects the water balance [1]. Runoff increases, whereas evapotranspiration and infiltration/groundwater recharge decrease, resulting in several negative impacts like larger runoff volumes and higher runoff peak rates, increase of flooding event frequency, urban heat islands (UHI), etc. [2,3,4].
Low impact development (LID) is a widely discussed and implemented concept in stormwater management, with the aim to mitigate the adverse impacts of urbanization. The main goal of LID strategies is to maintain or restore the pre-development hydrologic regime [5,6]. LID tools such as green roofs, bio-retention cells or infiltration trenches use hydrological functions similar to processes that can be observed in natural catchments, e.g., infiltration, evapotranspiration, storage, and attenuation [5,7].
Hydrological simulation is a reasonable and accepted option to evaluate the LID performance with respect to the water balance. Therefore, the pre- and post-development hydrological conditions of a catchment are analyzed. Usually, evaluation approaches (e.g., by Coffman [8]), planning guidelines (e.g., [9,10]) as well as previous studies dealing with LID performance (compare review papers by Ahiablame et al. [7] and Eckart et al. [6]) focus on the runoff component of the water balance. Alterations in evapotranspiration and groundwater recharge/infiltration are neglected, although they play an important role regarding the heat island effect or increased groundwater levels due to artificial groundwater recharge [4,11]. However, holistic approaches (e.g., Henrichs et al. [12], Eger et al. [13], Feng et al. [14]) considering all components of the water balance should be preferred in order to provide a reasonable basis for planning purposes.
Several modeling tools provide the possibility to simulate the hydrological processes of LIDs in order to evaluate their performance (for an overview compare reference by authors Jayasooriya and Ng [15]). The US Environmental Protection Agency Storm Water Management Model (SWMM) [16] used in this study is currently one of the most sophisticated tools in modeling LID performance [15]. The application requires the definition of a varying number of LID parameters (e.g., soil layer thickness, porosity, hydraulic conductivity, etc.) depending on the LID to be simulated, e.g., green roof or bio-retention cell.
The water balance estimation has to be based on continuous simulations to consider the inter-event time resulting in different boundary conditions, e.g., soil moisture, at the start of a storm event. The water balance components can be calculated for the entire simulation period (long-term) as well as for individual storm events.
Recent studies dealing with sensitivity analyses regarding LIDs focused on the green roof performance with respect to effective UHI mitigation [17], the sensitivity of the runoff volume and runoff peak to green roof parameters for calibration purposes [18], the sensitivity of the runoff volume to rain garden parameters to support the decision for future measurement installation sites and smart water control [19], or use a one-at-time (OAT) sensitivity analysis approach [20].
In contrast, this paper presents a global sensitivity analysis (GSA) of the complete water balance to the LID parameters, thus, following a holistic approach considering runoff volume as well as evapotranspiration and groundwater recharge/storage change. GSA focuses on the variance of model output and how it can be apportioned to the different model parameters. Compared to local sensitivity analysis, which investigates sensitivities at one point in the parameter space, global methods aim to assess the model response over the whole parameter space defined by given parameter ranges. Consequently, GSA methods also account for the influence of parameter interactions on the model output. The application of OAT sensitivity analysis to environmental models was demonstrated to be inadequate [21].
The main goal is the identification of non-influential parameters (parameter fixing) and parameters that affect a particular water balance component (parameter prioritization). This is valuable for the planning as well as for the modeling process of LIDs using SWMM. In addition to the long-term GSA, a storm event-based sensitivity analysis complements the investigations and widens the scope of the influence of LID parameters on the water balance. The application of LIDs for stormwater management affects the hydrograph, especially the timing and magnitude of the runoff peak, and is capable of pollutants removal. However, the focus of this paper is on the water balance.
2. Materials and Methods
The following LIDs, which are among the most implemented in stormwater management projects, are investigated: Green roof, bio-retention cell, and infiltration trench.
Bio-retention cells are depressions with an engineered and (partially) vegetated soil mixture placed above a gravel storage bed. Green roofs are a variation of a bio-retention cell with a (partially) vegetated soil layer above a drainage mat that conveys excess water off the roof. Infiltration trenches are ditches filled with gravel providing storage volume for captured runoff to infiltrate into the native soil below [22]. The SWMM setup only consisted of the single LID (green roof) or the LID and the contributing impervious area (bio-retention cell and infiltration trench). The contributing subcatchment to the bio-retention cell and the infiltration is modeled as totally impervious without depression storages.
SWMM simulates LIDs with a soil moisture model consisting of different layers and the corresponding parameters (see layer concept in Figure 1). The surface layer accounts for the runoff generation, the infiltration into the soil or storage layer, and optionally provides a surface storage. Storage volume for stormwater retention is provided by the soil and storage layer. The drainage mat layer of a green roof conveys percolated stormwater from the roof. An overview of the layers and parameters and their ranges used for the sensitivity analysis for the mentioned LIDs can be found in Table 1. For further information about the parameters refer to Rossman and Huber [22]. Please note that the hydrological computations are only affected by the difference between the soil properties and not by their absolute values. In order to reduce the number of parameters, we assumed the wilting point to be zero while adapting the other two soil properties accordingly. The vegetation volume for the infiltration trench was assumed to be zero, according to Rossman and Huber [22]. The optional underdrain for the infiltration trench and bio-retention cell was not considered, as the focus was on LIDs applicable for the restoration of the natural water balance without the projected runoff. Clogging was not considered either, assuming a pretreatment, and as it only affects the already investigated hydraulic conductivity of the soil underneath a gravel storage layer [22].
SWMM considers the processes of runoff, infiltration, and evapotranspiration (for details see Figure 1). Consequently, the water balance can be calculated:
where P is the precipitation, R is the runoff volume (overflow + underdrain), ET is the evapotranspiration, GR is the groundwater recharge and ∆S is the change in system storage. Runoff and evapotranspiration are key processes regarding the urban surface hydrology and are investigated individually. The remaining components, groundwater recharge and change in system storage, are investigated jointly.
The maximal number of parameters for the GSA is 13 (green roof) and the computation time per run is short (ca. 1–2 min.). These boundary conditions affect the selection of a reasonable GSA method (for the variety of GSA methods compare Saltelli et al. [23]). According to Saltelli et al. [24], the variance-based method of Sobol [25], which can be applied even if the model is non-linear or non-monotonic, is used to calculate the first-order sensitivity index Si as well as the total effect sensitivity index STi.
where Si is the first-order index, STi is the total effect index, Y is the variable (model output), X is the parameter, V is the variance, X~i are all parameters but Xi, and E denotes the average. is called the first-order effect of Xi on Y and is the variation of the average Y when fixing Xi at different values while varying the other parameters. is called the total effect of Xi on Y and is the average variation of Y when varying Xi while fixing the other parameters at different values. Equation 4 shows the algebraic rule of how the variation of Y can be expressed:
The first-order index Si represents the main effect contribution of each parameter Xi to the variance of the output. It indicates by how much the output variance could be reduced on average if Xi could be fixed. Si can be used for the “parameter prioritization” setting finding the most influential parameter that one should measure first in order to reduce the variance. The total effect index STi accounts for the total contribution to the output variation due to factor Xi, thus, it summarizes its first-order effect plus all higher-order effects due to interactions. A total effect index STi of zero implies that Xi is non-influential and can be fixed anywhere in its distribution without affecting the variance of the output. Consequently, STi can be used for the “parameter fixing” setting. For further information about the GSA method used refer to Sobol [25], and Saltelli et al. [23].
In addition to these numerical results, input/output scatterplots (e.g., water balance component versus LID parameter values) are a very simple and informative way to evaluate the results of a sensitivity analysis. Identifying a pattern for such a scatter-plot indicates that this water balance component is sensitive to the LID parameter. The clearer the shape or pattern in the plot, the higher might be the sensitivity. Note that the minimum or maximum of a water balance component does not necessarily appear with the minimum or maximum of the investigated LID parameter as the simulation results are based on parameter samples where interactions between the parameters can occur. However, identifying a mainstream trend (shape or pattern) in the scatterplot indicates that this water balance component is sensitive to the LID parameter.
The sensitivity analysis was implemented using the open-source Python library for Sensitivity Analysis SALib [26]. It uses the sampling scheme proposed by Saltelli [27], which extends the Sobol sequence of quasi-random numbers [28]. Quasi-random sequences are designed to generate a sample that is uniformly distributed over the unit hypercube (considering the min–max range of the parameters). The total cost of the used method is a number of N(k + 2) simulations, where N is the base sample and k is the number of inputs. With a chosen N of 1000 (in accordance to Saltelli et al. [24]), the total cost is 15,000 simulations for the green roof and bio-retention cell and 8000 simulations for the infiltration trench.
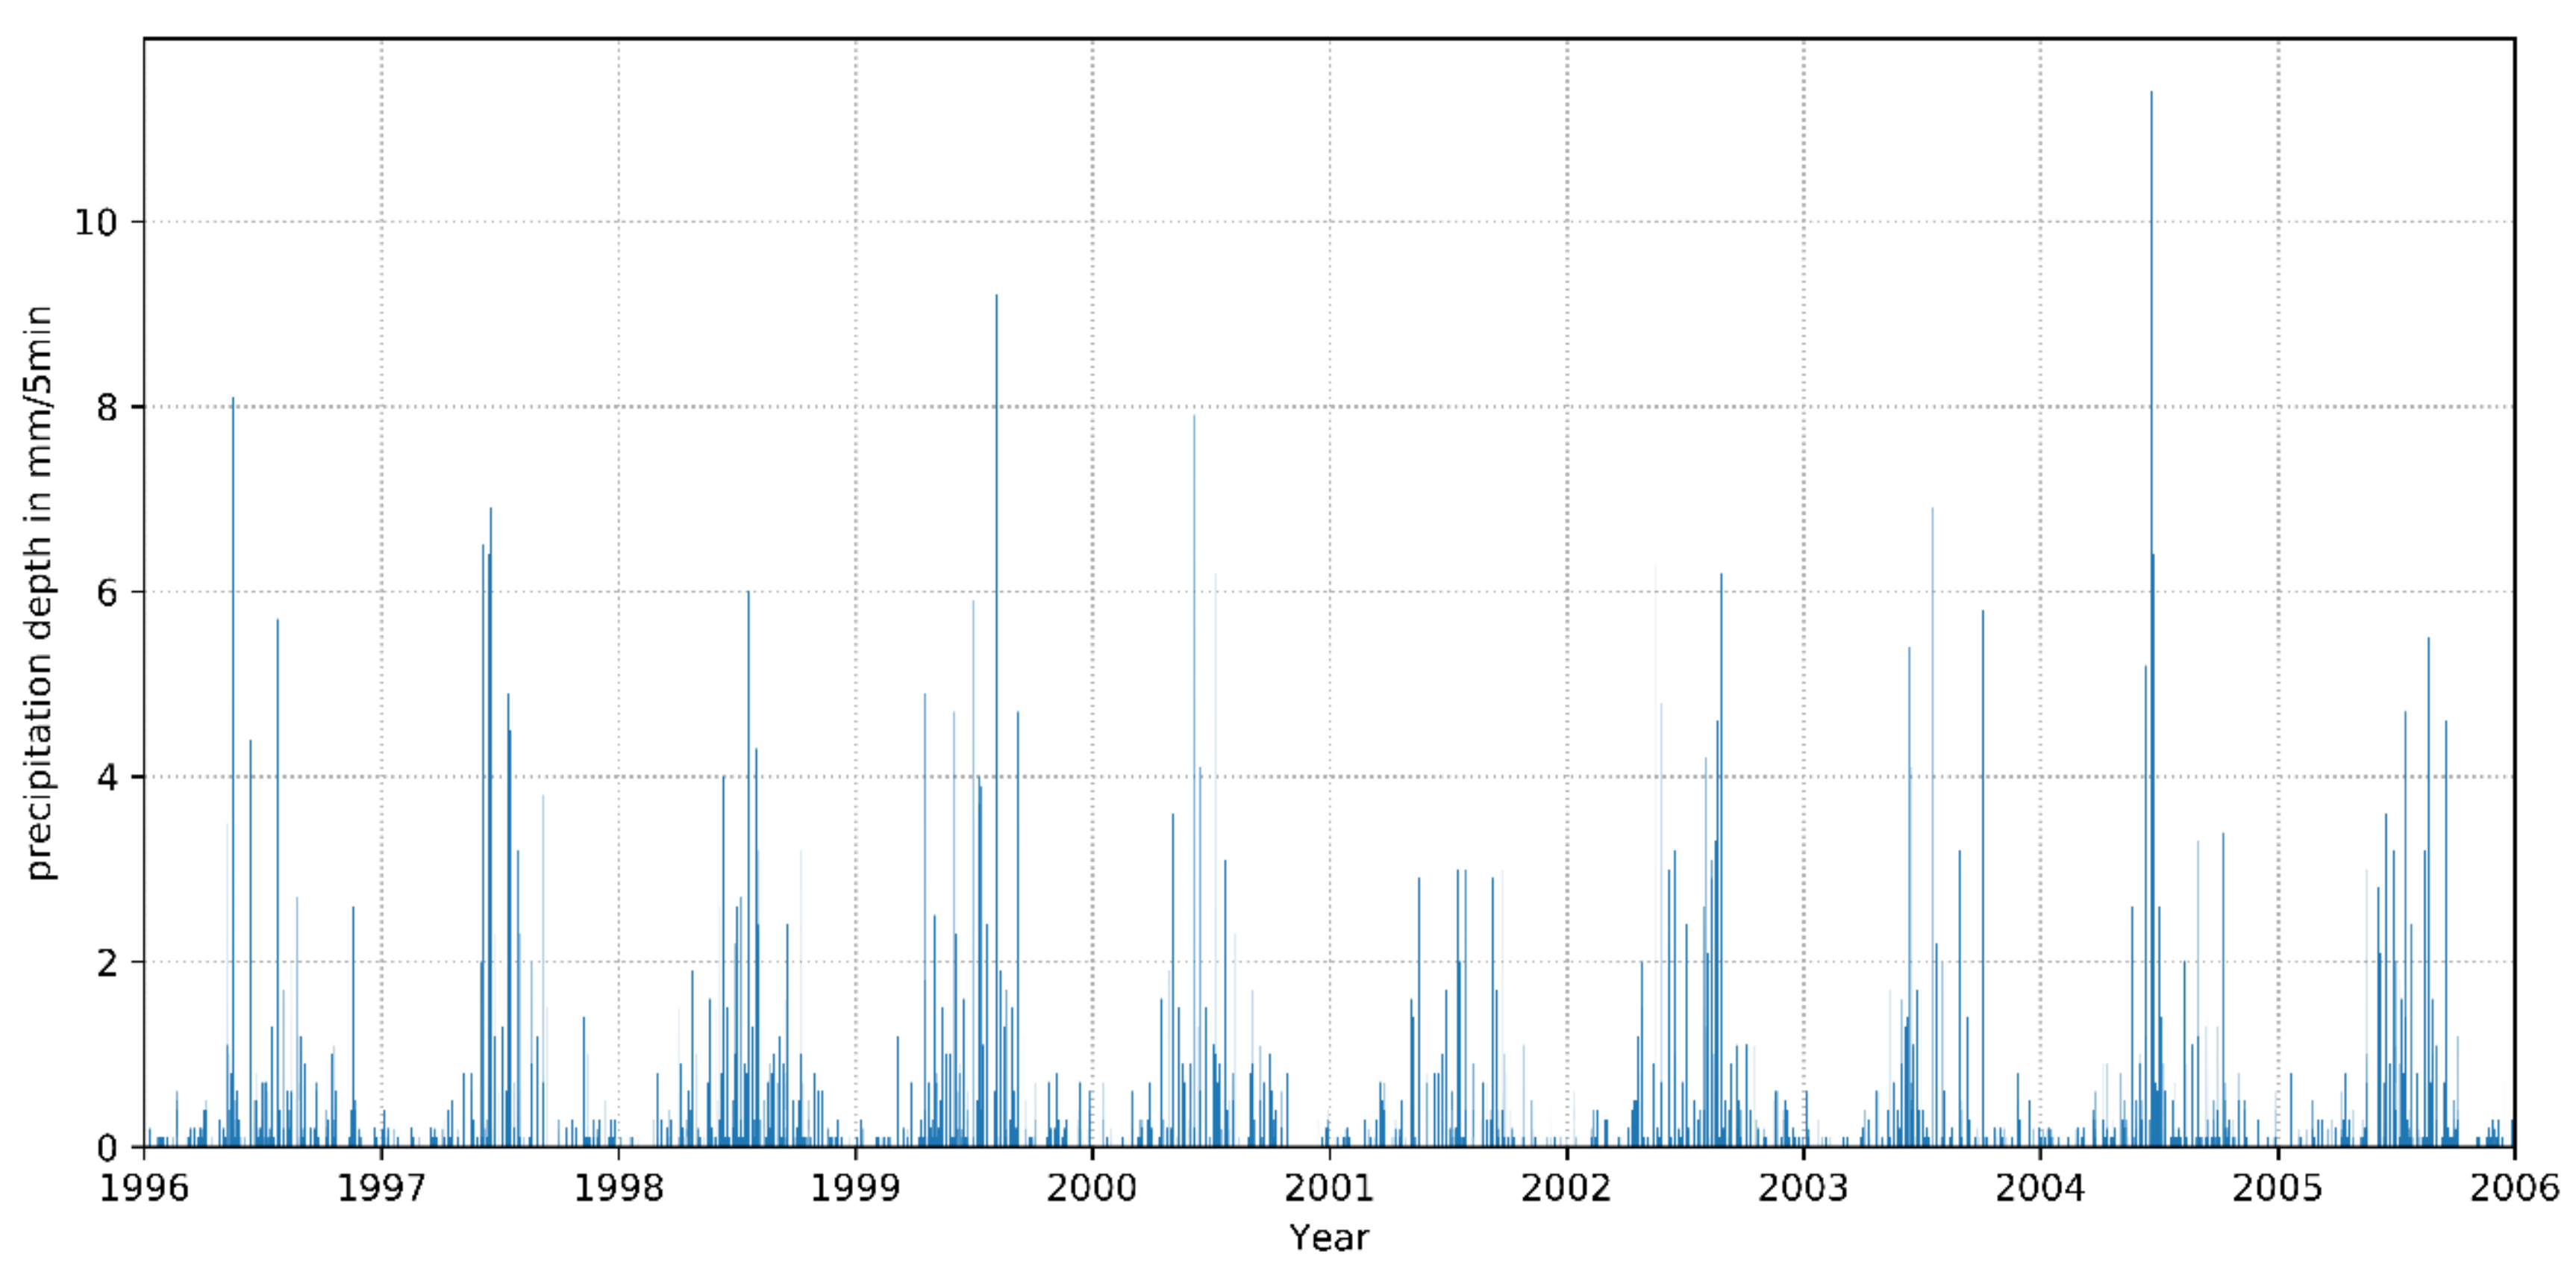
The precipitation time series used for the simulations has a length of 10 years (1996–2006, Figure 2) and is provided by the Austrian Water and Waste Management Association (OEWAV) [29]. It was measured at Graz/Austria and has an average annual precipitation depth of 783 mm. The evaporation rates are computed from daily max–min temperatures provided by the Central Institute for Meteorology and Geodynamics (ZAMG) [30]. SWMM offers this option using the Hargreaves method [31]. The temperature series shows a daily minimum of −21.2 °C, a mean of 10.6 °C, and a maximum of 37.2 °C.
The water balance and the appropriate sensitivities of the components to LID parameters were calculated with long-term simulations as well as for individual storm events within the long-term simulations. The storm events were detected using an event gap (minimum inter-event time) of 4 h and applying a threshold of 1 mm precipitation depth in 1 h to be considered as an individual storm event (for details see Leimgruber et al. [32]). The assessment period for the storm event-based water balance covers the time from the start of a storm event to the start of the next storm event, hence, it includes the storm event and the subsequent inter-event time. Subsequently, the term “water balance period” is used for this assessment period. The precipitation depth and the antecedent dry period were calculated for every storm event in order to investigate the effects of these storm event characteristics on the sensitivity of water balance components to the LID parameters.
3. Results and Discussion
3.1. Long-Term Results
3.1.1. Green Roof
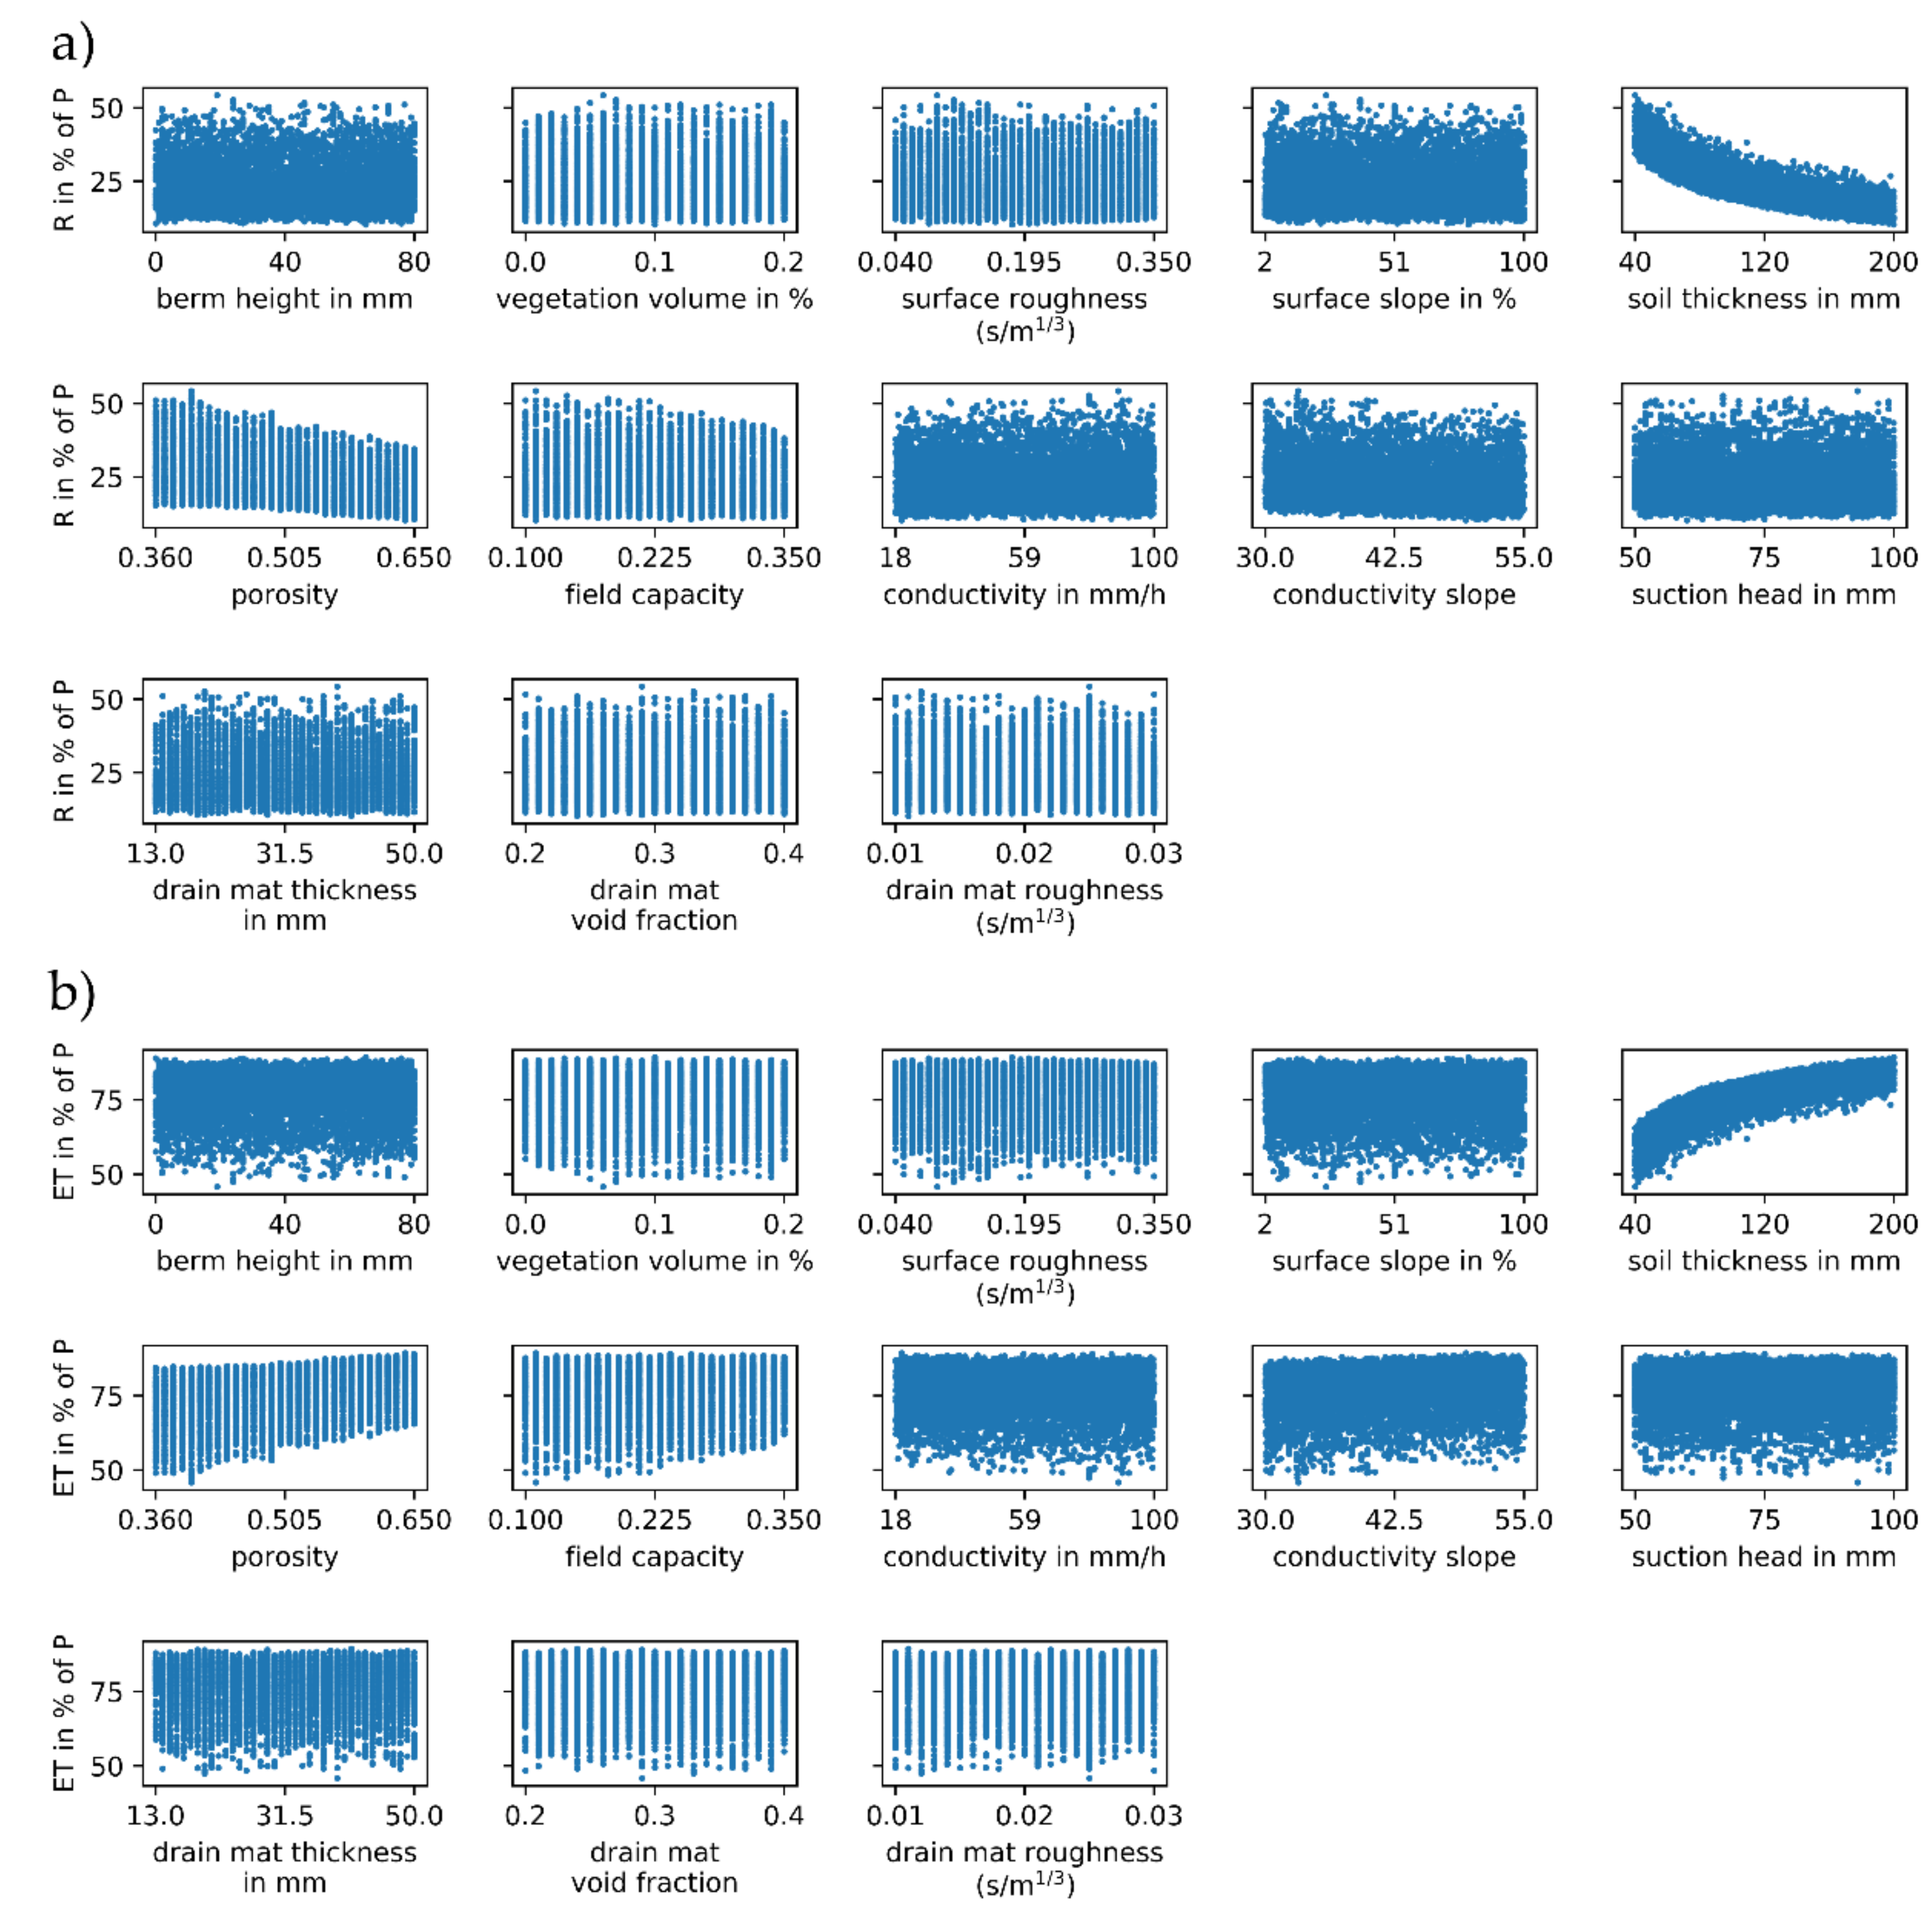
The simulated long-term runoff volume for the green roof ranges between 10.2–54.3% of total precipitation (Equation (1)) and the evapotranspiration between 45.8–89.3% (Figure 3). As the change in system storage of the green roof water balance is approximately zero and, thus, negligibly small compared to the other components for the long-term observation, no further results are presented for this component.
The most distinct pattern in the scatter-plots for the green roof runoff volume can be observed for the soil thickness (Figure 3a) indicating that the runoff volume is affected by the soil thickness. A larger soil thickness results in smaller runoff volumes as more stormwater is retained in the green roof. A similar behavior, to a much smaller extent, can be seen for the parameters porosity and field capacity.
The visually derived results are confirmed by the obtained sensitivity indices (Table 2). Considering the values of the first-order index Si, the most influential parameter for the green roof runoff volume is the soil thickness, followed by the porosity. These observations confirm results presented by Krebs et al. [16] who identified the porosity as one of the most influential parameters for green roof runoff without investigating the soil thickness. The influence of the conductivity slope and the field capacity is rather low. All other parameters show a total effect index STi of zero (berm height, vegetation volume, surface roughness, surface slope, suction head, drainage mat thickness, drainage mat void fraction, drainage mat roughness) or close to zero (conductivity) (Table 2). That implies that these parameters are non-influential.
Basically, the findings described for the runoff volume are also valid for the evapotranspiration (see Figure 3b and Table 2). In contrast to the runoff volume, larger values of the soil thickness, porosity, conductivity slope, and field capacity result, on average, in an increase of the evapotranspiration. The values for the sensitivity indices are similar, thus, the results for the parameter prioritization as well as for the parameter fixing are identical. This is not surprising for green roofs as the runoff volume and the evapotranspiration are both related to the retention volume: The more stormwater that is retained in the green roof the less runoff can occur and the more water is available for evapotranspiration. Therefore, if the runoff volume is sensitive to a parameter, the evapotranspiration should also be sensitive to it and vice versa.
3.1.2. Infiltration Trench
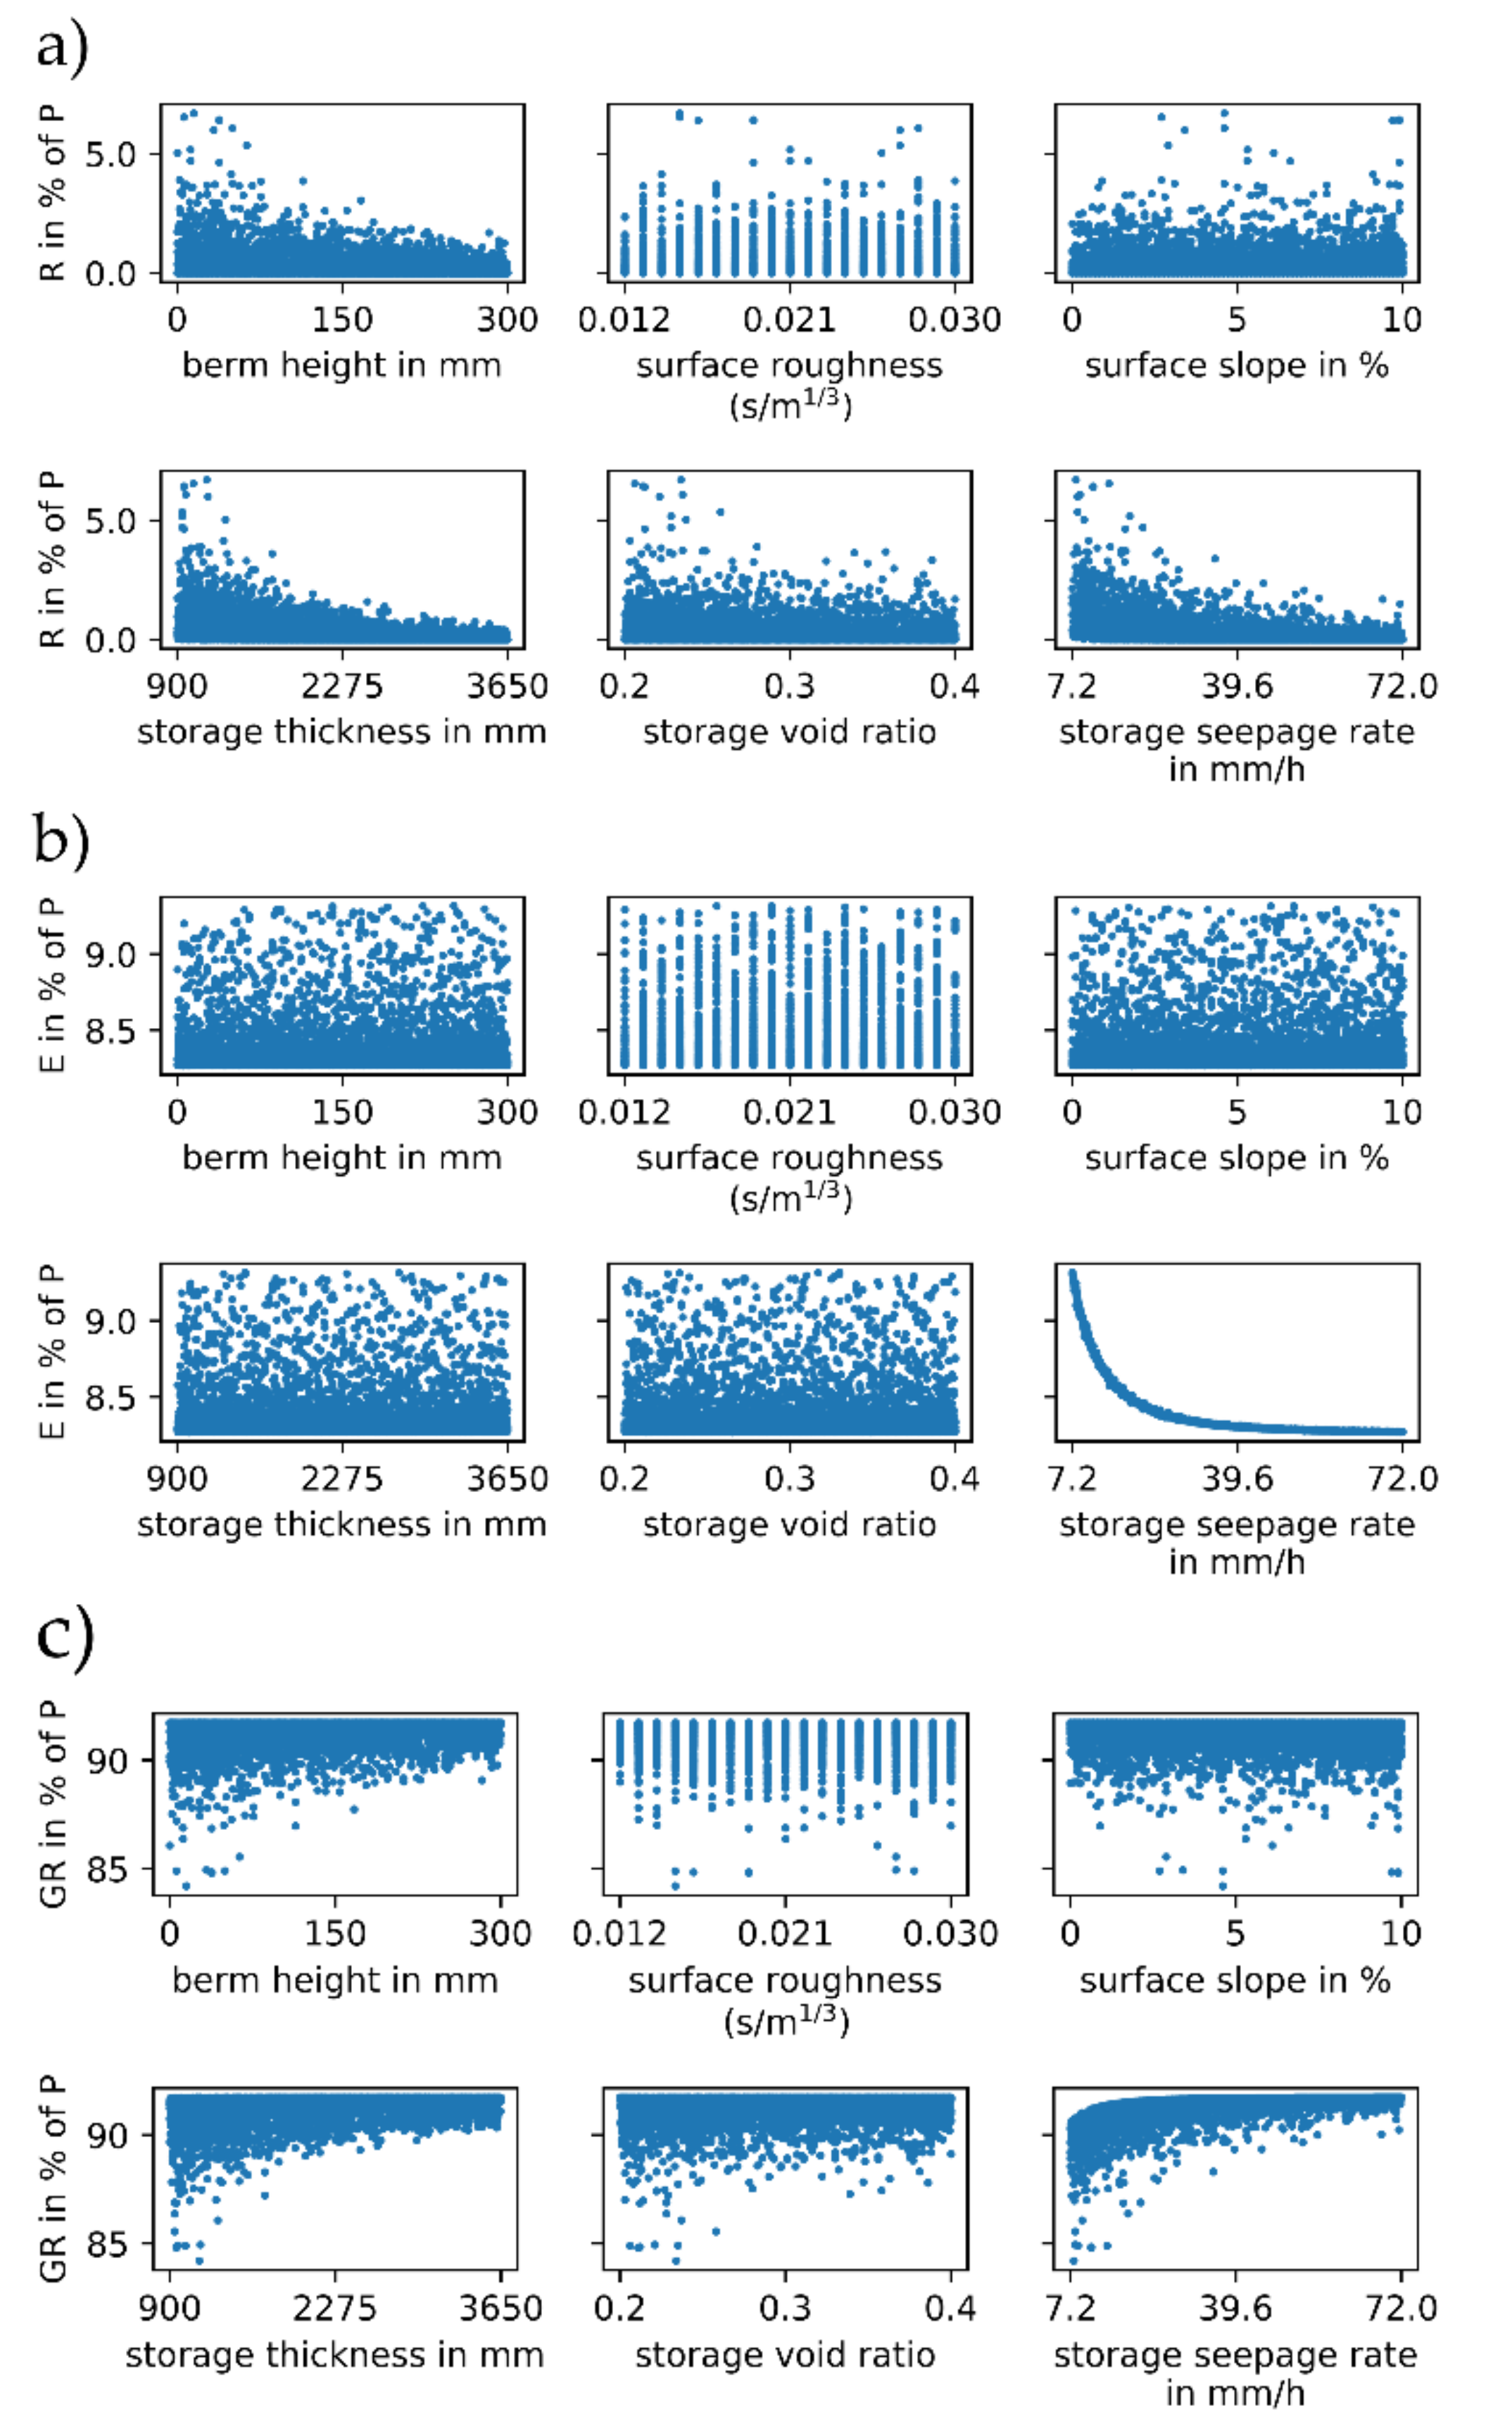
The long-term runoff volume, evaporation, and groundwater recharge for the infiltration trench ranges between 0.0–6.7%, 8.3–9.3%, and 84.2–91.7%, respectively (Figure 4). The long-term change in system storage is negligibly small compared to the other components.
The scatter-plots for the infiltration trench runoff volume (Figure 4a) and groundwater recharge (Figure 4c) show a rather clear pattern for the berm height, storage thickness, storage void ratio, and storage seepage rate. The larger the mentioned parameters are, the smaller the runoff volume is, whereas the groundwater recharge is larger as more stormwater can be retained (berm height, storage thickness, storage void ratio) or as stormwater infiltrates faster (storage seepage rate), resulting in fewer surcharged conditions and overflow events. The surface roughness as well as the surface slope does not show a pattern.
Regarding the evaporation of the infiltration trench, a distinct pattern can only be found for the storage seepage rate (Figure 4b). All other parameters do not show a pattern. A smaller seepage rate results in higher values for the evaporation as stormwater is retained for a longer period and, hence, is available for evaporation. However, the results show a very small range (only 1.0% between maximum and minimum), which can be explained with the relatively small evaporation rates of a maximum of 6.4 mm/day in summer compared to the minimal seepage rate of 7.2 mm/h (up to a maximum of 72 mm/h). Thus, infiltration is dominant for an infiltration trench and the investigated parameter ranges. Therefore, there is little variation for the time period in which water is available for evaporation. Additionally, SWMM ignores the response of evapotranspiration to the soil moisture variation [36]. This can also be a reason for little variations obtained for the evapotranspiration values.
The visual observations for the infiltration trench are confirmed by the obtained sensitivity indices (Table 3). The total effect index STi is zero for the surface roughness and surface slope for all three water balance components. Consequently, these two parameters are non-influential for the complete water balance. Regarding the evaporation, only the storage seepage rate appears to be sensitive, but as already mentioned, this result should be handled with care, considering the narrow range of the evaporation values. The storage seepage rate and the storage thickness are the most influential parameters for the runoff volume as well as for the groundwater recharge. Both parameters are affecting the occurrence of surcharged conditions resulting in overflow (runoff) and, thus, less groundwater recharge. The large differences between STi and Si imply that there are strong interactions between the parameters.
The study of Song et al. [20] also revealed the storage thickness, storage void ratio, and storage seepage rate as influential parameters for the infiltration (groundwater recharge) but not the berm height. The difference in results to Song et al. [20] might be caused by their different approaches: Different range for berm height values, one-at-a-time sensitivity analysis instead of a GSA, and only a small storm event instead of the precipitation continuum used for the sensitivity analysis. The precipitation data used in the study [20] is also the reason why the runoff volume appeared to be insensitive to all infiltration trench parameters.
3.1.3. Bio-Retention Cell
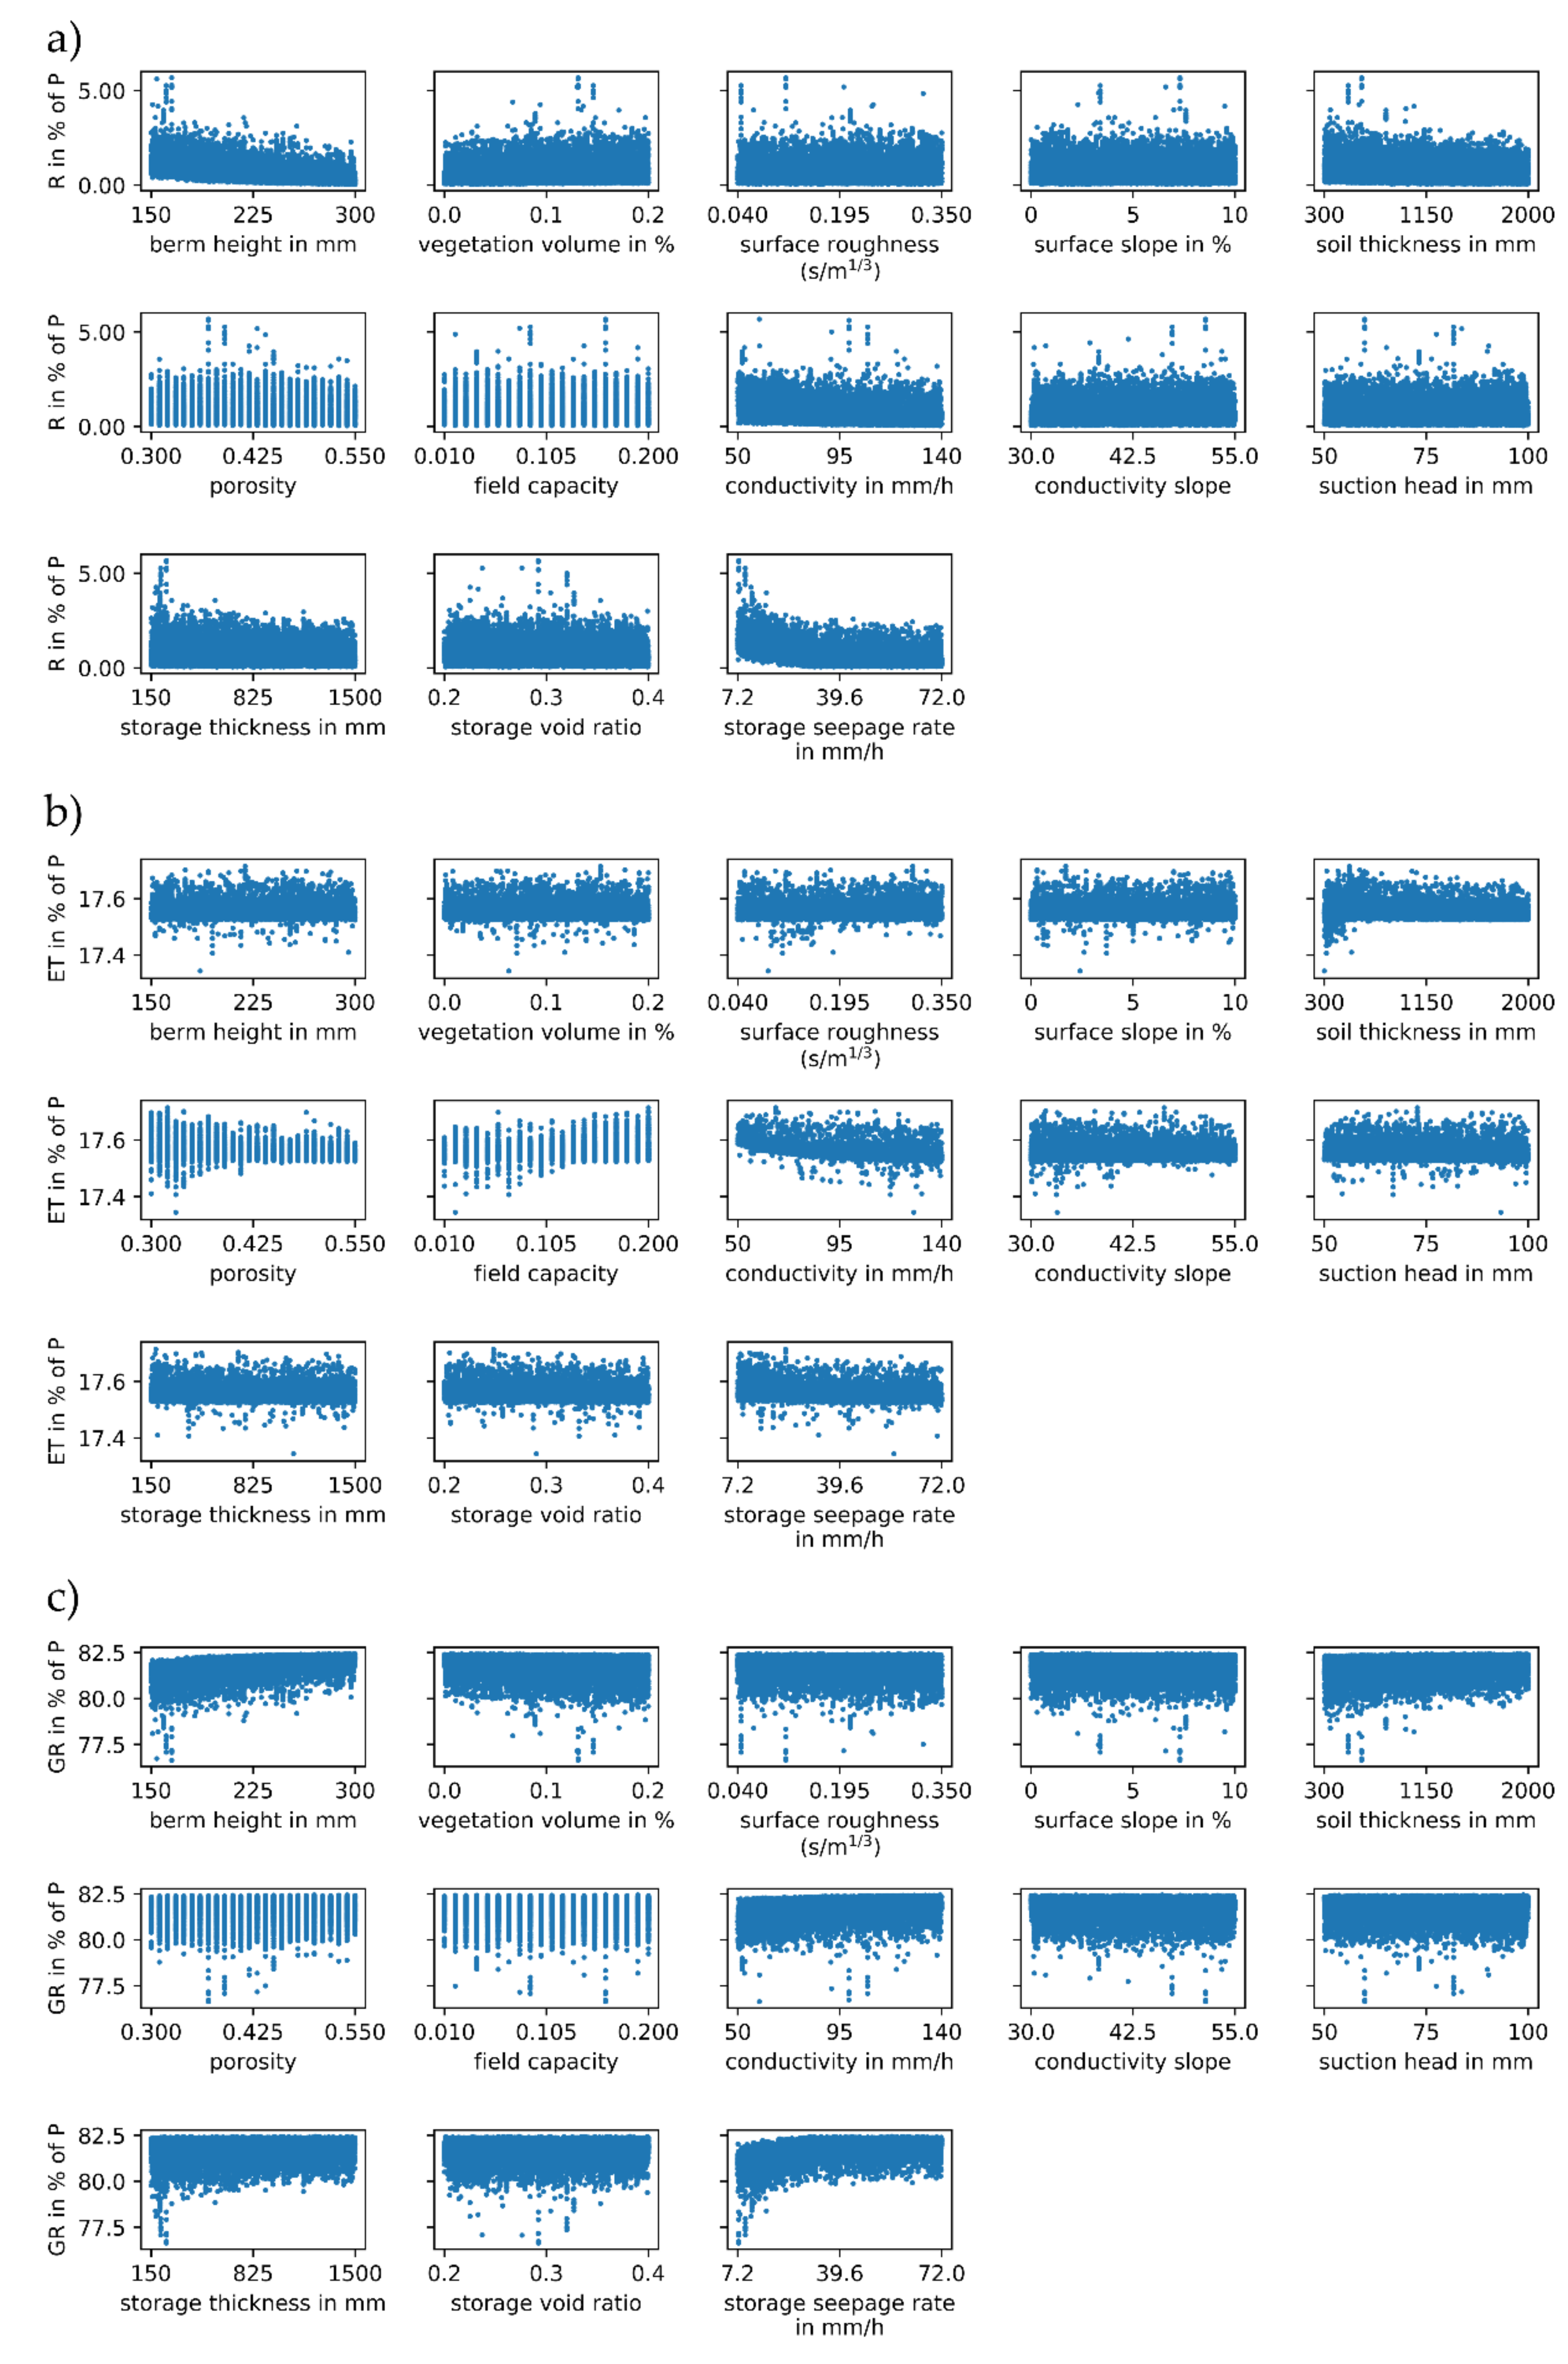
The long-term runoff volume, evapotranspiration, and groundwater recharge for the bio-retention cell ranges between 0.0–5.7%, 17.3–17.7%, and 76.6–82.4%, respectively (Figure 5). The long-term change in system change is negligibly small compared to the other components.
The results for the runoff volume and groundwater recharge of the bio-retention cell are correlated. The surface roughness, surface slope, porosity, field capacity, suction head, and storage void ratio do not show a pattern in the scatter-plots for the runoff volume (Figure 5a) as well as for the groundwater recharge (Figure 5c) and have a STi of zero or close to zero (compare values in Table 4). Consequently, the mentioned parameters are non-influential for both water balance components. The most influential parameter for the runoff volume and the groundwater recharge is the storage seepage rate, followed by the berm height, the conductivity, and the soil thickness. These parameters affect the emptying time (storage seepage rate, conductivity) and retention capacity (berm height, soil thickness) of the bio-retention cell.
In descending order, the evapotranspiration is most sensitive to the conductivity, field capacity, porosity, and storage seepage rate (compare Si in Table 4), as they affect the volume of stormwater or the time that stormwater is available for evapotranspiration. However, the range of the evapotranspiration values is very small (only 0.4% between maximum and minimum) and the conclusions of the sensitivity analysis have to be regarded with suspicion, therefore. The reason for this small range is the same as for the infiltration trench: Because of the small evapotranspiration rates of a maximum of 6.4 mm/day in summer compared to the minimal seepage rate of 7.2 mm/h (up to a maximum of 72 mm/h), infiltration is dominant for a bio-retention cell and the investigated parameter ranges. Again, as SWMM ignores the response of evapotranspiration to the soil moisture variation, this can be a reason for little variations obtained for the evapotranspiration values as well.
3.2. Storm Event-Based Results
The storm event separation revealed 775 storm events. The event precipitation depth ranges between 1.1–124.0 mm with a mean of 8.7 mm. The duration of the storm events ranges between 10 min and 25 h with a mean of 3.6 h. The maximum storm event intensity (averaged over the duration) is 74.7 mm/h, the minimum 0.61 mm/h and the mean 3.8 mm/h, whereas the maximum storm peak is 11.4 mm/5 min. The maximal return periods are 19 years, 25 years, and 20 years for a duration of 15 min, 60 min, and 720 min, respectively. The water balance was evaluated based on these storm events in order to investigate the effects of storm event characteristics on the sensitivity of LID parameters to water balance components. The investigated LID parameters were those with the highest first-order indices Si for the respective water balance component. Investigations of other influential parameters have been conducted as well but did not reveal new findings.
In difference to the long-term investigations the change in system storage may not be zero or negligibly small. It is investigated in combination with the groundwater recharge. The storm event characteristics considered for the investigations regarding the runoff volume and storage change/groundwater recharge are the precipitation depth and the antecedent dry period. For the evapotranspiration, the length of the water balance period and the precipitation depth per water balance period were used.
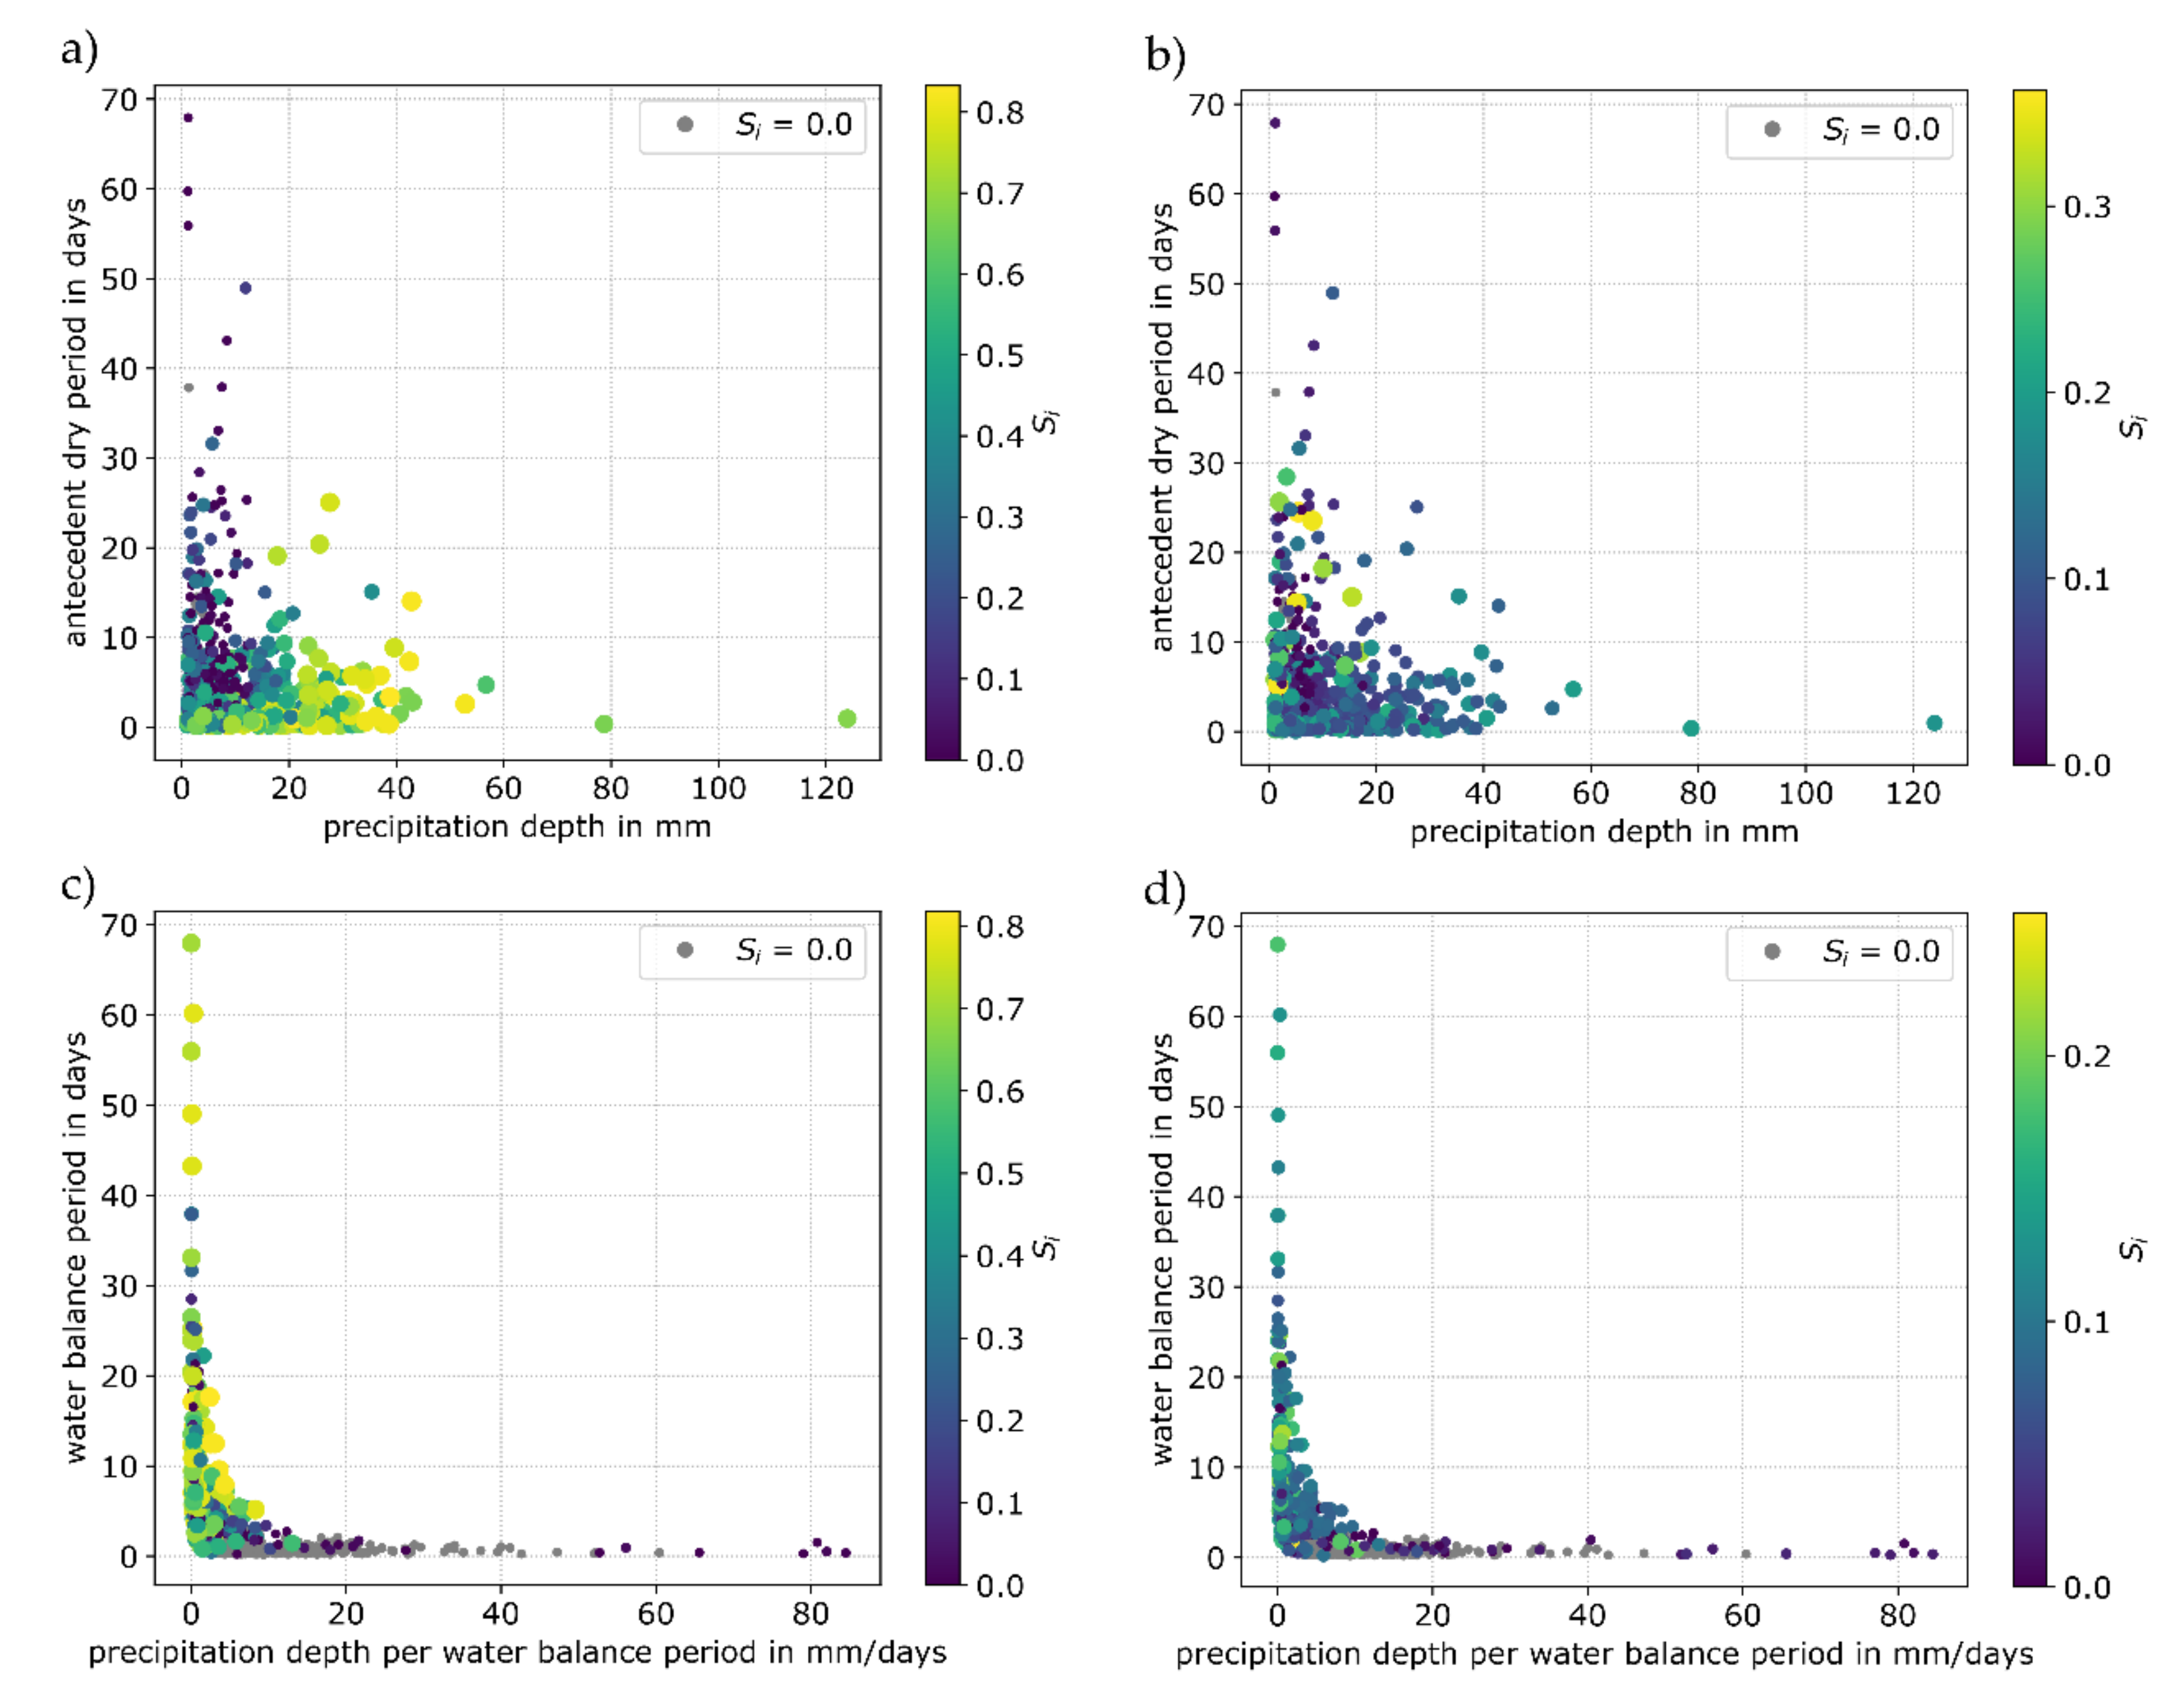
3.2.1. Green Roof
The parameters soil thickness (Figure 6a—Runoff volume, Figure 6c—Evapotranspiration) and porosity (Figure 6b—Runoff volume, Figure 6d—Evapotranspiration) were used for a storm event-based sensitivity analysis for the green roof.
The storm event characteristics precipitation depth and antecedent dry period show a clear effect on the sensitivity of the runoff volume to the green roof parameter soil thickness. The sensitivity tends to increase with an increasing precipitation depth, while it tends to decrease with an increasing antecedent dry period (Figure 6a). Storm events with a very small precipitation depth may not result in a runoff as the complete stormwater is retained in the green roof. Thus, the sensitivity is zero or at least small. The antecedent dry period affects the starting conditions, e.g., soil moisture, for the subsequent storm event. The longer the antecedent dry period, the larger is the green roof retention capacity restoration due to evapotranspiration. A long antecedent dry period results in small sensitivities as the green roof may have its full retention capacity at the start of the storm event. Thus, evapotranspiration is a key process controlling the green roof retention (according to Palla et al., Kasmin et al., Stovin et al. [37,38,39]). Especially the combination of a large precipitation depth, and a small antecedent dry period results in a high sensitivity of the runoff volume to the soil thickness, whereas the opposite combination of a small precipitation depth and a long antecedent dry period results in a very small sensitivity (Figure 6a).
The storm event-based sensitivity of the runoff volume to the green roof parameter porosity also shows a relation to the precipitation depth (Figure 6b) and antecedent dry period (Figure 6b), but it is less distinct than to the soil thickness. A longer antecedent dry period results in smaller sensitivity indices. A certain trend to higher sensitivity indices can be found for an increasing precipitation depth, but there are also some storm events with a small precipitation depth that result in high sensitivity indices.
SWMM ignores the response of evapotranspiration to the soil moisture variation [36]. Therefore, the availability of water is the most important boundary condition regarding the evapotranspiration. Only if there is water available, evapotranspiration can occur. With respect to the green roof, the availability of water is dependent on the precipitation depth of a storm event and the time to the next storm event (inter-event time) as the soil may become dry. The sensitivity indices tend to increase with an increasing water balance period, as the possibility that the soil falls dry increases (Figure 6c). A high precipitation depth per water balance period results in very small sensitivity indices as the likelihood that the soil falls dry is small (Figure 6c). The mentioned effects of the water balance period length and the precipitation depth per water balance period are also valid for the storm event-based sensitivity of the evapotranspiration to the green roof parameter porosity (see Figure 6d).
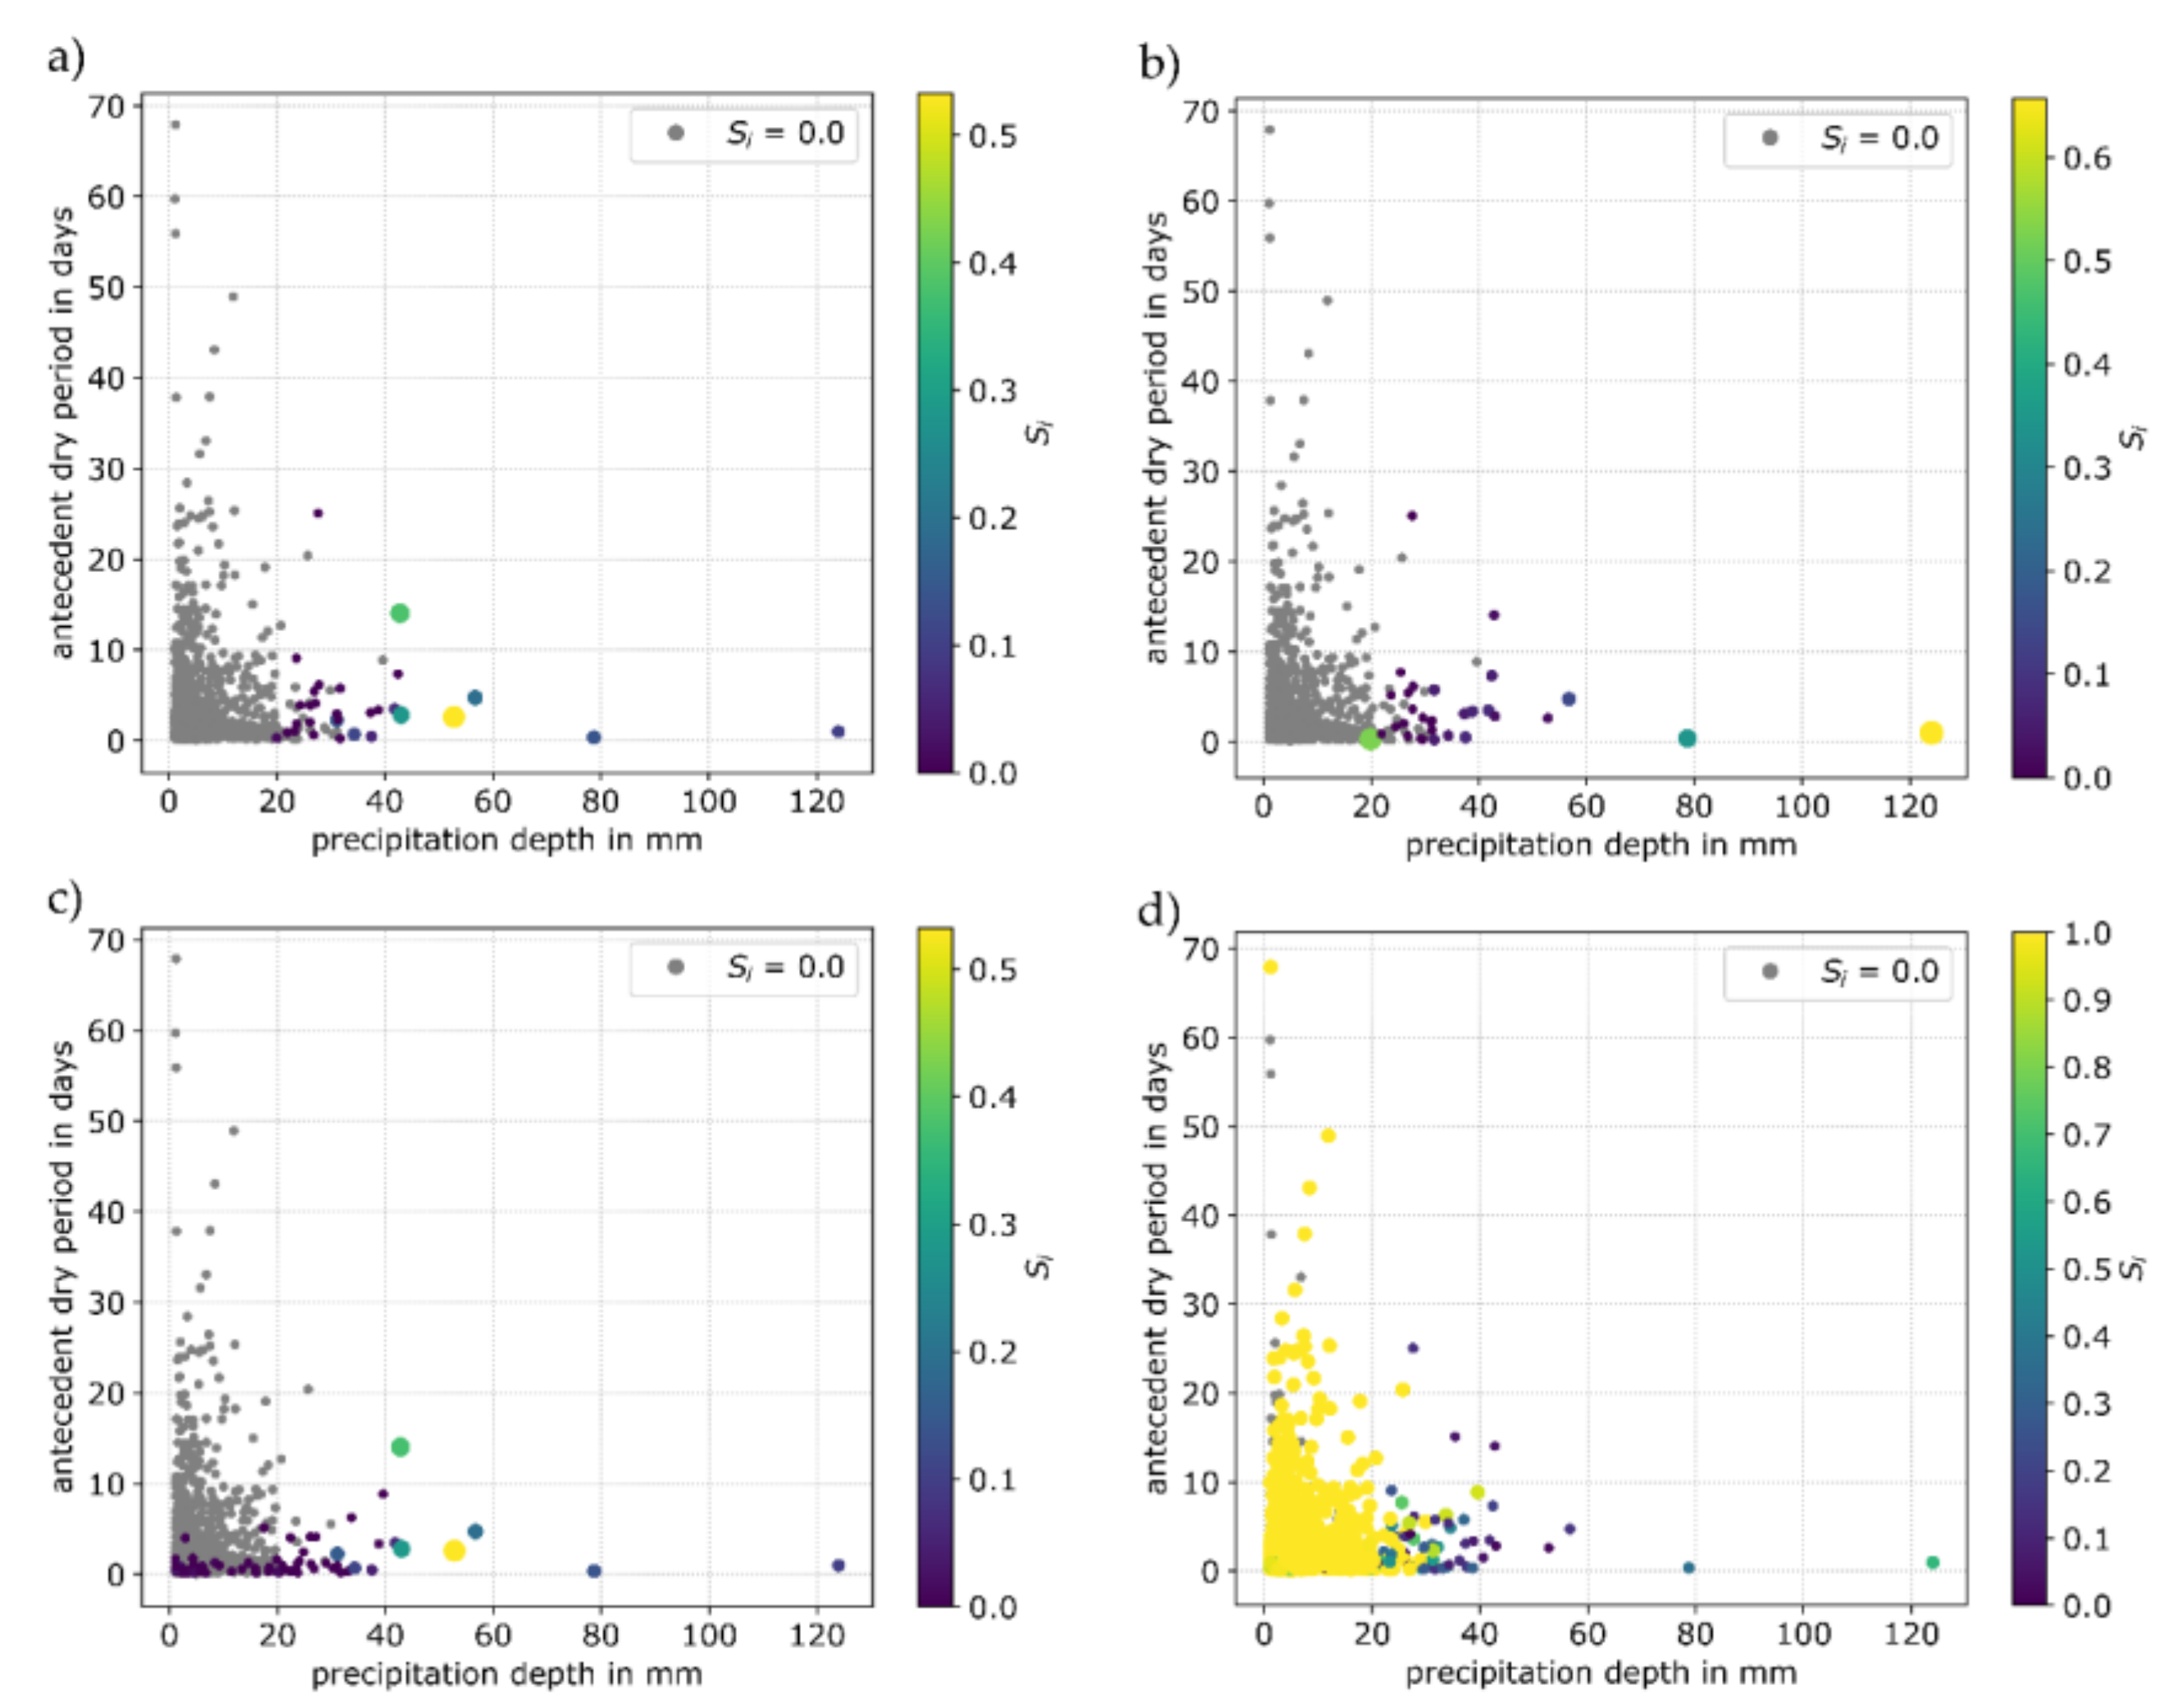
3.2.2. Infiltration Trench
The investigated parameters for the infiltration trench are the storage thickness (Figure 7a—Runoff volume, Figure 7c—Storage change/Groundwater recharge) and the storage seepage rate (Figure 7b—Runoff volume, Figure 7d—Storage change/Groundwater recharge). The range for the evapotranspiration values is very small (1.0%) for the long-term results and the storm event-based sensitivity analysis does not show any particularity. Therefore, no results are shown for this water balance component.
According to planning guidelines, the infiltration trench should not show a runoff or at least only with a certain recurrence time. Therefore, the runoff should only be sensitive to an infiltration trench parameter for storm events resulting in surcharged conditions with runoff. Besides a high precipitation depth, a short antecedent dry period potentially causes overflow events as the infiltration trench may not have its full storage capacity at the start of the storm event. The obtained results confirm the mentioned assumptions: The runoff volume is only sensitive to the storage thickness (Figure 7a) as well as to the storage seepage rate (Figure 7b) for storm events with a high precipitation depth and/or a short antecedent dry period.
The storage change/groundwater recharge is highly sensitive (S1 ≈ 1.0) to the storage seepage rate for the predominant part of the storm events (Figure 7d) as this parameter affects the emptying time of the infiltration trench having a big influence on the storage change/groundwater recharge especially for the short-term investigation. Only storm events with high precipitation depths and small antecedent dry periods tend to show smaller sensitivity indices. Such storm events potentially result in runoff, affecting also the storage change/groundwater recharge as overflowing water is not available for infiltration anymore. On the contrary, a sensitivity of the storage change/groundwater recharge to the storage thickness appears only for a small number of storm events with high precipitation depth and/or small antecedent dry period (Figure 7c). This result is correlated to the result for the runoff volume (Figure 7a) as the storage thickness influences the appearance of surcharged conditions resulting in a runoff and affecting the storage change/groundwater recharge.
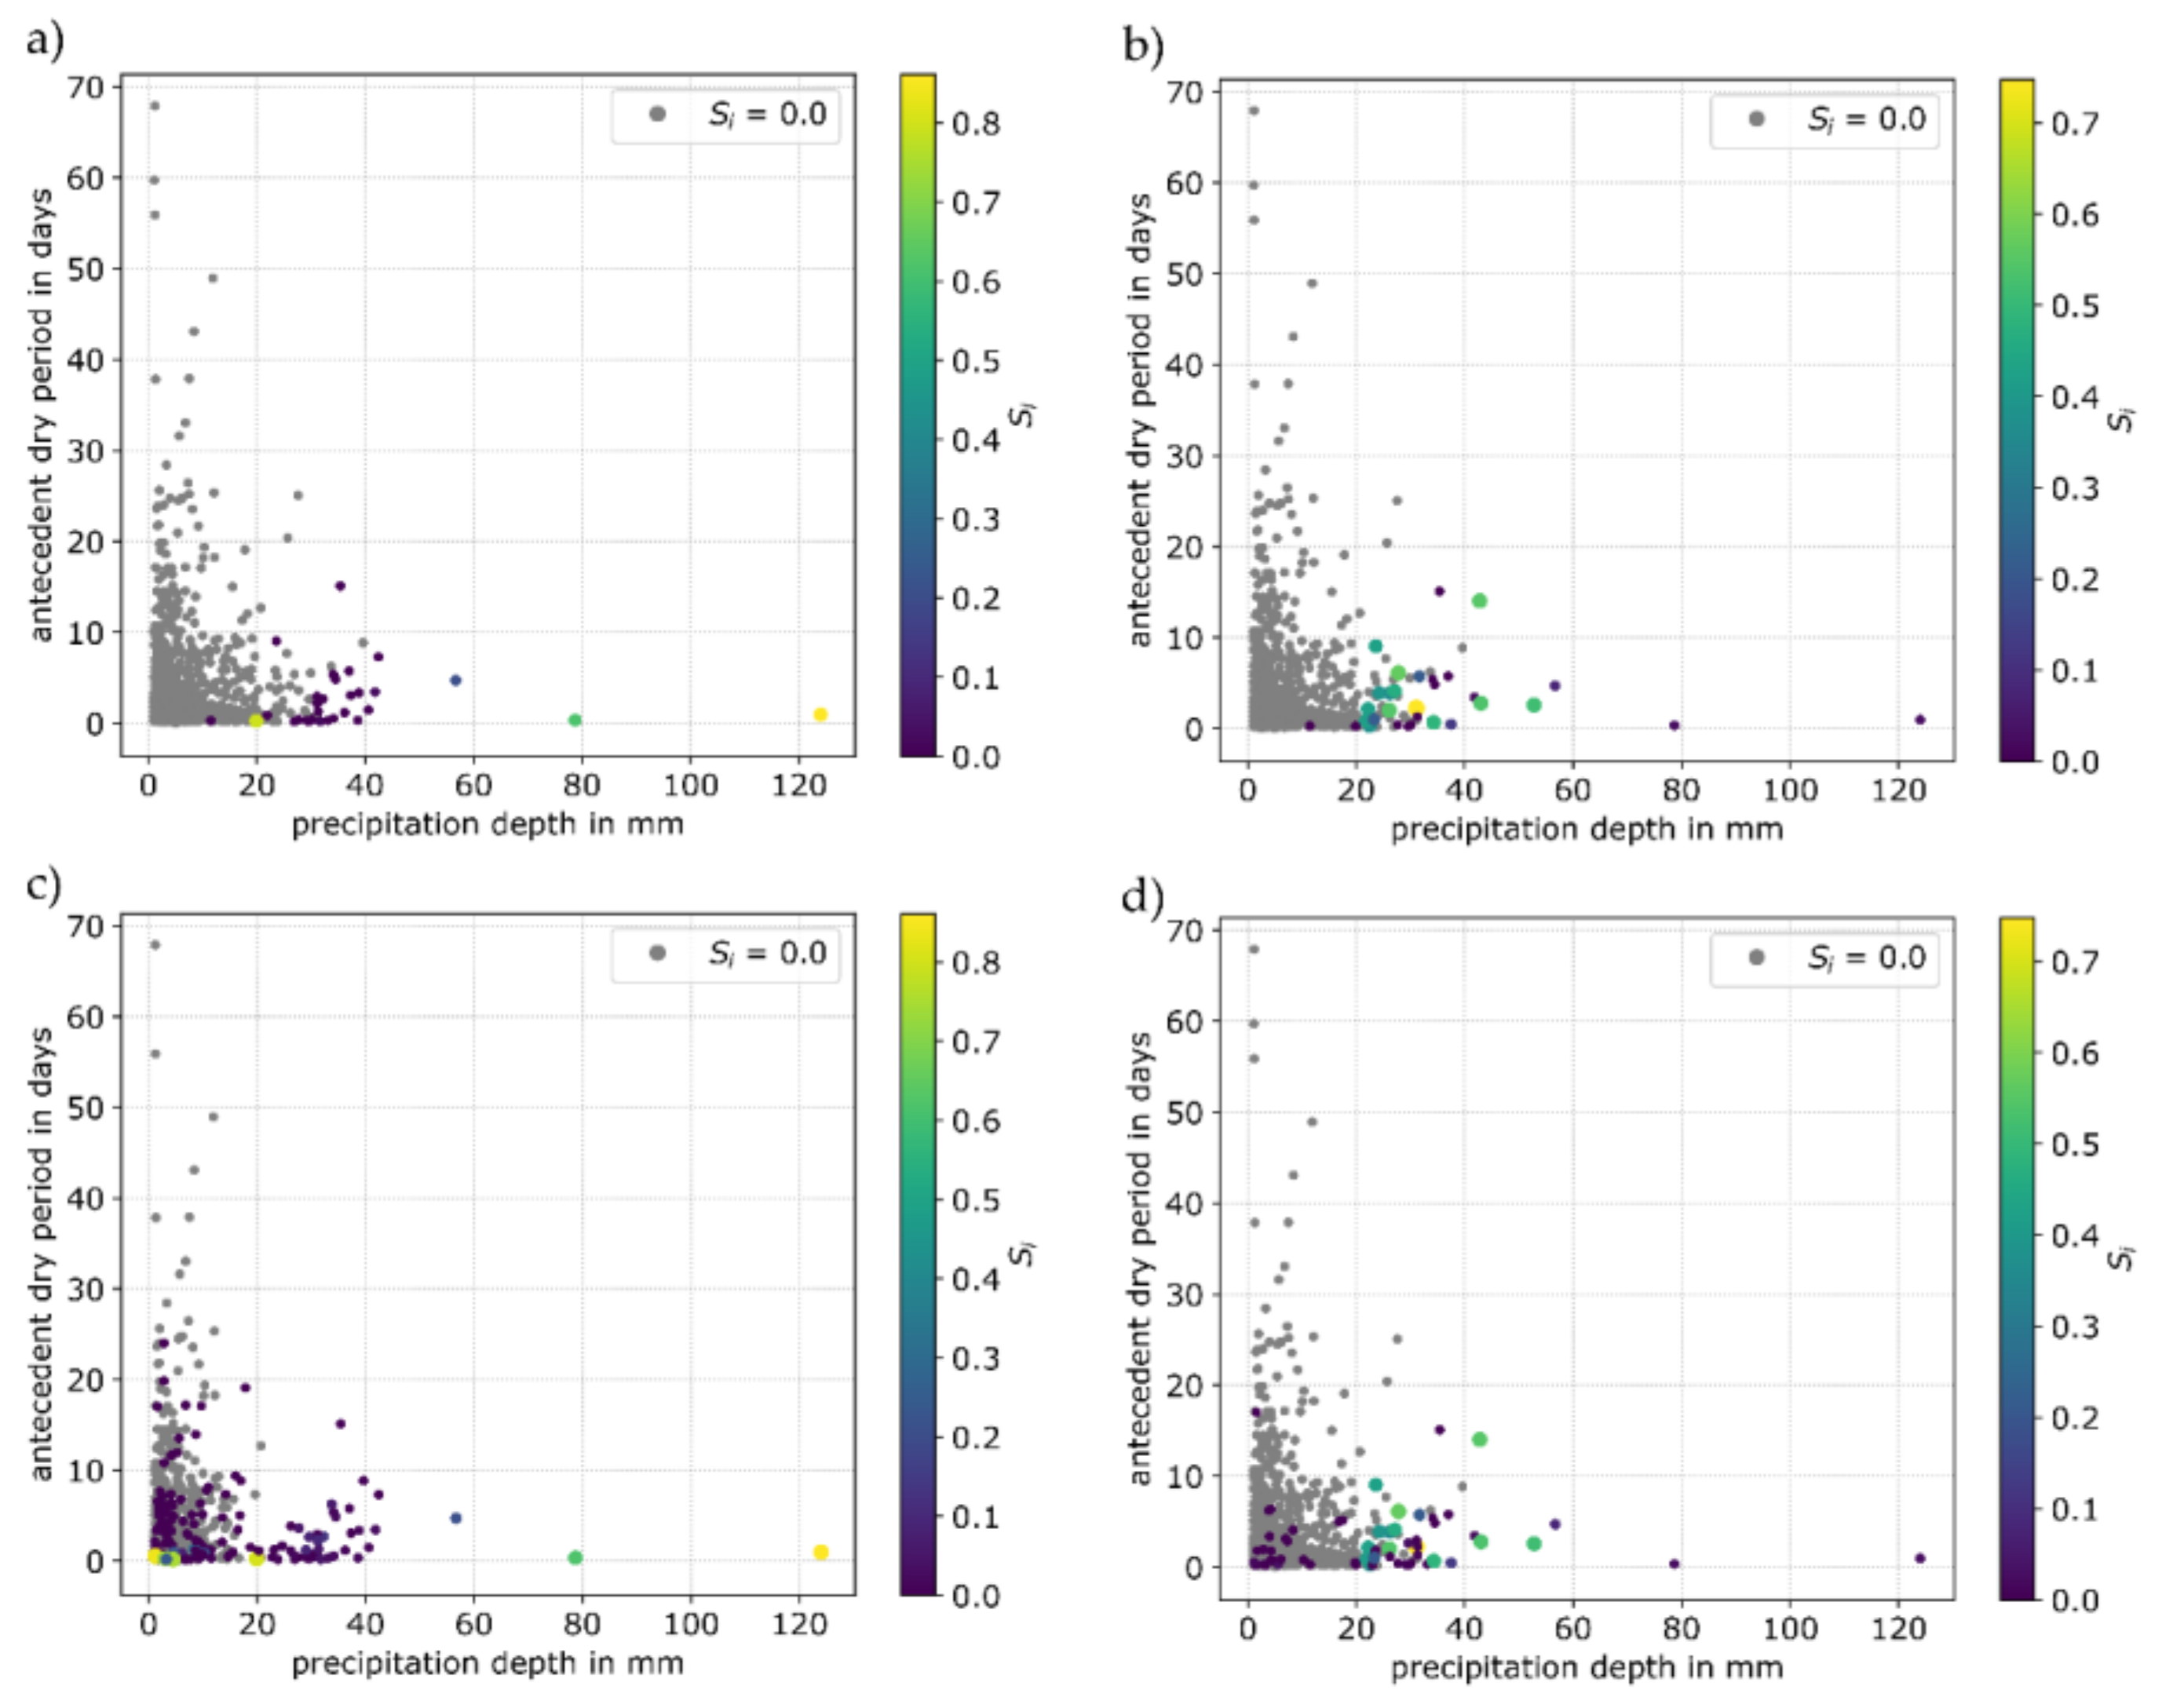
3.2.3. Bio-Retention Cell
The investigated parameters for the bio-retention cell are the storage seepage rate (Figure 8a—Runoff volume, Figure 8c—Storage change/Groundwater recharge) and the berm height (Figure 8b—Runoff volume, Figure 8d—Storage Change/Groundwater recharge). Similar to the infiltration trench results, the range for evapotranspiration values is very small (0.4%) for the long-term results and the storm event-based sensitivity analysis does not show any particularity. Therefore, no results are shown for this water balance component.
The results for the sensitivities of the runoff volume to the bio-retention cell parameters storage seepage rate (Figure 8a) and berm height (Figure 8b) are in accordance with the appropriate results for the infiltration trench (Figure 7a,b): Sensitivities can only be found for storm events with a high precipitation depth and/or a short antecedent dry period that may cause surcharged conditions and runoff.
The storage change/groundwater recharge is sensitive to the bio-retention cell parameters storage seepage rate (Figure 8c) and berm height (Figure 8d) only for a few storm events. Regarding the berm height, the results are correlated to the results for the runoff volume (see Figure 8a). The berm height influences the occurrence of surcharged conditions resulting in runoff and affecting the storage change/groundwater recharge. Such surcharged conditions appear in conjunction with storm events that show a high precipitation depth and/or a small antecedent dry period. Regarding the storage seepage rate, the storage change/groundwater recharge is sensitive to it also for some storm events with smaller precipitation depths but again only for storm events with a short antecedent dry period.
3.3. General Discussion
The long-term GSA revealed non-influential and influential parameters for the water balance of the three investigated LIDs. These results are valuable when using SWMM for planning/modeling LIDs regarding the water balance.
The stormwater retention capacity (affected by the green roof soil thickness and porosity, the infiltration trench storage thickness, and the bio-retention cell berm height) and the emptying time (affected by the storage seepage rate of the infiltration trench and bio-retention cell) are important characteristics affecting the water balance. The simulated evapotranspiration shows a very small range as infiltration is the dominating process and as SMMM ignores the response of evapotranspiration to the soil moisture variation. The results are mostly in agreement with other studies. Krebs et al. [18] also identified the porosity as an important parameter for green roof runoff. The study of Song et al. [20] also revealed the storage thickness, storage void ratio, and storage seepage rate as influential parameters for the infiltration (groundwater recharge). Differences in results to this study are caused by different boundary conditions like the sensitivity analysis method used for the study, parameter ranges, or precipitation data.
The storm event-based GSA showed that the sensitivity of water balance components to LID parameters is influenced by storm event characteristics. The precipitation depth and antecedent dry period affect the occurrence of runoff or surcharged conditions by controlling the stormwater load and the restoration of available storage volume/retention capacity. The evapotranspiration and seepage are key processes controlling the LID retention capacity restoration, especially during the inter-event time. Palla et al., Kasmin et al., and Stovin et al. [37,38,39] identified the evapotranspiration as a key process controlling the green roof retention as well. The length of the water balance period, which depends on the inter-event time, is crucial for the evapotranspiration as it might limit the water availability. Consequently, long-term evaluations have to be used for a reasonable assessment of LID performance regarding the evapotranspiration.
The storm event-based GSA results indicate that the boundary conditions precipitation depth and antecedent dry period affecting the system state at the start of a storm event have to be considered using long-term simulations even if dealing with single storm event investigations.
The influence of storm event characteristics on the GSA results indicates that using another precipitation time series for the investigations could produce differing GSA results. E.g., a precipitation time series with less annual precipitation depth may not result in any runoff for the infiltration trench or bio-retention cell. Consequently, no sensitivities would be determined for the long-term nor for the storm-event based runoff. A similar impact is valid for the temperature that controls the evapotranspiration. Lower temperatures and consequently lower evapotranspiration rates affect the drying time, e.g., of the green roof soil. Hence, it can occur that the soil never falls dry, resulting in no sensitivities.
4. Conclusions
This study presents the results of a GSA of the simulated water balance to the parameters of a green roof, an infiltration trench, and a bio-retention cell. All evaluations are based on long-term simulations of 10 years using SWMM. The water balance and in succession the sensitivity indices were determined for the long-term and for storm event results. These evaluations account for an overall picture of the LID parameter influence on the water balance.
The long-term GSA revealed LID parameters that are non-influential for the complete water balance:
- There were nine parameters for the green roof (berm height, vegetation volume, surface roughness, surface slope, conductivity, suction head, drainage mat thickness, drainage mat void fraction, drainage mat roughness),
- There were two parameters for the infiltration trench (surface roughness, surface slope), and
- There were three parameters for the bio-retention cell (surface roughness, surface slope, suction head).
The most influential parameters were:
- Soil thickness for green roof volume and evapotranspiration,
- Storage seepage rate for the complete water balance of the infiltration trench as well as for the bio-retention cell runoff volume and groundwater recharge, and
- Conductivity for bio-retention cell evapotranspiration.
The identification of the most influential parameters is helpful for practitioners to know which parameter should be measured first and with the highest effort in order to reduce the variance of simulation results most. Consequently, non-influential parameters can be given a lower priority as they can be fixed anywhere in their range of variation without affecting the output of interest.
The storm event-based analysis showed that the influence of LID parameters on the water balance components varies. While several storm event results showed no sensitivity of water balance components to LID parameters, some other storm event results showed a very high influence of LID parameters on the water balance components. The storm event characteristics precipitation depth and antecedent dry period affect the runoff volume and storage change/groundwater recharge sensitivity, whereas the precipitation depth and length of water balance period affect the evapotranspiration sensitivity.
The storm event-based results indicate that the inter-event time cannot be neglected when planning and/or modeling LIDs. Thus, long-term simulations have to be used even if dealing with single storm event investigations.
The parameter fixing (identification of non-influential parameters) and parameter prioritization through the long-term sensitivity analysis is the main outcome of this study. The results should be considered when using SWMM for a holistic LID planning approach based on long-term simulations and considering the complete water balance.
This study focused on the water balance of LIDs. Potential areas for future research will be investigations on the sensitivity of the hydrograph (e.g., runoff peak and time to peak) and the pollutant removal efficiency to LID parameters. Furthermore, other types of LIDs could be investigated, and the GSA could be conducted using other precipitation and temperature time series.
Author Contributions
Conceptualization and methodology, J.L., G.K., D.M.; investigation, J.L.; resources, D.C.; data curation, J.L., D.C.; validation, J.L., G.K.; writing—original draft preparation, J.L.; writing—review and editing, J.L., G.K., D.C., D.M.; visualization, J.L., D.C.; supervision, D.M.
Funding
The research is part of the project “FlexAdapt—Entwicklung flexibler Adaptierungskonzepte für die Siedlungsentwässerung der Zukunft”. The project was funded by the Austrian Federal Ministry for Sustainability and Tourism and the State of Styria.
Conflicts of Interest
The authors declare no conflict of interest.
References
- Shuster, W.D.; Bonta, J.; Thurston, H.; Warnemuende, E.; Smith, D.R. Impacts of impervious surface on watershed hydrology: A review. Urban Water J. 2005, 2, 263–275. [Google Scholar] [CrossRef]
- Cheng, S.J.; Wang, R.Y. An approach for evaluating the hydrological effects of urbanization and its application. Hydrol. Process. 2002, 16, 1403–1418. [Google Scholar] [CrossRef]
- Haase, D. Effects of urbanisation on the water balance—A long-term trajectory. Environ. Impact Assess. Rev. 2009, 29, 211–219. [Google Scholar] [CrossRef]
- Fletcher, T.D.; Andrieu, H.; Hamel, P. Understanding, management and modelling of urban hydrology and its consequences for receiving waters: A state of the art. Adv. Water Resour. 2013, 51, 261–279. [Google Scholar] [CrossRef]
- US EPA. Low Impact Development (LID)—A Literature Review; US EPA Office of Water (4203): Washington, DC, USA, 2000.
- Eckart, K.; McPhee, Z.; Bolisetti, T. Performance and implementation of low impact development—A review. Sci. Total Environ. 2017, 607, 413–432. [Google Scholar] [CrossRef] [PubMed]
- Ahiablame, L.M.; Engel, B.A.; Chaubey, I. Effectiveness of low impact development practices: Literature review and suggestions for future research. Water Air Soil Pollut. 2012, 223, 4253–4273. [Google Scholar] [CrossRef]
- Coffman, L. Low-Impact Development Design Strategies, an Integrated Design Approach; Department of Environmental Resources, Programs and Planning Division: Prince George’s County, MD, USA, 2000.
- DWA. Arbeitsblatt DWA-A 138—Planung, Bau und Betrieb von Anlagen zur Versickerung von Niederschlagswasser; Deutsche Vereinigung für Wasserwirtschaft, Abwasser und Abfall e.V.: Hennef, Germany, 2005. [Google Scholar]
- Austrian Standards Institute. ÖNORM B 2506-1: Regenwasser-Sickeranlagen für Abläufe von Dachflächen und Befestigten Flächen—Teil 1: Anwendung, Hydraulische Bemessung, Bau und Betrieb; ON: Vienna, Austria, 2013. [Google Scholar]
- Goebel, P.; Coldewey, W.G.; Dierkes, C.; Kories, H.; Meßer, J.; Meißner, E. Impacts of green roofs and rain water use on the water balance and groundwater levels in urban areas. Grundwasser 2007, 12, 189–200. [Google Scholar] [CrossRef]
- Henrichs, M.; Langner, J.; Uhl, M. Development of a simplified urban water balance model (WABILA). Water Sci. Technol. 2016, 73, 1785–1795. [Google Scholar] [CrossRef]
- Eger, C.G.; Chandler, D.G.; Driscoll, C.T. Hydrologic processes that govern stormwater infrastructure behaviour. Hydrol. Process. 2017, 31, 4492–4506. [Google Scholar] [CrossRef]
- Feng, Y.; Burian, S.; Pomeroy, C. Potential of green infrastructure to restore predevelopment water budget of a semi-arid urban catchment. J. Hydrol. 2016, 542, 744–755. [Google Scholar] [CrossRef]
- Jayasooriya, V.M.; Ng, A.W.M. Tools for Modeling of Stormwater Management and Economics of Green Infrastructure Practices: A Review. Water Air Soil Pollut. 2014, 225, 2055. [Google Scholar] [CrossRef]
- Rossman, L. Storm Water Management Model—User’s Manual Version 5.1; US EPA National Risk Management Research Laboratory: Cincinnati, OH, USA, 2015. [Google Scholar]
- Yang, J.; Wang, Z.-H. Physical parameterization and sensitivity of urban hydrological models: Application to green roof systems. Build. Environ. 2014, 75, 250–263. [Google Scholar] [CrossRef]
- Krebs, G.; Kuoppamäki, K.; Kokkonen, T.; Koivusalo, H. Simulation of green roof test bed runoff. Hydrol. Process. 2016, 30, 250–262. [Google Scholar] [CrossRef]
- Palermo, S.A.; Zischg, J.; Sitzenfrei, R.; Rauch, W.; Piro, P. Parameter Sensitivity of a Microscale Hydrodynamic Model. Green Energy Technol. 2018. [Google Scholar] [CrossRef]
- Song, J.-Y.; Chung, E.-S.; Kim, S.H. Decision Support System for the Design and Planning of Low-Impact Development Practices: The Case of Seoul. Water 2018, 10, 146. [Google Scholar] [CrossRef]
- Saltelli, A.; Annoni, P. How to avoid perfunctory sensitivity analysis. Environ. Model. Softw. 2010, 25, 1508–1517. [Google Scholar] [CrossRef]
- Rossman, L.A.; Huber, W.C. Storm Water Management Model Reference Manual Volume III—Water Quality; US EPA National Risk Management Research Laboratory: Cincinnati, OH, USA, 2016.
- Saltelli, A.; Ratto, M.; Andres, T.; Campolongo, F.; Cariboni, J.; Gatelli, D.; Saisana, M.; Tarantola, S. Global Sensitivity Analysis. The Primer; John Wiley & Sons, Ltd.: Chichester, UK, 2007; ISBN 978-0-470-72518-4. [Google Scholar]
- Saltelli, A.; Ratto, M.; Tarantola, S.; Campolongo, F. Sensitivity Analysis for Chemical Models. Chem. Rev. 2005, 105, 2811–2827. [Google Scholar] [CrossRef]
- Sobol, I.M. Sensitivity estimates for nonlinear mathematical models. Math. Model. Comput. Exp. 1993, 1, 407–414. [Google Scholar]
- Herman, J.; Usher, W. SALib: An open-source Python library for Sensitivity Analysis. Available online: http://joss.theoj.org (accessed on 1 March 2018).
- Saltelli, A. Making best use of model evaluations to compute sensitivity indices. Comput. Phys. Commun. 2002, 145, 280–297. [Google Scholar] [CrossRef]
- Sobol, I.M. Uniformly distributed sequences with an additional uniform property. USSR Comput. Math. Math. Phys. 1976, 16, 236–242. [Google Scholar] [CrossRef]
- OEWAV. ÖWAV—Leitfaden—Niederschlagsdaten zur Anwendung der ÖWAV-Regelblätter 11 und 19; Österreichischer Wasser- und Abfallwirtschaftsverband: Vienna, Austria, 2007. [Google Scholar]
- ZAMG Jahrbuch—ZAMG. Available online: https://www.zamg.ac.at/cms/de/klima/klimauebersichten/jahrbuch (accessed on 28 November 2017).
- Hargreaves, G.H.; Samani, Z.A. Reference Crop Evapotranspiration from Temperature. Appl. Eng. Agric. 1985, 1, 96–99. [Google Scholar] [CrossRef]
- Leimgruber, J.; Steffelbauer, D.B.; Krebs, G.; Tscheikner-Gratl, F.; Muschalla, D. Selecting a series of storm events for a model-based assessment of combined sewer overflows. Urban Water J. 2018, 15, 453–460. [Google Scholar] [CrossRef]
- Rossman, L.A.; Huber, W.C. Storm Water Management Model Reference Manual Volume I—Hydrology; US EPA National Risk Management Research Laboratory: Cincinnati, OH, USA, 2016.
- FLL. Dachbegrünungsrichtlinie—Richtlinie für die Planung Ausführung und Pflege von Dachbegrünungen; Forschungsgesellschaft Landschaftsentwicklung und Landschaftsbau e.V.: Bonn, Germany, 2008. [Google Scholar]
- Sieker, F.; Adams, R.; Huhn, V.; Stecker, A. Naturnahe Regenwasserbewirtschaftung in Siedlungsgebieten—Grundlagen, Leitfaden und Anwendungsbeispiele; Expert Verlag: Renningen, Malmsheim, 1996. [Google Scholar]
- Feng, Y.; Burian, S. Improving Evapotranspiration Mechanisms in the U.S. Environmental Protection Agency’s Storm Water Management Model. J. Hydrol. Eng. 2016, 21, 06016007. [Google Scholar] [CrossRef]
- Palla, A.; Lanza, L.G.; La Barbera, P. A Green Roof Experimental Site in the Mediterranean Climate. In Proceedings of the 11th International Conference on Urban Drainage (ICUD), Edinburgh, UK, 31 August–5 September 2008; pp. 1–10. [Google Scholar]
- Kasmin, H.; Stovin, V.R.; Hathway, E.A. Towards a generic rainfall-runoff model for green roofs. Water Sci. Technol. 2010, 62, 898–905. [Google Scholar] [CrossRef] [PubMed]
- Stovin, V.; Poë, S.; Berretta, C. A modelling study of long term green roof retention performance. J. Environ. Manag. 2013, 131, 206–215. [Google Scholar] [CrossRef] [PubMed] [Green Version]
Figure 1.
Layer concept and simulated processes in Storm Water Management Model (SWMM) for (a) green roof, (b) infiltration trench, and (c) bio-retention cell.
Figure 1.
Layer concept and simulated processes in Storm Water Management Model (SWMM) for (a) green roof, (b) infiltration trench, and (c) bio-retention cell.

Figure 2.
Precipitation time series used for the simulations; measured at Graz/Austria from 1996–2006.
Figure 2.
Precipitation time series used for the simulations; measured at Graz/Austria from 1996–2006.

Figure 3.
Results of the long-term simulations for the green roof depending on the value of the 13 green roof parameters. Each dot illustrates the result of a parameter sample. (a) Runoff volume (R); (b) evapotranspiration (ET).
Figure 3.
Results of the long-term simulations for the green roof depending on the value of the 13 green roof parameters. Each dot illustrates the result of a parameter sample. (a) Runoff volume (R); (b) evapotranspiration (ET).

Figure 4.
Results of the long-term simulations for the infiltration trench depending on the value of the six infiltration trench parameters. Each dot illustrates the result of a parameter sample. (a) Runoff volume (R); (b) evaporation (E); (c) groundwater recharge (GR).
Figure 4.
Results of the long-term simulations for the infiltration trench depending on the value of the six infiltration trench parameters. Each dot illustrates the result of a parameter sample. (a) Runoff volume (R); (b) evaporation (E); (c) groundwater recharge (GR).

Figure 5.
Results of the long-term simulations for the bio-retention cell depending on the value of the 13 bio-retention cell parameters. Each dot illustrates the result of a parameter sample. (a) Runoff volume (R); (b) evapotranspiration (ET); (c) groundwater recharge (GR).
Figure 5.
Results of the long-term simulations for the bio-retention cell depending on the value of the 13 bio-retention cell parameters. Each dot illustrates the result of a parameter sample. (a) Runoff volume (R); (b) evapotranspiration (ET); (c) groundwater recharge (GR).

Figure 6.
Results of the storm event-based sensitivity analysis for the green roof. Si depending on storm event characteristics (a + b: Precipitation depth—antecedent dry period, c + d: Water balance period—precipitation depth per water balance period) and green roof parameters. (a) Si for runoff volume and soil thickness; (b) Si for runoff volume and porosity; (c) Si for evapotranspiration and soil thickness; (d) Si for evapotranspiration and porosity. Water balance period: Period from start of a storm event to the start of the subsequent storm event.

Figure 7.
Results of storm event-based sensitivity analysis for the infiltration trench. Si depending on storm event characteristics (precipitation depth, antecedent dry period) and infiltration trench parameters: (a) Si for runoff volume and storage thickness; (b) Si for runoff volume and storage seepage rate; (c) Si for storage change/groundwater recharge and storage thickness; (d) Si for storage change/groundwater recharge and storage seepage rate.

Figure 8.
Results of storm event-based sensitivity analysis for the bio-retention cell. Si depending on storm event characteristics (precipitation depth, antecedent dry period) and bio-retention cell parameters: (a) Si for runoff volume and storage seepage rate; (b) Si for runoff volume and berm height; (c) Si for storage change/groundwater recharge and storage seepage rate; (d) Si for storage change/groundwater recharge and berm height.


Table 1.
Low impact development (LID) parameter ranges for the sensitivity analysis.
| Green Roof | |||||
|---|---|---|---|---|---|
| Layer | Parameter | min | max | Unit | Reference |
| Surface | Berm height | 0 | 80 | mm | [22] |
| Vegetation volume | 0 | 0.2 | % | [22] | |
| Surface roughness | 0.04 | 0.35 | s/m1/3 | [33] | |
| Surface slope | 2 | 100 | % | ||
| Soil | Soil thickness (for extensive green roof) | 40 | 200 | mm | [22] |
| Porosity | 0.36 | 0.65 | - | [22,34], adapted | |
| Field capacity | 0.1 | 0.35 | - | [22,34], adapted | |
| Wilting point | 0 | - | |||
| Conductivity | 18 | 100 | mm/h | [34], adapted | |
| Conductivity slope | 30 | 55 | - | [22] | |
| Suction head | 50 | 100 | mm | [22] | |
| Drainage mat | Drainage mat thickness | 13 | 50 | mm | [22] |
| Drainage mat void fraction | 0.2 | 0.4 | - | [22] | |
| Drainage mat roughness | 0.01 | 0.03 | s/m1/3 | [22] | |
| Infiltration Trench | |||||
| Layer | Parameter | min | max | Unit | Reference |
| Surface | Berm height | 0 | 300 | mm | [22] |
| Vegetation volume | 0 | ||||
| Surface roughness | 0.012 | 0.03 | s/m1/3 | [22] | |
| Surface slope | 0 | 10 | % | ||
| Storage | Storage thickness | 900 | 3650 | mm | [22] |
| Storage void ratio | 0.2 | 0.4 | - | [22] | |
| Storage seepage rate | 7.2 | 72 | mm/h | [35] | |
| Bio-Retention Cell | |||||
| Layer | Parameter | min | max | Unit | Reference |
| Surface | Berm height | 150 | 300 | mm | [22] |
| Vegetation volume | 0 | 0.2 | fraction | [22] | |
| Surface roughness | 0.04 | 0.35 | s/m1/3 | [33] | |
| Surface slope | 0 | 10 | % | ||
| Soil | Soil thickness | 300 | 2000 | mm | [33] |
| Porosity | 0.3 | 0.55 | - | [33] | |
| Field capacity | 0.01 | 0.2 | - | [33] | |
| Wilting point | 0 | - | |||
| Conductivity | 50 | 140 | mm/h | [33] | |
| Conductivity slope | 30 | 55 | - | [33] | |
| Suction head | 50 | 100 | mm | [33] | |
| Storage | Storage thickness | 150 | 1500 | mm | [33] |
| Storage void fraction | 0.2 | 0.4 | - | [33] | |
| Storage seepage rate | 7.2 | 72 | mm/h | [35] | |
Table 2.
Result of the long-term sensitivity analysis for the green roof; blue-shaded: Non-influential parameters (STi < 0.01), green-shaded: Most influential parameters (highest Si).
Table 2.
Result of the long-term sensitivity analysis for the green roof; blue-shaded: Non-influential parameters (STi < 0.01), green-shaded: Most influential parameters (highest Si).
| Runoff Volume | Evapotranspiration | |||
|---|---|---|---|---|
| Parameter | Si | STi | Si | STi |
| Berm height | 0.000 | 0.000 | 0.000 | 0.000 |
| Vegetation volume | 0.000 | 0.000 | 0.000 | 0.000 |
| Surface roughness | 0.000 | 0.000 | 0.000 | 0.000 |
| Surface slope | 0.000 | 0.000 | 0.000 | 0.000 |
| Soil thickness | 0.795 | 0.804 | 0.798 | 0.807 |
| Porosity | 0.168 | 0.188 | 0.166 | 0.186 |
| Field capacity | 0.003 | 0.030 | 0.003 | 0.030 |
| Conductivity | 0.001 | 0.004 | 0.001 | 0.004 |
| Conductivity slope | 0.022 | 0.024 | 0.021 | 0.023 |
| Suction head | 0.000 | 0.000 | 0.000 | 0.000 |
| Drainage mat thickness | 0.000 | 0.000 | 0.000 | 0.000 |
| Drainage mat void fraction | 0.000 | 0.000 | 0.000 | 0.000 |
| Drainage mat roughness | 0.000 | 0.000 | 0.000 | 0.000 |
Table 3.
Results of the long-term sensitivity analysis for the infiltration trench; blue-shaded: Non-influential parameters (STi < 0.01), green-shaded: Most influential parameters (highest Si).
Table 3.
Results of the long-term sensitivity analysis for the infiltration trench; blue-shaded: Non-influential parameters (STi < 0.01), green-shaded: Most influential parameters (highest Si).
| Runoff Volume | Evaporation | Groundwater Recharge | ||||
|---|---|---|---|---|---|---|
| Parameter | Si | STi | Si | STi | Si | STi |
| Berm height | 0.039 | 0.248 | 0.001 | 0.000 | 0.015 | 0.161 |
| Surface roughness | 0.000 | 0.000 | 0.000 | 0.000 | 0.000 | 0.000 |
| Surface slope | 0.000 | 0.000 | 0.000 | 0.000 | 0.000 | 0.000 |
| Storage thickness | 0.216 | 0.552 | 0.001 | 0.000 | 0.137 | 0.369 |
| Storage void ratio | 0.022 | 0.094 | 0.000 | 0.000 | 0.013 | 0.063 |
| Storage seepage rate | 0.285 | 0.465 | 0.999 | 1.000 | 0.533 | 0.642 |
Table 4.
Result of the long-term sensitivity analysis for the bio-retention cell; blue-shaded: Non-influential parameters (STi < 0.01), green-shaded: Most influential parameters (highest Si).
Table 4.
Result of the long-term sensitivity analysis for the bio-retention cell; blue-shaded: Non-influential parameters (STi < 0.01), green-shaded: Most influential parameters (highest Si).
| Runoff Volume | Evapo-Transpiration | Groundwater Recharge | ||||
|---|---|---|---|---|---|---|
| Parameter | Si | STi | Si | STi | Si | STi |
| Berm height | 0.296 | 0.336 | 0.000 | 0.000 | 0.282 | 0.319 |
| Vegetation volume | 0.026 | 0.032 | 0.000 | 0.000 | 0.025 | 0.030 |
| Surface roughness | 0.000 | 0.000 | 0.000 | 0.000 | 0.000 | 0.000 |
| Surface slope | 0.000 | 0.000 | 0.000 | 0.000 | 0.000 | 0.000 |
| Soil thickness | 0.052 | 0.081 | 0.009 | 0.134 | 0.051 | 0.083 |
| Porosity | 0.005 | 0.006 | 0.079 | 0.334 | 0.005 | 0.008 |
| Field capacity | 0.000 | 0.000 | 0.090 | 0.312 | 0.002 | 0.001 |
| Conductivity | 0.128 | 0.160 | 0.356 | 0.378 | 0.141 | 0.173 |
| Conductivity slope | 0.003 | 0.008 | 0.016 | 0.096 | 0.003 | 0.008 |
| Suction head | 0.002 | 0.001 | 0.005 | 0.004 | 0.003 | 0.001 |
| Storage thickness | 0.024 | 0.084 | 0.026 | 0.072 | 0.026 | 0.087 |
| Storage void ratio | 0.000 | 0.006 | 0.004 | 0.004 | 0.001 | 0.006 |
| Storage seepage rate | 0.348 | 0.420 | 0.055 | 0.111 | 0.345 | 0.419 |
© 2018 by the authors. Licensee MDPI, Basel, Switzerland. This article is an open access article distributed under the terms and conditions of the Creative Commons Attribution (CC BY) license (http://creativecommons.org/licenses/by/4.0/).
Share and Cite
MDPI and ACS Style
Leimgruber, J.; Krebs, G.; Camhy, D.; Muschalla, D. Sensitivity of Model-Based Water Balance to Low Impact Development Parameters. Water 2018, 10, 1838. https://doi.org/10.3390/w10121838
AMA Style
Leimgruber J, Krebs G, Camhy D, Muschalla D. Sensitivity of Model-Based Water Balance to Low Impact Development Parameters. Water. 2018; 10(12):1838. https://doi.org/10.3390/w10121838
Chicago/Turabian StyleLeimgruber, Johannes, Gerald Krebs, David Camhy, and Dirk Muschalla. 2018. "Sensitivity of Model-Based Water Balance to Low Impact Development Parameters" Water 10, no. 12: 1838. https://doi.org/10.3390/w10121838
Note that from the first issue of 2016, this journal uses article numbers instead of page numbers. See further details here.