Groundwater Quality and Suitability for Different Uses in the Saloum Area of Senegal


1
Department of Civil Engineering, ESP, University Cheikh Anta Diop, Dakar, Senegal, PO Box 5085 Dakar Fann, Senegal
2
Faculty of Sciences, University of Poitiers, IC2MP, 5 Rue Albert Turpain, B8 TSA 51106, 86073 Poitiers, CEDEX 9, France
3
Department of Geology, Faculty of Science and Technology, University Cheikh Anta Diop, BP 5005 Dakar-Fann, Senegal
*
Author to whom correspondence should be addressed.
Water 2018, 10(12), 1837; https://doi.org/10.3390/w10121837
Submission received: 15 November 2018
/
Revised: 6 December 2018
/
Accepted: 7 December 2018
/
Published: 12 December 2018
(This article belongs to the Special Issue Advances in Hydrogeology: Trend, Model, Methodology and Concepts)
Abstract
:Hydrogeochemical analyses were conducted on groundwater sampled from the Saloum aquifer, in southern Senegal. The objective was to identify the chemical processes that control hydrochemistry and to assess the quality of groundwater for determining its suitability for drinking and agricultural purposes. Water samples were collected from 79 wells during the dry season in May 2012, and were subjected to analysis for chemical characteristics (major ions), pH, electrical conductivity (EC) and total dissolved solid (TDS). The dominant hydrochemical facies observed for the groundwater samples are NaCl and CaHCO3. Gibbs plot depicts predominance of rock water interaction and evaporation processes controlling the water chemistry. Percentage of Na+, Residual Sodium Carbonate (RSC), Total Hardness (TH) and Sodium Adsorption Ratio (SAR) values were calculated. The results were compared with the standard guideline values recommended by the World Health Organization and agricultural water standards. The TDS in groundwater is less than 1200 mg/L and SAR values are less than 10. RSC values overall are less than 1.25 meq/L. Results show that the groundwater in the area has generally a low hardness and is fresh (95%) to brackish. The majority of groundwater samples are appropriate for domestic uses. The indexes for water irrigation compared with standard limits revealed that most of the Saloum groundwater samples fall in the suitable range for irrigation.
1. Introduction
Assessment of groundwater chemical characteristics is crucial to better predict its uses. The processes occurring within the groundwater and reactions with aquifer minerals have a profound effect on water quality [1]. Knowledge of the geochemical evolution of groundwater in arid and semi-arid regions could lead to sustainable development and effective management of these water resources [2,3,4]. Accordingly, water quality analysis is important for groundwater studies and utilization. The present work was carried out to analyze the groundwater quality in the Saloum region in southern Senegal and to examine its potential uses. Diversity of groundwater quality in the study area is a function of physical and chemical parameters that are greatly influenced by geological formations and anthropogenic activities. In the study area, agriculture is the principal economic activity. Today, the target of agricultural policy is to eradicate poverty, allowing several harvests each year. As surface water resources are lacking, groundwater resources in the area are crucial because they represent the only water sources for drinking and agricultural purposes for people living in this area. Since 2000 [5,6], hydrogeological and hydrochemical studies have been carried out in the study area. However, the capacity of groundwater to fulfill domestic and irrigation water needs has yet not been addressed. Within the frame of a sound management of this vital resource in the Saloum basin, it has become essential to assess its suitability for these uses. In general, it is widely recognized that utilizations of groundwater resources are closely correlated with their geochemical properties [7,8,9,10,11,12,13]. As there are no industries in this basin, the objective of the present work is primarily to assess the suitability of groundwater resources to be used for irrigation and for domestic life.
2. Materials and Methods
2.1. Location of the Study Area
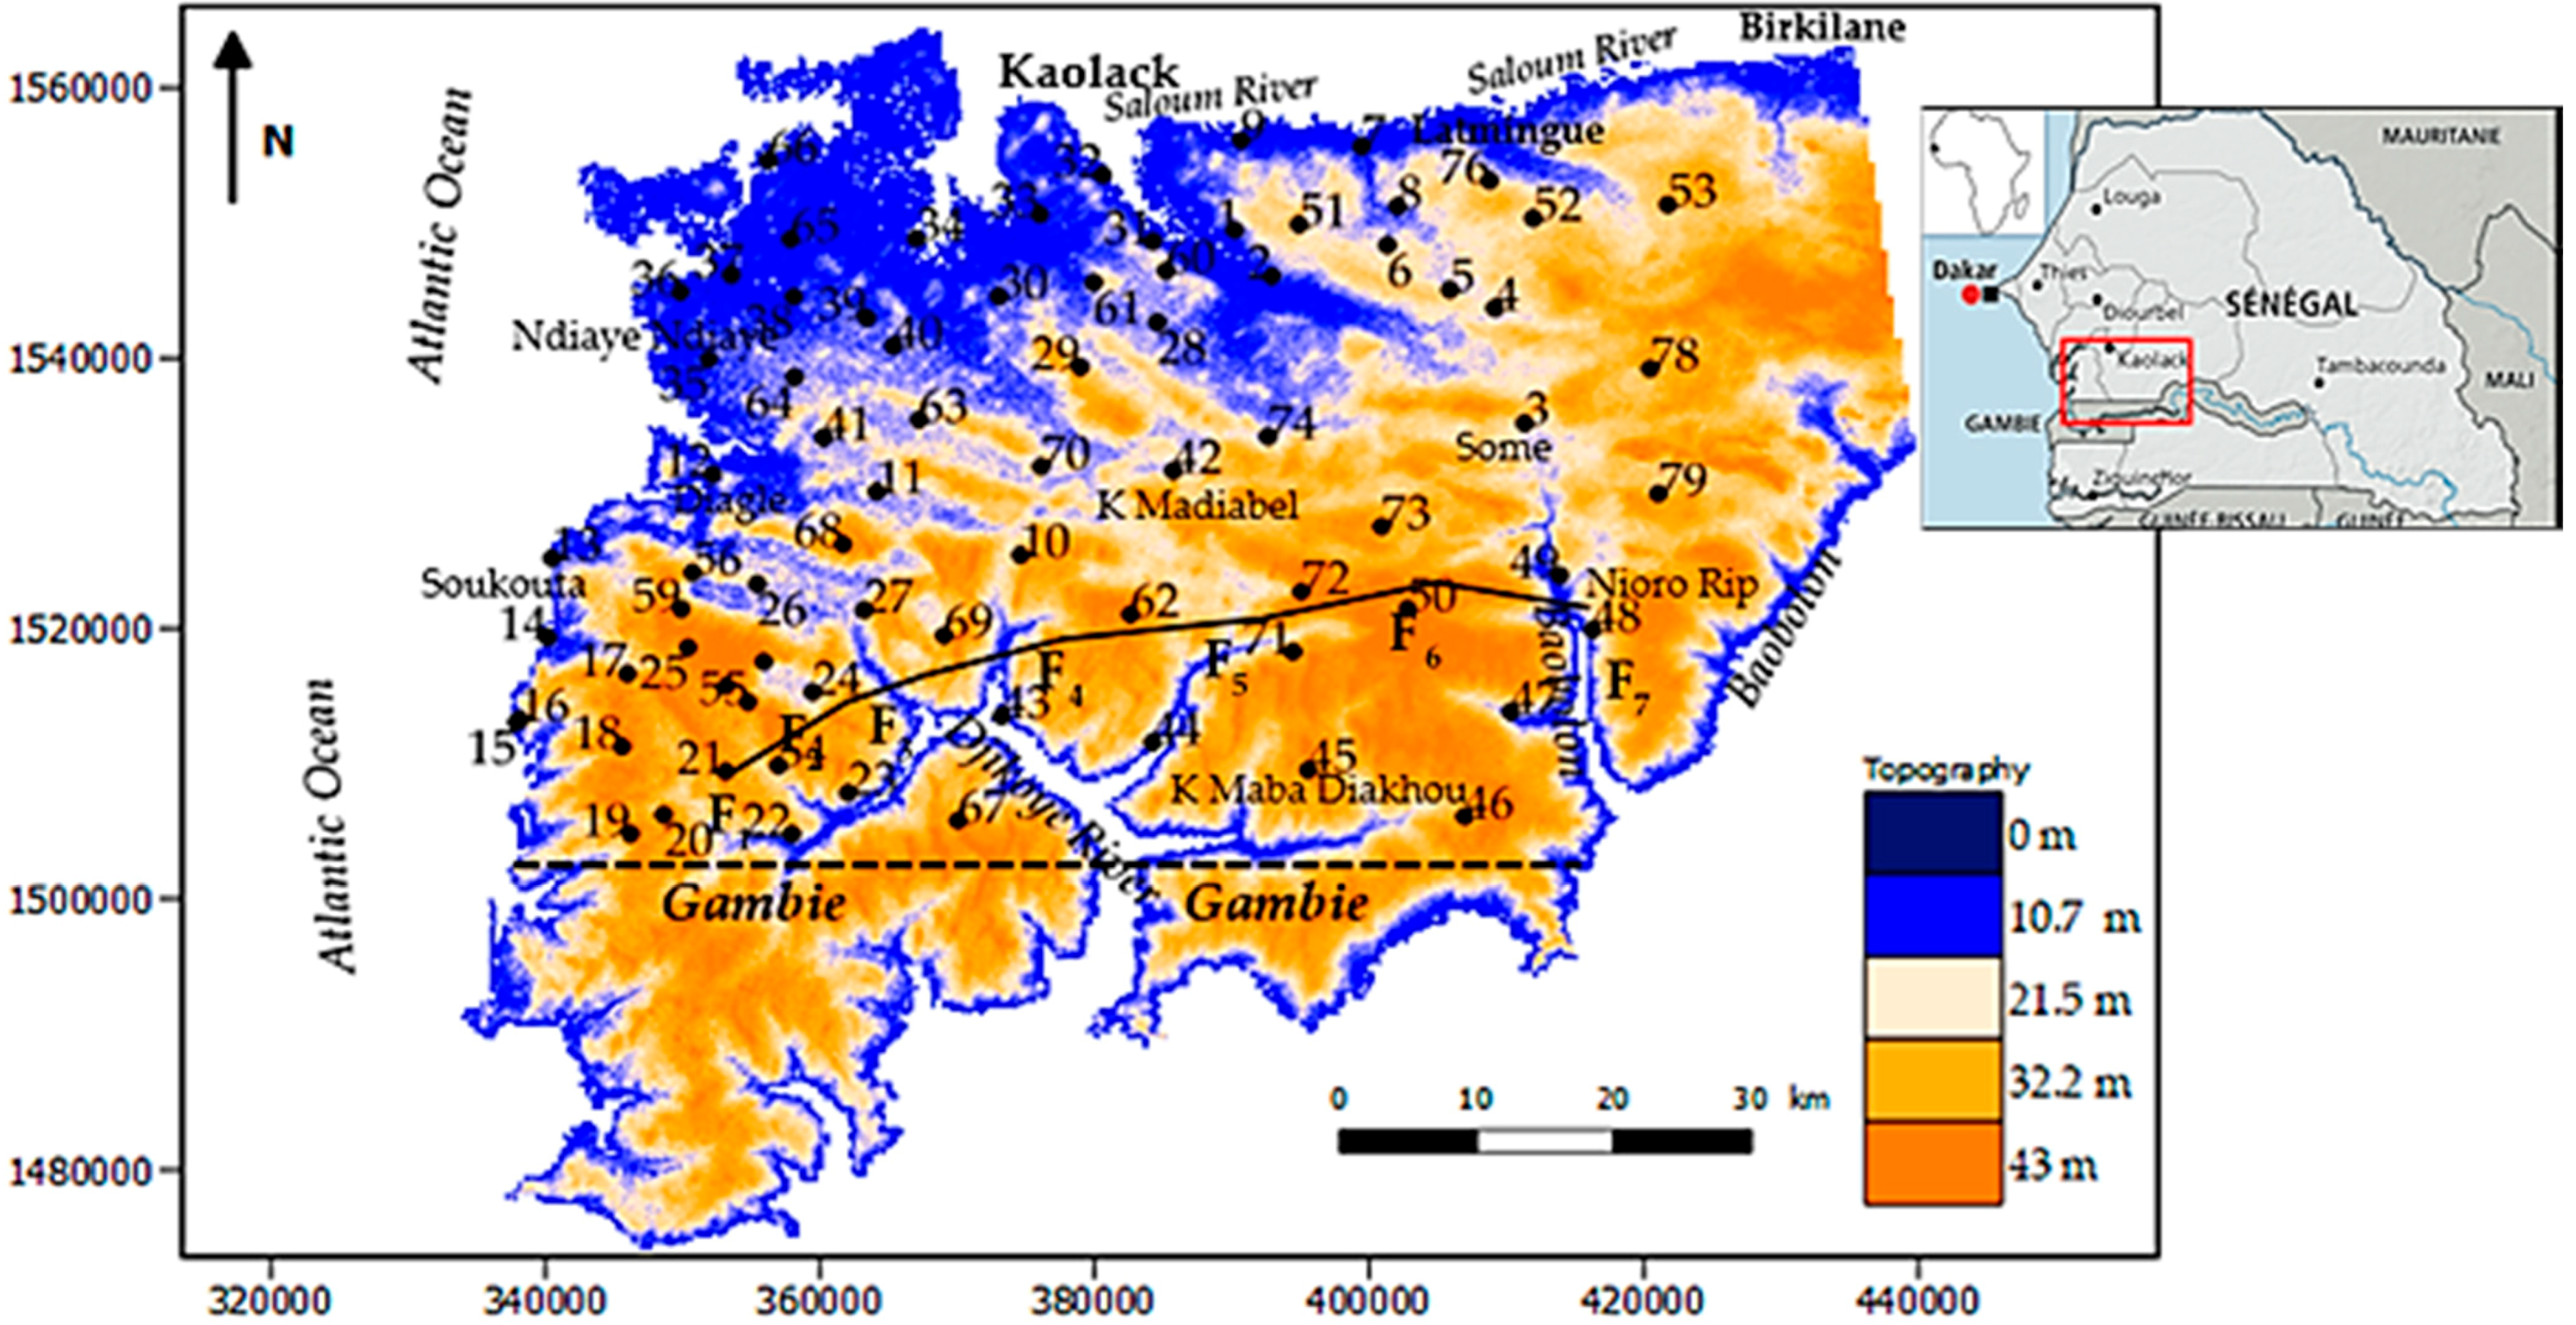
The study area is located in the mid-western part of Senegal (Figure 1) and extends over approximately 5000 km2 from 13°35′ to 14°10′ N, and from 15°40′ to16°30′ W. It is bounded to the west by the Atlantic Ocean, to the north by the Saloum River, to the south by the Gambia frontier and to the east by the meridian passing through Birkilane.
The climate of the region is tropical, characterized by two main seasons, a rainy season from June to October and a dry season from November to May. The annual average precipitation ranges between 600–800 mm and annual temperature ranges from 18 °C in December to 32 °C in May. The average annual potential evapotranspiration varies from 1700 to 2400 mm. Water loss through this intense evaporation is the main cause of the hyper-salinization (from 37% at the river mouth to 90% at Kaolack) of Saloum River and accumulation of halite crusts in the flat-lying alluvial deposits within the drainage basin [14].
Geomorphologically, altitudes range from 0 m in the estuary to 40 m above mean sea level. The plain is gently sloping and extends towards the coast where there are deposits of sand dunes of variable altitudes, from 1 m in the northern part to 2 to 8 m in the southern zone. The hydrologic system of the region is characterized by the River Saloum, its two tributaries, Bandiala and Diomboss, and numerous small streams called “Bolons” locally. Downstream, it forms a large low-lying estuary bearing tidal wetlands, a mangrove ecosystem and vast areas of denuded saline soils called ‘Tannes’ locally. In the southern part of the study area are Djikoye and Baobolon, which are tributaries of the Gambia River.
2.2. Geological and Hydrogeological Settings
The Continental Terminal (CT) formations constitute the aquifer in the area of Saloum. The CT in Saloum is of marine origin with the presence of detrital formation with a strong ferralitic alteration, a neo-formation of kaolinite and significant silica movements [15].
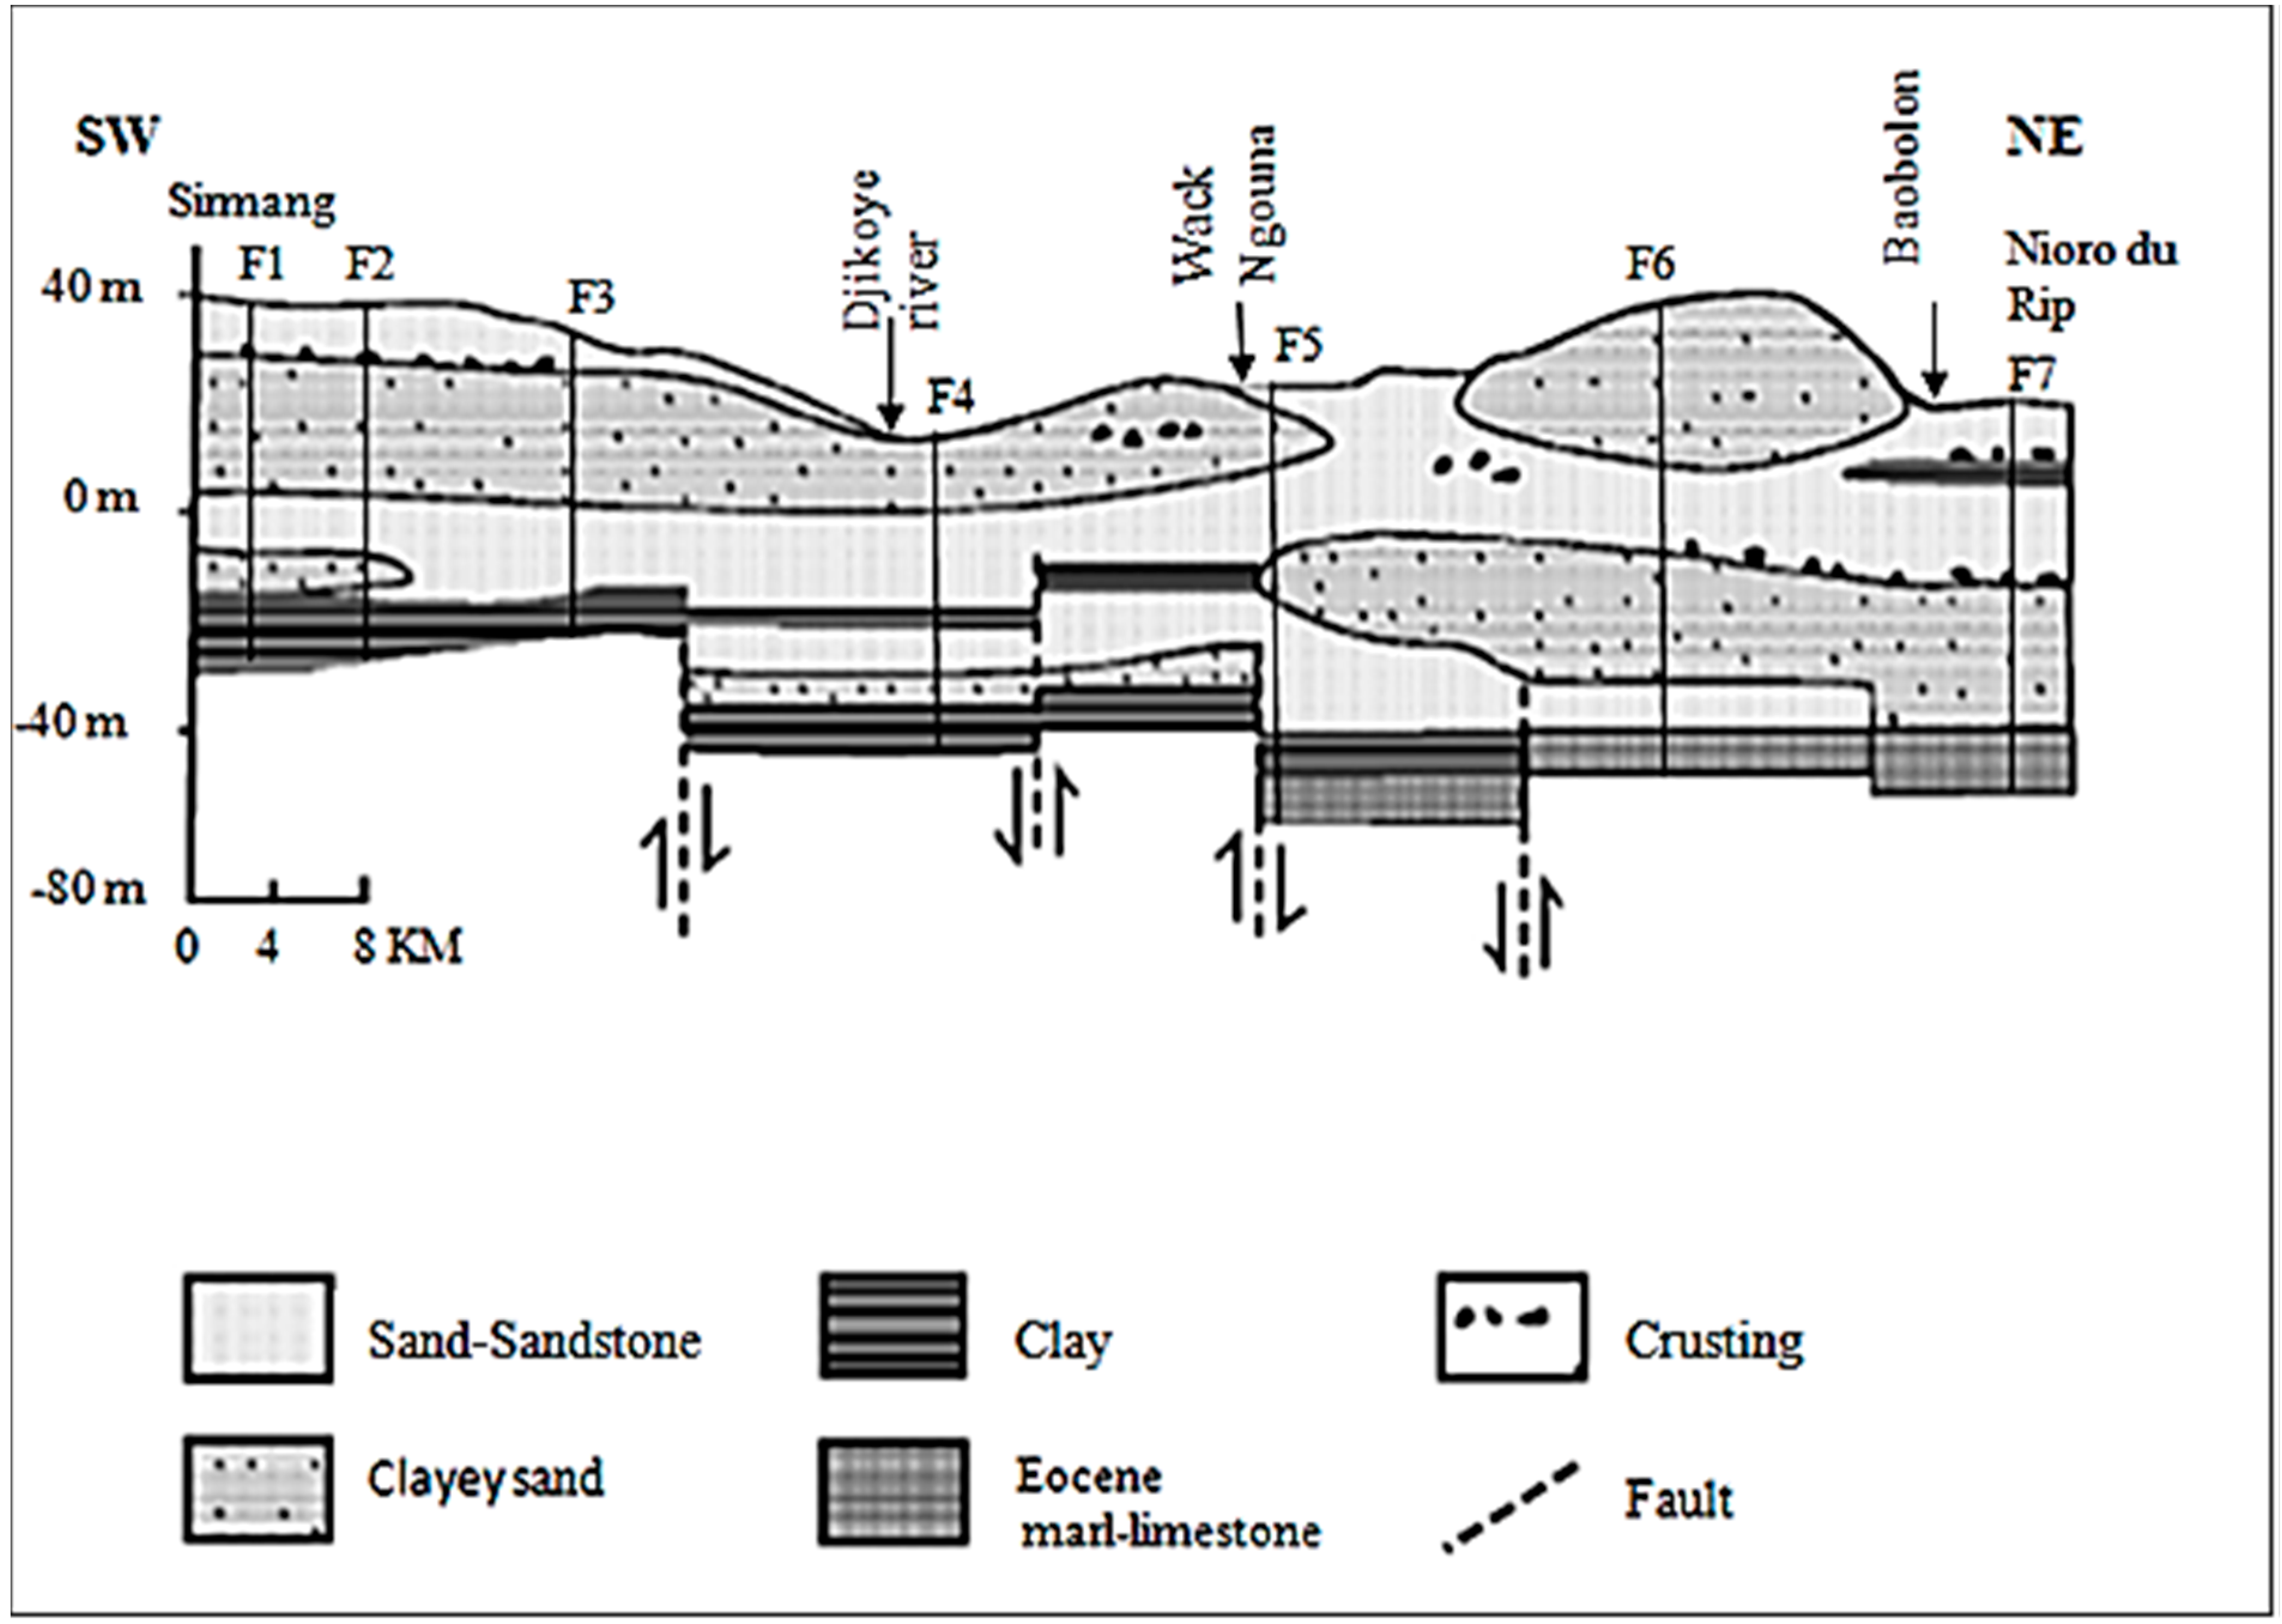
The CT sediments, of detrital sea-origin formations, are laterally and vertically heterogeneous (Figure 2) and consist generally of discontinuous interbedded sandstone, sandy clay, clayey sand, silt and clay [16]. The formations, overlaid with a thin layer of quaternary sand, occur all over the region and contain this unconfined aquifer.
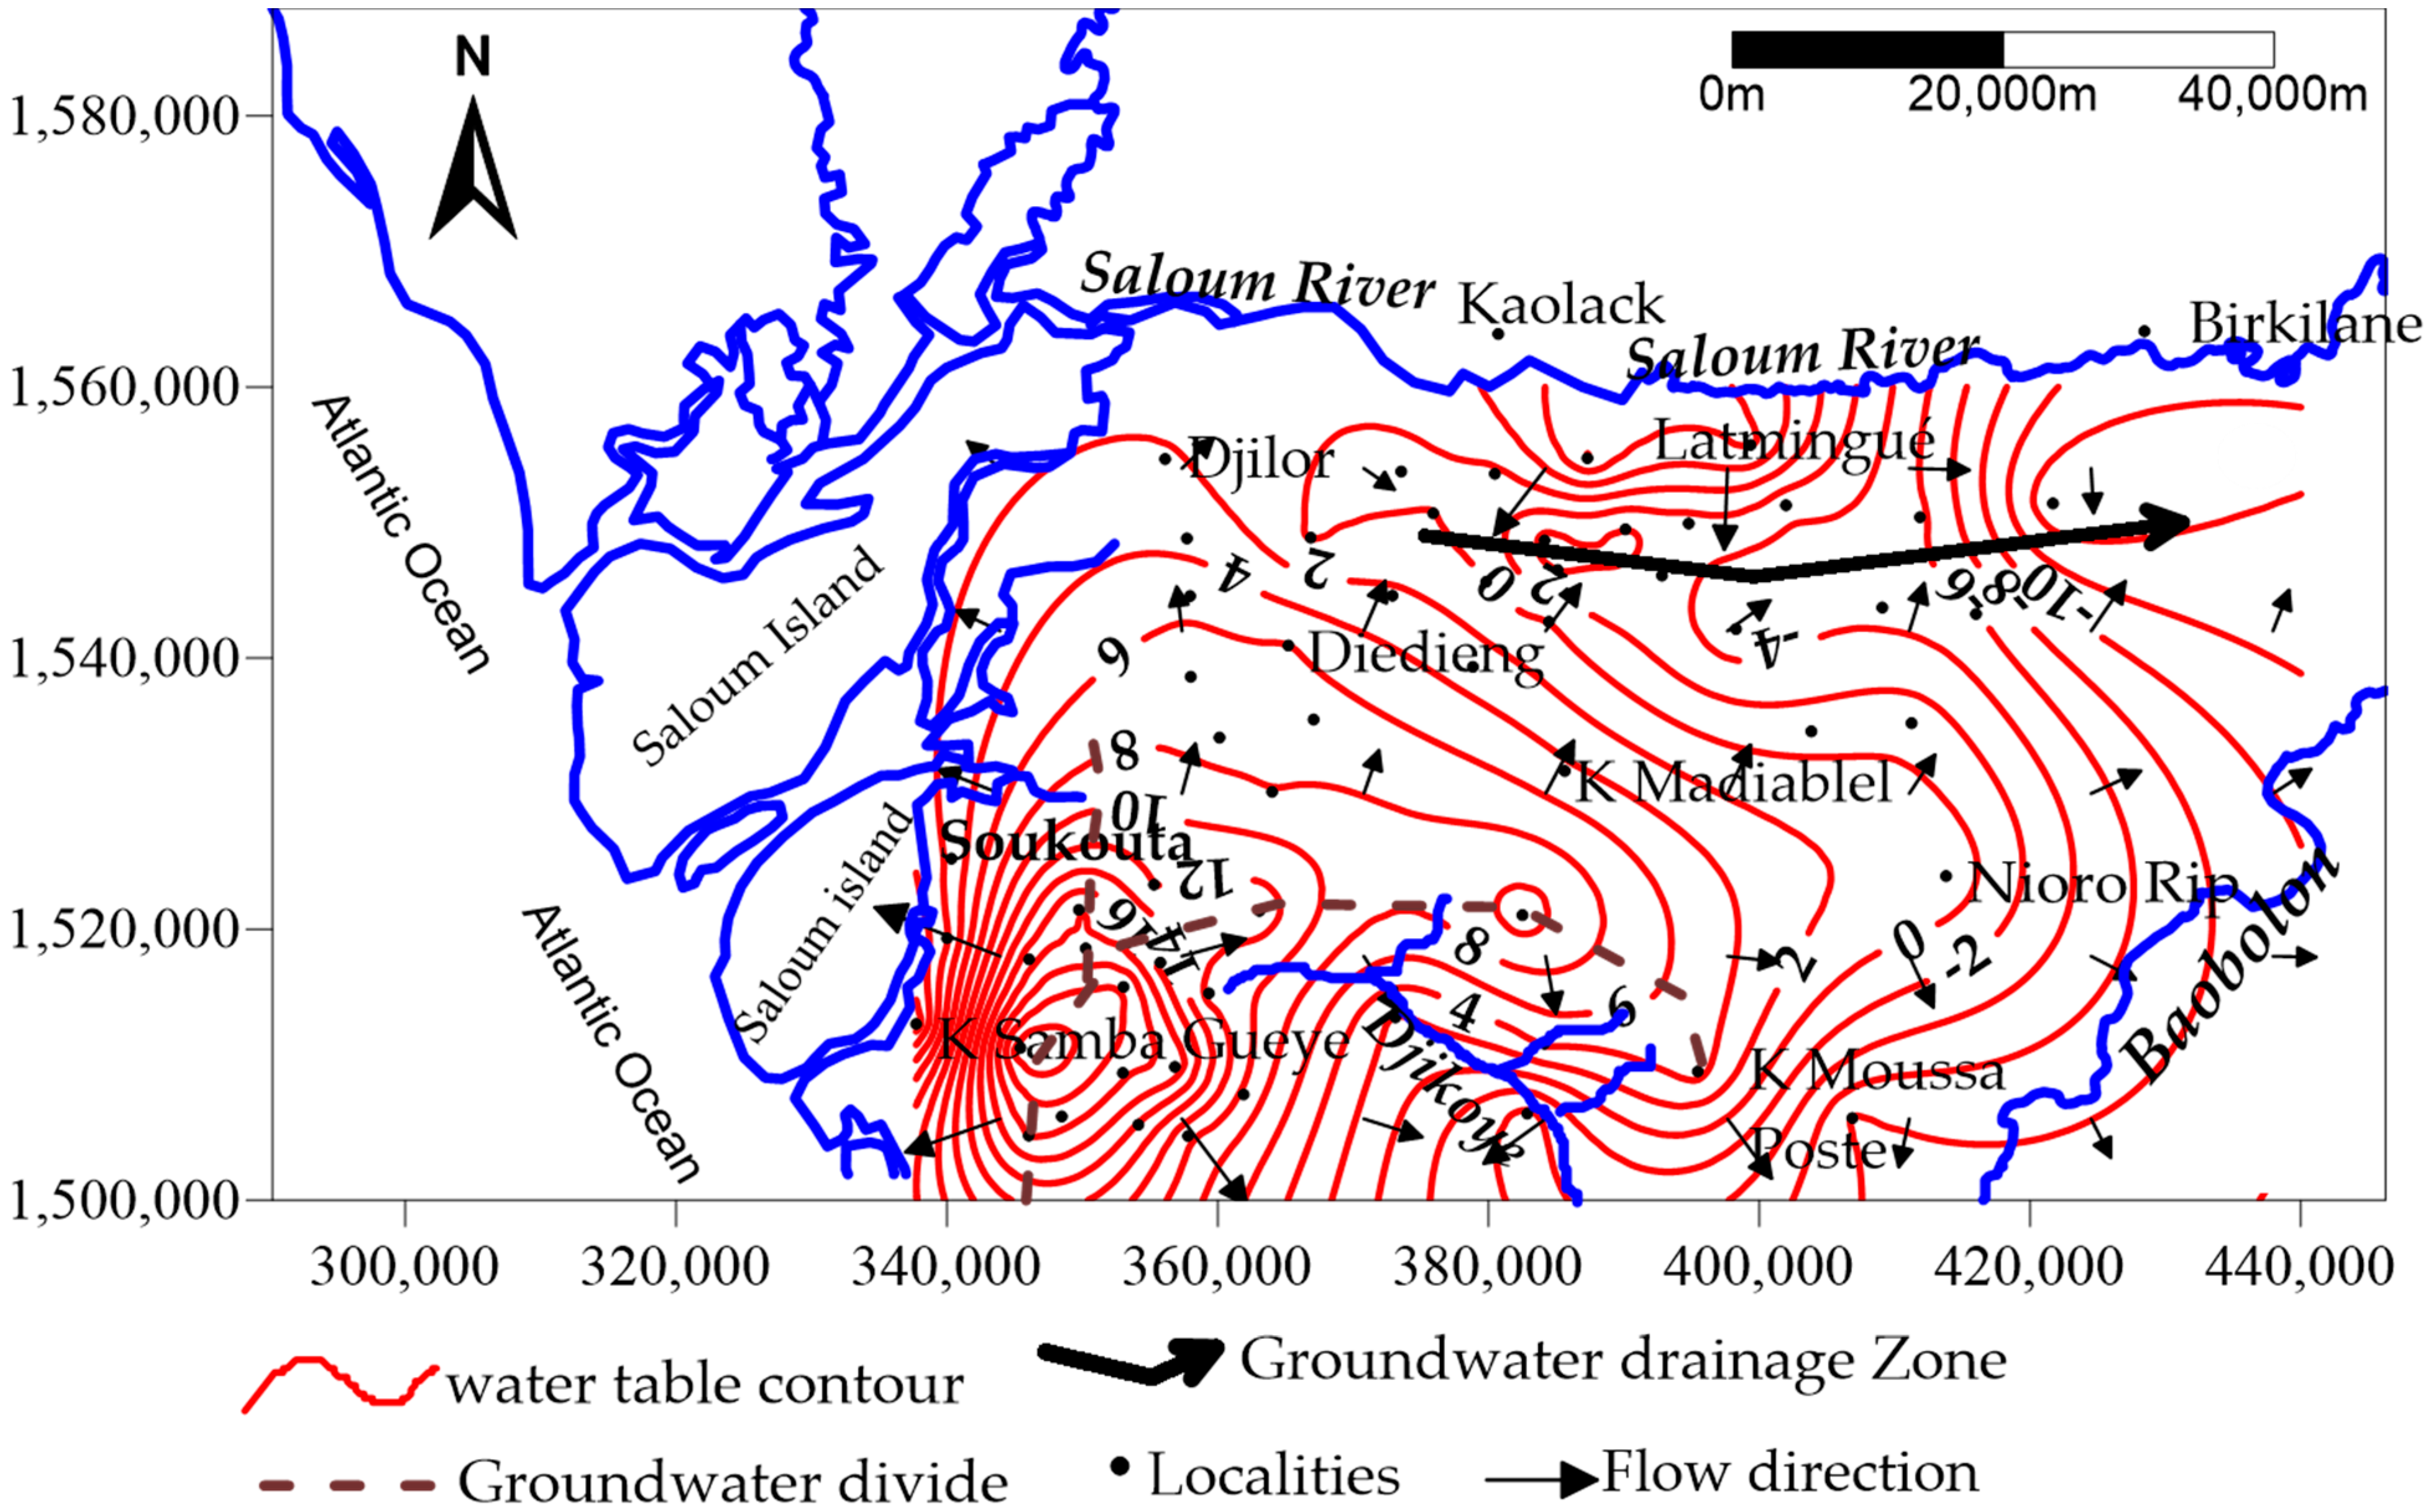
Unconsolidated sediments consist mainly of grains of unsorted fine quartz sand, with a 0.1 mm average diameter. In the east of the region (Nioro), quartz grains are coated by micritic (10–20 µm) calcite, which at depth develops to sparitic size (100 µm) [17] with trace quantity of glauconite and feldspar. Goethite and kaolinite are the two cements encountered respectively in ferruginous sandstones and sediments of sand and non-ferruginous sandstones. The most dominant clay mineral is kaolinite but there are also traces of illite, smectites and chlorite [17] within the study area, the thickness of the CT aquifer ranges from about 10 m to the north-west to 80–100 m eastward where buried palaeochannels have been identified by geophysical investigations [16]. The Eocene impervious marl, limestone and clay constitute the basement of the CT aquifer, with an elevation varying between −20 and −100 m [16]. The piezometric map (Figure 3) is illustrated based on head data of the field campaign in 2012. It is characterized by two main zones, a piezometric dome (hydraulic head > 20 m) located in the South West and a groundwater drainage zone with head below mean sea level (down to −12 m) in the North-East. This second zone collects part of the flow derived from the groundwater mound and flow from the Saloum River. In the southern part of the system, groundwater flow is divergent and discharges respectively to the Bandiala branch and to the Djikoye River. The hydraulic gradient is variable with mean values of 0.11% to South West. The gradient is very low towards the piezometric depression and varies between 0.02% and 0.05%. Transmissivity of the aquifer ranges between 3 × 10⁻⁴ and 3.5 × 10⁻² m2/s. The horizontal hydraulic conductivity of the aquifer (K) spans 3 orders of magnitude (1.7 × 10⁻⁵ to 2.2 × 10⁻³ m/s), which shows a rather marked heterogeneity in the aquifer. The depth of the water table from the soil surface varies between 3 m to the west and 40 m to the east. Recharge was estimated using a chloride mass balance method in the unsaturated zone, and an average value of 17 mm/year represents the region as a whole [5,18]. Rainfall infiltration is the principal contribution for groundwater recharge.
2.3. Sample Collection and Analysis
Groundwater samples were collected from 79 boreholes and open wells used for rural water supply using standard sampling procedures during May 2012 (dry season). Electrical Conductivity (EC), pH and total dissolved solid (TDS) were measured in situ. These parameters were measured using portable electrodes (HACH™, Loveland, CO, USA). The rest of the parameters were determined at the HydrASA Laboratory of the University of Poitiers (Midwest France). Total concentrations of major cations (Na+, Ca2+, Mg2+, K+) were determined using flame atomic absorption spectrometry (VARIAN AA240FS spectrometer, Agilent Technologies France, 91978 Les Ulis Cedex, France). Concentrations of anions (Cl−, NO3− and SO42−) were determined by ionic chromatography (ICS1000 DIONEX, ThermoFisher Scientific France, 33700 Bordeaux, France), and concentration of CO32− and HCO3− were determined using the titrimetric method. Before analyses, samples were filtered on nitrocellulosic Millipore filters of 0.45 µm of porosity, to eliminate all fine particles in suspension and only collect solutions containing dissolved elements. The quality of the chemical data was assessed by checking ion balances. Only analyses of samples (66) which ion balance error is less than 10% are used in this study.
Evaluation of the groundwater data is carried out by statistical methods. Geochemical methods are used to establish the processes controlling the groundwater hydrochemistry. The geochemical results are plotted on Piper trilinear plot using DIAGRAMMES 6.5 software [19], and on Gibbs diagram [20] to assess the quality-controlling mechanism and dominant hydro-geochemical facies of the study area. The Chloro-Alkaline Indices CAI [21] are calculated to quantify the process of Base Exchange reaction. The evolution of geochemical processes in groundwater depends on the equilibrium between mineral phases and water and is commonly discussed by saturation indices [22,23]. The Saturation Indice (SI) is evaluated to interpret groundwater hydrochemistry, using software PHREEQC [24,25].
Groundwater quality for drinking purposes is interpreted by considering the World Health Organization [26,27] standards. The quality parameters like salinity (EC), toxicity due to chloride and sodium (SAR), and parameters causing miscellaneous problems to soil-water-plant relationships (sulfate, RSC) [28] are determined to assess the irrigation suitability of the groundwater. The Wilcox diagram and the US Salinity Laboratory diagram [29,30] are also used for processing of data.
3. Results and Discussion
3.1. General Groundwater Chemistry
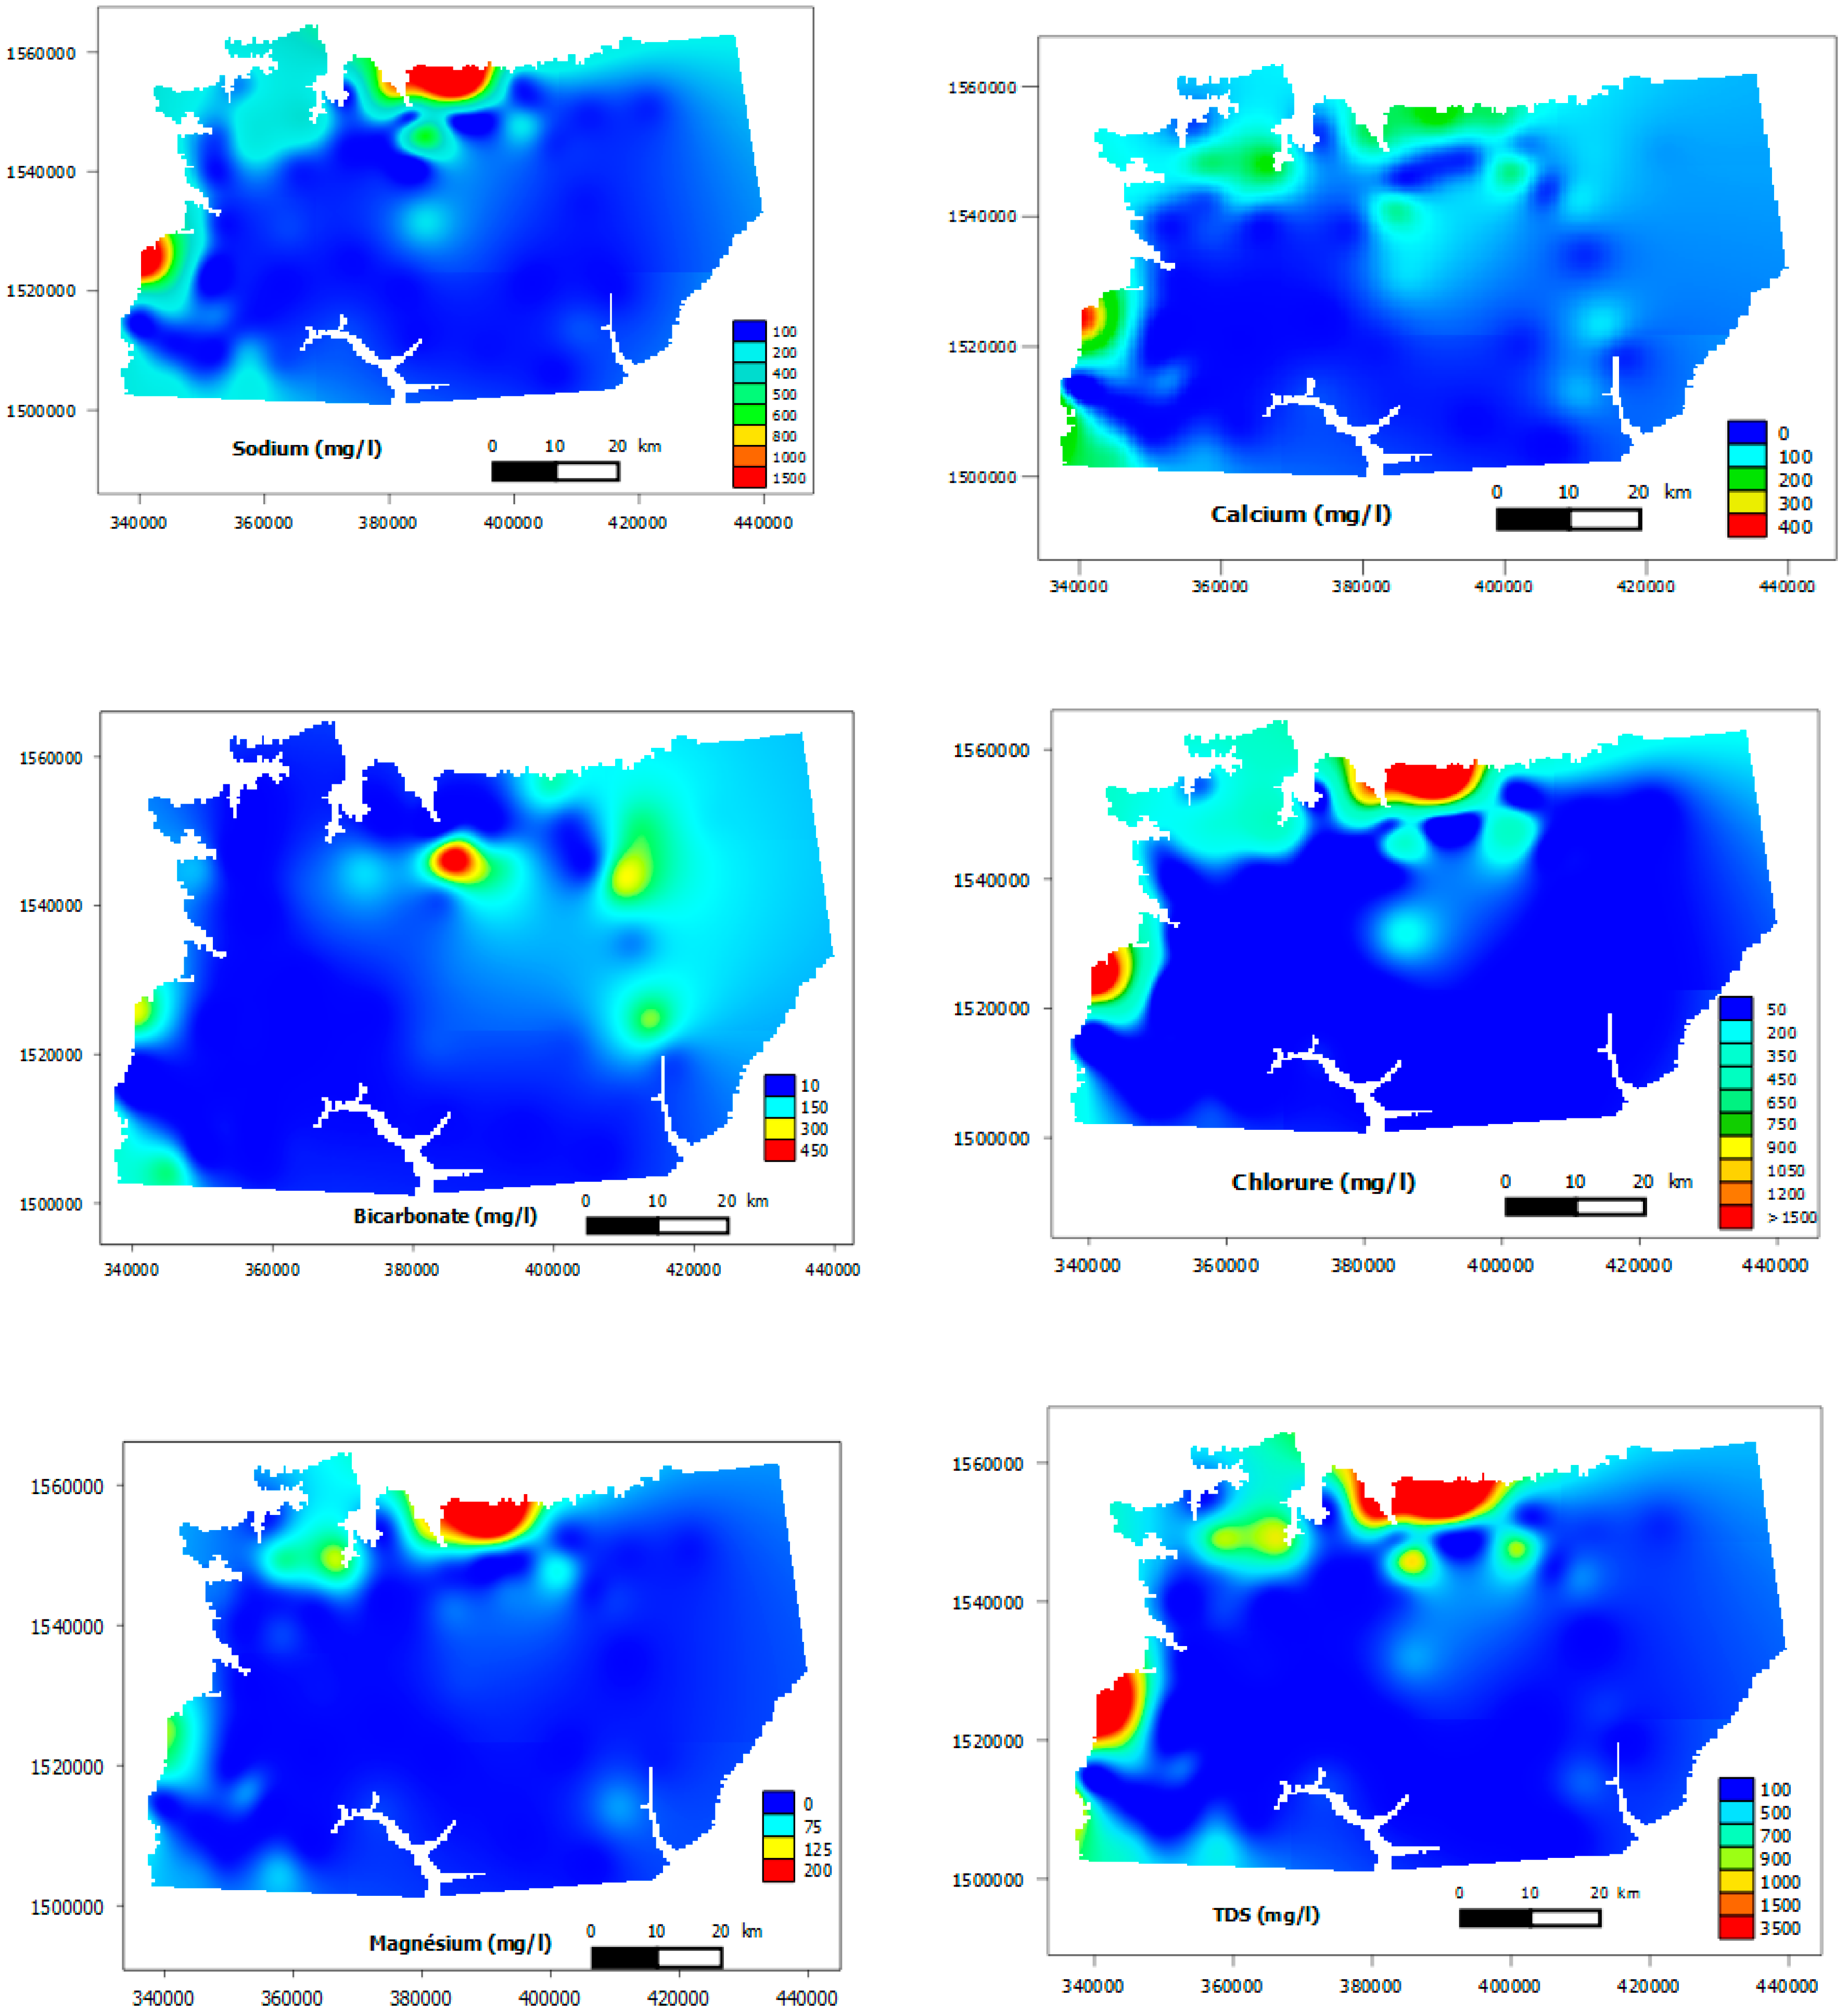
Analytical results of groundwater samples are presented in Table 1. Physical and chemical parameters including statistical measures, such as minimum, maximum, average, median and standard deviation are reported in Table 2. pH values range from 3.8 to 8.3, with an average of 6.9 indicating acidic (12% of samples) to slightly alkaline waters. Electrical conductivity (EC) varies considerably from 38.7 to 7160.0 µScm−1 with an average 763.1 µScm−1. Total Dissolved Solids (TDS) ranges from 20.6 to 3900.0 mg/L. A large majority (95%) of all groundwater samples can be classified as fresh (TDS < 1000 mg/L) and 5% as brackish (TDS > 1000 mg/L) [31]. Higher values of TDS are generally noticed in the western coastal areas and near the Saloum River.
The spatial distribution map of the TDS, chloride, sodium, magnesium and calcium concentrations are very similar which demonstrates the origin of salinity (Figure 4). The abundance of cations in the groundwater is in the following order: Na+≥ Ca2+ ≥ Mg2+ > K+. The concentrations of cations in the groundwater ranges between 4.5–1726.0, 0.0–428.0, 0.0–228.0 and 0.0–128.0 mg/L for Na+, Ca2+, Mg2+, and K+, respectively. Chloride is the dominant anion, followed by bicarbonate and sulfate. The concentrations of the following anions Cl−, SO42− and HCO3− ranges between respectively 3.0–2886.0, 0.0–545.0 and 1.53–473.0 mg/L. Nitrate concentration in the study area varies in the range of 0.0–342.0 mg/L, and all samples fall below the desirable limits, except few samples. The main source of nitrate in the groundwater is attributed to anthropogenic local pollution. Drinking water with a high nitrate content can cause some diseases for children [32,33].
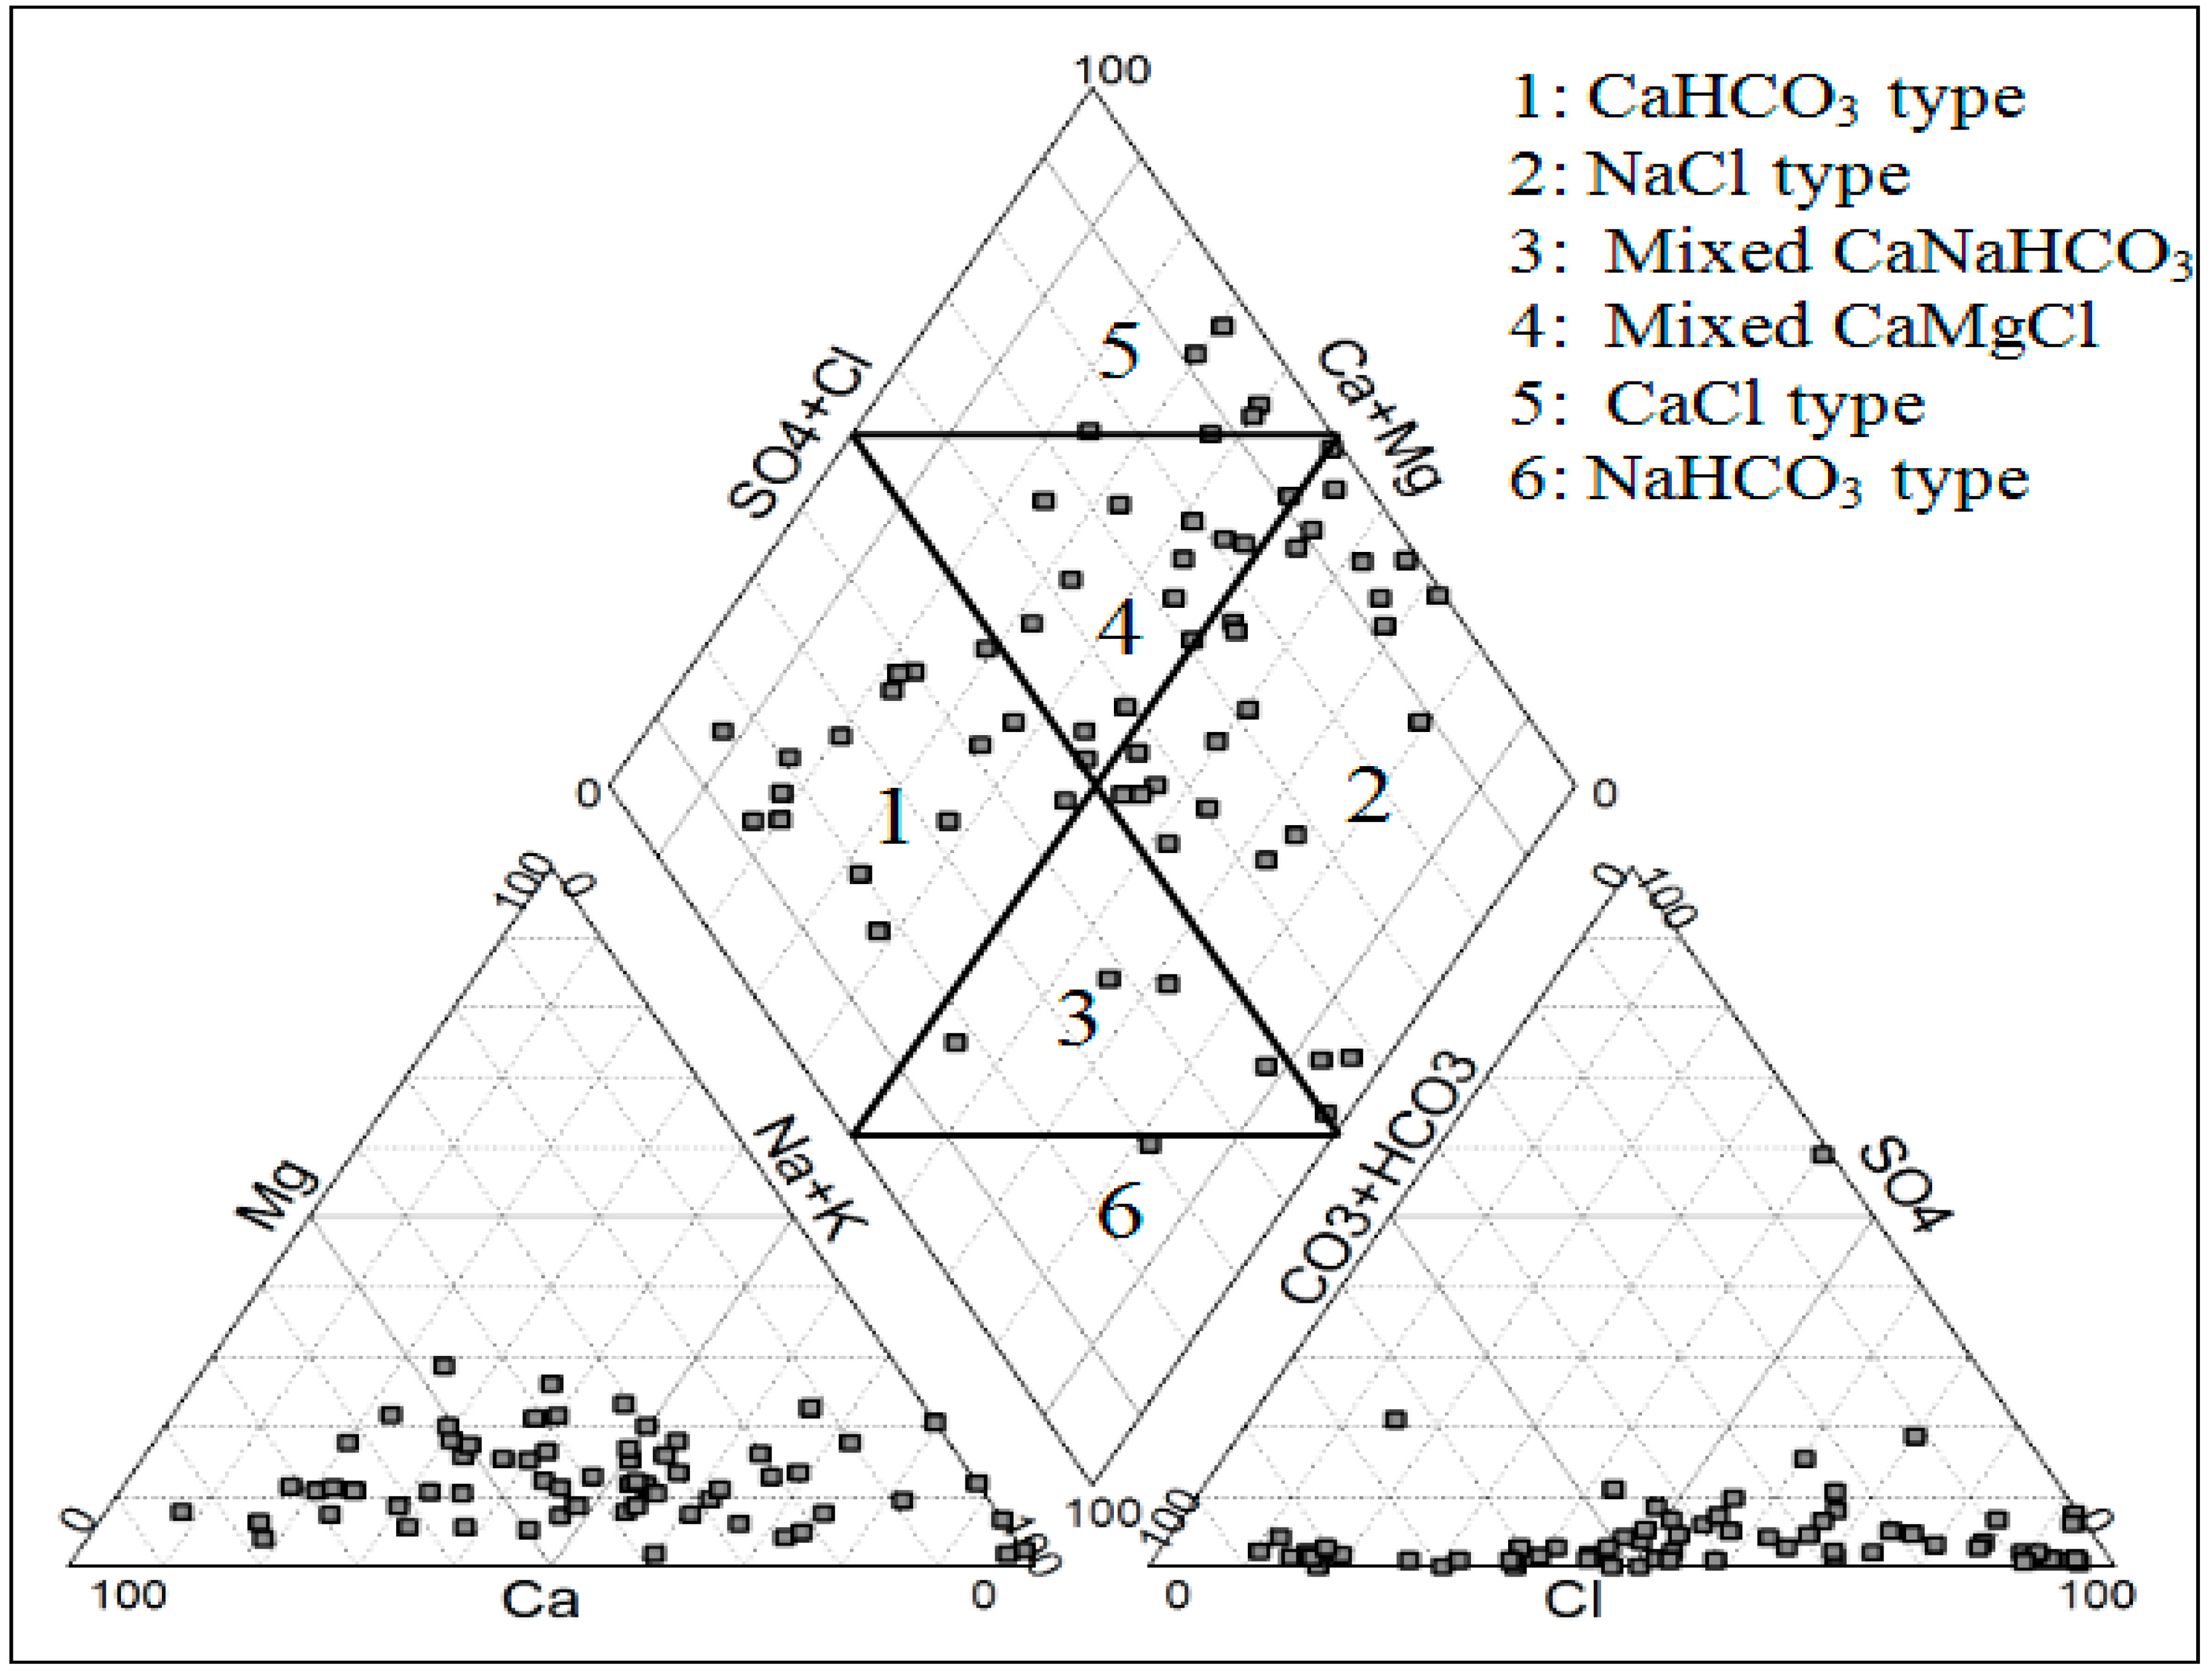
Concentrations of the main cations and anions are plotted on Piper diagram [34] for the analysis of the geochemical evolution of groundwater. Piper diagram has been widely used to study the similarities and differences in the composition of waters and to classify them into certain chemical types. Typical classification of hydrochemical facies for groundwater is shown in Figure 5. Two major facies types are dominant: the calcium bicarbonate (Ca-HCO3) water type and the sodium chloride (Na-Cl) water type. Some samples also represent mixed Ca-Mg-Cl, Ca-Na-HCO3 types and other samples demonstrate Ca-Cl types. It is suggested that the chemistry of the groundwater was controlled by a mixing process and cation exchange process as discussed below.
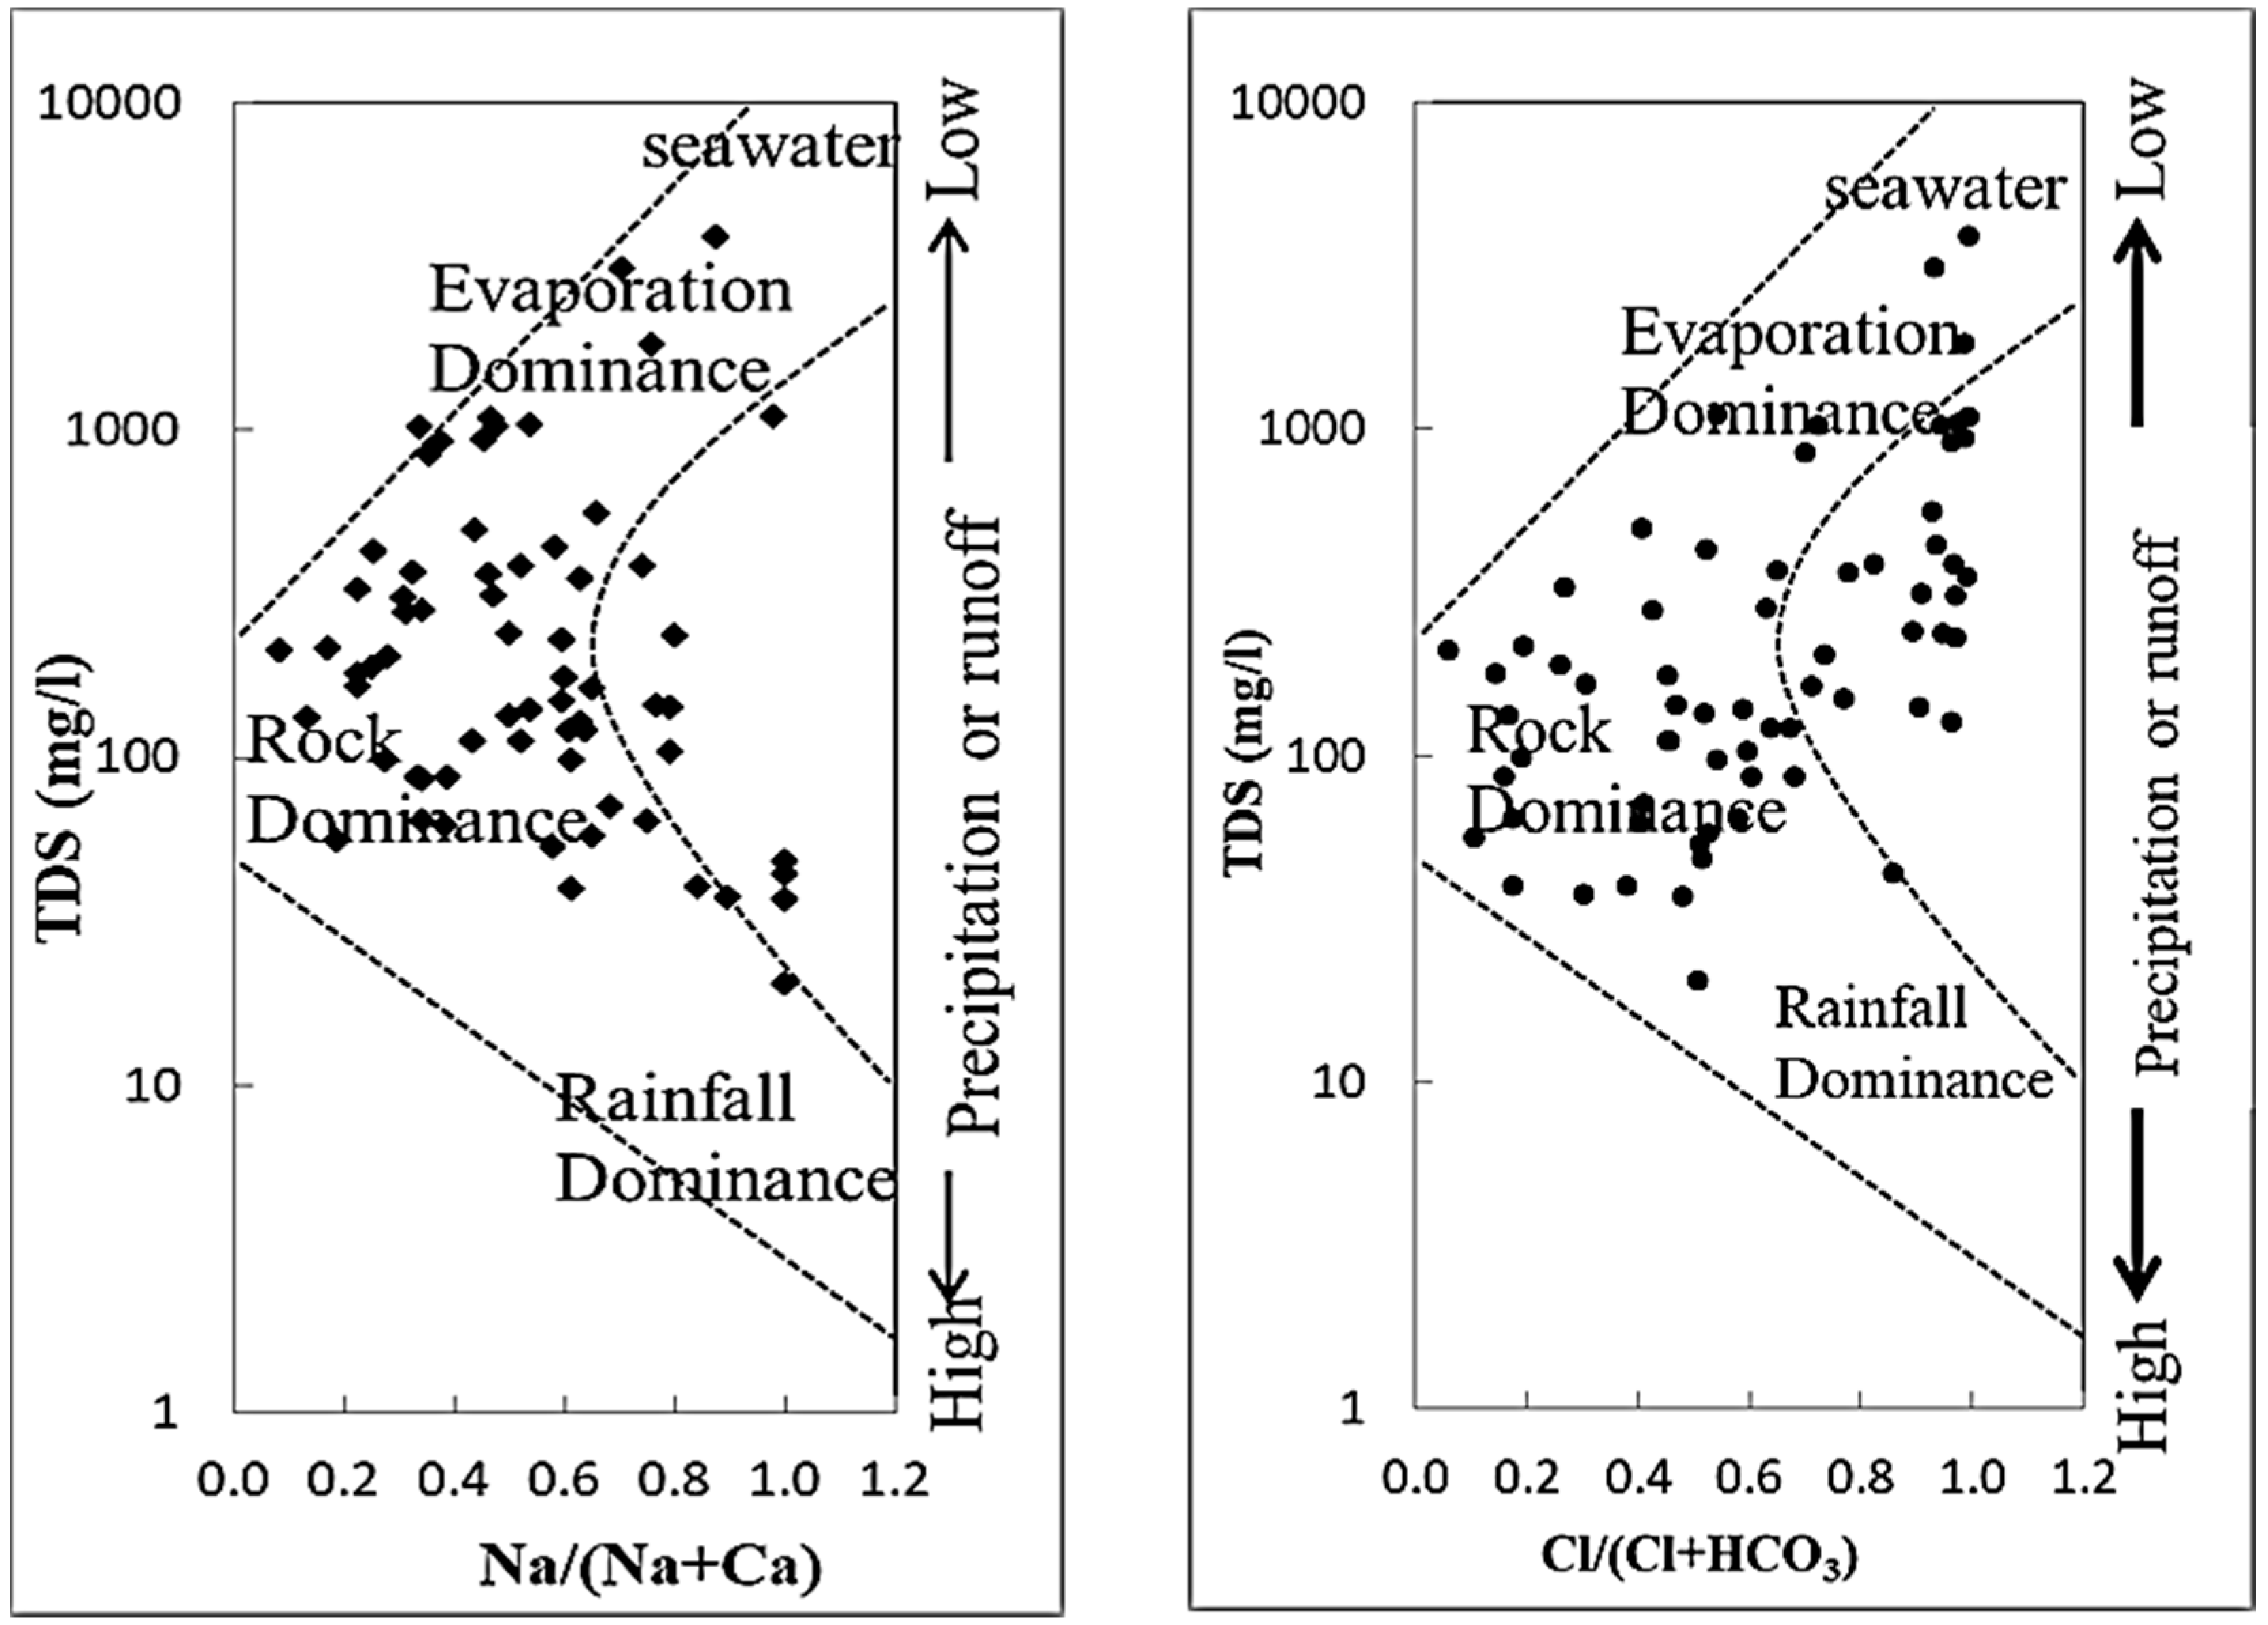
In addition to the Piper diagram, Gibbs plots are also used to gain better insight into hydrochemical processes such as precipitation, rock water interaction and evaporation on groundwater chemistry in the study area. Gibbs [20,35] demonstrated that if TDS is plotted against Na/(Na + Ca) and Cl/(Cl + HCO3), this would provide information on the mechanism controlling the chemistry of waters.
As shown in Figure 6, most of groundwater samples are located in the rock dominance section and few samples in the evaporation zone. The chemistry of groundwater is controlled mainly by water-rock interaction. Gibbs diagram indicates that groundwater samples tend to move from rock dominance sector as a result of sodium and chloride dissolution with increasing TDS to the evaporation sector as a result of sea water intrusion. In the Saloum region, the increase in salinity may be related to the high evaporation recorded between March and June. Leaching of salt concentrations accumulated during the dry months may be responsible for the significant increase in Na+ and Cl− content.
The Chloro-Alkaline Indices (CAI) are widely used to assess the ions exchange reactions between groundwater and its host rock [36,37,38,39,40,41,42] suggested two Chloro-Alkaline Indices CAI 1, 2 for the interpretation of ion exchange between groundwater and host environment. Equations (1) and (2) express the Chloro-Alkaline Indices (CAI). The concentrations are in meq/L:
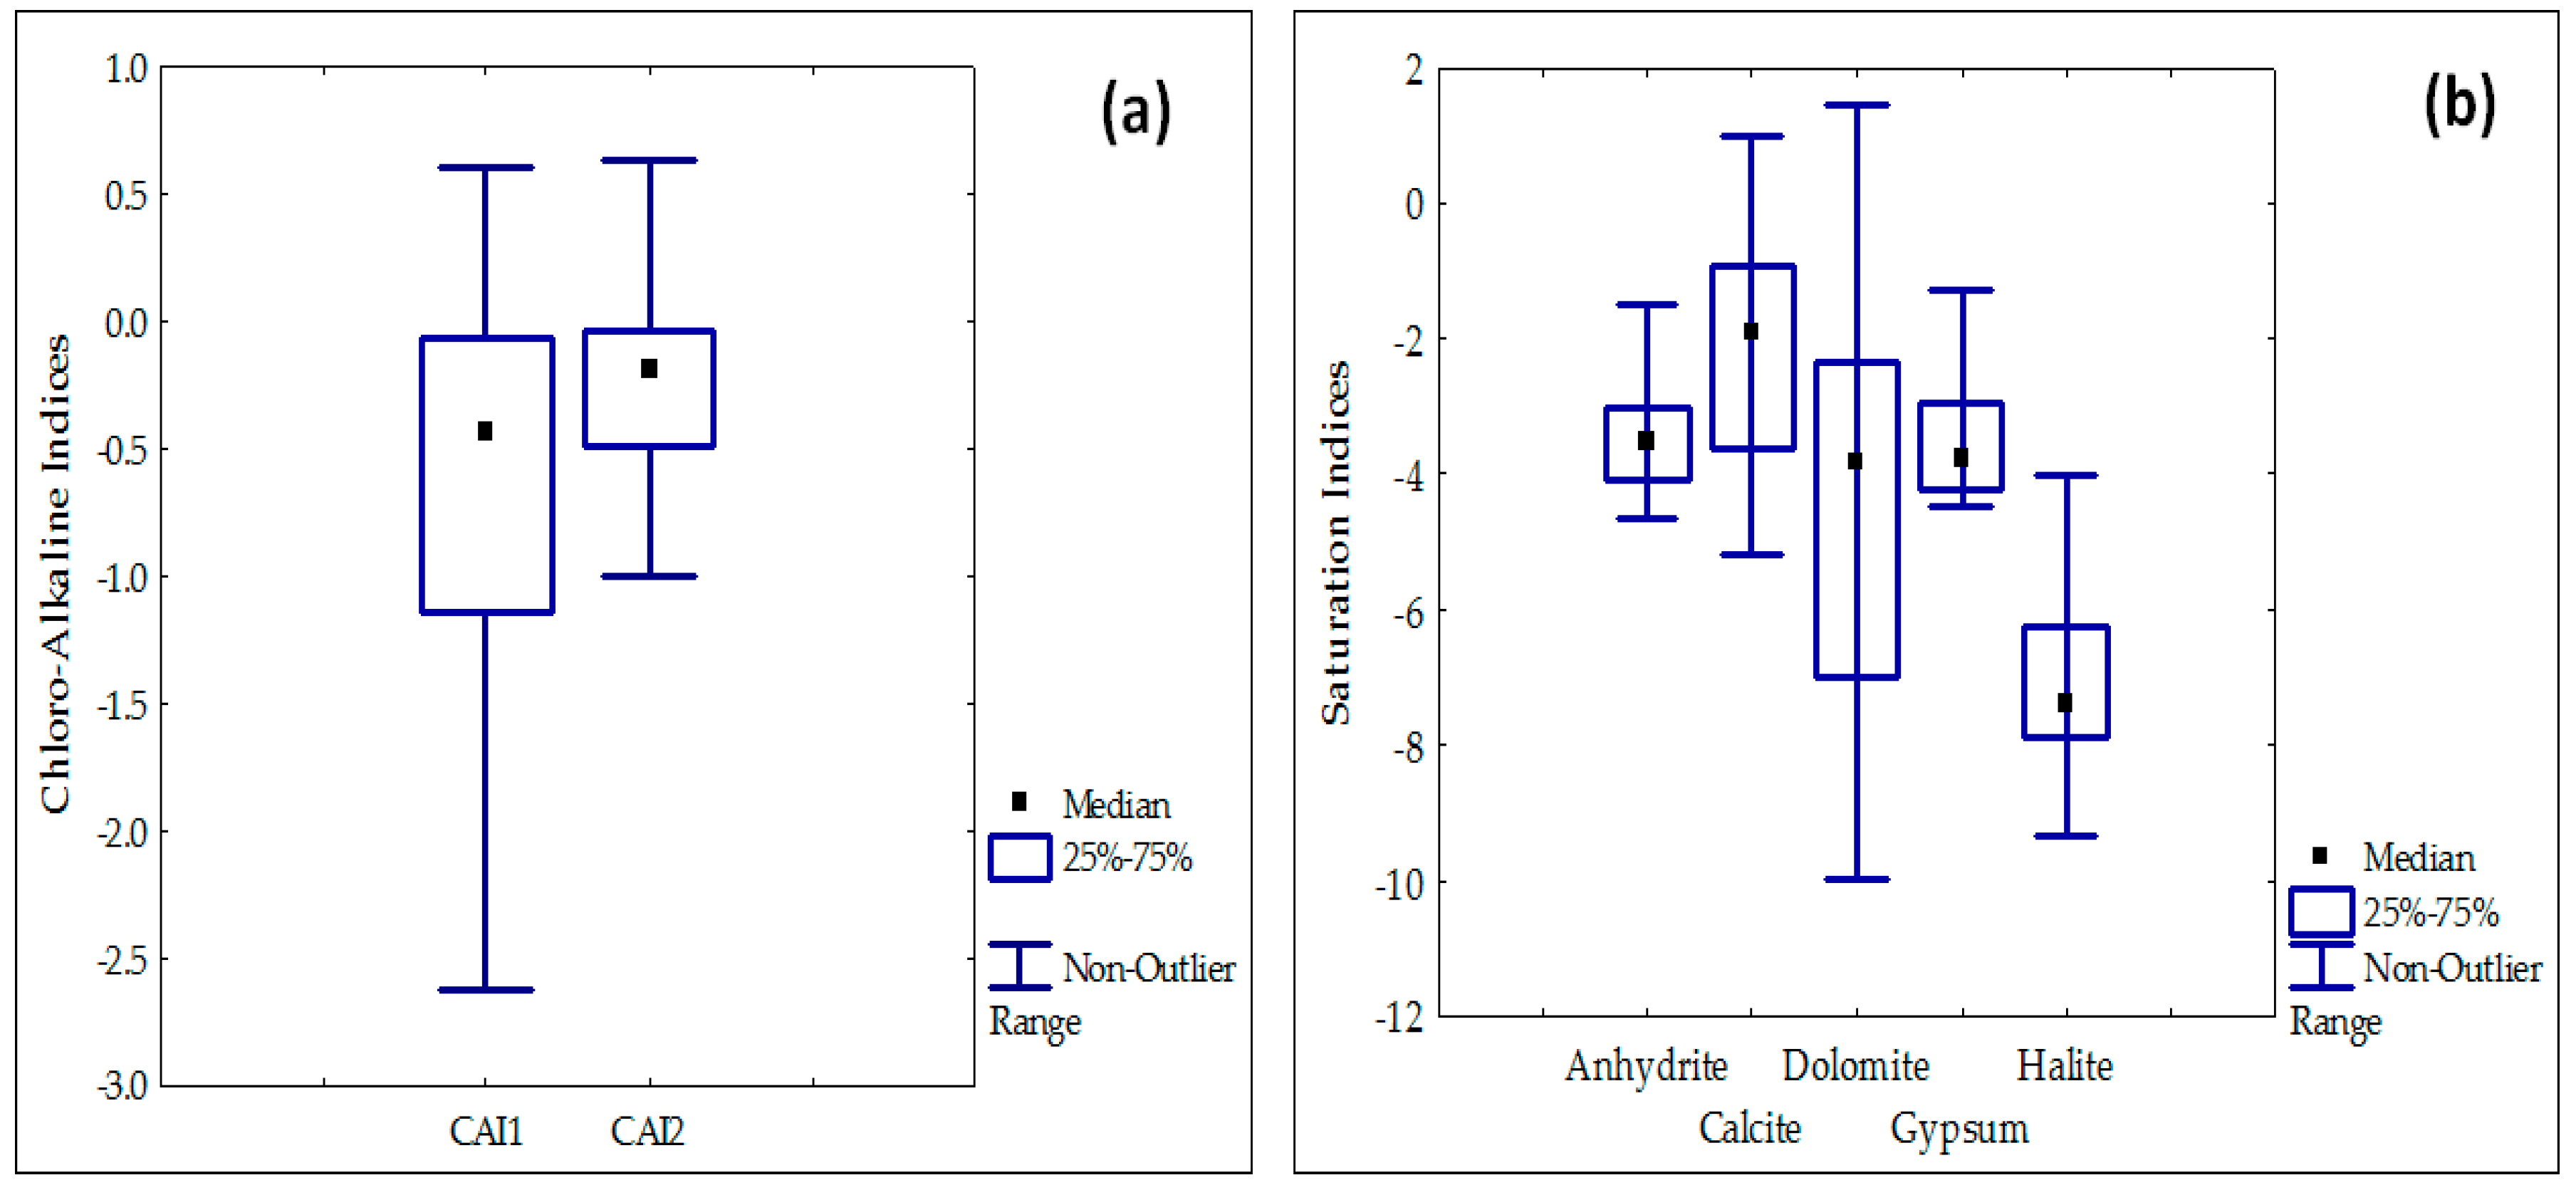
Positive Chloro-Alkaline Indices indicate exchange of Na+ and K+ from the water with Mg2+ and Ca2+ of the rocks (base-exchange reaction). The CAI is negative when there is an exchange of Mg2+ and Ca2+ of the water with Na+ and K+ of the rocks. Most samples of the aquifer have negative indices (Figure 7a), indicating the substitution of calcium and magnesium in groundwater with sodium and potassium in the underground environment.
3.2. Binary Diagram and Geochemical Process
In this study, correlation analyses between various parameters of the groundwater have been calculated and are presented in Table 3. Correlation coefficient (R) is a commonly used measure to establish the relationship between two variables [43,44]. EC and TDS show a good positive correlation with Mg2+, Ca2+, Na+ and Cl− (R > 0.82). A high positive correlation is found between Na+-Cl− (0.99), Mg2+-Cl− (0.90), Ca2+-Cl− (0.78) Ca2+-Na+ (0.72), and shows that for most of the groundwater samples these parameters originate from a common source.
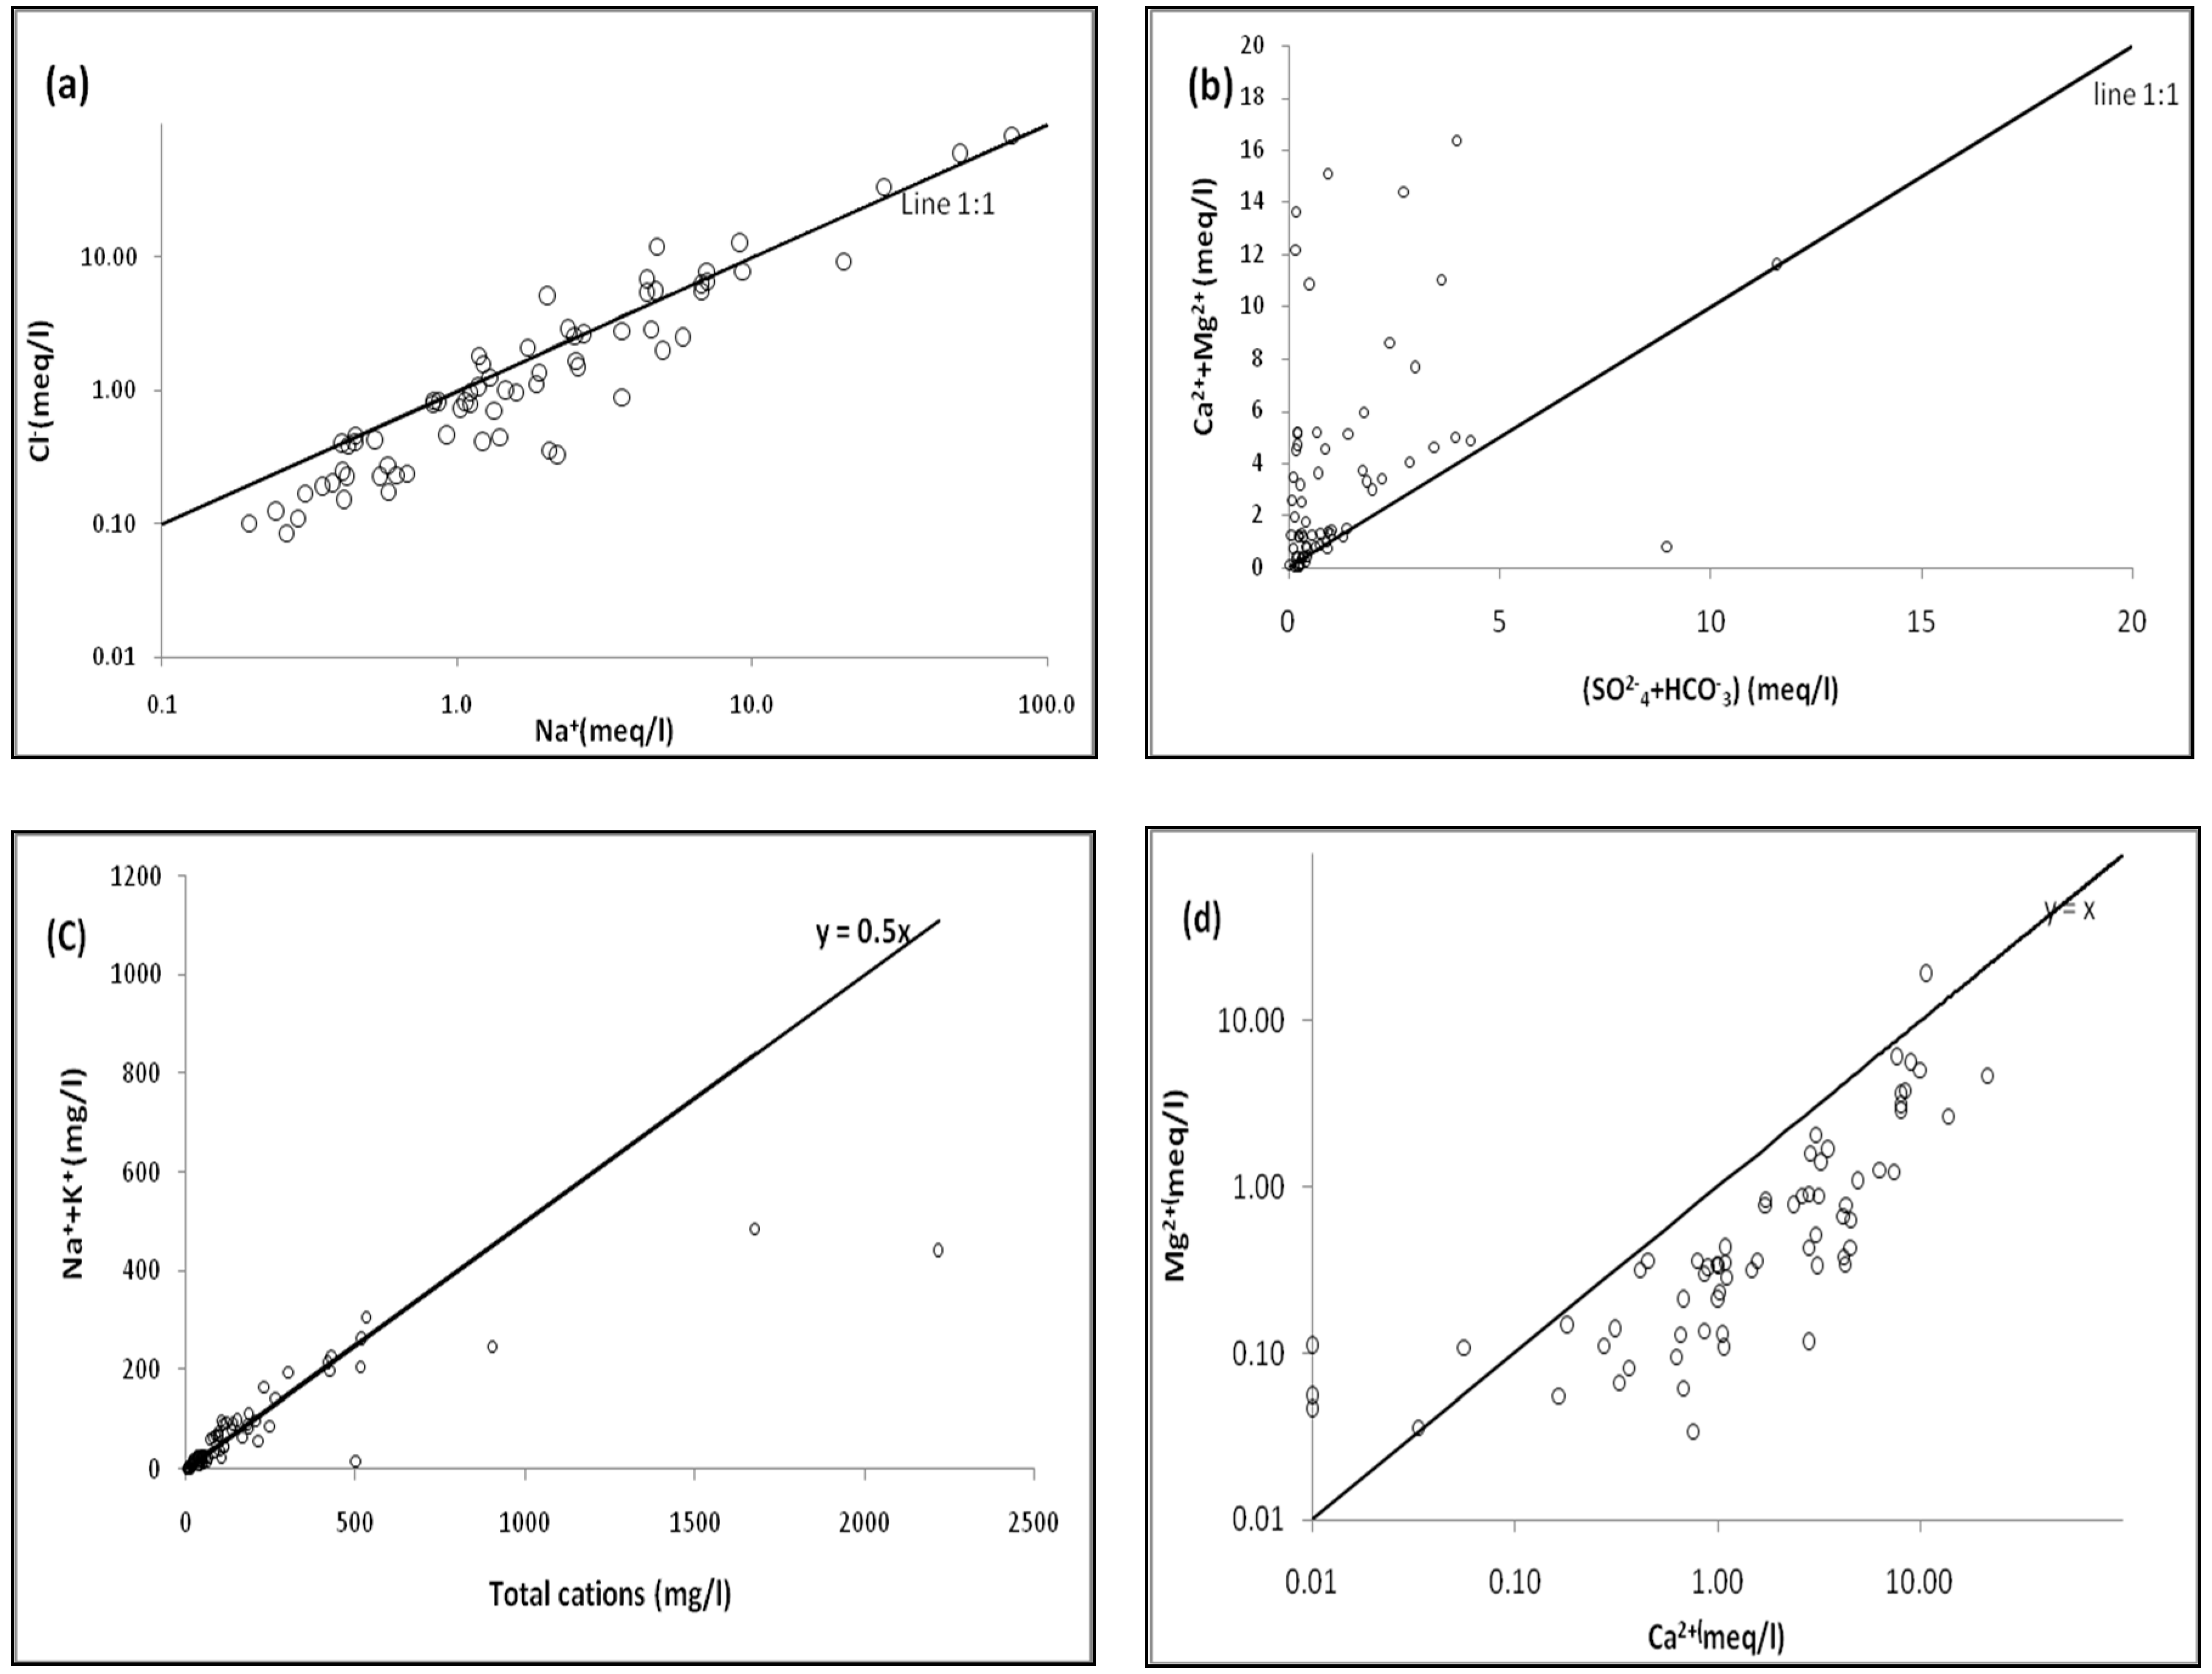
The analysis of the different hydrochemical processes responsible for the composition of the groundwater relies on the different relationships between the dissolved species and also on their content [45,46,47]. The relationships between concentrations of the major dissolved elements are shown in Figure 8. The plot Cl− vs. Na+ has been used to identify the sources of salinity in groundwater environment. Figure 8a shows the value of Cl− as a function of Na+ in the groundwater samples and there is a strong correlation (R = 0.99) between them.
High levels of Cl− and Na+ can be derived from saline intrusion. These ions concentrations are highest in the northern part of the study area, along the hypersaline river of Saloum, and at the west, close to the Atlantic coast. As such, moving up the course of the river from its estuary, saline waters were collected in community wells from Koilal (9), Latmingué (7), Dabane Galadio (32), Thioffior (33), Bandoulou Toucouleur (34), and Djalaba Sintye (65). Waters were also sampled in wells of coastal communities as in Missira (15) and Soukouta (13) in the south-west. Na + and Cl− may also be derived from the dissolution of soil salts with high evaporation during the dry season. The low values are noted in the center and eastern zones of the study area (Figure 4). In Figure 8a, some analytical data deviate from the expected 1:1 relation, indicating that some of the Na+ can be derived from other processes (weathering and/or cation exchange reactions). The increased Na+ content shows that Na+ in groundwater may result from silicate weathering. The mechanism of silicate weathering can be understood by estimating the ratio between (Na+ + K+) and total cations. Majority of samples in the study area are plotted above the trend line (Na+ + K+) = 0.5 Tc (Figure 8c) which signifies the contribution of silicate weathering due to the abundance of Na+ and K+ in groundwater [48,49].
The plot of (Ca2+ + Mg2+) versus (HCO3− + SO2−4) is used to determine also the ion exchange processes (Figure 8b). The main processes responsible for the release of Ca2+ ions in solution are usually the dissolution of calcite and the alteration of feldspar. In this diagram, some samples fall along the aquiline 1:1. This suggests that these ions have resulted from the dissolutions of carbonate [1,25,45,50,51]. However, a substantial excess of Ca2+ over Mg2+ (Figure 8d) showed that calcite is more abundant than dolomite. Calcium can also be derived from carbonates (calcite and dolomite) or sulphates (gypsum). This process is very scarce and its contribution in Ca2+ concentration in groundwater is very low in this area. In some wells near the sea (Missira (15), Ndiaye-Ndiaye (37), Lerane Kolli (36)) and to the Saloum river (Latmingue (7)), the contact between sea water and fresh water in a mainly clayey aquifer may be responsible for the high calcium content. This explains the presence of Ca-Cl facies (Piper diagram, Figure 5) in these locations due an exchange between the clay-Ca2+ and Na+ of the sea water. In Figure 8b, the mechanism of cation exchange on clay minerals could be another source because most of groundwater samples fall above to the 1:1 line. Accordingly, the quality of groundwater in the study area for the majority of the samples resulted from rock-water interaction process with the chemical weathering of rock, dissolution of carbonates and ion exchange between water and clay minerals.
3.3. Mineral Saturation Indices
In order to investigate thermodynamic controls on the water composition, equilibrium speciation calculation was made using PHREEQC [24,52]. These calculations provided saturation indices (SI) of minerals that might be reacting in the system. The SI of a given mineral is defined in Equation (3) as [52,53]:
where IAP = Ion Activity Product of the solution, Ks = Solubility Product of the mineral.
A positive SI value points out supersaturation and a tendency for the mineral to precipitate from the groundwater, whereas a negative SI indicates undersaturation and hence the dissolution of the minerals into groundwater. For a given mineral, there is apparent equilibrium into groundwater if SI values ranging between −0.5 and +0.5 and there is no dissolution and no precipitation for the mineral in these groundwater [54,55]. Wateq.dat is the thermodynamic database used [25,56]. The saturation indices of Anhydrite, Calcite, Dolomite and Halite are presented in Figure 7b. The calculated values range from −4.65 to −1.03, −5.19 to 0.98, −9.97 to 0.69 and −9.33 to −4.02 respectively. The Anhydrite, Gypsum and Halite SI indicate that groundwater is very undersaturated with these minerals. Groundwater is saturated with respect to carbonate minerals for few samples. About 10% of groundwater samples display saturation indices of calcite and dolomite, which range from −0.50 to 0.50, indicating equilibrium with respect to these minerals.
3.4. Drinking Water Quality
The analytical results of physical and chemical parameters of groundwater were compared with the standard guideline values recommended by the World Health Organization [26,27] for drinking and public health purposes (Table 4). The table shows the most desirable limits and maximum permissible limits of various parameters. 88% of groundwater samples are permissible for drinking water if reference is made to pH and 12% of the samples are unsuitable with low values of pH. Several processes can be responsible for low pH values such as the dissociation of carbonic acid, atmospheric diffusion of CO2, decomposition and oxidation of organic matter. In the domain of mangroves, the leaching of reduced sulfur in acidic soil horizons is responsible of the low values of pH. It is the case of waters sampled in the wells located at the western zone (Nema (14), Nema Ding (17)), north—northwestern zone (Koila (9), Ndiaye Ndiaye Serere (37), Thiofior (33), Dabane Galadio (32)), and southern zone (Keur Seyni Gueye (22), Keur Momar Sokhna (23), Keur Moussa poste (46)) of the study area. The groundwater pH decreasing is due to the migration of these acidic solutions from the soil.
The concentrations of ions, such as Na+, Ca2+, Mg2+, Cl− and SO42− are within the maximum allowable limits for drinking except a few samples. The TDS content of the groundwater in most (95%) of the groundwater samples is less than 1200 mg/L (Table 5). Therefore, the TDS content is considered satisfactory and groundwater can be used for drinking without any risk, with respects to this parameter.
Total Hardness (TH) of water is caused primarily by the presence of cations such as calcium and magnesium and anions such as carbonate, bicarbonate but has no known adverse effects [57]. TH of the groundwater was calculated using the formula (Equation (4)) given below [58]:
In water samples, hardness values range from 0.3 mg/L to 1486.6 mg/L with an average value of 219 mg/L. Groundwater exceeding the limit of 300 mg/L CaCO3 is considered very hard [59]. Per the WHO international standards, 500 mg/L is the TH maximum permissible limit for drinking water and 100 mg/L the most desirable limit. Nine samples exceed the maximum allowable limits (Table 4).
Groundwater inland is suitable for drinking in the study area based on the concentrations of major ions and quality parameters like pH, TDS, TH. This is not the case for waters sampled in wells close to the sea and the Saloum River. In these regions, water is polluted by saline intrusion as indicated by high TDS values and high concentrations of Na+ and Cl−. Finally, majority of groundwater samples are appropriate for domestic uses, except the particular cases of wells close to the seaside and to the Saloum river.
3.5. Suitability of Groundwater for Irrigation
Many indices allow appreciating the suitability of water for irrigation [61]. In this study, the general criteria for assessing the quality are the following: total concentration of dissolved salts (TDS); relative proportion of sodium to other principal cations, relative proportion of bicarbonate to calcium and magnesium, and elements that may be toxic (sulfates concentration and chloride concentration) (Table 6). More than 82% of the samples were categorized in class I based on TDS content and 14% were categorized in class II. This classification of water samples in relation to the TDS classes shows their suitability for irrigation. Identical results are obtained with the EC. The absorption of water and nutrients from the soil by plants become difficult with excess salinity, which reduces osmotic activity. [62,63]. 93% of the samples showed that the groundwater is excellent for irrigation based on the chloride content. With the sulfate, a single sample (Nema Ba (14)) located close to the mangrove ecosystem where the soils are acid sulfated, is unfit for irrigation (Table 6).
Sodium adsorption ratio (SAR) is also an important parameter for determining the suitability of groundwater for irrigation because it is a measure of alkali/sodium hazard to crops. Irrigation with water rich in Na+ can reduce soil permeability and thus limit the flow of air and water. This is due to the exchange processes that are established between water and soil. The Na+ ions are adsorbed by the clay particles replacing the Mg2+ and Ca2+ ions [62,63,64]. The excess sodium or limited calcium and magnesium are evaluated by the Sodium adsorption ratio SAR (Equation (5)) which is expressed as:
where all ionic concentrations are expressed in meq/L.
The SAR values range from 0.2 to 31.7 with an average value of 2.8. Table 7 illustrate classification of groundwater samples from the study area with respect to SAR. Based on this ratio, all groundwater samples showed suitability for agriculture practices except for four samples.
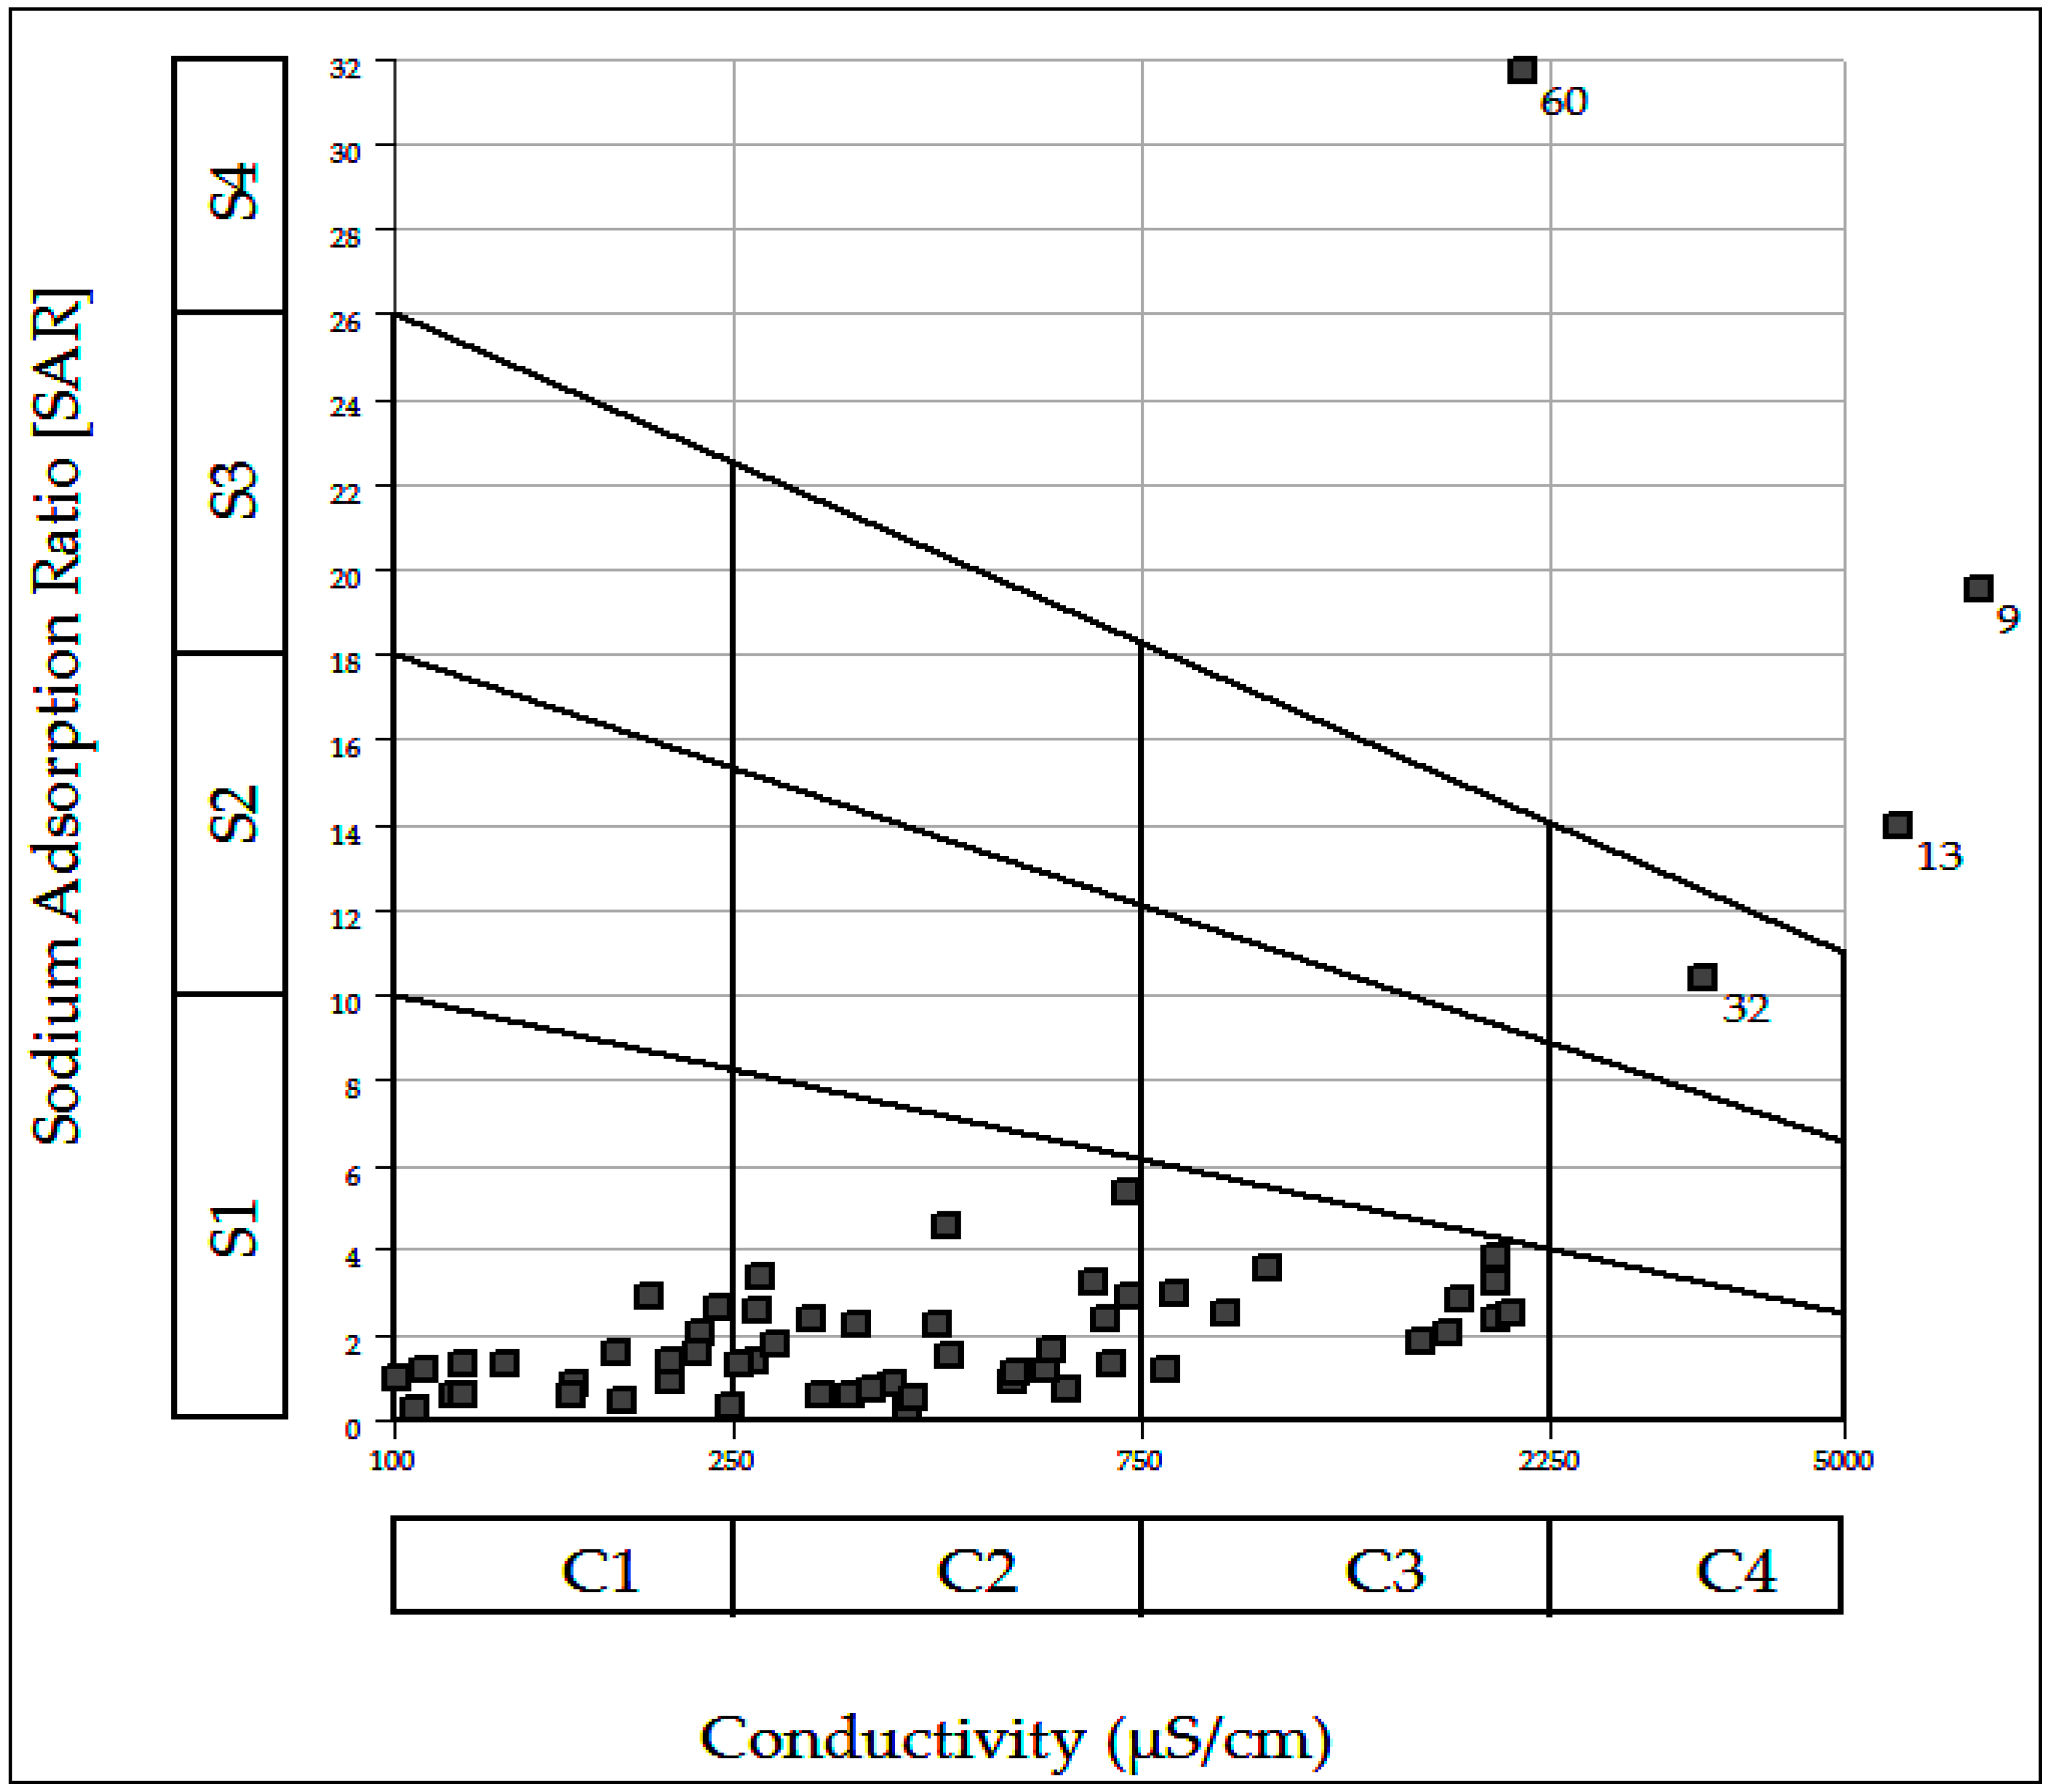
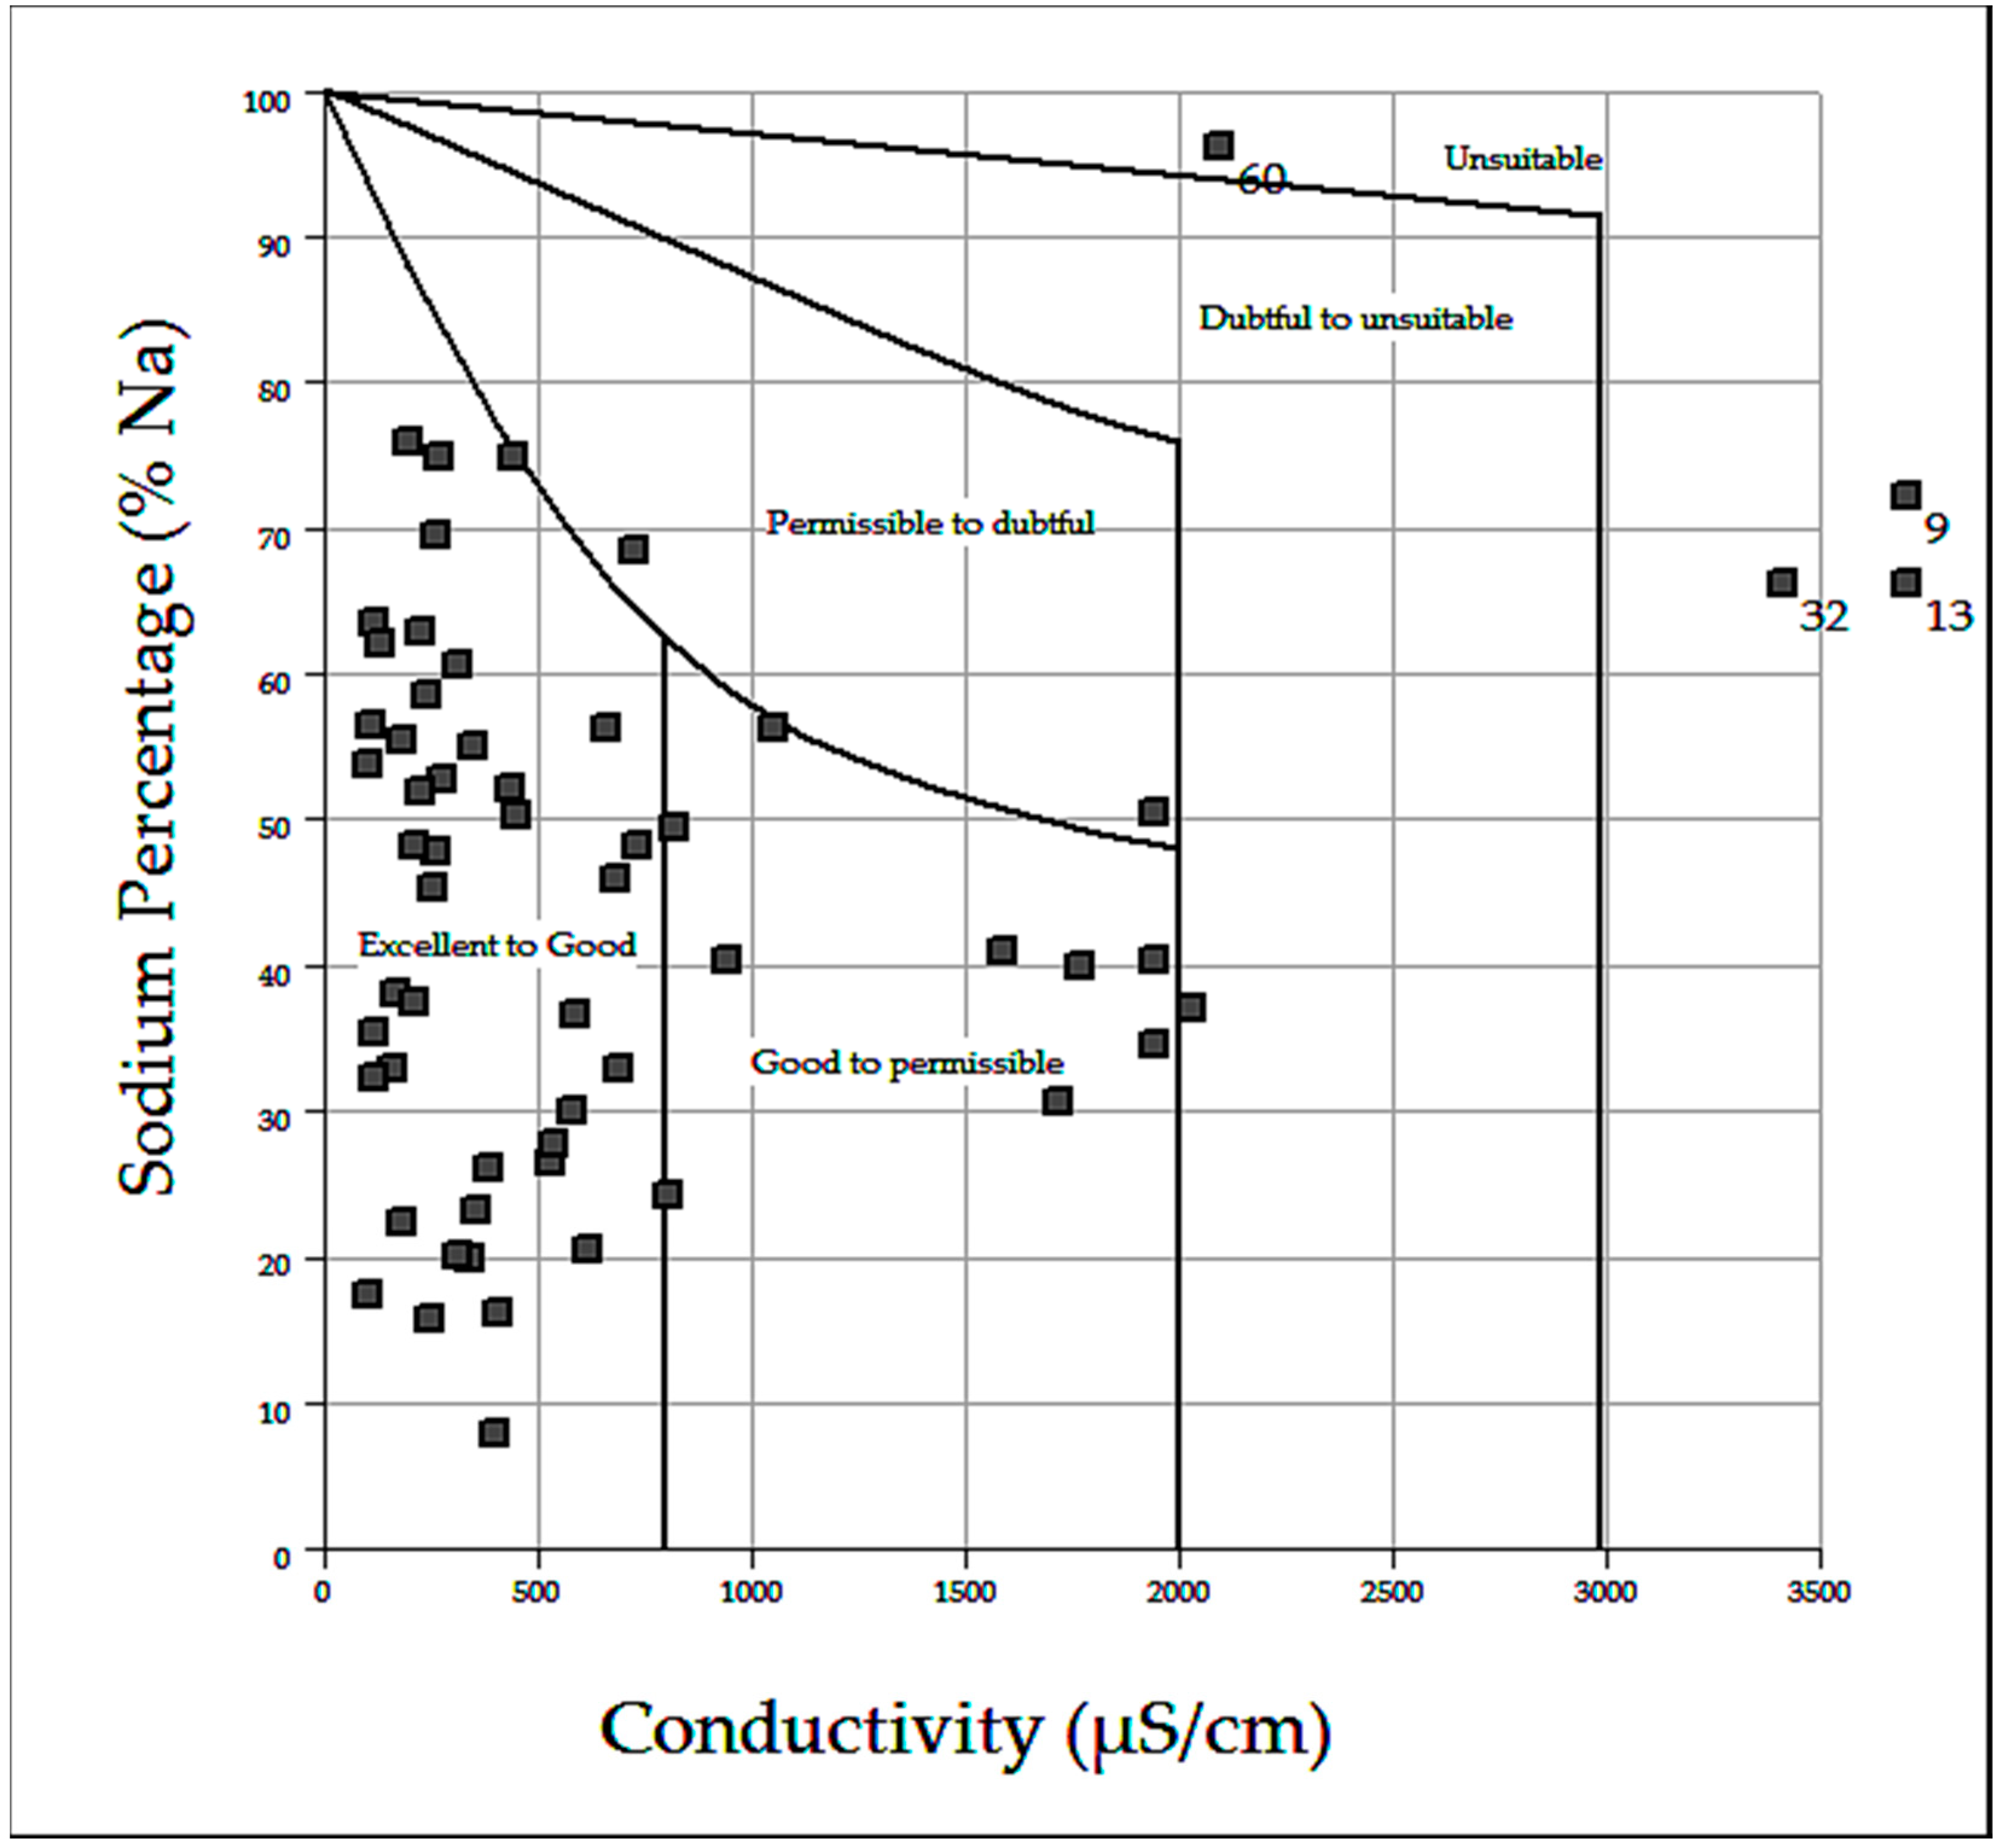
The analytical data reported on the US salinity diagram (Figure 9) shows that 96% samples are in C1S1, C2S1 and C3S1 categories suggesting that water can be used for agricultural activity. The diagram suggests that groundwater is suitable for irrigational use in almost all soil types with limited risk due to exchangeable sodium. Four samples fall in the field of C4S3 and C4S4, indicating very high salinity and high alkalinity hazard. These samples are not suitable for irrigational purposes. Wilcox diagram (Figure 10) is widely utilized for evaluating the suitability of water for irrigation using percent sodium and EC. The Wilcox diagram shows that most of the groundwater samples fall in the fields of excellent to good and good to permissible except four samples falling in the field unsuitable for irrigation.
Residual sodium carbonate RSC is another index used to assess the quality of water for irrigation purposes [65]. The following equation is used to calculate RSC:
where the concentrations are reported in meq/L.
The water suitability for irrigation according to the RSC is based on three classes: water is not suitable for irrigation if the water RSC exceeds 2.5 meq/L, slightly adapted to irrigation if RSC ranges between 1.25 and 2.5 and acceptable for irrigation if the RSC values are less than or equal to 1.25 [66]. The classification of groundwater for irrigation according to the RSC values is presented in Table 8, where the category of groundwater is good except for one sample.
Samples (9), (13), (32), (60) are unsuitable for irrigation as shown by the US salinity and Wilcox diagrams used to estimate the quality of waters. For the first three samples, the unsuitable quality is due to their closeness to the Saloum river ((9), (32)) and to the sea (13) and thus to saline intrusion. The well (60) is located inland and its water quality cannot be associated with the current position of saline intrusion. This abnormal salinity water might be indicative of the presence of salt-water pockets of ancient valleys existing in this sector. The water in this well is not suitable for irrigation with its high content of bicarbonate (472.2 mg·L−1) responsible for precipitation of carbonaceous minerals and an increase in Sodium content. For a better understanding of the bicarbonate effects on the negative impact of Sodium, the RSC method must be coupled with the conclusions obtained from the study of salinity with the two diagrams (US salinity and Wilcox).
4. Conclusions
The main purpose of this study was to evaluate the geochemical processes regulating groundwater quality in the aquifer of Saloum (Senegal), in order to assess its suitability for domestic and agricultural utilizations. Groundwater samples collected in the field were analyzed for pH, EC, TDS and major ions. The order of abundance of ions is Na+ > Ca2+ > Mg2+ > K+ and Cl− > HCO3− > SO42−. The different binary diagrams indicate chemical weathering of rocks, dissolution of carbonates and ion exchanges between water and clay minerals control the groundwater chemistry. Piper diagram, Gibbs plots, Chloro-Alkaline Indices and Saturation Indices were also used to understand the hydrochemical processes. Most samples were classified as Ca-HCO3 and Na-Cl types. In the Gibbs plots, most samples fall in rock dominance zone and few in evaporation dominance zone. Interpretation of hydrochemical analysis of groundwater samples reveal that the groundwater in Saloum is essentially within the class of excellent to good based on TDS, soft to moderately hard based on total hardness and fresh with regards to the nature of groundwater based on TDS. Except in some places, the groundwater is within the permissible limits for domestic use according to the concentrations of the major ions. Total dissolved solids in groundwater is less than 1200 mg/L and SAR values are less than 10. Most of the samples fall in the suitable range for irrigation purpose from US Lab and Wilcox diagrams. RSC values overall are less than 1.25 meq/L. The assessments of water for irrigation use show that the water is of good to permissible quality.
The main conclusion drawn from this study is that groundwater represents a key resource for the social and economic development for the Saloum region in Senegal. It can be used, with respect to its chemical properties, without risk for domestic and agricultural uses, over almost the whole Saloum region. Exceptions are located along the seaside and the Saloum river, where due to saline water intrusion, groundwater is unfit.
In order to be able to satisfy the growing needs in both sectors, population and agriculture, a sustainable management of this vital resource should now be implemented. To this end the Water Management Plan is planning the realization of a forthcoming numerical simulation model of the Continental Terminal Aquifer in order to optimize groundwater abstractions for both users, taking account of the groundwater system’s physico-chemical properties, hydrodynamic functioning and constraints mainly related to saltwater intrusion.
Author Contributions
Data collection, S.N.; methodology, interpretation, writing, review & editing, all authors.
Funding
This research received no external funding.
Acknowledgments
The authors gratefully acknowledge the assistance for the chemical analyses by the staff of HydrASA laboratory of the University of Poitiers (France). Authors are also thankful to the Department of Civil Engineering of Dakar University for their help in field missions made by the first author. We would like to thank the three anonymous reviewers for their suggestions and comments.
Conflicts of Interest
The authors declare no conflict of interest.
References
- Rajmohan, N.; Elango, E.L. Identification and evolution of hydrogeochemical processes in the groundwater environment in an area of the Palar and Cheyyar River Basins, Southern India. Environ. Geol. 2004, 46, 47–61. [Google Scholar] [CrossRef]
- Jalali, M. Geochemistry characterization of groundwater in an agricultural area of Razan, Hamadan, Iran. Environ. Geol. 2009, 56, 1479–1488. [Google Scholar] [CrossRef]
- Baye, A.Y.; Razack, M.; Ayenew, T.; Zemedagegnehu, E. Hydrogeological and hydrochemical framework of Upper Awash River basin, Ethiopia: With special emphasis on inter-basins groundwater transfer between Blue Nile and Awash rivers. J. Afr. Earth Sci. 2012, 65, 46–60. [Google Scholar]
- Furi, W.; Razack, M.; Alemayu, T.A.; Ayenew, T.; Legesse, D. Fluoride enrichment mechanism and geospatial distribution in the volcanic aquifers of the Middle Awash basin, Northern Main Ethiopian Rift. J. Afr. Earth Sci. 2011, 60, 315–327. [Google Scholar] [CrossRef]
- Faye, S.; Cisse Faye, S.; Ndoye, S.; Faye, A. Hydrogeochemistry of the Saloum (Senegal) superficial coastal aquifer. Environ. Geol. 2003, 44, 127–136. [Google Scholar] [CrossRef]
- Faye, S.; Maloszewski, P.; Stichler, W.; Trimborn, P.; Cisse Faye, S.; Gaye, C.B. Groundwater salinization in the Saloum (Senegal) delta aquifer: Minor elements and isotopic indicators. Sci. Total Environ. 2005, 343, 243–259. [Google Scholar] [CrossRef] [PubMed]
- Abderamane, H.; Razack, M.; Vassolo, S. Hydrogeochemical and isotopic characterisation of the Groundwter in the Chari-Baguirmi depression. Republic of Chad. Environ. Earth Sci. 2013, 69, 2337–2350. [Google Scholar] [CrossRef]
- Ntanganedzeni, B.; Elumalai, V.; Rajmohan, N. Coastal Aquifer Contamination and Geochemical Processes Evaluation in Tugela Catchment, South Africa-Geochemical and Statistical Approaches. Water 2018, 10, 687. [Google Scholar] [CrossRef]
- Celestino, A.E.M.; Cruz, D.A.M.; Sánchez, E.M.O.; Reyes, F.G.; Soto, D.V. Groundwater Quality Assessment: An Improved Approach to K-Means Clustering, Principal Component Analysis and Spatial Analysis: A Case Study. Water 2018, 10, 437. [Google Scholar] [CrossRef]
- Zhang, X.; Qian, H.; Chen, J.; Qiao, L. Assessment of Groundwater Chemistry and Status in a Heavily Used Semi-Arid Region with Multivariate Statistical Analysis. Water 2014, 6, 2212–2232. [Google Scholar] [CrossRef] [Green Version]
- Li, X.; Wu, H.; Qian, H.; Gao, Y. Groundwater Chemistry Regulated by Hydrochemical Processes and Geological Structures: A Case Study in Tongchuan, China. Water 2018, 10, 338. [Google Scholar] [CrossRef]
- Yuan, J.; Xu, F.; Deng, G.; Tang, Y.; Li, P. Hydrogeochemistry of Shallow Groundwater in a Karst Aquifer System of Bijie City, Guizhou Province. Water 2017, 9, 625. [Google Scholar] [CrossRef]
- Krishna Kumar, S.; Logeshkumaran, A.; Magesh, N.S.; Godson, P.S.; Chandrasekar, N. Hydro-geochemistry and application of water quality index (WQI) for groundwater quality assessment, Anna Nagar, part of Chennai City, Tamil Nadu, India. Appl. Water Sci. 2015, 5, 335–343. [Google Scholar] [CrossRef]
- Diop, E.S. Tropical Holocene Estuaries. Comparative Study of the Physical Geography Features of the Rivers from the South of Saloum to the Mellcore (Guinea Republic). Ph.D. Thesis, University Louis Pasteur, Strasbourg, France, 1986. (In French). [Google Scholar]
- Conrad, G.; Lappartient, J.R. The Continental Terminal, its position within the Cenozoic geodynamic evolution of the Senegalo-mauritanian basin. J. Afr. Earth Sci. 1987, 6, 45–60. [Google Scholar]
- Diluca, C. Hydrogeology of the Continental Terminal Aquifer between the Sine and the Gambia; Technical Report, BRGM DKR 76 DKR; BRGM Publ.: Orléans, France, 1976; p. 33. (In French) [Google Scholar]
- Lappartient, J.R. The Continental Terminal and the Early Pleistocene of the Senegalo-Mauritanian Basin. Stratigraphy, Sedimentology, Diagenesis, Alterations, Paleoshore Reconstitutions from the Ferralitic Formations. Ph.D. Thesis, University of Marseille, Provence, France, 1985. (In French). [Google Scholar]
- Edmunds, M.W. Groundwater Recharge in Senegal. In Technical Report Hydrogeology Series; Report WD/90/49R; British Geological Survey Publ.: Keyworth, UK, 1990; p. 162. [Google Scholar]
- Simler, R. Diagrammes; Laboratoire d’Hydrogéologie d’Avignon: Avignon, France, 2009. [Google Scholar]
- Gibbs, R.J. Mechanism controlling world water chemistry. Science 1970, 17, 1088–1090. [Google Scholar] [CrossRef]
- Schoeller, H. Qualitative evaluation of groundwater resources. In Methods and Techniques of Groundwater Investigation and Development; Water Resources Series, N° 33; UNESCO: Paris, France, 1967; pp. 44–52. [Google Scholar]
- Garrels, R.M.; Christ, C.L. Solutions, Minerals, and Equilibria; Freeman: Dallas, TX, USA, 1965; p. 450. [Google Scholar]
- Ammar, F.H.; Chkir, N.; Zouari, K.; Hamelin, B.; Deschamps, P.; Aigoun, A. Hydrogeochemical processes in the complex Terminal aquifer of southern Tunisia: An integrated investigation based on geochemical and multivariate statistical methods. J. Afr. Earth Sci. 2014, 100, 81–95. [Google Scholar] [CrossRef]
- Parkhurst, D.L.; Apelo, C.A.J. User’s guide to PHREEQC (version 2)-A Computer program for speciation, batch-reaction, one-dimensional transport, and inverse geochemical calculations. United States Geological Survey. In Water Resources Investigations; Report 99-4259; USGS Publ.: Washington, DC, USA, 1999; p. 326. [Google Scholar]
- Touhari, F.; Meddi, M.; Mehaiguene, M.; Razack, M. Hydrogeochemical assessment of the Upper Cheliff groundwater (North West Algeria). Environ. Earth Sci. 2015, 73, 3043–3061. [Google Scholar] [CrossRef]
- WHO. Guidelines to Drinking Water Quality; World Health Organization: Geneva, Switzerland, 1983. [Google Scholar]
- WHO. Guideline for Drinking-Water Quality, 3rd ed.; World Health Organization: Geneva, Switzerland, 2004. [Google Scholar]
- Mukherjee, S.; Kumar, B.A.; Körtvélyessy, L. Assessment of groundwater quality in the south 24-Parganas, west Bengal coast, India. J. Environ. Hydrol. 2005, 13, 1–8. [Google Scholar]
- Wilcox, L.V. Classification and Use of Irrigation Water; Circular 969; US Department of Agriculture: Washington, DC, USA, 1955.
- USSL (United States Salinity Laboratory staff). Diagnosis and Improvement of Saline and Alkali Soils; Hand Book 60; US Department of Agricultural Soils; US Department of Agricultural (USDA): Washington, DC, USA, 1954; pp. 69–81.
- Freeze, A.; Cherry, J. Groundwater; Prentice-Hall: Englewood Cliffs, NJ, USA, 1979; p. 604. [Google Scholar]
- Gilly, G.; Corrao, G.; Favilli, S. Concentrations of nitrates in drinking water and incidence of gastric carcinomas. First descriptive study of the Piemonate Region, Italy. Sci Total Environ. 1984, 34, 35–37. [Google Scholar] [CrossRef]
- Venkateswaran, S.; Karuppannan, S.; Vijay, S.P.; Kannan, R.; Malar, S.; Prabu, P. Hydro Chemical Characteristic and Groundwater Quality Assessment in Parts of Pambar River Basin, Tamil Nadu, India. Int. J. Innov. Technol. Explor. Eng. 2013, 3, 36–44. [Google Scholar]
- Piper, A.M. A graphic procedure in the chemical interpretation of water analysis. Am. Geophys. Union Trans. 1944, 25, 914–923. [Google Scholar] [CrossRef]
- Gibbs, R.J. Mechanism controlling world river water chemistry: Evaporation-crystallization process. Science 1971, 172, 871–872. [Google Scholar]
- Versluys, J. Subterranean water conditions in the coastal regions of the Netherlands. Econ. Geol. 1931, 26, 65–95. [Google Scholar] [CrossRef]
- Schoeller, H. Les échanges de base dans les eaux souterraines; trois exemples en Tunisie. Bull. Soc. Geol. Fr. 1934, 4, 389–420. [Google Scholar]
- Schoeller, H. Géochimie des eaux souterraines. Revue l’Instit. Français Pétrole 1956, 10, 230–234. [Google Scholar]
- Stuyfzand, P.J. A new hydrochemical classification of water types: Principles and application to the coastal dunes aquifer system of the Netherlands. In Proceedings of the 9th Salt Water Intrusion Meeting, Delft, The Netherlands, 12–16 May 1986; pp. 641–655. [Google Scholar]
- Stuyfzand, P.J. Base Exchange Indices as Indicators of salinization or Freshening of Coastal Aquifers. In Proceedings of the 20th Salt Water Intrusion Meeting, Naples, FL, USA, 23–27 June 2008; pp. 262–265. [Google Scholar]
- Batabyal, A.K.; Gupta, S. Fluoride-contaminated groundwater of Birbhum district, West Bengal, India: Interpretation of drinking and irrigation suitability and major geochemical processes using principal component analysis. Environ. Monit. Assess. 2017, 189–369. [Google Scholar] [CrossRef] [PubMed]
- Schoeller, H. Geochemistry of groundwater. In Groundwater Studies—An International Guide for Research and Practice; UNESCO: Paris, France, 1977; Volume 15, pp. 1–18. [Google Scholar]
- Kurumbein, W.C.; Graybill, F.A. An introduction to Statistical Models in Geology; McGraw Hill Book Company: New York, NY, USA, 1965. [Google Scholar]
- Mrazovac, S.; Vojinovic-Miloradov, M. Correlation of main physicochemical parameters of some groundwater in northern Serbia. J. Geochem. Explor. 2011, 108, 176–182. [Google Scholar] [CrossRef]
- Fisher, R.S.; Mulican, W.F. Hydrochemical evolution of sodium-sulfate and sodium-chloride groundwater beneath the Northern Chihuahuan desert, Trans-Pecos, Texas, USA. Hydrogeol. J. 1997, 10, 455–474. [Google Scholar] [CrossRef]
- Hiscock, K.M. Hydrogeology; Principles and Practice; Blackwell Publishing: Oxford, UK, 2005. [Google Scholar]
- Wang, P.; Yu, J.; Zhang, Y.; Liu, C. Groundwater recharge and hydrogeochemical evolution in the Ejina Basin, northwest China. J. Hydrol. 2013, 476, 72–86. [Google Scholar] [CrossRef]
- Stallard, R.F.; Edmond, J.M. Geochemistry of the Amazon: The influence of geology and weathering environment on the dissolved load. J. Geophys. Res. Oceans 1983, 88, 9671–9688. [Google Scholar] [CrossRef]
- Saravanan, K.; Srinivasamoorthy, K.; Prakash, R.; Gopinath, S.; Suma, C.S. An Evaluation of Hydrogeochemistry of Groundwater in Upper Vellar Sub-Basin using Mineral Stability and Solute Transport Modeling. International Conference on Water Resources, Coastal and Ocean Engineering (ICWRCOE). Aquat. Procedia 2015, 4, 1119–1125. [Google Scholar] [CrossRef]
- Cerling, T.E.; Pederson, B.L.; Damm, K.L.V. Sodium-calcium ion exchange in the weathering of shales: Implications for global weathering budgets. Geology 1989, 17, 552–554. [Google Scholar] [CrossRef]
- Datta, P.S.; Tyagui, S.K. Major ion chemistry of groundwater in Delhi area: Chemical weathering processes and groundwater regime. J. Geol. Soc. India 1996, 47, 179–188. [Google Scholar]
- Parkhurst, D.L.; Apelo, C.A.J. Description of Input and Examples for PHREEQC Version 3—A Computer Program for Speciation, Batch-Reaction, One-Dimensional Transport, and Inverse Geochemical Calculations. U.S. Department of the Interior. In U.S. Geological Survey Techniques and Methods; USGS Publ.: Washington, DC, USA, 2013; 6–A43. [Google Scholar]
- Garrels, R.M.; Mackenzie, F.T. Origin of the chemical compositions of some springs and lakes. In Equilibrium Concepts in Natural Water Systems; Stumm, W., Ed.; American Chemical Society: Washington, DC, USA, 1967; pp. 222–242. [Google Scholar]
- Srinivasamoorthy, K.; Chidambaram, S.; Prasanna, M.V.; Vasanthavigar, M.; John Peter, A.; Anandhan, P. Identification of major sources controlling groundwater chemistry from a hard rock terrain—A case study from Mettur Taluk, Salem district, Tamilnadu, India. J. Earth Syst. Sci. 2008, 117, 49. [Google Scholar] [CrossRef]
- Srinivasamoorthy, K.; Gopinath, M.; Chidambaram, S.; Vasanthavigar, M.; Sarma, V.S. Hydrochemical characterization and quality appraisal of groundwater from Pungar sub basin, Tamilnadu, India. J. King Saud Univ. Sci. 2014, 26, 37–52. [Google Scholar] [CrossRef]
- Hounslow, A.W. Water Quality Data: Analysis and Interpretation; CRC Press LLC: Boca Raton, FL, USA, 1995. [Google Scholar]
- Schroeder, H.A. Relations between hardness of water and death rates from certain chronic and degenerative diseases in the United States. J. Chron. Dis. 1960, 12, 586–591. [Google Scholar] [CrossRef]
- Hem, J.D. Study and Interpretation of Chemical Characteristics of Natural Water, 3rd ed.; Geological Survey Water-Supply 1985, Paper 2254; United States Government Printing Office: Washington, DC, USA.
- Sawyer, G.N.; McCarthy, D.L. Chemistry of Sanitary Engineers, 2nd ed.; McGraw Hill: New York, NY, USA, 1967; p. 518. [Google Scholar]
- Comly, H.H. Cyanosis in infants caused by nitrates in well water. J. Am. Med. Assoc. 1945, 129, 112–116. [Google Scholar] [CrossRef]
- Kumar, M.; Kumari, K.; Ramanathan, A.L.; Saxena, R.A. Comparative Evaluation of Groundwater Suitability for Irrigation and Drinking Purposes in Two Intensively Cultivated, Districts of Punjab, India. Environ. Geol. 2007, 53, 553–574. [Google Scholar] [CrossRef]
- Saleh, A.; Al-Ruwaih, F.; Shehata, M. Hydrogeochemical processes operating within the main aquifers of Kuwait. J. Arid. Environ. 1999, 42, 195–209. [Google Scholar] [CrossRef]
- Elango, L.; Kannan, R.; Senthil Kumar, M. Major ion chemistry and identification of hydrogeochemical processes of groundwater in part of Kancheepuram district, Tamil Nadu, Indian. J. Environ. Geosci. 2003, 10, 157–166. [Google Scholar]
- Collins, R.; Jenkins, A. The impact of agricultural land use on stream chemistry in the middle Hills of the Himalayas, Napal. J. Hydrol. 1996, 185, 71–86. [Google Scholar] [CrossRef]
- Subramani, T.; Elango, L.; Damodarasamy, S.R. Groundwater quality and its suitability for drinking and agricultural use in Chithar River Basin, Tamil Nadu, India. Environ. Geol. 2005, 47, 1099–1110. [Google Scholar] [CrossRef]
- Yidana, S.M. Groundwater classification using multivariate statistical methods: Southern Ghana. J. Afr. Earth Sci. 2010, 57, 455–469. [Google Scholar] [CrossRef]
Figure 1.
The location map and the sampling network.

Figure 2.
Geological cross section from Sirmang to Nioro du Rip [6], modified. (Location of cross section is indicated in Figure 1).

Figure 3.
Piezometric map (May 2012).

Figure 4.
Distribution of the main elements contents (mg/L) and TDS (mg/L) in the groundwater.

Figure 5.
Piper plot of the groundwater chemistry in May 2012.

Figure 6.
Mechanism controlling groundwater chemistry.

Figure 7.
Chloro-Alkaline Indices (a) and Saturation Indices (b) of the groundwater samples.

Figure 8.
Bivariate plots of (a) Cl− vs. Na+, (b) Ca2+ + Mg2+ vs. SO42− + HCO3−, (c) Na+ + K+ vs. Total Cations, and (d) Mg2+ vs. Ca2+.
Figure 8.
Bivariate plots of (a) Cl− vs. Na+, (b) Ca2+ + Mg2+ vs. SO42− + HCO3−, (c) Na+ + K+ vs. Total Cations, and (d) Mg2+ vs. Ca2+.

Figure 9.
USSL classification of groundwater. C: Salinity Hazard; C1: Low, C2: Medium, C3: High, C4: Very high; S: Sodium Hazard; S1: Low, S2: Medium, S3: High, S4: Very high.
Figure 9.
USSL classification of groundwater. C: Salinity Hazard; C1: Low, C2: Medium, C3: High, C4: Very high; S: Sodium Hazard; S1: Low, S2: Medium, S3: High, S4: Very high.

Figure 10.
Suitability of groundwater for irrigation in Wilcox diagram.


Table 1.
Analytical Results of Groundwater Samples from the Saloum CT aquifer.
| N° | Name | Ca | Mg | Na | K | HCO3 | Cl | SO4 | NO3 | TDS | pH | EC | RSC | TH |
|---|---|---|---|---|---|---|---|---|---|---|---|---|---|---|
| 1 | Koumbal | 20.39 | 2.84 | 43.48 | 1.24 | 33.55 | 48.32 | 1.18 | 41.00 | 164.00 | 7.20 | 309.00 | −0.70 | 62.81 |
| 2 | Sikatoroum | 62.31 | 10.73 | 21.10 | 3.64 | 170.80 | 16.44 | 2.07 | 49.00 | 180.00 | 8.10 | 342.00 | −1.19 | 200.50 |
| 3 | Some | 21.37 | 1.30 | 15.49 | 1.97 | 76.25 | 8.38 | 1.46 | 2.92 | 87.00 | 7.60 | 163.00 | 0.08 | 58.85 |
| 4 | Touba Darou camp | 84.37 | 8.10 | 28.04 | 1.05 | 259.25 | 55.22 | 2.76 | 1.34 | 327.00 | 6.46 | 613.00 | −0.63 | 244.66 |
| 5 | Ndobene | 20.10 | 4.00 | 26.93 | 1.96 | 45.75 | 37.78 | 0.77 | 16.00 | 140.00 | 6.90 | 264.00 | −0.58 | 66.93 |
| 6 | Daga Youndou | 159.69 | 34.45 | 108.98 | 0.54 | 27.45 | 422.84 | 2.85 | 36.50 | 920.00 | 4.92 | 1720.00 | −10.35 | 542.76 |
| 7 | Latmingue | 155.90 | 37.10 | 100.30 | 128.70 | 179.95 | 376.29 | 34.91 | 50.00 | 850.00 | 6.45 | 1590.00 | −7.88 | 544.33 |
| 8 | Keur Mamour Lo | 61.11 | 6.22 | 25.21 | 1.83 | 46.65 | 72.80 | 11.83 | 48.12 | 205.00 | 7.40 | 385.00 | −2.80 | 178.69 |
| 9 | Koilal | 214.00 | 228.40 | 1726.10 | 49.70 | 33.55 | 2886.18 | 316.3 | 27.94 | 3900.00 | 5.30 | 7160.00 | −28.92 | 1486.67 |
| 10 | Ndrame Scale | 0.00 | 0.67 | 8.64 | 1.26 | 13.42 | 7.21 | 0.00 | 4.62 | 37.10 | 7.20 | 69.40 | 0.17 | 2.78 |
| 11 | Ndrame Ibra | 8.29 | 3.82 | 35.38 | 2.67 | 6.10 | 37.92 | 1.20 | 46.09 | 142.00 | 7.30 | 267.00 | −0.63 | 36.66 |
| 12 | Diagle | 15.12 | 0.42 | 26.51 | 0.76 | 24.40 | 25.98 | 2.40 | 29.05 | 121.00 | 7.50 | 229.00 | −0.39 | 39.53 |
| 13 | Soukouta | 427.40 | 57.20 | 1158.90 | 35.80 | 268.40 | 2154.45 | 30.89 | 23.29 | 3110.00 | 7.70 | 5740.00 | −21.63 | 1306.83 |
| 14 | Nema Ba | 160.40 | 43.30 | 211.90 | 102.00 | 12.20 | 275.86 | 544.9 | 12.51 | 1040.00 | 4.50 | 1940.00 | −11.37 | 581.42 |
| 15 | Missira 1 | 170.70 | 28.32 | 150.50 | 64.50 | 162.50 | 232.86 | 80.81 | 293.45 | 1030.00 | 6.79 | 1940.00 | −8.18 | 544.75 |
| 16 | Missira2 | 6.52 | 0.80 | 10.30 | 0.30 | 23.79 | 14.35 | 1.41 | 1.97 | 54.00 | 5.63 | 101.00 | 0.00 | 19.63 |
| 17 | Nema Nding | 55.37 | 16.79 | 92.91 | 0.66 | 22.20 | 122.08 | 13.20 | 163.97 | 443.00 | 3.85 | 819.00 | −3.78 | 208.39 |
| 18 | Dassilame Soce | 0.67 | 0.43 | 6.60 | 0.89 | 15.25 | 3.86 | 0.00 | 5.09 | 37.70 | 6.10 | 71.00 | 0.18 | 3.49 |
| 19 | Karang | 97.39 | 9.49 | 114.03 | 4.87 | 179.95 | 101.37 | 11.65 | 168.41 | 500.00 | 6.23 | 940.00 | −2.69 | 283.03 |
| 20 | Sirmang | 19.33 | 3.83 | 32.03 | 0.00 | 44.40 | 31.65 | 3.65 | 33.40 | 175.00 | 6.90 | 350.00 | −0.55 | 64.26 |
| 21 | keur Samba Gueye | 3.34 | 0.67 | 6.05 | 0.00 | 24.40 | 3.01 | 0.00 | 3.18 | 40.20 | 7.50 | 76.50 | 0.18 | 11.16 |
| 22 | keur Seyni Gueye | 45.72 | 20.97 | 68.81 | 16.35 | 50.20 | 119.69 | 10.00 | 102.50 | 560.00 | 4.10 | 1050.00 | −3.18 | 201.67 |
| 23 | Keur Momar Sokh | 10.48 | 1.15 | 34.82 | 2.87 | 34.40 | 14.49 | 1.30 | 49.83 | 144.00 | 5.43 | 269.00 | −0.05 | 30.98 |
| 24 | Bambadalo Thiakh | 3.68 | 1.77 | 12.53 | 1.14 | 10.07 | 8.04 | 1.20 | 21.47 | 64.00 | 6.30 | 121.00 | −0.16 | 16.57 |
| 25 | keur Lahine Fatim | 7.31 | 0.98 | 27.98 | 0.56 | 18.30 | 15.76 | 2.80 | 35.14 | 104.00 | 7.60 | 199.00 | −0.15 | 22.38 |
| 26 | Nioro Alassane Tall | 0.00 | 0.55 | 14.25 | 0.45 | 13.12 | 8.10 | 1.18 | 9.04 | 48.60 | 7.90 | 80.50 | 0.17 | 2.31 |
| 27 | Keur Saloum Diane | 0.00 | 0.07 | 5.56 | 0.25 | 7.38 | 4.42 | 0.00 | 2.44 | 20.60 | 7.30 | 38.60 | 0.12 | 0.30 |
| 28 | Lamaram Badiane | 88.00 | 9.90 | 50.20 | 10.90 | 153.35 | 105.75 | 5.81 | 47.99 | 426.00 | 6.09 | 805.00 | −2.69 | 261.25 |
| 29 | Ndiagne | 21.83 | 4.30 | 19.08 | 1.22 | 61.00 | 29.65 | 1.44 | 8.76 | 112.00 | 7.50 | 210.00 | −0.44 | 72.52 |
| 30 | Ndiakhate | 46.60 | 1.40 | 9.80 | 4.80 | 118.95 | 13.62 | 1.36 | 5.87 | 132.00 | 6.53 | 249.00 | −0.49 | 122.33 |
| 31 | Sama Toucouleur | 46.30 | 11.10 | 29.50 | 2.10 | 103.70 | 54.56 | 4.25 | 34.42 | 280.00 | 6.47 | 530.00 | −1.52 | 162.00 |
| 32 | Dabane Galadio | 178.20 | 67.00 | 639.50 | 21.80 | 30.50 | 1195.78 | 107.4 | 25.81 | 1830.00 | 5.48 | 3410.00 | −13.91 | 724.67 |
| 33 | Tiofior | 52.00 | 10.70 | 90.30 | 4.50 | 13.05 | 194.25 | 2.93 | 28.37 | 352.00 | 4.84 | 661.00 | −3.26 | 174.58 |
| 34 | Bandoulou Toucou | 181.60 | 61.30 | 187.30 | 48.50 | 55.75 | 556.18 | 7.96 | 170.84 | 1030.00 | 5.91 | 1940.00 | −13.19 | 709.42 |
| 35 | Tallene | 13.14 | 1.56 | 9.31 | 0.95 | 36.30 | 14.26 | 0.72 | 2.80 | 62.00 | 6.60 | 118.00 | −0.19 | 39.35 |
| 36 | Lérane Kolli | 70.20 | 13.00 | 44.30 | 12.70 | 114.55 | 102.66 | 12.15 | 36.85 | 369.00 | 6.90 | 692.00 | −2.69 | 229.67 |
| 37 | Ndiaye ndiaye S. | 90.00 | 7.70 | 45.10 | 8.50 | 29.15 | 182.79 | 2.63 | 18.04 | 308.00 | 4.50 | 579.00 | −4.65 | 257.08 |
| 38 | Sorom1 | 46.30 | 9.30 | 112.20 | 3.50 | 22.20 | 196.94 | 3.16 | 39.05 | 385.00 | 6.80 | 723.00 | −2.71 | 154.50 |
| 39 | Thianda Thiamene | 71.80 | 4.60 | 70.50 | 6.60 | 88.80 | 128.40 | 5.27 | 47.95 | 364.00 | 7.40 | 682.00 | −2.51 | 198.67 |
| 40 | Keur Mat Thiam | 20.34 | 2.51 | 25.39 | 1.09 | 57.95 | 27.99 | 0.95 | 12.98 | 112.00 | 7.30 | 210.00 | −0.27 | 61.32 |
| 41 | Passi Diemoul | 19.79 | 4.15 | 33.33 | 1.55 | 28.30 | 45.68 | 10.00 | 21.76 | 150.00 | 6.70 | 280.00 | −0.87 | 66.78 |
| 42 | Keur Madiabel | 77.10 | 9.40 | 97.40 | 3.10 | 73.20 | 198.75 | 10.81 | 22.39 | 386.00 | 7.40 | 728.00 | −3.42 | 231.92 |
| 43 | Koular | 24.80 | 9.50 | 35.60 | 32.20 | 20.25 | 84.66 | 4.76 | 48.36 | 239.00 | 5.30 | 448.00 | −1.69 | 101.58 |
| 44 | Koutango | 17.29 | 3.66 | 10.33 | 4.66 | 18.30 | 26.17 | 3.43 | 23.08 | 86.00 | 7.30 | 162.00 | −0.86 | 58.46 |
| 45 | Keur Maba Diakhou | 6.23 | 1.67 | 13.32 | 0.22 | 14.95 | 9.67 | 2.30 | 18.21 | 58.00 | 5.07 | 109.00 | −0.20 | 22.55 |
| 46 | Keur Moussa Poste | 1.14 | 1.31 | 7.01 | 0.32 | 16.78 | 5.95 | 0.00 | 5.48 | 40.30 | 4.80 | 75.90 | 0.11 | 8.29 |
| 47 | Porokhane | 40.80 | 15.10 | 22.40 | 3.70 | 59.65 | 55.59 | 13.26 | 45.30 | 284.00 | 7.10 | 535.00 | −2.30 | 164.92 |
| 48 | Nioro du Rip | 21.78 | 5.18 | 9.35 | 1.18 | 64.05 | 8.77 | 16.56 | 7.45 | 99.00 | 6.15 | 186.00 | −0.46 | 76.04 |
| 49 | Paoskoto | 91.50 | 5.20 | 9.70 | 0.00 | 228.75 | 18.01 | 8.93 | 6.09 | 212.00 | 6.41 | 400.00 | −1.24 | 250.42 |
| 50 | Taiba Niassene | 17.15 | 1.66 | 4.53 | 0.51 | 52.16 | 3.56 | 1.01 | 0.97 | 56.00 | 5.68 | 106.00 | −0.14 | 49.80 |
| 51 | Thiamene | 22.17 | 3.49 | 25.36 | 1.93 | 54.90 | 35.31 | 1.08 | 11.59 | 134.00 | 6.90 | 254.00 | −0.49 | 69.99 |
| 52 | Keur Ali Bassine | 83.27 | 4.13 | 19.85 | 1.33 | 207.40 | 29.17 | 3.09 | 10.93 | 216.00 | 6.91 | 406.00 | −1.10 | 225.38 |
| 53 | Keur Goumba Gueye | 62.14 | 4.00 | 23.50 | 0.76 | 128.10 | 46.02 | 4.37 | 12.21 | 190.00 | 6.69 | 361.00 | −1.33 | 172.01 |
| 54 | Keur Ayip KA | 15.20 | 3.90 | 70.50 | 2.70 | 53.05 | 61.39 | 3.49 | 48.75 | 236.00 | 4.95 | 443.00 | −0.21 | 54.25 |
| 55 | Thila babou Diarra | 10.81 | 4.40 | 19.93 | 1.23 | 14.20 | 18.59 | 1.71 | 43.06 | 121.00 | 6.90 | 227.00 | −0.67 | 45.39 |
| 56 | Keur Mama Lamine | 0.00 | 1.34 | 9.49 | 0.36 | 1.53 | 5.36 | 1.94 | 14.51 | 44.00 | 7.00 | 83.20 | −0.08 | 5.57 |
| 57 | keur Aliou DIOP | 56.30 | 17.50 | 57.60 | 1.90 | 199.15 | 54.27 | 2.23 | 50.00 | 313.00 | 6.90 | 588.00 | −0.98 | 213.67 |
| 58 | Ngayene Thiébou | 123.40 | 52.50 | 124.10 | 30.20 | 63.05 | 244.49 | 10.44 | 341.50 | 1090.00 | 4.20 | 2030.00 | −9.44 | 527.25 |
| 59 | Simon Diene | 5.49 | 1.35 | 13.42 | 1.71 | 15.25 | 8.13 | 2.84 | 18.75 | 71.00 | 7.30 | 135.00 | −0.14 | 19.37 |
| 60 | Keur Soce Sogo | 9.20 | 4.40 | 467.50 | 20.30 | 472.75 | 326.31 | 59.12 | 0.00 | 1110.00 | 8.30 | 2090.00 | 6.93 | 41.33 |
| 61 | Keur Niegne Wolof | 50.60 | 5.20 | 18.90 | 0.00 | 109.80 | 37.95 | 1.27 | 13.11 | 166.00 | 8.10 | 316.00 | −1.15 | 148.17 |
| 62 | Keur Mamour Koumba | 13.55 | 0.75 | 7.99 | 0.17 | 54.90 | 6.80 | 1.43 | 2.97 | 64.00 | 6.06 | 121.00 | 0.16 | 36.99 |
| 63 | Keur Mor Khouredia | 13.57 | 2.54 | 24.37 | 1.59 | 42.70 | 29.05 | 0.73 | 7.31 | 98.00 | 7.10 | 183.00 | −0.19 | 44.48 |
| 64 | Keur Abdou Yassine | 22.50 | 7.20 | 40.80 | 8.50 | 33.05 | 59.30 | 2.25 | 52.00 | 231.00 | 4.01 | 434.00 | −1.17 | 86.25 |
| 65 | Djalaba Sintye | 147.50 | 30.40 | 139.90 | 20.80 | 36.10 | 277.60 | 8.64 | 311.01 | 940.00 | 4.70 | 1770.00 | −9.27 | 495.42 |
| 66 | Djilor | 31.50 | 4.40 | 51.30 | 2.80 | 16.10 | 94.43 | 1.15 | 35.30 | 128.00 | 5.80 | 240.00 | −1.67 | 97.08 |
Table 2.
Summary statistics for concentrations of chemical constituents.
| Parameters | Min | Max | Average | Median | Standard Deviation |
|---|---|---|---|---|---|
| HCO3− (mg L−1) | 1.5 | 473.0 | 7223.0 | 43.5 | 82.5 |
| Cl− (mg L−1) | 3.0 | 2886.0 | 177.3 | 41.8 | 457.7 |
| NO3− (mg L−1) | 0.0 | 342.0 | 44.4 | 23.1 | 69.4 |
| SO42− (mg L−1) | 0.0 | 545.0 | 21.4 | 2.8 | 77.7 |
| K+ (mg L−1) | 0.0 | 128.7 | 10.5 | 1.9 | 22.9 |
| Na+ (mg L−1) | 4.5 | 1726.0 | 103.1 | 28.0 | 263.3 |
| Ca2+ (mg L−1) | 0.0 | 428.0 | 56.7 | 23.6 | 71.0 |
| Mg2+ (mg L−1) | 0.1 | 228.0 | 14.1 | 4.4 | 30.9 |
| pH | 3.8 | 8.3 | 6.9 | 6.7 | 1.1 |
| EC (µS cm−1) | 38.6 | 7160.0 | 763.1 | 346.0 | 1213.6 |
| TDS (mg L−1) | 20.6 | 3900.0 | 408.6 | 177.5 | 657.5 |
Table 3.
Correlation between pairs of physiochemical parameters of groundwater quality. High correlation are shown in bold.
Table 3.
Correlation between pairs of physiochemical parameters of groundwater quality. High correlation are shown in bold.
| HCO3− | Cl− | NO3− | SO42− | K+ | Na+ | Ca2+ | Mg2+ | pH | EC | TDS | |
| HCO3− (mg/L) | 1.00 | ||||||||||
| Cl− (mg/L) | 0.17 | 1.00 | |||||||||
| NO3− (mg/L) | −0.08 | 0.07 | 1.00 | ||||||||
| SO42− (mg/L) | −0.02 | 0.47 | −0.06 | 1.00 | |||||||
| K+ (mg/L) | 0.08 | 0.51 | 0.22 | 0.86 | 1.00 | ||||||
| Na+ (mg/L) | 0.25 | 0.99 | 0.07 | 0.50 | 0.53 | 1.00 | |||||
| Ca2+ (mg/L) | 0.32 | 0.78 | 0.31 | 0.39 | 0.60 | 0.72 | 1.00 | ||||
| Mg2+ (mg/L) | 0.01 | 0.90 | 0.19 | 0.60 | 0.58 | 0.90 | 0.63 | 1.00 | |||
| pH | 0.43 | −0.02 | −0.17 | −0.48 | −0.46 | −0.01 | −0.10 | −0.12 | 1.00 | ||
| E C (µs/cm) | 0.23 | 0.98 | 0.15 | 0.54 | 0.61 | 0.98 | 0.84 | 0.90 | −0.07 | 1.00 | |
| TDS (mg/L) | 0.27 | 0.98 | 0.15 | 0.54 | 0.61 | 0.98 | 0.83 | 0.90 | −0.05 | 1.00 | 1.00 |
Table 4.
Groundwater samples of the study area exceeding the permissible limits prescribed by WHO for drinking purposes.
Table 4.
Groundwater samples of the study area exceeding the permissible limits prescribed by WHO for drinking purposes.
| Parameters | WHO International Standard (1983, 2004) | Wells Exceeding Permissible Limits (Figure 1) | Undesirable Effect | |
|---|---|---|---|---|
| Desired Limit | Maximum Allowable Limits | |||
| pH | 6.5–8.5 | 9,2 | 6, 9, 14, 17, 22, 33, 37, 46, 54, 58, 64, 65 | Taste |
| TH (mg/L) | 100 | 500 | 6, 7, 9, 13, 14, 15, 32, 34, 58 | Scale formation |
| Na (mg/L) | - | 200 | 9, 13, 14, 32, 34, 60 | Taste |
| Ca (mg/L) | 75 | 200 | 9, 13, 15, 34 | Scale formation |
| Mg (mg/L) | 50 | 150 | 9 | |
| Cl (mg/L) | 250 | 600 | 9, 13, 32 | Salty Taste |
| SO4 (mg/L) | 200 | 500 | 14 | Taste |
| NO3 (mg/L) | 50 | - | 15, 17, 19, 22, 34, 58, 65 | Methaemoglobinaemia in infant an [60] |
Table 5.
Suitable of groundwater for drinking purpose on different classification.
| Based on TDS (mg/L) | Water Class | Number of Samples |
|---|---|---|
| <300 | Excellent | 43 |
| 300–600 | Good | 12 |
| 600–900 | Fair | 1 |
| 900–1200 | Poor | 7 |
| >1200 | Unacceptable | 3 |
Table 6.
Suitable of water with different constituents for irrigation.
| Classes of Water | Parameters | Suitable for Irrigation | |||
|---|---|---|---|---|---|
| TDS (mg/L) | SO42− (mg/L) | Cl− (mg/L) | EC (mS/cm) | ||
| I | 0–700 (55) | 0–192 (64) | 0–142 (51) | 0–0.75 (51) | Excellent to good for irrigation |
| II | 700–2000 (9) | 192–480 (1) | 142–355 (10) | 0.75–2.25 (12) | Good to injurious suitable soil |
| III | >2000 (2) | >480 (1) | >355 (5) | >2.25 (3) | Unfit for irrigation |
Values in parenthesis show the number of corresponding samples.
Table 7.
Suitability of water for irrigation with different value of SAR.
| SAR | Suitability for Irrigation |
|---|---|
| 1–10 (90.0%) | Suitable for all types of crops and soil except for those crops sensitive to sodium |
| 10–18 (4.0%) | Suitable for coarsed textured or organic soil with permeability |
| 18–26 (1.5%) | Harmful for almost all soil |
| >26 (4.5%) | Unsuitable for irrigation |
Values in parenthesis show the total percentage of samples.
Table 8.
Quality of groundwater based on residual sodium carbonate.
| RSC (meq/L) | Remark on Quality | Representing Wells |
|---|---|---|
| <1.25 | Good | All wells except No.60 |
| 1.25–2.5 | Doubtful | Nil |
| >2.5 | Unsuitable | 60 |
© 2018 by the authors. Licensee MDPI, Basel, Switzerland. This article is an open access article distributed under the terms and conditions of the Creative Commons Attribution (CC BY) license (http://creativecommons.org/licenses/by/4.0/).
Share and Cite
MDPI and ACS Style
Ndoye, S.; Fontaine, C.; Gaye, C.B.; Razack, M. Groundwater Quality and Suitability for Different Uses in the Saloum Area of Senegal. Water 2018, 10, 1837. https://doi.org/10.3390/w10121837
AMA Style
Ndoye S, Fontaine C, Gaye CB, Razack M. Groundwater Quality and Suitability for Different Uses in the Saloum Area of Senegal. Water. 2018; 10(12):1837. https://doi.org/10.3390/w10121837
Chicago/Turabian StyleNdoye, Seyni, Claude Fontaine, Cheikh Becaye Gaye, and Moumtaz Razack. 2018. "Groundwater Quality and Suitability for Different Uses in the Saloum Area of Senegal" Water 10, no. 12: 1837. https://doi.org/10.3390/w10121837
Note that from the first issue of 2016, this journal uses article numbers instead of page numbers. See further details here.