Spatial and Seasonal Variations of Water and Salt Movement in the Vadose Zone at Salt-Impacted Sites

Department of Civil Engineering, Lassonde School of Engineering, York University, Toronto, ON M3J 1P3, Canada
*
Author to whom correspondence should be addressed.
Water 2018, 10(12), 1833; https://doi.org/10.3390/w10121833
Submission received: 8 November 2018
/
Revised: 2 December 2018
/
Accepted: 7 December 2018
/
Published: 12 December 2018
(This article belongs to the Section Hydrology)
Abstract
:Oilfield-produced brine is a major source of salt contamination in soil and groundwater. Salt transport in the upper soil layers is controlled by the atmospheric interactions via infiltration of meteoritic water. In lower layers, it is controlled by fluctuations in the groundwater table, which are also linked to atmospheric interactions via groundwater recharge. Therefore, climate is an important factor in the movement of contaminants in the unsaturated zone. A one-dimensional variably saturated flow and transport model with soil atmospheric boundary conditions was used to estimate the effect of climate type and soil texture on soil water and salt dynamics in variably saturated soils. Numerical simulations were run with Hydrus-1D, using daily climate data. Simulations were run for nine-year climate datasets for different ecoclimatic locations in Alberta, Canada. Results indicated that coarse-grained materials are good evaporation barriers, resulting in water gain conditions at the ground surface, irrespective of the climate type. However, the quantity of water gain and associated advective fluxes are a function of climate. Results also indicated that flow and transport in fine-textured soils is more dependent on the climate type. For fine-grained soils in arid climatic conditions, net water loss at the ground surface and upward migration of salt can be expected. For wetter climates, the upward migration of salt is less probable.
1. Introduction
Groundwater resources play an important role in the development of the modern society. On a global scale, the growing groundwater demand has become crucial for the livelihood and food security, especially in areas with arid and semi-arid climates [1]. In Canada, approximately 30% of the population depends on groundwater resources for domestic use [2].
Over the past few decades, the study of the unsaturated zone has received a great deal of attention in relation to understanding the effect of water dynamics and solute transport in the unsaturated zone [3]. The unsaturated zone or vadose zone is the portion of subsurface that lies above the water table, and acts as a natural filter by attenuating pollutants that might migrate from near or at the ground surface before reaching and polluting surface and groundwater resources.
Large oil and gas operations have existed in the Great Plains Area of Canada since the mid-20th century [4]. The extraction and processing of these natural resources sometimes result in spills of highly concentrated drilling fluids and co-produce saline water released at the ground surface or in the subsurface. The spill of salts poses a severely adverse effect on the near-subsurface environments. The transport of the produced saline water in the unsaturated zone leads to contamination of groundwater resources and degradation of soil chemical and physical properties caused by excess of sodium and chloride concentrations [5]. The transport becomes more complex due to the heterogeneity of the soil profile. Soil texture and soil layering configurations impact salt migration during the infiltration (I) and evaporation (E) processes, which in turn increase the risk of salinization and sodification in the root zone [6]. The I and E are controlled by many variables, such as: soil hydraulic properties, depth to the groundwater table, interconnectivity between the unsaturated zone and groundwater systems, presence of diurnal or nocturnal phreatophytes, root water uptake distribution, and seasonal climatic conditions [7]. According to an estimate, the salt-affected area due to various reasons covers about 1 × 10⁹ ha in the world [8].
The current methods of risk assessment and site-specific remediation controls are regulated by the Alberta’s Environmental policy framework on sustainable soil and groundwater contamination management practices. Under the framework, one of the options for the management of contaminated sites requires the use of a software called subsoil salinity tool [9]. The subsoil salinity tool (SST) is a software program designed for the development of soil salinity guidelines applicable below the root zone regarding the net vertical and lateral movement of salt over time. In essence, SST program is a chloride-mass-balance-based fate and transport guideline calculator, which employs a conceptual model based on vertical chloride transport in soil as a function of hydraulic gradient, and saturated hydraulic conductivity [9]. The SST program relies on pre run simulations and the user can either make use of a pre-assigned vertical gradient corresponding to a specific natural region and subregion for the province of Alberta [10] or use field measured vertical gradient values.
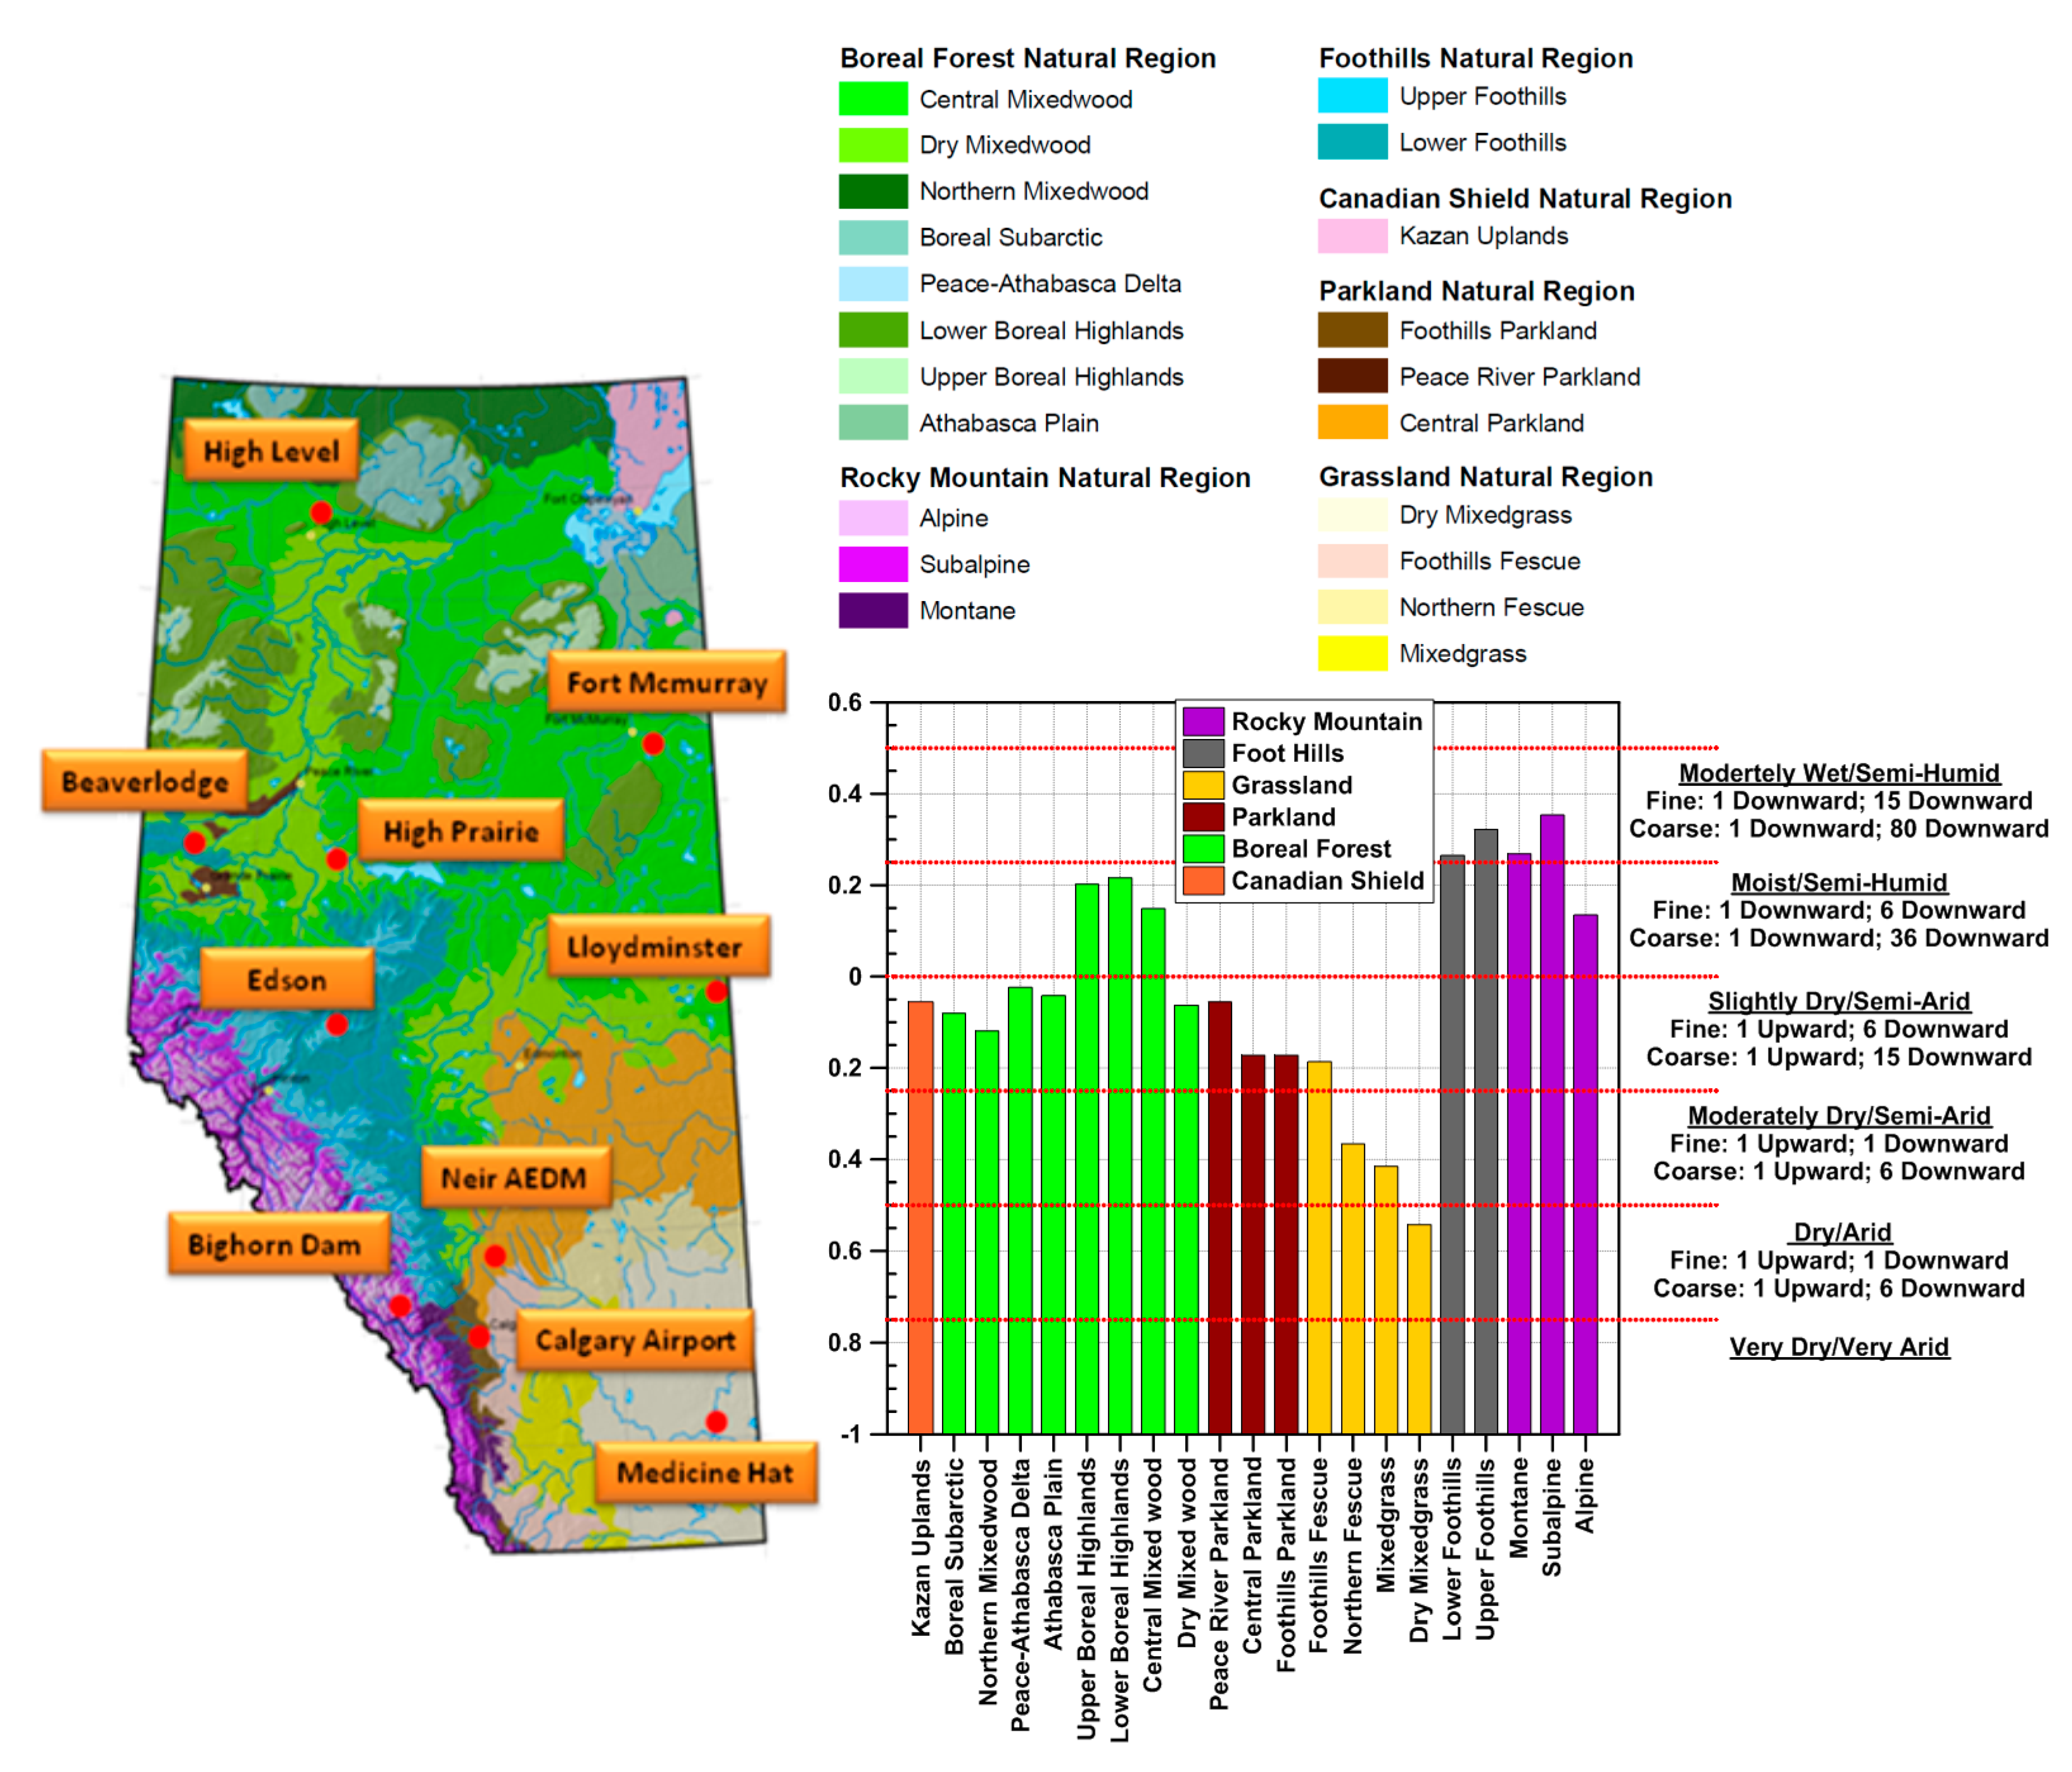
Figure 1 shows the various natural regions and subregions for the province of Alberta. The same figure also shows the climate moisture index (CMI) for various regions and associated upward or downward drainage rates (gradients) (mm/year) for fine and coarse soil materials. For each climate and soil type, two different drainage rates are provided. The first drainage rate is used to develop guidelines for receptors located in closer proximity to the soil surface such as the root zone, shallow groundwater and aquatic life. The second drainage rate is used to develop guidelines for deeper receptors, such as drinking water aquifers. For example, for Foothills and Rocky Mountain Natural Regions, where climate is estimated to be moderately wet/semi-humid, the highest drainage rates only in the downward direction are assigned. This is based on the assumption that for this subregion, there is a net moisture surplus, and salts will transport downward in a manner associated with recharge conditions for both coarse and fine materials. Similarly, drainage rates for moist/semi-humid climate for some regions of Rocky Mountain and Boreal Forest are also only downward but are in smaller in magnitude than the wet/semi-humid climate. It can also be observed that for Parkland and certain Boreal Forest subregions where the water balance is near neutral, both upward and downward drainage rates are assigned. In general, higher drainage rates are associated with wetter climates and coarse soils, while lower drainage rates are associated with drier climates and fine-grained soils. In addition, the magnitude of drainage rate used to develop guidelines for receptors located in closer proximity to the soil surface appears to be fixed at 1 mm/year. The SST program also does provide the flexibility to modify the drainage categories if information on vertical hydraulic gradient from nested wells at particular site is available [9].
The assignment of a constant drainage rate, either in the upward or downward direction, has a number of limitations. Water fluxes in the vadose zone could vary significantly from site to site, even for similar climate conditions. Even with the same average flux, salt migration will be different with constant flux than with seasonally varying flux. Therefore, using constant recharge/discharge rates does not represent possible significant difference between sites and may overestimate or underestimate salt migration at the site. Field measurements of vertical gradient at salt-contaminated sites require significant effort and availability of this information does not necessarily address concerns associated with seasonally varying flux. It is anticipated that a more practical solution could be using representative climate datasets with different regional and representative parameters to predict the salt movement using variably saturated flow and transport modeling. Additionally, use of a soil atmosphere boundary with representative climate datasets will ensure that soil atmosphere interaction is taken into consideration, and direction and magnitude of the flux at the ground surface is appropriately estimated. The importance of soil atmosphere interaction has been highlighted in a number of recent publications [11,12,13,14].
The present research attempts to understand the relationship between the effects of soil texture and climate type on water and salt dynamics in the variably saturated zone for different ecoclimatic regions in Alberta, Canada, using numerical modeling. The flow and transport modeling was carried out using Hydrus-1D [15]. Hydrus-1D is a computer code, which can be used to simulate water flow, heat, carbon dioxide and major ion solute transport in variably saturated porous media. Hydrus has been used in the past for similar studies [16].
Hydrus-1D uses the finite element method to solve relevant governing differential equations of energy and mass transfer. Multiyear climate datasets were compiled and classified for six different natural regions of province of Alberta and constituted the upper boundary of the models. The soil atmosphere boundary was used to estimate the direction and magnitude of the water flux at the ground surface. Estimated unsaturated soil hydraulic properties for commonly occurring surficial soils in Alberta were used in the modeling. Results from the simulations indicate that the direction and magnitude of the salt movement is dependent on the climate and soil types. The results from this work can be used for site-specific risk assessments for the vertical migration of salt for various general climate and soil types.
2. Theoretical Considerations
2.1. Water Flow and Solute Transport in Variably Saturated Soils
Richards [17] defined the governing partial differential equation for uniform water movement in unsaturated soils by combining the mass balance equation with the Darcy-Buckingham flux law. For one-dimensional vertical domain, the equation can be expressed as:
where θ is the volumetric water content (L3/L3), t is time (T), h is the soil water pressure head (L), z is the vertical spatial coordinate (L), K(h) is the unsaturated hydraulic conductivity function (L/T) and S is the sink term (L3/L3T) that accounts, for example, for root water uptake (transpiration).
In order to solve the above equation, two sets of hydraulic properties are required. These properties are soil–water characteristic curve (SWCC) and the unsaturated hydraulic conductivity function [15]. The unsaturated soil hydraulic properties are of great importance, especially when numerical models are used in the analysis of variably saturated water flow and salt transport [18]. van Genuchten [19] estimated the unsaturated hydraulic conductivity in terms of SWCC parameters based upon the theory of Maulem [20]. The van Genuchten function [19] for SWCC is as follows:
where θs is the saturated water content (L3/L3), θr is the residual water content (L3/L3), α (1/L), n (−), and m (−) are curve fitting parameters, and other parameters are as defined earlier. The parameter α can be related to the inverse of air entry value (also referred to as the bubbling pressure which is the negative pressure head that must be exceeded before air recedes into the soil pores [21]. The parameter n is related to the pore size distribution index. Using the assumption that m = 1 − 1/n, van Genuchten [19] formulated the following equation for the unsaturated hydraulic conductivity function:
where the effective saturation, Se, is computed as shown below:
Ks is the saturated hydraulic conductivity (L/T); (−) is an empirical parameter that is normally assumed to be 0.5 [15] and all the other parameters are as described earlier. It should be noted that in most instances, Equation (2) is fitted to the measured SWCC data and the fitted parameters are used to estimate the unsaturated hydraulic conductivity function using Equation (3).
The governing partial differential equation for one-dimensional vertical transport of inert, non-adsorbing solutes during transient water flow in a variably saturated rigid porous medium can be expressed as [22]:
where C is the total concentration of chemical (ML−3), q is the volumetric flux density (LT−1), and De is the hydrodynamic dispersion coefficient (L2T−1).
The hydrodynamic dispersion coefficient is given by [23]:
where Dw is the moLecular diffusion coefficient in free water (L2T−1), τw is a tortuosity factor in the liquid phase (−), |q| is the absolute value of the Darcian fluid flux density (LT−1), and DL is the longitudinal dispersivity (L).
The tortuosity factor can be estimated as a function of the water content using the relationship [24]:
2.2. Soil Atmosphere Interactions
The magnitude and direction of the water flux across the soil–atmosphere interface depends upon the prevailing climatic conditions and transient near surface soil moisture [12,25]. The soil–atmosphere interface can be represented in the form of a system-dependent boundary condition (BC), where the flux across this interface is not known as a priori and is calculated as part of the solution [15]. This system-dependent BC can change from a prescribed flux to prescribed head and vice versa, and can be represented as following [15]:
and
where h (L) is the pressure head at the soil surface and E(LT−1) is the maximum rate of I or E across the soil atmosphere interface and hA and hS are the minimum and maximum pressure heads, respectively, allowed under the prevailing soil conditions. The value of hA can be calculated from the air humidity, Hr, as follows [15]:
where Hr is relative humidity of the atmosphere (dimensionless); R is the gas constant (8.31 kg m2 s−2 K−1 g moL−1); M is the moLecular weight of water (0.018 kg g moL−1); g is the gravitational acceleration (9.81 m s−2); and T is the temperature (K). In instances where the precipitation (P) rate exceeds the I capacity of the soil, the BC at the soil surface is changed from prescribed flux (precipitation flux) to head boundary (h = hs) and any excess water on the soil surface is immediately removed as a surface runoff (RO). Similarly, in instances that the potential evaporation (PE) rate exceeds the capability of the soil to deliver enough water toward the soil surface (h ≤ hA) the system-dependent BC changes from prescribed flux (PE rate), to head boundary. In this case, the PE reduces actual evaporation (AE) that is estimated by the prevailing pressure head at the ground surface.
3. Materials and Methods
3.1. Meteorological Data Input
Continuous daily climatic datasets were compiled for 10 different locations across Alberta. The locations and their association with various ecoclimatic regions are identified in Figure 1. These datasets consisted of daily values of maximum and minimum temperatures, mean relative humidity, total precipitation, wind speed and net radiation. These datasets covered a period from January 2005 to December 2014. The Thornthwaite climate classification is an empirical system that was developed from climatic data collected in the United States [26,27]. It forms an adequate basis for evaluating the climate for engineering purposes, especially for analysis associated with soil atmosphere boundary [25]. The climate can be classified by computing the moisture index as follows:
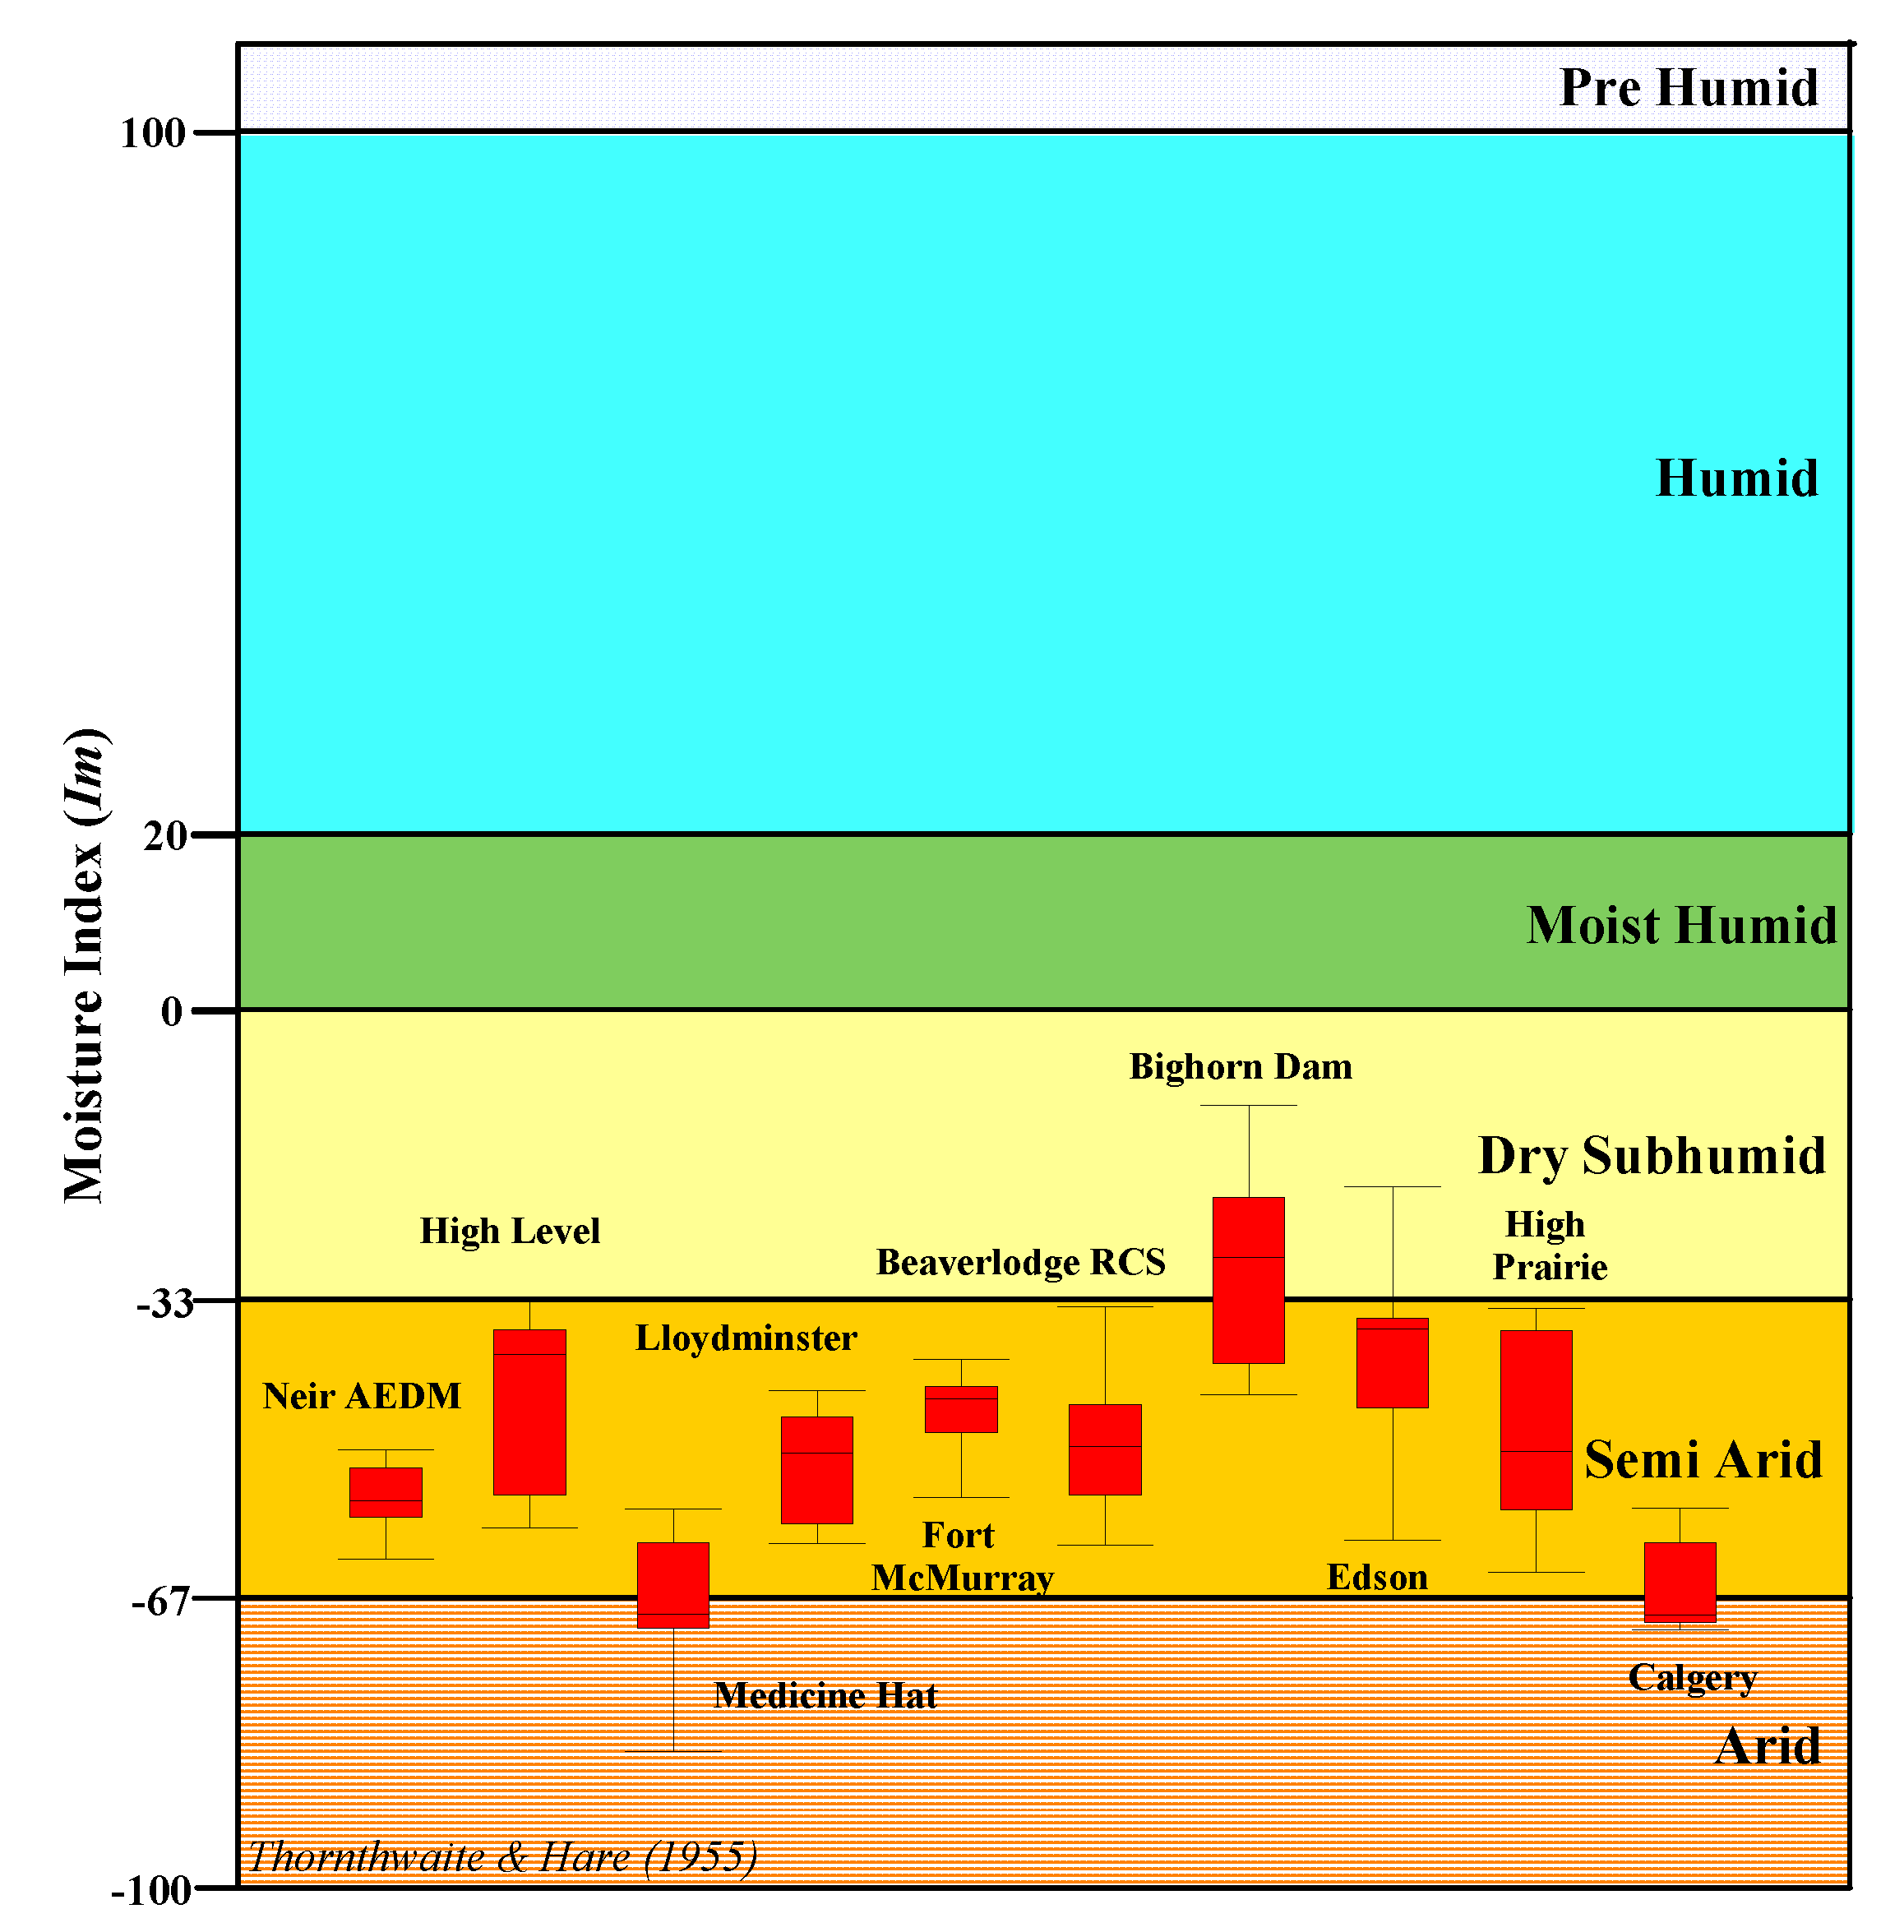
where Im is the 1955 Thornthwaite’s annual moisture index, Pa is the total annual precipitation (compiled from weather stations), and PEa is the annual PE. PE was estimated using the Penman method [28] and the compiled climate data. The moisture index may vary from positive values indicating moist/humid climates to negative values indicating dry climates. An Im value of zero signifies that the annual precipitation and PE are equal. Based on the computed annual moisture indices, the climate classification for various locations in the province of Alberta (Figure 2) can be divided into three main climate conditions as follows: dry sub-humid (Bighorn Dam and Edson); semi-arid (high level, Fort McMurray, Beaverlodge, high prairie, Lloydminster, Neir AEDM); and arid (Calgary and Medicine Hat).
3.2. Soil Hydraulic Properties
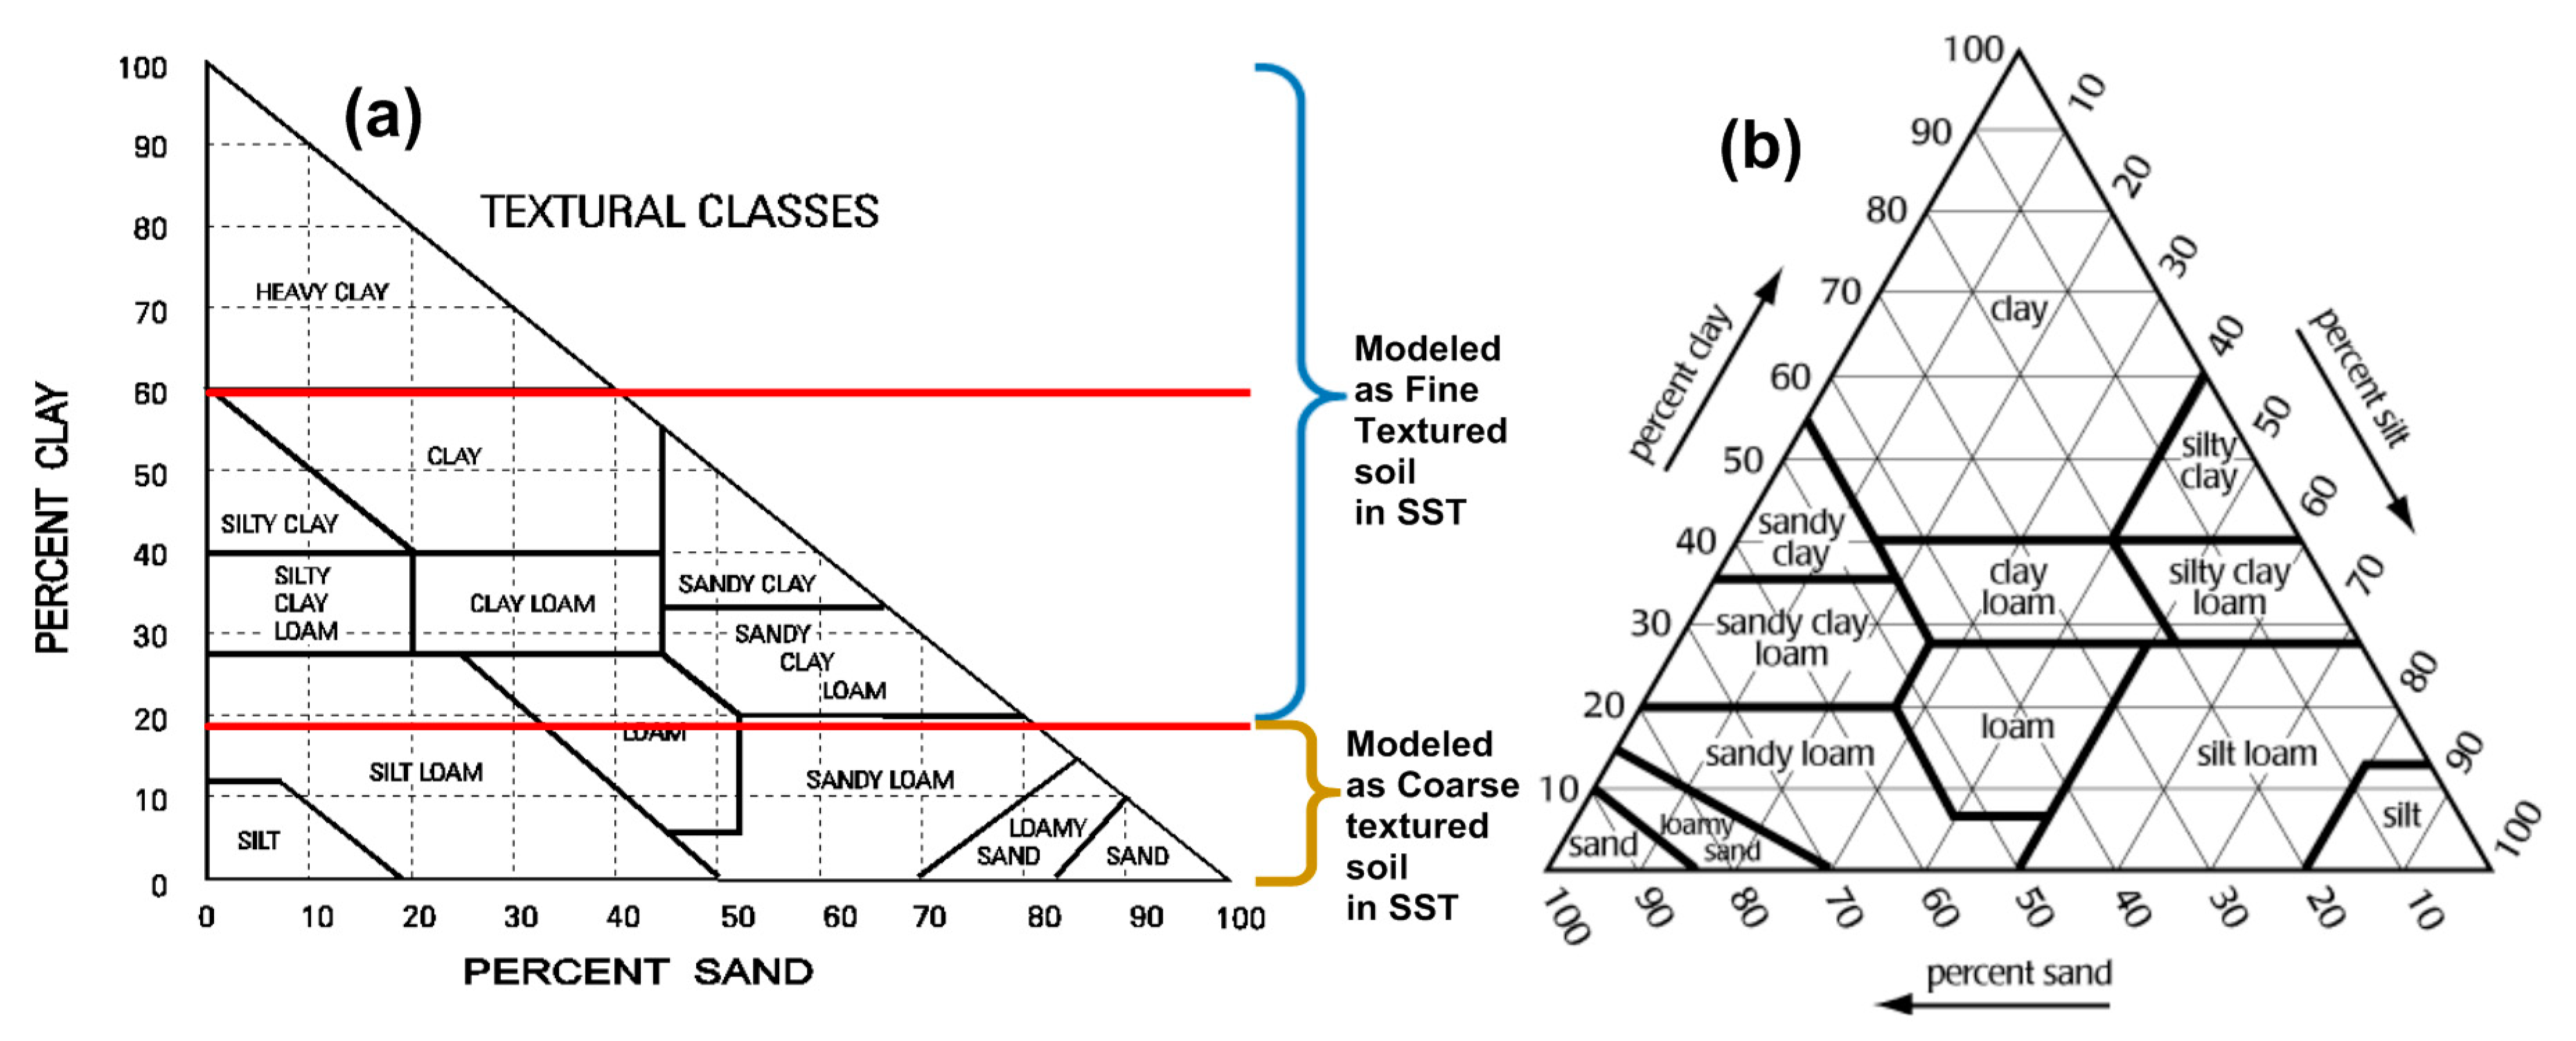
As mentioned earlier, two sets of soil hydraulic properties, namely SWCC and unsaturated hydraulic conductivity function, are required for the solution of unsaturated flow equation. Both of these properties can be measured in the laboratory and in the field. Field or laboratory measurements for unsaturated soil hydraulic properties are difficult, time-consuming and costly [29]. Therefore, several methods have been proposed to estimate soil hydraulic properties from easily measured soil properties, e.g., texture, bulk density, and particle size distribution. A review of the techniques over the last two decades has been reported recently [30]. Figure 3 compares the Canadian system of soil classification to the system used by the United States Department of Agriculture (USDA). It can be observed that the two procedures of soil classification are very similar. For current soil salinity guidelines [9], two generalized soil lithology groupings (coarse and fine) are used to categorize soil texture at sites across Alberta. These lithology groupings are marked on the Canadian system of soil classification, shown in Figure 3. It can be observed that lithology groupings represent a wide range. For example, fine-grained groups can have anywhere between 18% to 100% clay fraction.
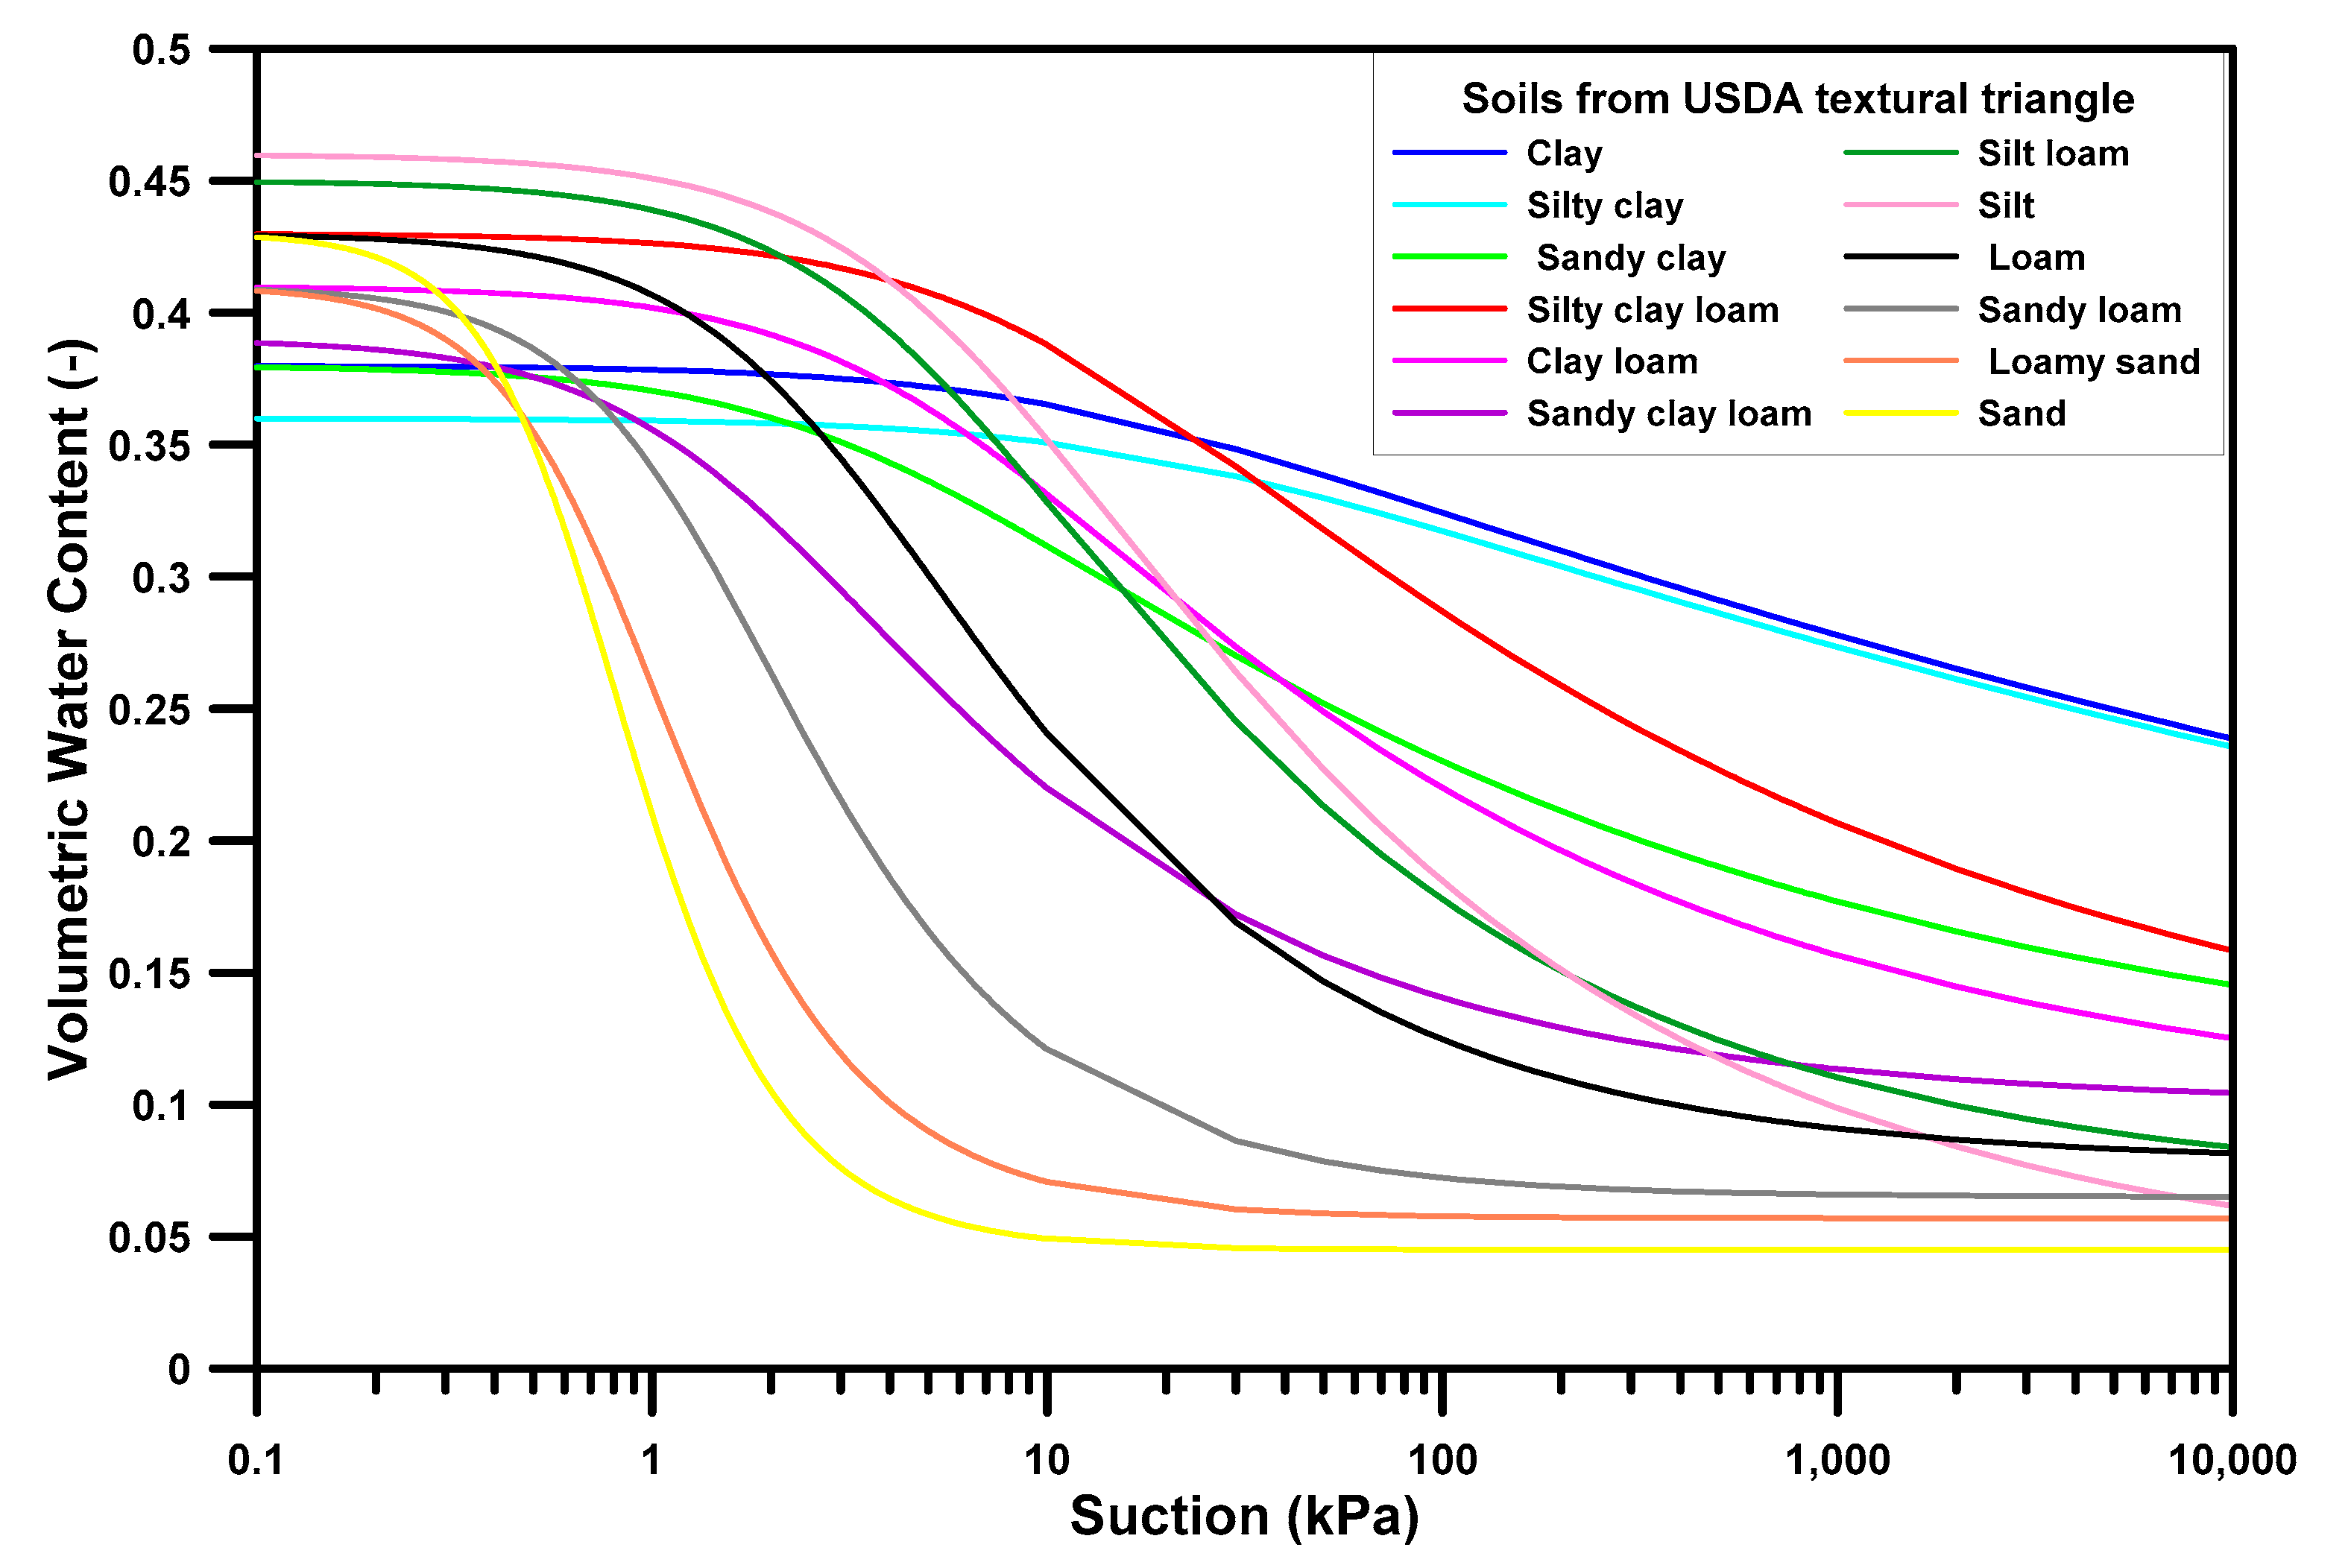
Figure 4 shows the SWCCs for all different USDA textural classes. These SWCCs are available in Hydrus-1D soil catalogue and are approximately averages for the different USDA textural classes. The curves were developed using multiple linear regression from a large database of some 2540 soil horizons by various researchers [31,32]. For the current research, two different soil types (sand and clay) were considered. The soil hydraulic properties of selected soil types were taken from the above-mentioned soil catalog available in Hydrus-1D. The SWCC used are shown in Figure 4. It should be noted that the selection was made to compare and contrast the water and salt transport for two entirely different types of textural classes corresponding to coarse- and fine-grained materials. In instances where any site-specific soil information is available, one can use the computer program Rosetta [33], which employs pedotransfer functions (PTFs) to predict van Genuchten [19] water retention parameters and the saturated hydraulic conductivity. Rosetta offers five different PTFs and uses a hierarchical approach, which allows for the estimation of hydraulic parameters using limited (textural classes only) to more extended (texture, bulk density, and one or two water retention points) input data. This hierarchical approach allows for optimal use of available input data. Rosetta is available as a dynamically linked library in Hydrus-1D.
3.3. Model Development
The model was comprised of a one-dimensional (1D) soil column with a 3 m depth. This was in line with recommendation in the literature for shallow-rooted vegetation covers [34]. In all simulations, an atmospheric BC with a surface RO was imposed at the top of the column. The top boundary was comprised of the nine-year daily climate records. The simulations were only run for the active period of the calendar year. The active period represents thawed ground conditions, when precipitation can either make its way into the ground as I, or can flow away as a RO [25]. Running the simulations only for the active period greatly reduces the unnecessary complexities and higher computation time [25], and this approach has been successfully used and described in the literature [12]. The active season for each ecoclimatic region was estimated by a detailed statistical analysis of daily records of maximum, minimum and average temperatures for the nine-year period.
In this paper, the analysis of the effect of climate type on water and salt dynamics was based on the climate classification of various regions in Alberta (Figure 1). For the study of the dry climatic condition, the climate data from the Calgary region was used. The analysis of semi-arid climatic condition (or neutral climatic condition) was carried out using climate data from the Lloydminster region. The Bighorn region was chosen for the analysis of the sub-humid climate (or wet climate condition). A zero-gradient water flow BC was set at the bottom of the column to simulate free drainage; this is representative of deep groundwater table conditions [15].
For the simulation of the solute transport, a non-reactive solute input source equal to a relative concentration of 1.0 was assumed to be located at a depth between 1.0 m and 1.5 m. A concentration flux BC was used as the upper boundary and a zero-concentration gradient was assumed as the lower BC. The period of analysis considered for the salt transport simulation matched with the compiled nine-year continuous climate data for the active period.
For coarse materials, the solute migrated through the domain in less than 3 years. However, for fine materials, the solute movement was substantially slower than in coarse materials. Therefore, simulations were run for the 18-year period by combining the two nine-year climate datasets.
4. Results and Discussion
4.1. Arid Climatic Condition
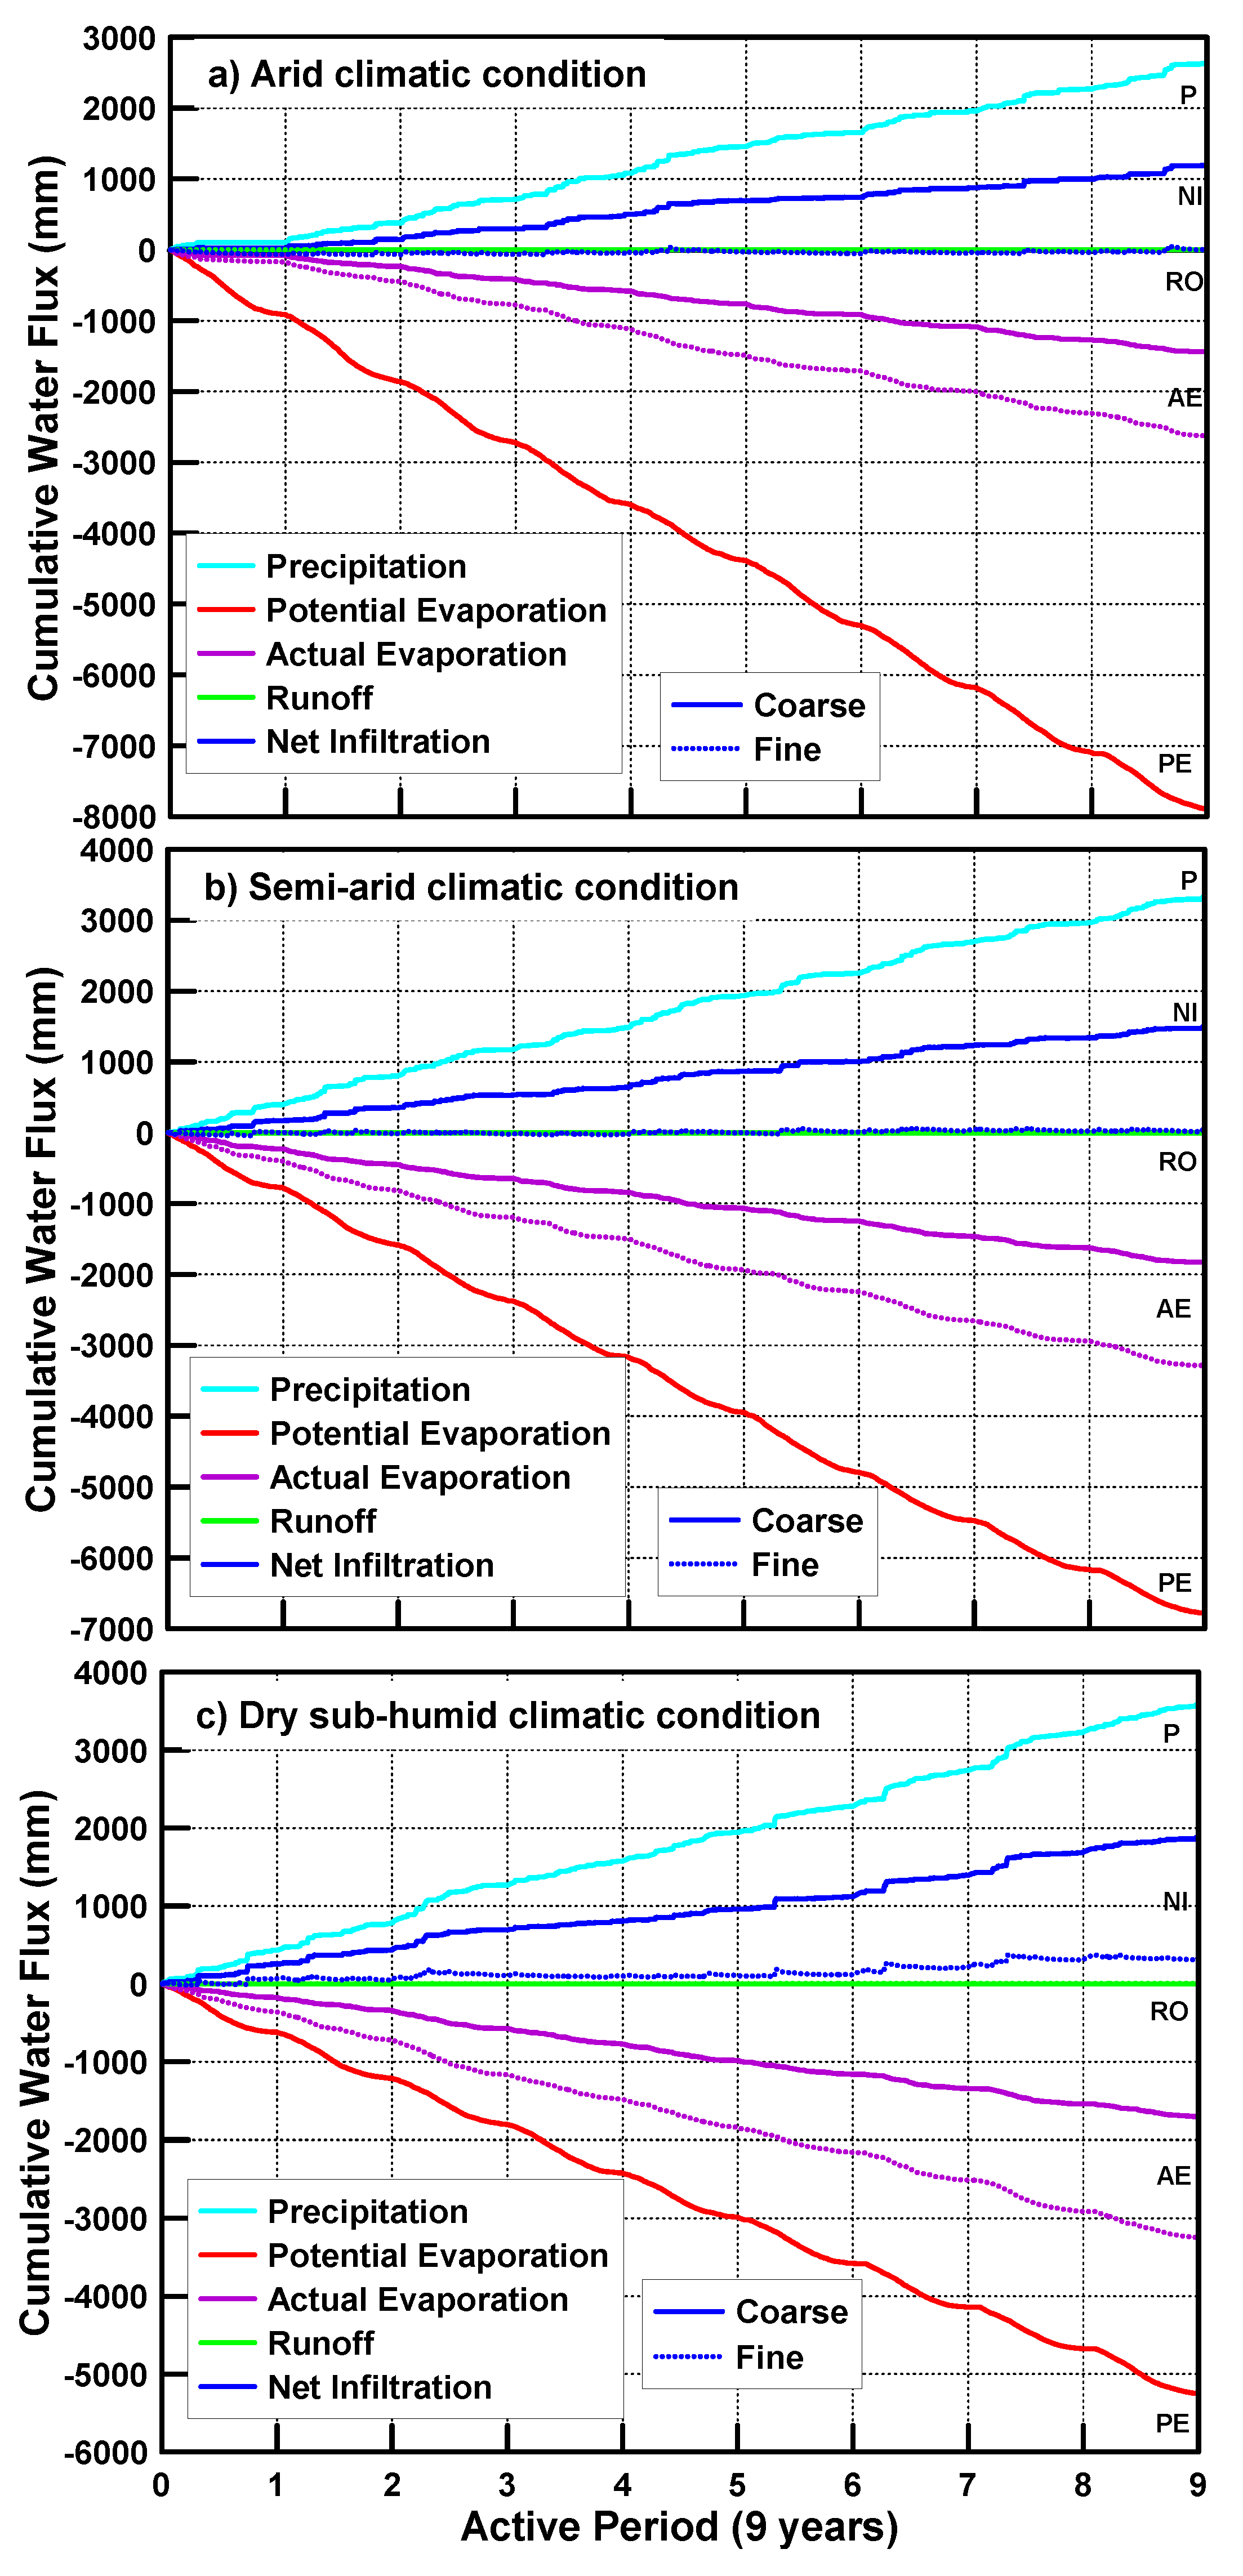
Figure 5a summarizes the water balance at the ground surface for simulations run with fine and coarse soil hydraulic properties for arid climatic conditions. The results presented are cumulative values over 9 years of an active period. The quantities that appear as negative values represent water leaving the system or water loss, while positive values represent water entering the system or water gain conditions. Net infiltration (NI) is the quantity of precipitation that overcomes the E and makes its way into the soil column. It is estimated as the difference of precipitation and sum of the AE and the surface RO.
The review for Figure 5a indicates that AE values for coarse- and fine-grained show significant differences. The cumulative AE value of fine-grained material is 80% more than the AE value for coarse-grained material. This difference is attributed to fine material’s lower hydraulic conductivity value and higher water retention when compared to coarse-grained material. The fine material tends to hold more water in the near-the-surface soil layers owing to its higher retention capacity and lower hydraulic conductivity resulting in higher AE. The difference in AE values for fine and coarse materials results in different water balance conditions at the ground surface.
From the NI plot for coarse materials, it can be observed that there is water gain of 1187 mm over the nine-year period. This amount is approximately 50% of the average yearly precipitation. These observations lead one to conclude that for coarse materials, there would be a significant amount of downward water movement in the system as 50 percent of the meteoric water makes its way into the soil profile. On the other hand, the NI plot for fine-grained soil materials indicates that there is minimal or no water loss or gain at the ground surface. This indicates that for the fine-grained soil materials, most of the meteoric water will be lost by E at the ground surface. Based on this observation, and considering the fact that the system is a representation of deep groundwater table condition, it can be concluded that there probably would be no appreciable downward or upward water movement in the system.
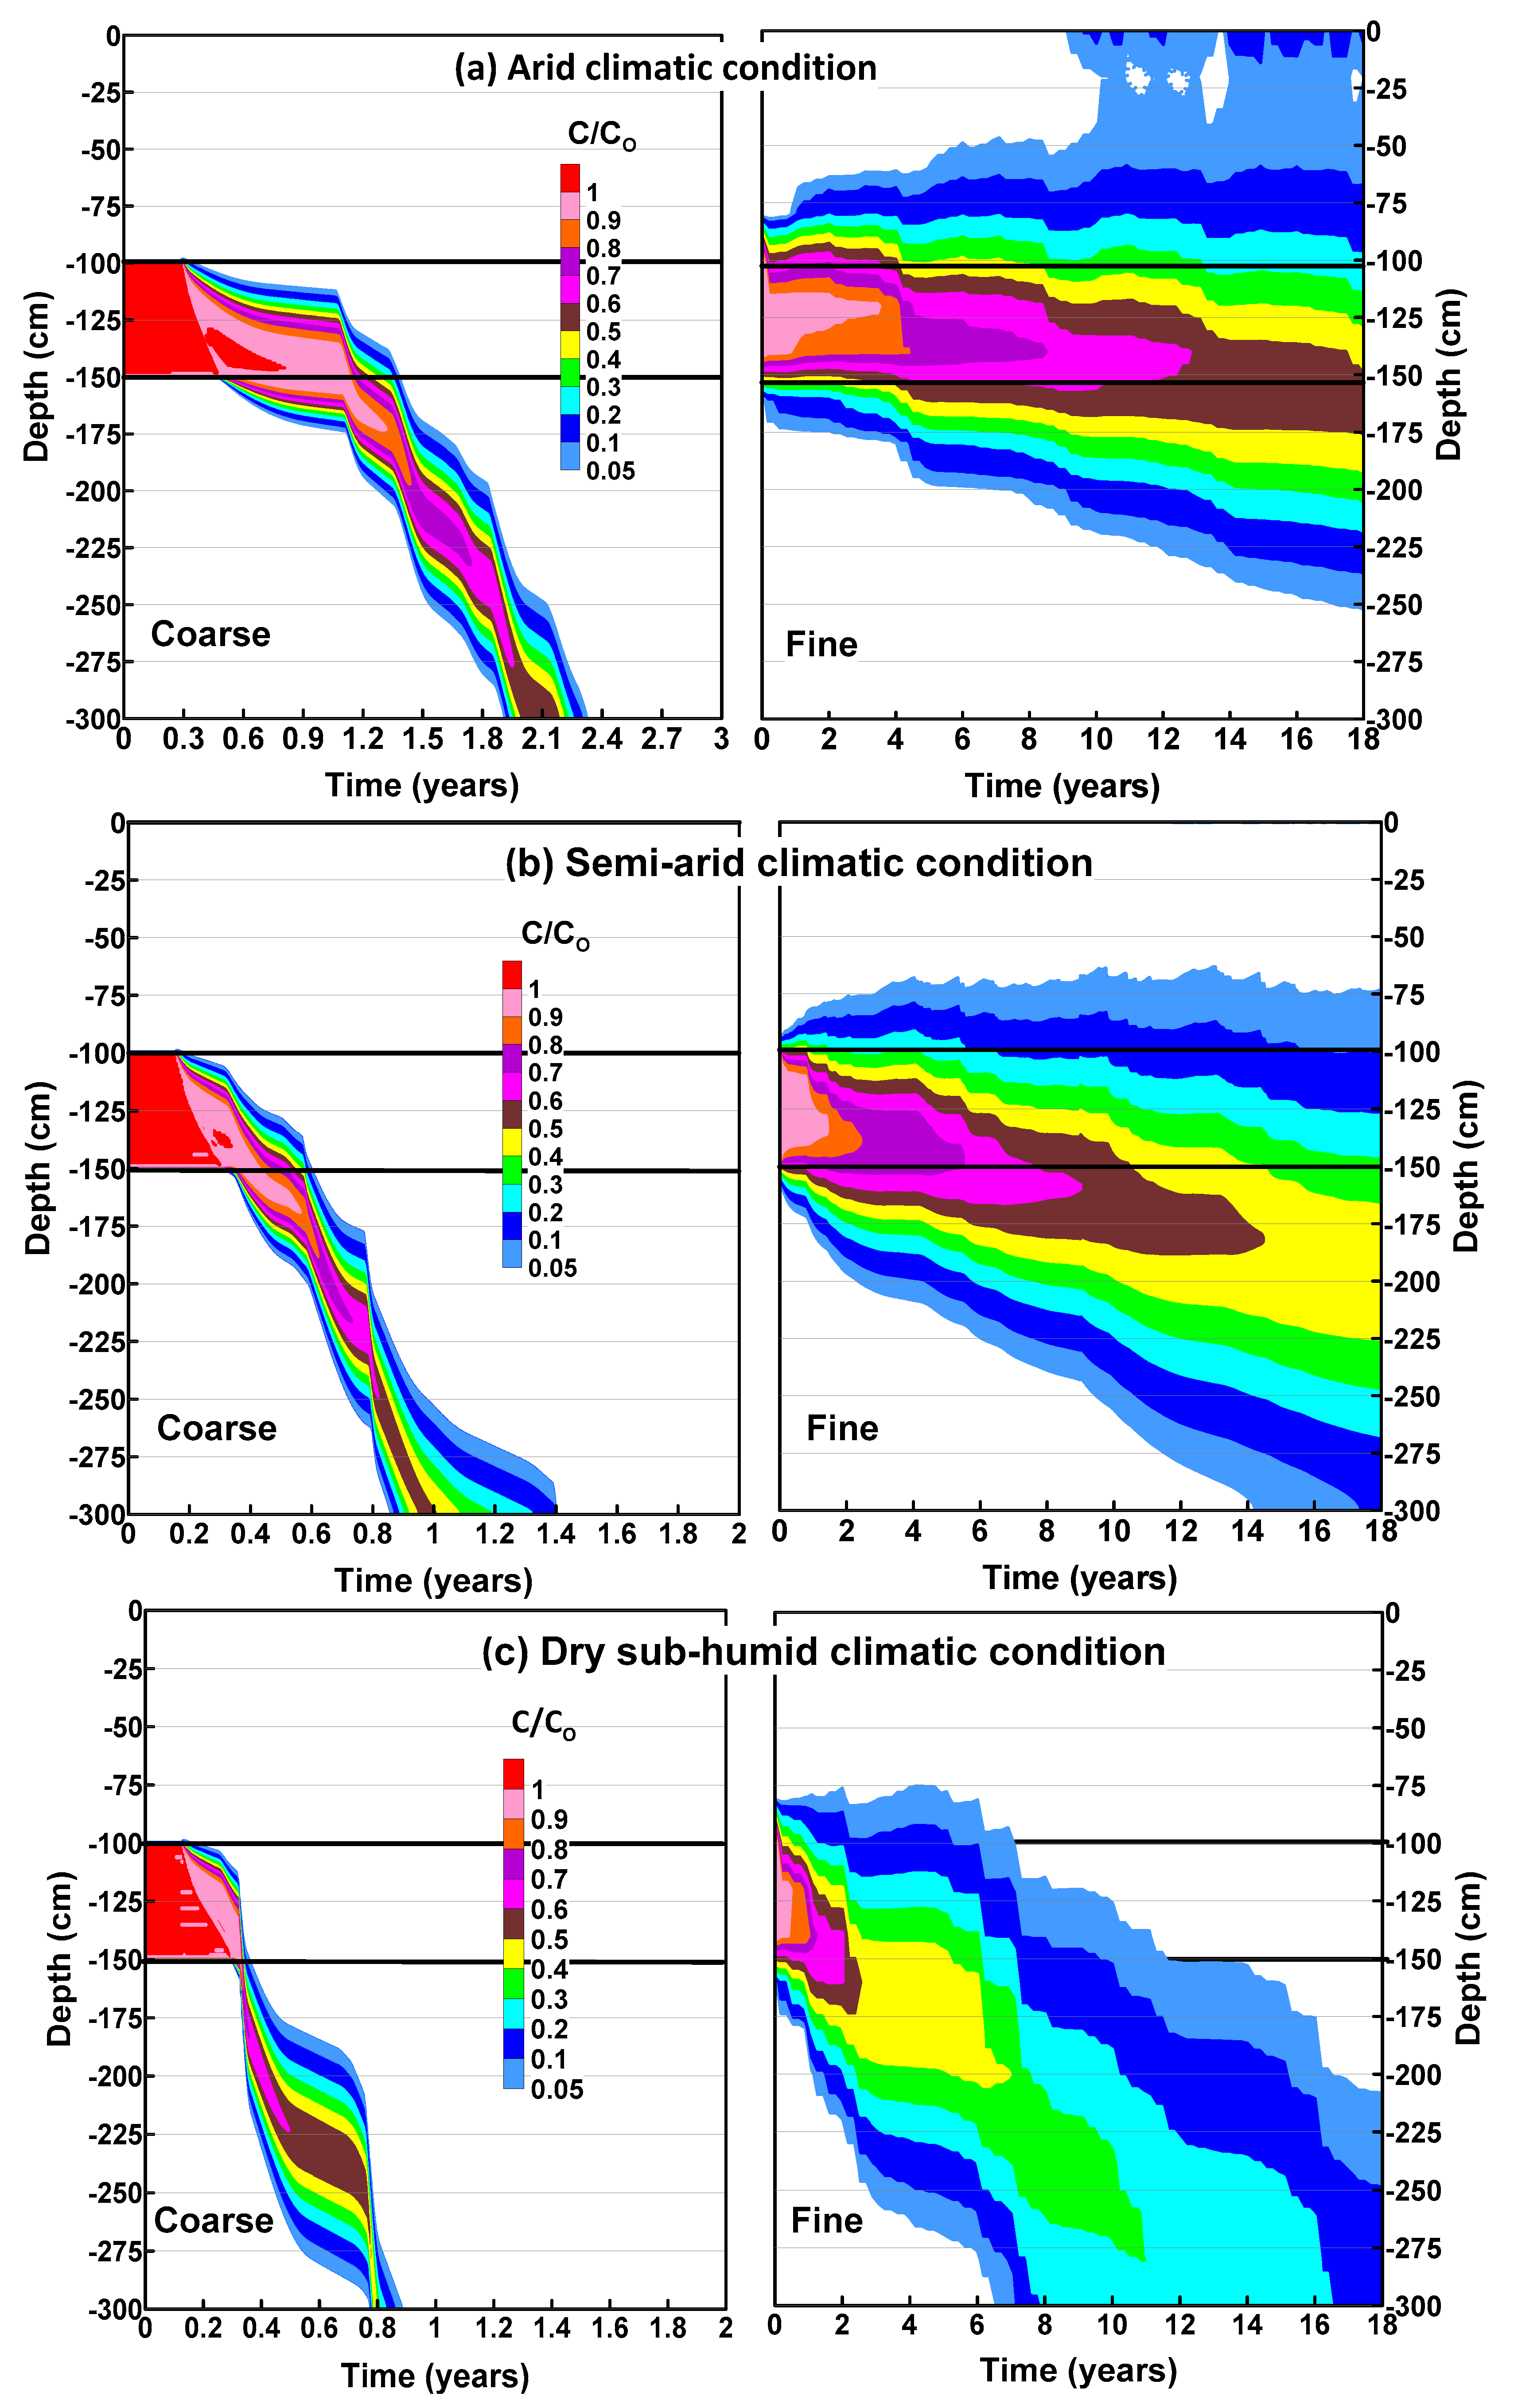
Figure 6a shows results of solute displacement in coarse- and fine-grained materials over the simulated period for arid climatic conditions. These concentration contours provide vertical distribution of solute over a period of three years for coarse-grained materials and 18-year period for fine-grained materials. These different time periods relate to the time taken by the solute to reach any of the model boundaries.
Two black horizontal continuous lines are drawn in Figure 6a to represent the initial location of the salt. Graphical results indicate that soil texture has a strong effect on the rate and direction of the salt movement. For instance, in the homogenous coarse-grained soil material, the direction of the salt displacement is exclusively downwards. The estimated time for the infiltrating water to fully drain the initial solute concentration appears to be slightly less than 2.4 years. The salt movement depicted in Figure 6a is consistent with the water balance results presented previously. In Figure 5a, it was shown that for coarse-grained soil materials, almost half of the meteoric water makes its way into the soil profile overcoming E. In addition, it was concluded that the water movement in the system will be predominantly downwards. Therefore, the salt movement results for coarse-grained materials shown in Figure 6a are consistent with anticipated behavior. The results also clearly indicate that even for dryer climatic conditions, there is a potential for the salt to migrate downwards over a short period of time to potentially impact deeper groundwater resources.
Results from simulation run with fine soil hydraulic properties illustrate the spreading of solute in both upward and downward directions (Figure 6a). There appears to slightly higher affinity for the solute to move in the downward direction. These observations are consistent with the water balance results for the fine-grained soil profile. As mentioned above, little or no water loss or gain was predicted at the ground surface for the fine-grained material. Therefore, the I of meteoric water in the soil domain was expected to be minimal. However, any downward water movement in the system is expected to be due to gravity drainage. Upward movement, if any, would have been attributed to either capillary rise from the groundwater table or upward diffusion due to the concentration gradient. Considering that the depth of ground water table is deep, it can be concluded that in fine-grained materials, the upward vertical solute displacement would be a diffusion-dominated transport process. The difference in more slightly downward migration could be due to slight downward advection in the system owing to the gravity drainage and downward diffusion due to the concentration gradient. The results for the fine-grained material in arid climatic conditions clearly indicate that there is a potential for the salt to migrate into the root zone.
4.2. Semi-Arid Climatic Condition
The results for water balance at the ground surface for coarse- and fine-grained materials under semi-arid climatic conditions are shown in Figure 5b. These results appear to be quite similar to those for arid climatic conditions presented in Figure 5a. Results in Figure 5b, once again, show no RO for either fine- or coarse-grained materials. The numerical model predicts ROs when the soil near the ground surface becomes saturated and the potential surface flux at the ground surface (P-PE) exceeds the saturated hydraulic conductivity of the soil [12]. The maximum precipitation intensity for semi-arid climate is 2.6 mm/h based on daily average data. This value is two orders of magnitude lower than the Ks of the coarse-grained material and only 0.6 mm/h higher than the Ks of the fine-grained material. However, there was only one precipitation event greater than 2.0 mm/h during the period of analysis. Therefore, the RO was expected to be negligible.
The cumulative AE value of fine-grained soil material over 9 years for semi-arid climatic conditions was approximately 70% higher than the AE of coarse-grained material. The difference between these values is due to difference in conductivity and retention properties of the coarse- and fine-grained soil materials as explained in the previous section.
The NI values for semi-arid climatic conditions are also plotted in Figure 5b, indicating net water gain conditions for coarse-grained materials and near neutral conditions for fine-grained materials. These values are higher than those for arid climatic conditions owing to larger precipitation events, and lower potential and AE. For coarse-grained materials, approximately 50% of meteoric water makes its way in the soil profile. In comparison with arid conditions, although it is a similar percentage of meteoric water, it accounts for approximately 25% more water influx at the ground surface (NIsemi-arid/NIarid = 1.25). This observation leads one to conclude that the downward movement in coarse-grained materials for semi-arid climatic conditions could potentially be higher than that in arid climatic conditions.
For fine-grained materials, less than 2% percent of the meteoric water made its way into the soil profile. Although it is a very small quantity, in comparison with arid conditions, it can be expected that on a relative basis, there could be more downward water movement.
Figure 6b shows the migration of salt under semi-arid climatic conditions in coarse- and fine-grained soil materials. The results are consistent with the water balance conditions for this region. It can be observed that there is downward migration of salt for both coarse- and fine-grained soils, as a result of water gain conditions at the ground surface. In coarse-grained materials, the higher amount of infiltrating water (NI = 1498 mm) resulted in faster downward solute displacement throughout the soil domain.
In coarse-grained materials, the estimated time to drain 50% of the initial concentration out of the domain is less than one year. The downward solute displacement resulted in an average seepage rate of 150 mm/year. In comparison to arid conditions, the rate of downward migration in semi-arid conditions is much faster. The total time to flush out all the solute from the soil domain reduces to 1.4 years from 2.4 years. This can partially be explained by the fact that more water flux at the ground surface makes its way into the soil domain, when compared to that under arid conditions. For semi-arid conditions, the downward solute displacement in fine-grained soils is much slower than that in coarse-grained soil. For instance, it took over 14 years for the 5% contour curve to reach the bottom of the soil column. In terms of solute displacement rate, 50% of the initial concentration moved from the source to the bottom of the soil column at an approximate seepage rate of 12.9 mm/year. Important to note is that in semi-arid climatic conditions, the vertical solute displacement shows a downward trend in comparison with arid climatic conditions, where for up to 18 years none of the solute reached the bottom boundary.
4.3. Dry Sub-Humid Climatic Condition
Figure 5c shows the water balance at the ground surface for sub-humid conditions. A review of this figure indicates that similar to arid and semi-arid regions, there is no RO for either coarse- or fine-grained materials. The maximum precipitation intensity for this region’s climate is 2.9 mm/h based on daily average data. This value is two orders of magnitude lower than the Ks of the coarse-grained material (Ks = 297 mm/h) and only 0.9 mm/h higher than the Ks of the fine-grained material (Ks = 2.0 mm/h). However, this event was recorded to occur only once over the 9-year period considered in this study.
The NI values for dry sub-humid climatic conditions plotted in Figure 5c show the highest net water gain for both coarse- and fine-grained materials for the three different climatic conditions considered in this study. For coarse-grained materials, more than half of meteoric water would enter in the soil domain based on the calculated net infiltration–precipitation ratio (NI/P = 54%). This water gain is higher when compared to semi-arid climatic conditions (NIdry-subhumid/NIsemi-arid = 1.32) and arid climatic conditions (NIdry-subhumid/NIarid = 1.66). This observation leads one to conclude that the downward solute displacement would be faster than the semi-arid climatic conditions and much faster than that in arid climatic conditions.
For fine-grained materials, the cumulative ratio NI/P indicates that approximately 10% of meteoric water would overcome E. This ratio turned out to be greater than that of semi-arid climatic conditions. This is consistent with results shown in Figure 5b,c, where the total cumulative precipitation value (P) for dry sub-humid climate is 7% higher and total cumulative PE is 22% lower than the values for semi-arid climatic condition.
Results from dry sub-humid climatic conditions show a similar trend, as described in previous climatic conditions. A review of Figure 5c indicates a large difference between the AE values for coarse- and fine-grained materials. The computed total cumulative PE value in dry sub-humid climatic conditions (5300 mm) is lower than those from Calgary and Lloydminster regions (6687 mm and 7953 mm, respectively). The cumulative AE/PE ratio of fine-grained soil material (61%) is approximately 100% higher than the AE/PE ratio of coarse-grained material (32%). As mentioned in previous sections, the difference can be attributed to fine material’s lower hydraulic conductivity value and higher water retention properties compared to the coarse-grained material.
A review of Figure 6c shows the fastest downward salt movement response in both course- and fine-grained materials among the three different climatic conditions in the province of Alberta, Canada. For instance, in the coarse-grained material (Figure 6c), the estimated time for the salt to reach the bottom of the soil column is less than 1 year. The estimated salt movement indicates a seepage rate of 374 mm/year. It is important to note the rapid downward salt displacement occurred throughout the first water year of analysis, which is in line with the meteorological data behavior as explained before. This can also indicate a higher risk of aquifer contamination for natural areas having higher humid climatic conditions.
Figure 6c also shows the salt displacement for the fine-grained material in dry sub-humid climatic conditions. The results are consistent with the observations derived from water balance. In this figure, it can be observed that the spreading of concentration contours extends beyond the limits of the 18-year of analysis. It is noted that the amount of the infiltrating water was not enough to drain the total mass of the contaminant out of the soil domain. In this graph, the 5% contour curve indicates the threshold of salt displacement located at the bottom of the soil column at the 7th year. The estimated salt movement for the 5% concentration contour indicates a seepage rate of 44.7 mm/year.
4.4. Detailed Water Balance Assessment
A review of Figure 5 indicates a general trend of cumulative amount of water gain (NI) in the soil domain over the nine-year period. The water gain is larger for wetter climates, i.e., more P and less E. It was also observed that larger water gain conditions result in faster vertical solute transport. The following graphical information presents the water balance for the whole domain. First, an analysis of the input to the models in the form of precipitation and PE intensities is presented, followed by the detailed water balance. These results further enhance our understanding of the system in relation to various climate and soil types.
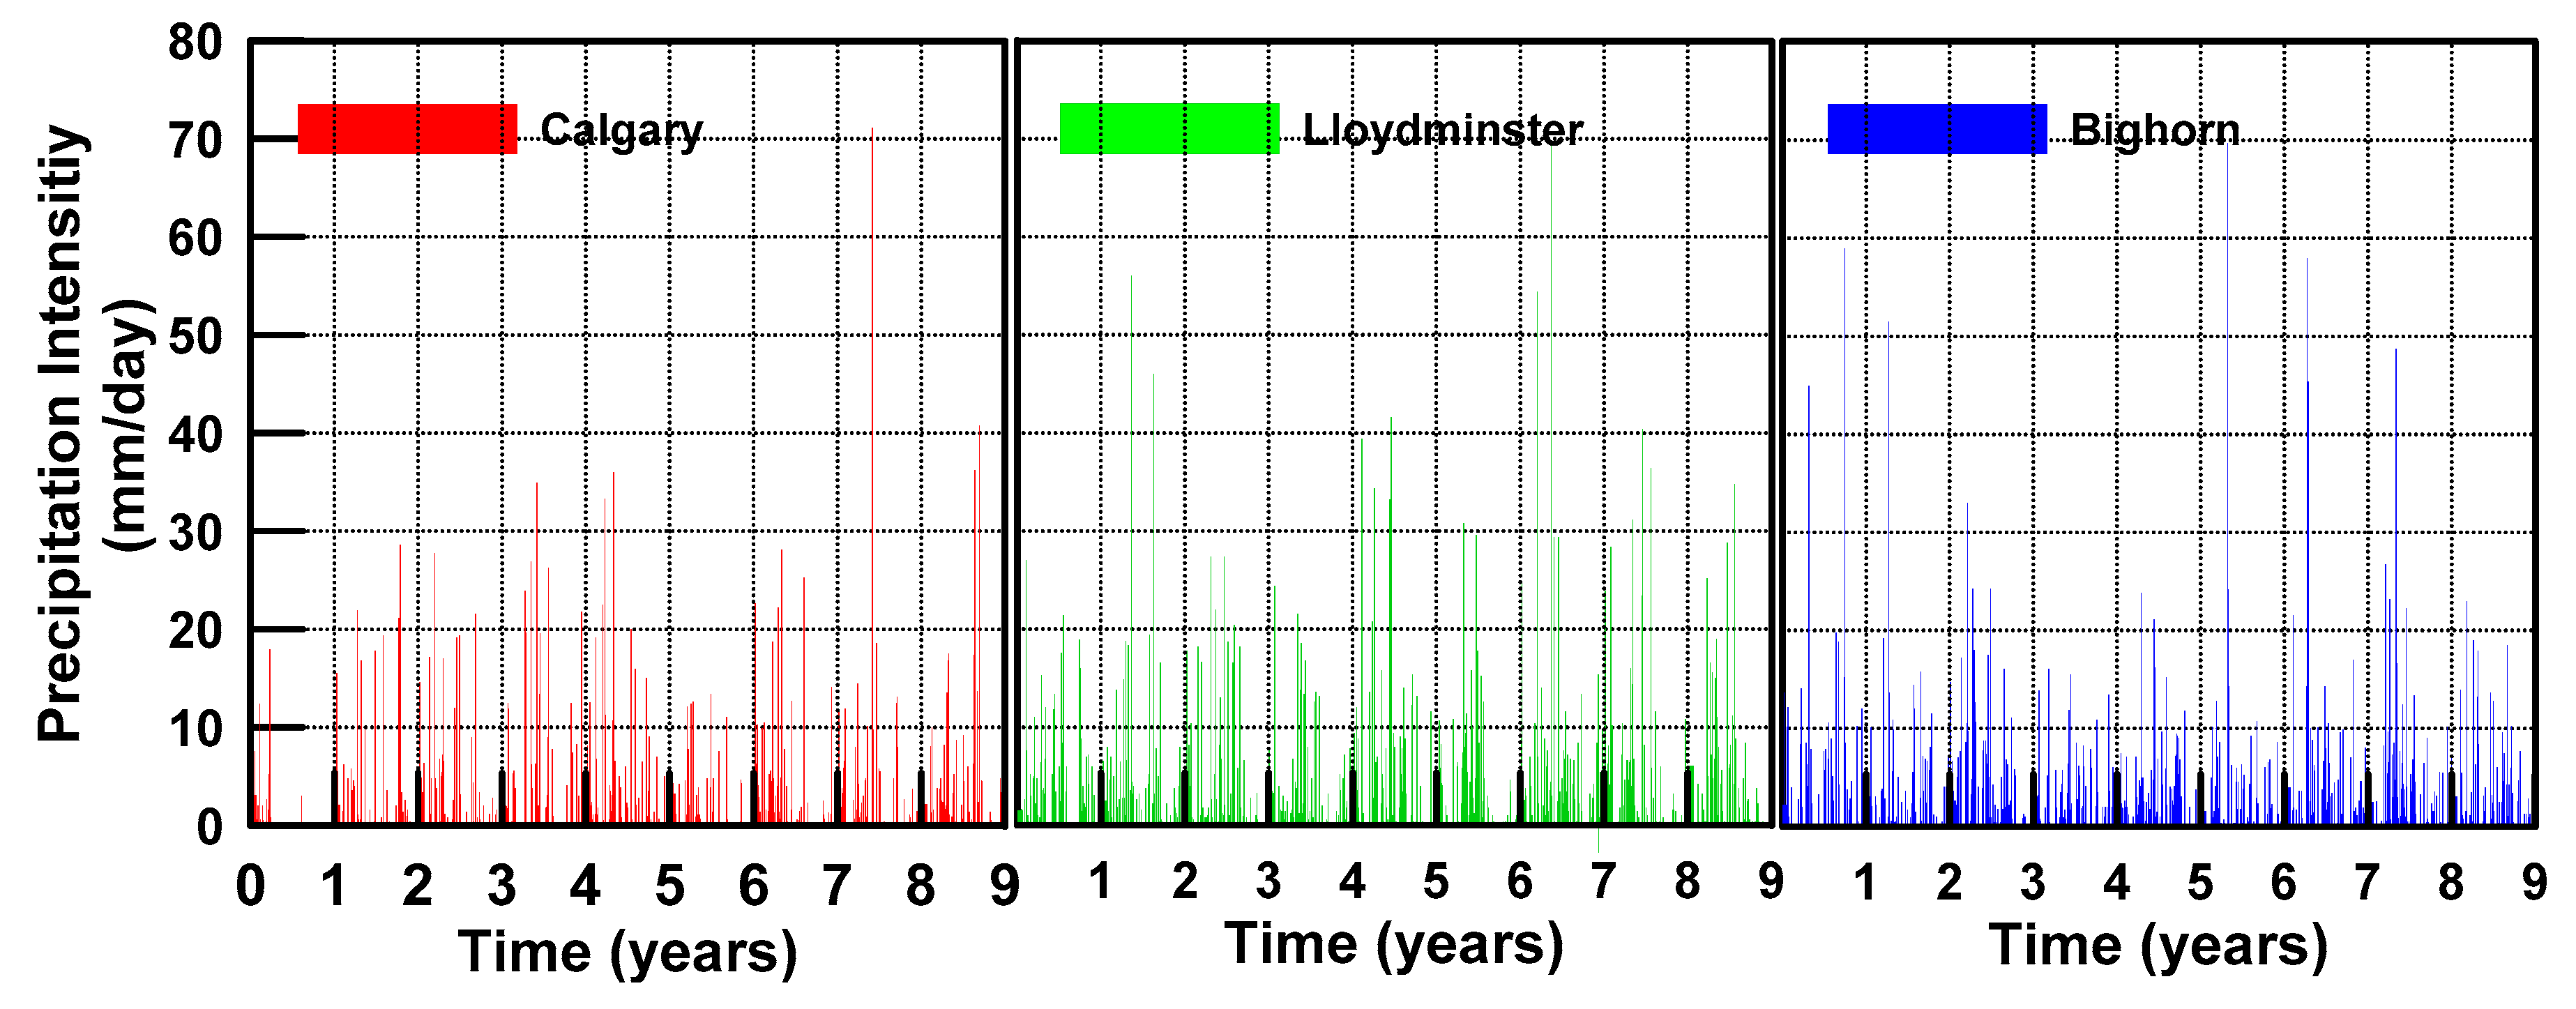
Figure 7 provides a graphical comparison of the precipitation records for the three different climatic conditions used in the analysis. Precipitation records from arid climatic conditions show the lowest precipitation occurred during the first year of analysis, amounting to only 108 mm. For the same first water year, the Lloydminster and Bighorn precipitation records show quite similar precipitation quantities with cumulative yearly values of 397 and 418 mm, respectively. The presentation of the records in this manner indicates that the precipitation intensities appear to be quite similar, at least from a visual perspective. Therefore, it is not possible to observe changes in the precipitation pattern that can potentially affect water and solute dynamics over time. Further analysis of precipitation intensities, and occurrence of events of specific intensity are presented below.
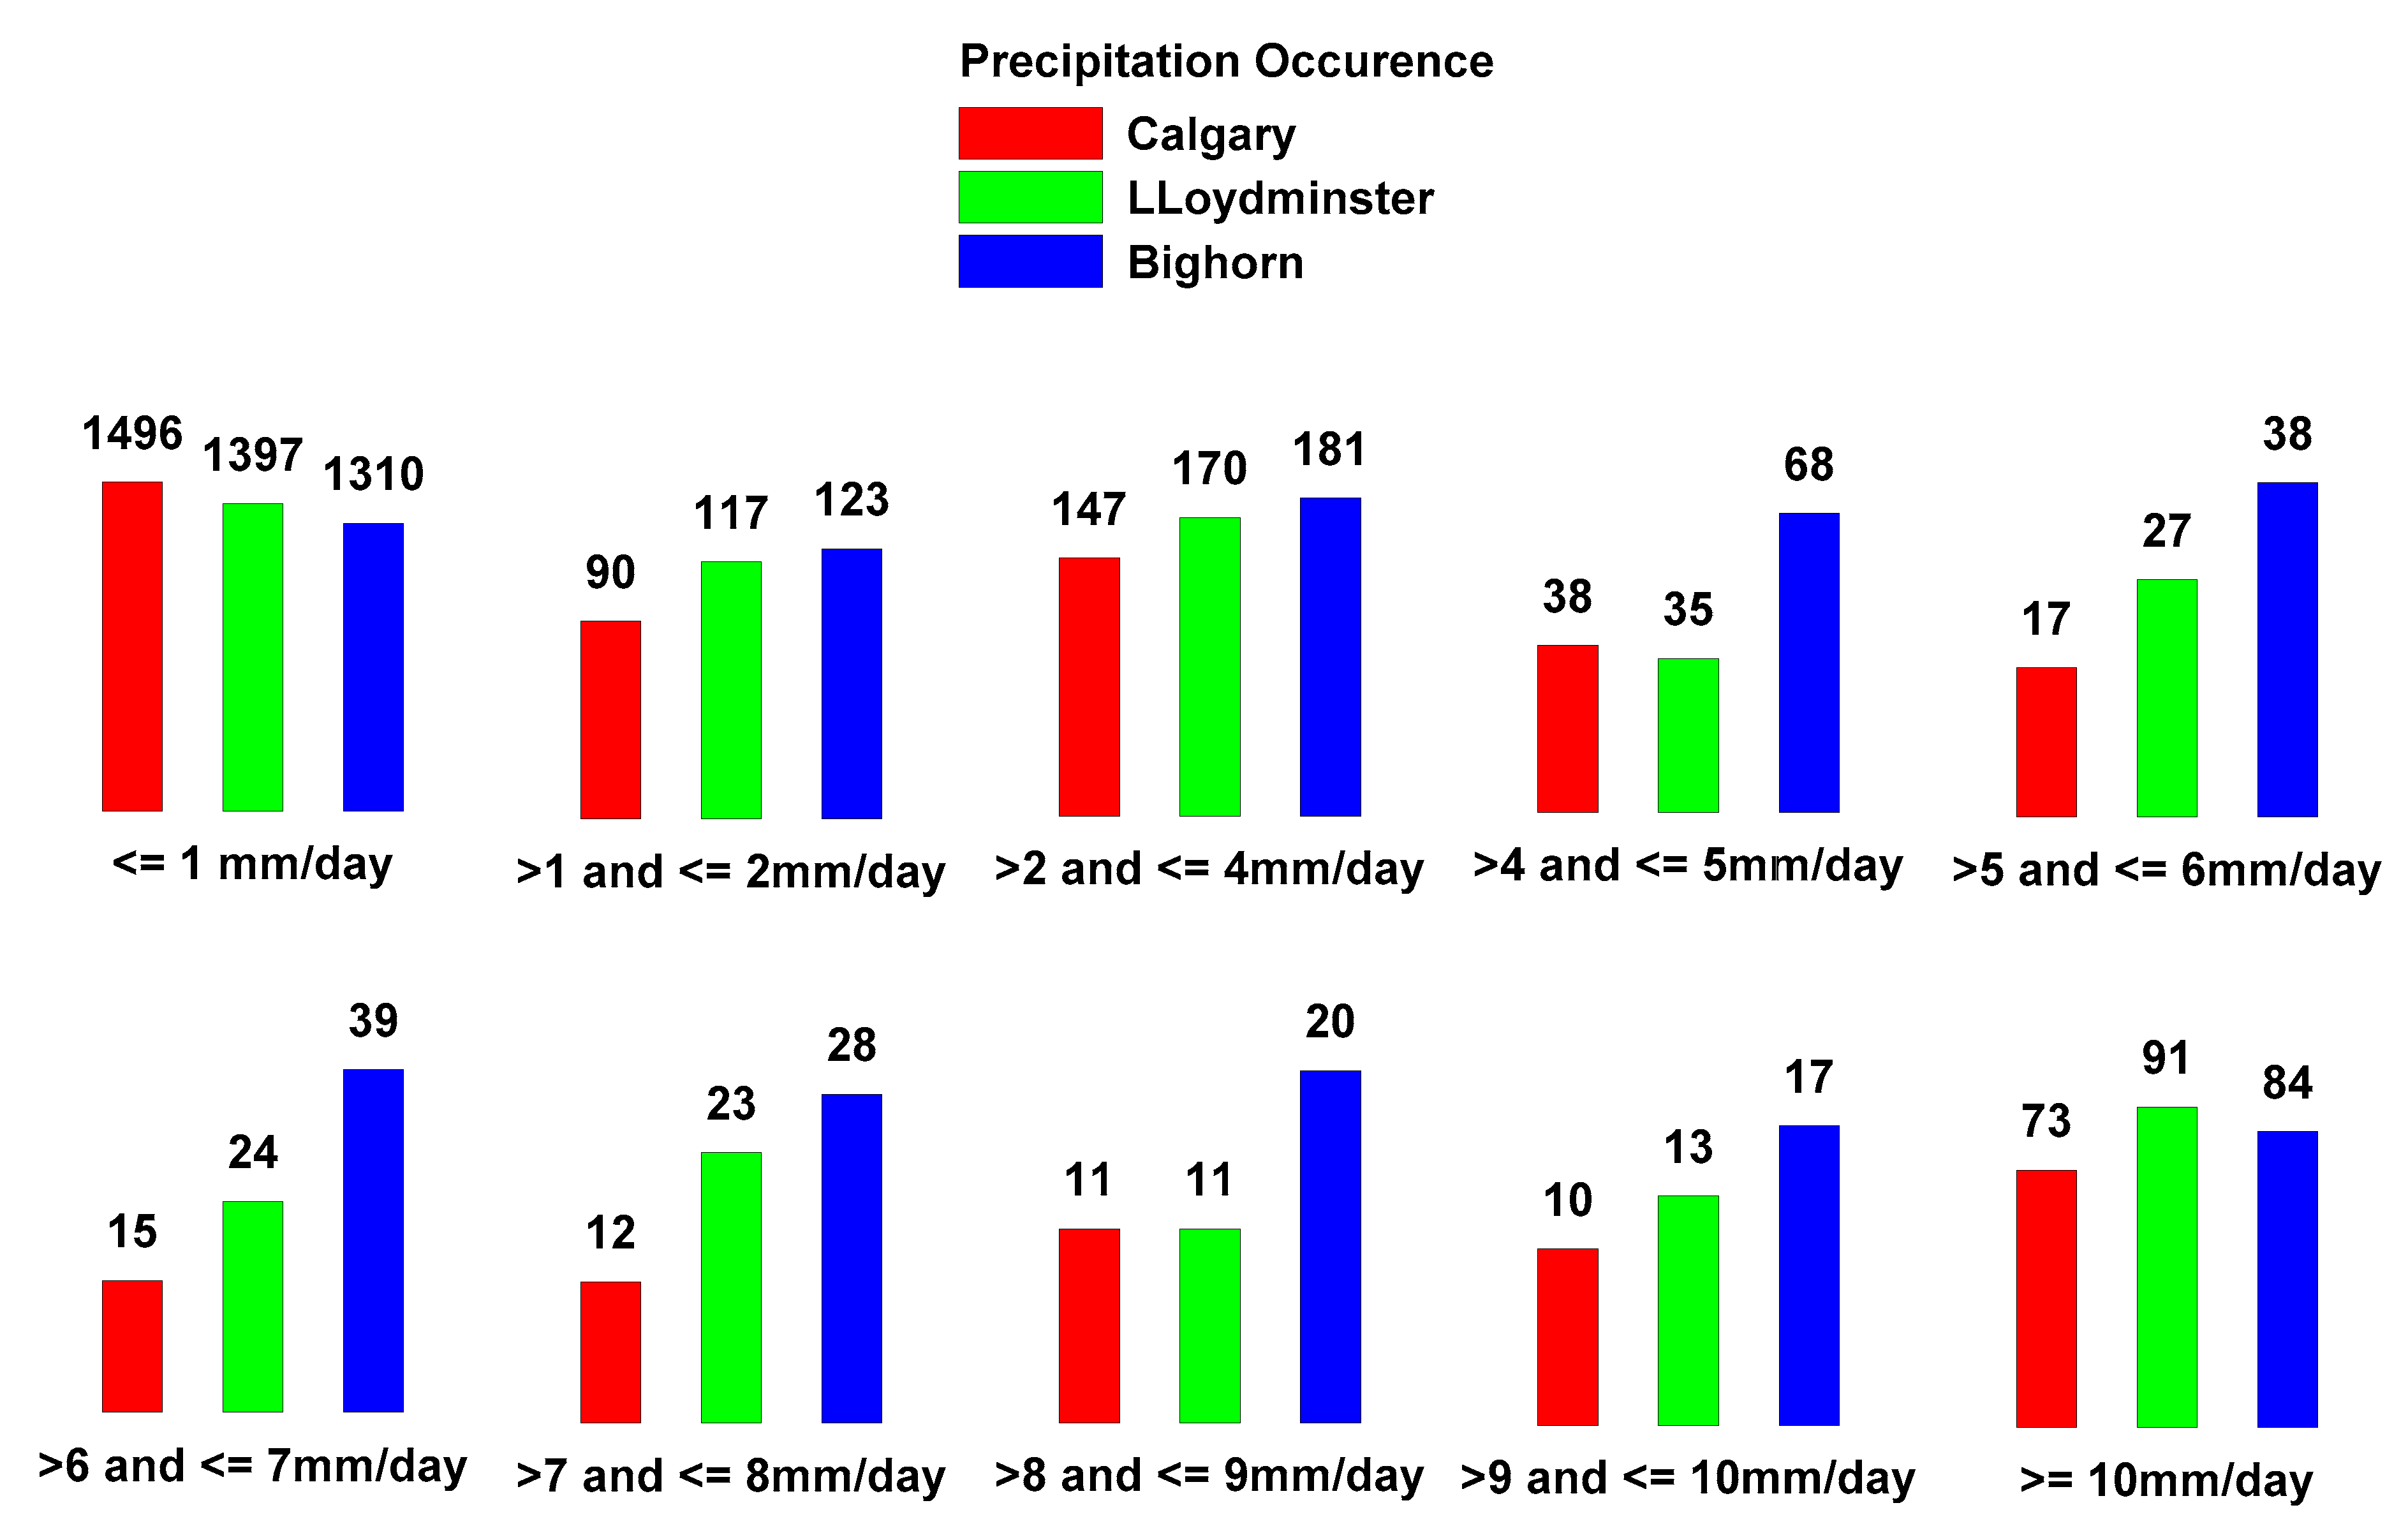
The occurrence of precipitation events was estimated and is plotted in Figure 8. The plot indicates that the Bighorn region (dry sub-humid) clearly has higher occurrence of larger precipitation events compared to Calgary (arid) and Lloydminster (semi-arid climatic conditions). It can also be observed that Calgary appears to have the highest occurrence of precipitation events of less than 1 mm. In general, it can be concluded that for the nine-year period considered in this study, Bighorn appears to have higher occurrence of larger precipitation events, followed by Lloydminster and Calgary. It is important to note that for same precipitation quantity, a higher intensity event can result in faster solute transport.
Figure 9 shows the statistical evaluation of the PE values for the three different climatic conditions in the form of Box and Whisker plots. Graphical results indicate that the highest median value is for the arid climatic condition (4.4 mm/day, marked by a horizontal line in the red box). Conversely, the Bighorn region (blue box) shows the lowest median value (2.9 mm/day). It can also be observed that for arid climatic conditions, PE values show much larger variation in comparison with those of the semi-arid and dry sub-humid climatic conditions (from 0.6 to 7.9 mm/day, displayed with vertical lines). A review of this figure clearly indicates that the daily PE values for Calgary are highest followed by Lloydminster and Bighorn. This observation implies that over a given time period, the water balance and associated water and solute transport could be different as a result of difference in quantity and distribution of PE.
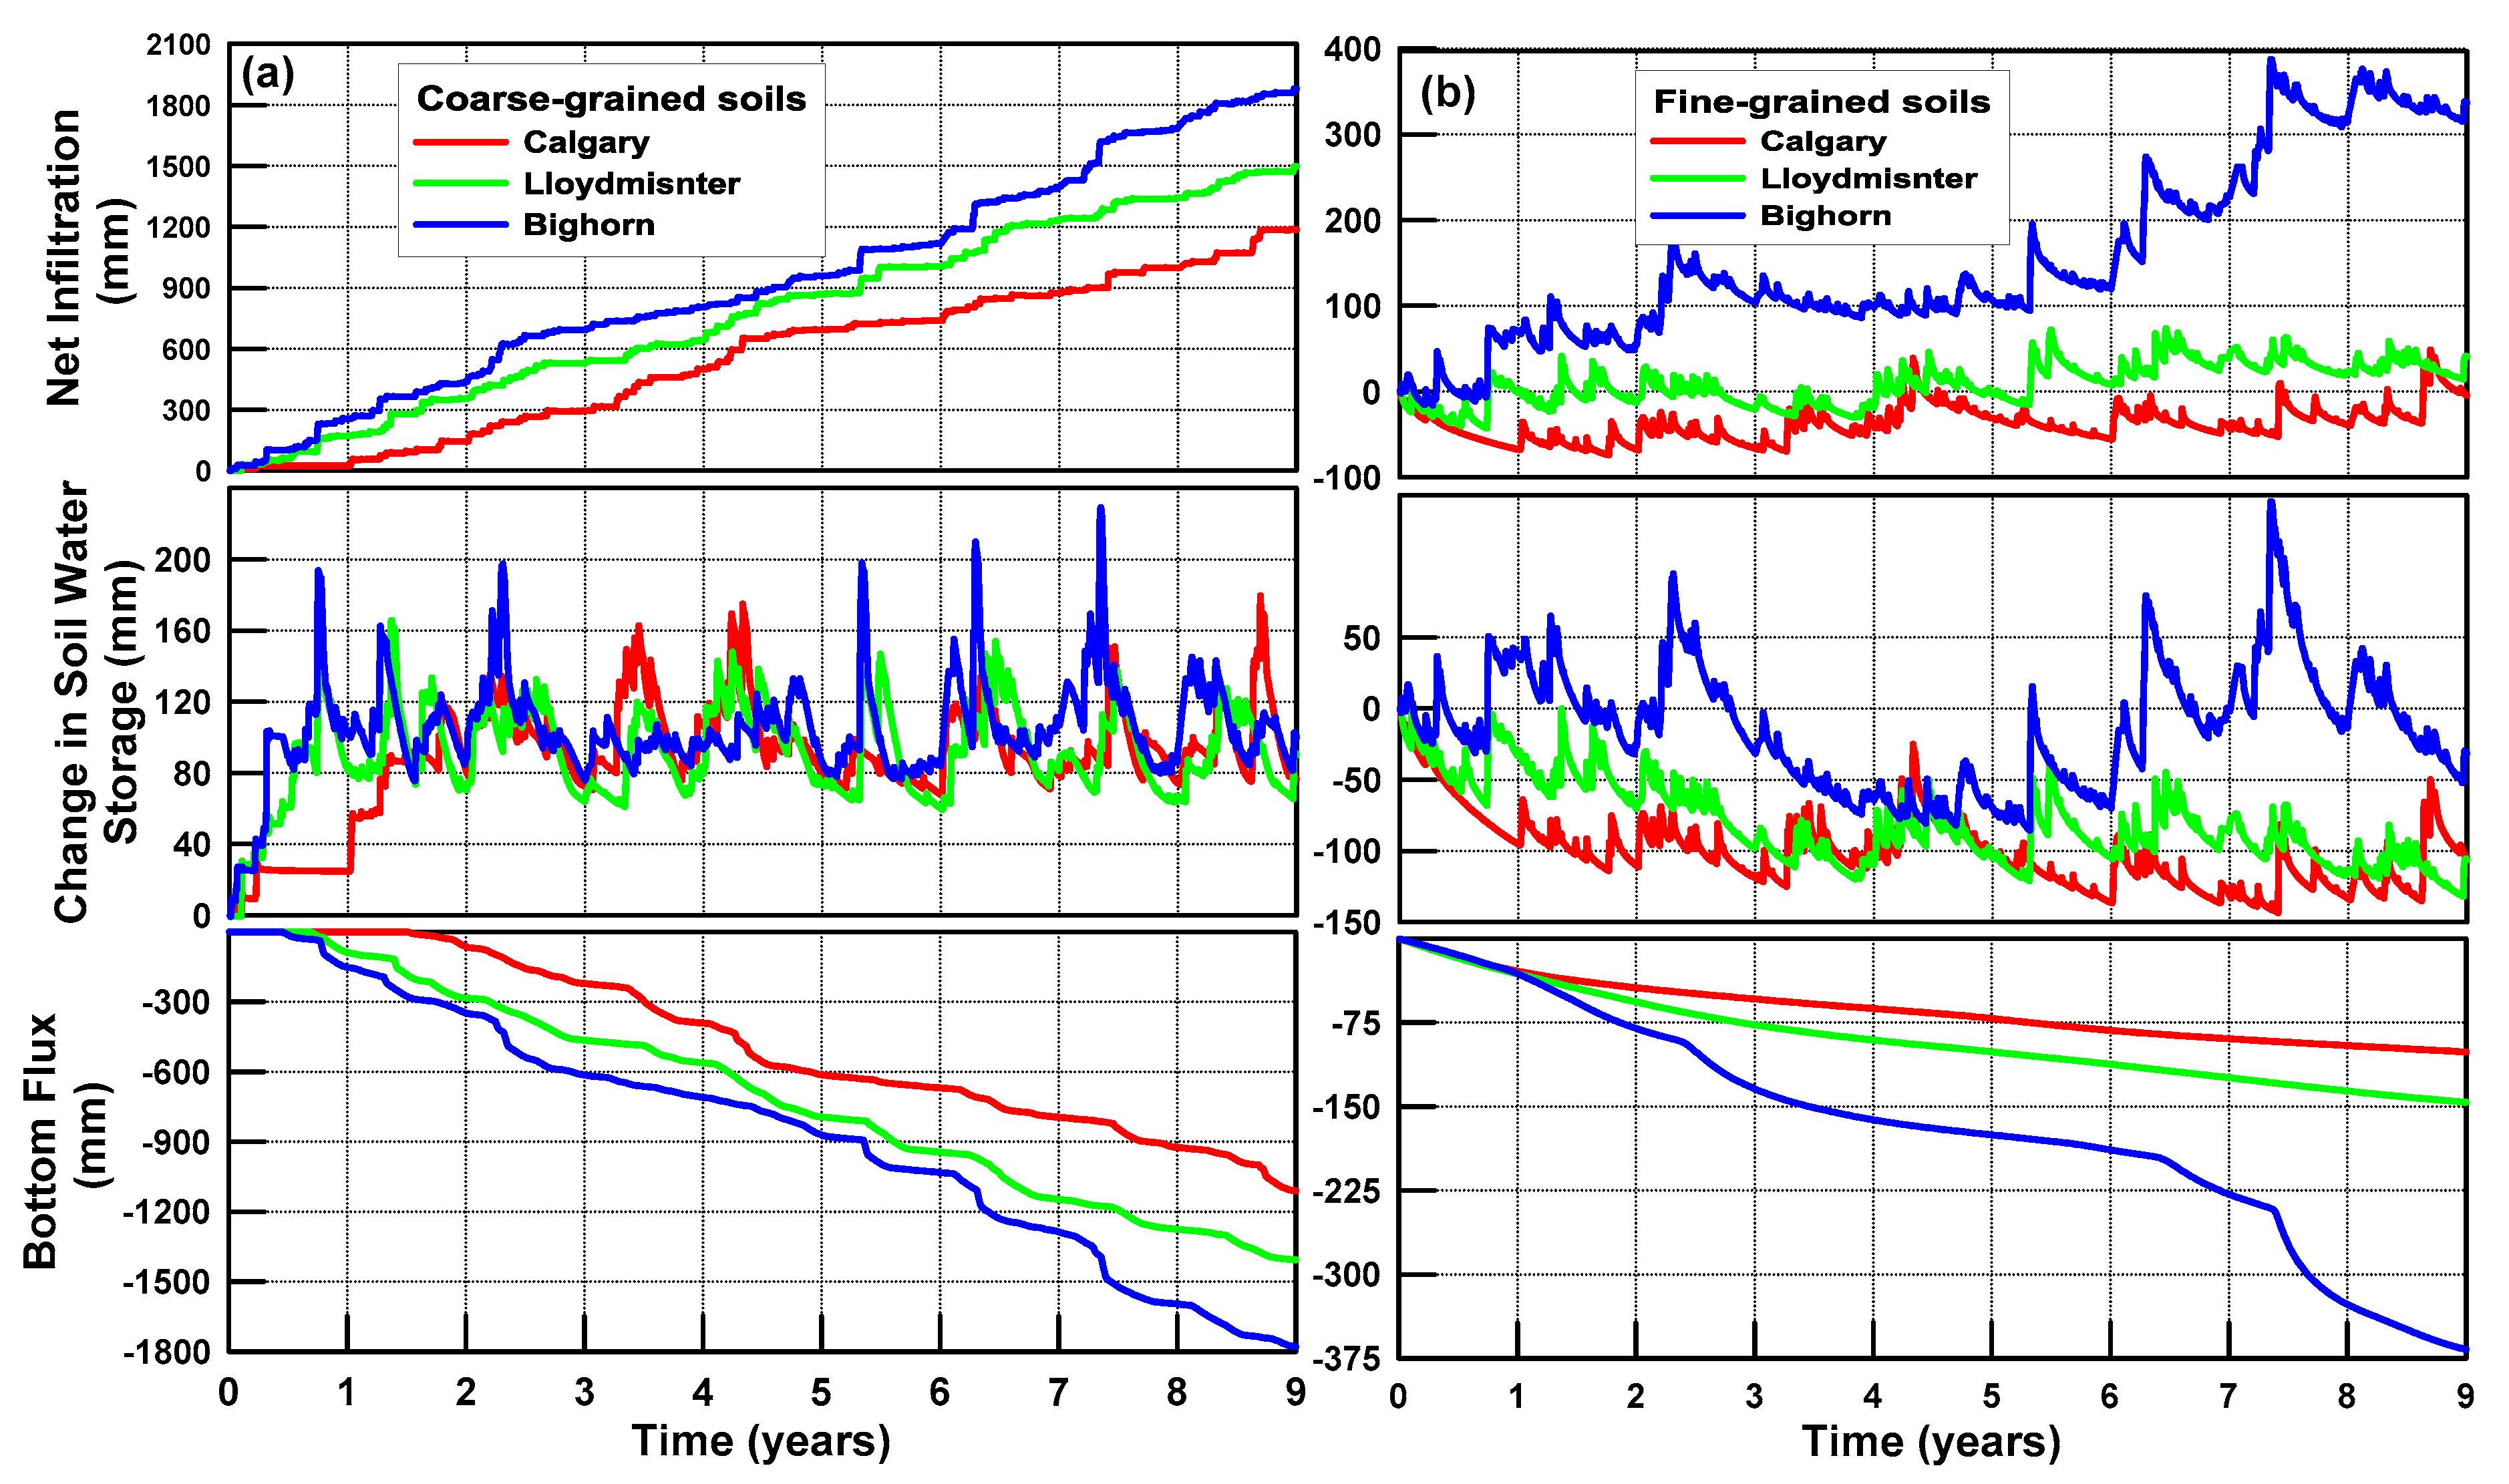
Water balance for simulation run with coarse soil hydraulic properties (Figure 10) indicate water gain (positive NI values) in the following order: Calgary region, 1187 mm; Lloydminster region, 1498 mm; and Bighorn region, 1880 mm. This observation leads one to conclude that most of meteoric water that enters the soil domain exists on the bottom boundary of the soil domain. Consistent with the NI values, the cumulative bottom flux (BF) values are highest for Bighorn followed by Lloydminster and Calgary, hence supporting the observation of fastest solute transport for the Bighorn region. The differences in the NI and BF values match closely with the change in water storage in the domain. Change in water storage results reveals that although the cumulative values at the end of nine-year period are quite similar for the three regions, the Bighorn region shows much higher saturation during the simulated period.
Water balance results for fine-grained soil materials shown in Figure 10 are in contrast to those for coarse-grained soils. It can be observed that the NI values for Bighorn (336 mm) and Lloydminster (41 mm) show water gain conditions, while the NI values for Calgary (−2 mm) present water loss conditions. The total cumulative BF values over the simulated period were: Calgary region, −101 mm; Lloydminster region, −146; and Bighorn region, −367 mm. These observations imply that overall, for all three climate types, the soil domain goes through water loss. The difference between the amounts of water coming in and out of the system is consistent with the water storage values. Depletion of water storage implies that the saturation within the soil domain will be lower, resulting in less advective transport.
5. Concluding Remarks
The climate classification carried out for 10 different locations in Alberta indicated that the climate in Alberta varies from arid to dry sub-humid climatic conditions. This classification was based on the estimation of annual moisture index, Im (Thornthwaite and Hare, 1955) [27]. An Im value of zero signifies that the annual precipitation and PE are equal. The compiled data revealed that for the province of Alberta, annual PE values are higher than the annual precipitation values. As such, in general, moisture loss conditions can be expected across the province. However, it should be noted that the Im and many other indices such as Thornwaite moisture index (TMI, as cited by Thornwaite, C.W., 1948) [26] are estimated based on the assumption that limitless supply of water is available to meet the evaporative demand dictated by prevailing atmospheric conditions. This assumption is only valid for water bodies or soil surfaces, which always remain saturated. The AE is not only the function of prevailing atmospheric conditions but also the transient soil moisture conditions. This is essentially the crux of this research as it was shown that transient soil moisture conditions are a function of soil texture and play a crucial role not only in subsurface flow and transport but also in the water balance at the ground surface. The accurate estimation of the AE requires a multiyear accurate climate dataset. Therefore, it can be concluded that the site-specific climate data are essential for accurate estimation of water balance at a particular site.
Numerical simulation results for water balance at the ground surface and vertical transport of the solute in variably saturated profiles indicated that the effect of climate type is closely linked to the soil texture.
It can also be concluded that the hydraulic properties of the soil, namely soil water characteristic curve and hydraulic conductivity, play a very important role in water balance at the ground surface. Coarse-grained materials have low retention and high conduction, facilitating the downward movement of the meteoric water. This makes them good E soil barriers, resulting in positive water balance at the ground surface, regardless of the climate type. However, the quantity of water gain and associated advective fluxes are a function of climate. Coarse materials in wetter climate are expected to have higher water gain at the ground surface and larger downward advective flux values. Net water gain conditions at the ground surface, however, would result in downward movement of salt and therefore pose a risk for contamination of deeper groundwater resources. The risk of contamination of deeper groundwater resources for coarse-grained environments will be higher for wetter climates.
Flow and transport in fine-textured soils seem to be even more dependent on the climate type. For arid climatic conditions, net water loss conditions exist for fine-grained soils. This is the result of the meteoric water, being held in soil layers closer to the ground surface due to higher retention and lower conduction of fine-grained soils. Although such soils restrict the downward migration of the solute, upward transport to the root zone is probable. Therefore, for fine-grained materials and arid climatic conditions, it can be concluded that the vertical upward solute displacement from a diffusion-dominated transport process can contaminate near-surface soil layers. For wetter climates, the upward migration of salt in fine-grained soils is less probable. The results indicate that even very small quantities of water gain at the ground surface can induce enough downward advection to limit any upward diffusion. Based on the results, it can also be concluded that for fine-grained soils in wetter climates, there is a higher probability of the salt to remain near the vicinity of its original location for longer periods of time.
Author Contributions
R.B. conceived and designed the modeling study. E.P.C. carried out the modeling study. Analysis was carried out by R.B. and E.P.C. R.B. laid out the manuscript. R.B. and E.P.C. contributed to the writing of the manuscript.
Funding
This work was supported by an internal grant provided by Lassonde School of Engineering, York University to the first author.
Conflicts of Interest
The authors declare no conflicts of interest.
References
- Zekser, I.; Everett, L. Groundwater resources of the world and their use. In IHP-VI, Series of Groundwater No. 6; Unesco: Paris, France, 2004; ISBN 92-9220-007-0. [Google Scholar]
- Ruttherford, S. Groundwater Use in Canada. West Coast Environmental Law. 2004. Available online: https://tinyurl.com/y76g7ekl (accessed on 5 November 2018).
- Šimůnek, J. Models of water flow and solute transport in the unsaturated zone. In Encyclopaedia of Hydrological Sciences; Anderson, M., McDonnell, J., Eds.; John Wiley: Chichester, UK, 2005; pp. 1121–1144. ISBN 9780471491033. [Google Scholar]
- Robertson, C.; Ratiu, I.; Bures, G. In-Situ Remediation of Brine Impacted Soils and Groundwater Using Hydraulic Fracturing, Desalinization and Recharge Wells; Remediation Technologies Symposium: Banff, AB, Canada, 2006; Available online: https://tinyurl.com/y9hypgj4 (accessed on 6 November 2018).
- Alberta Environment (AENV). Salt Contamination Assessment & Remediation Guidelines; Environmental Sciences Division, Environmental Services, Alberta Environment: Edmonton, AB, Canada, 2001; ISBN 0-7785-1717-9. [Google Scholar]
- Li, X.; Chang, S.; Salifu, K. Soil texture and layering effects on water and salt dynamics in the presence of a water table: A review. Environ. Rev. 2014, 22, 41–50. [Google Scholar] [CrossRef]
- Anderson, M.; Woessner, W. Applied Groundwater Modeling; Academic Press: Cambridge, MA, USA, 1992; 381p, ISBN 978-0120594856. [Google Scholar]
- Yang, F.; An, F.; Ma, H.; Wang, Z.; Zhou, X.; Liu, Z. Variations on soil salinity and sodicity and its driving factors analysis under microtopography in different hydrological conditions. Water 2016, 8, 227. [Google Scholar] [CrossRef]
- Alberta Government. Subsoil Salinity Tool Help File (Version 2.5.3). Equilibrium Environmental Inc., 2014. Available online: goo.gl/hZsgzE (accessed on 17 May 2018).
- Natural Regions Committee. Natural Regions and Sub-Regions of Alberta, Natural Regions Committee; Downing, D.J., Pettapiece, W.W., Eds.; Government of Alberta Publ. No. T/852; Natural Regions Committee: Edmonton, AB, Canada, 2006. Available online: goo.gl/b3MaUx (accessed on 27 April 2017).
- Bashir, R.; Sharma, J.; Vardon, P. Discussion: Climatic influence on geotechnical infrastructure: A review. Environ. Geotech. 2015, 2, 249–252. [Google Scholar]
- Bashir, R.; Sharma, J.; Stefaniak, H. Effect of hysteresis of soil-water characteristic curves on infiltration under different climatic conditions. Can. Geotech. J. 2016, 53, 273–284. [Google Scholar] [CrossRef] [Green Version]
- Adem, H.; Vanapalli, S. Soil-environment interactions modelling for expansive soils. Environ. Geotech. 2016, 3, 178–187. [Google Scholar] [CrossRef]
- Li, Y.; Šimunek, J.; Wang, S.; Yuan, J.; Zhang, W. Modeling of soil water regime and water balance in a transplanted rice field experiment with reduced irrigation. Water 2017, 9, 248. [Google Scholar] [CrossRef]
- Šimunek, J.; Šejna, M.; Saito, H.; Sakai, M.; van Genuchten, M.T. The Hydrus-1D Software Package for Simulating the One-Dimensional Movement of Water, Heat, and Multiple Solutes in Variably-Saturated Media; Version 4.17; Department of Environmental Sciences, University of California Riverside: Riverside, CA, USA, 2013; Available online: https://tinyurl.com/yb8s7xu7 (accessed on 6 November 2018).
- He, K.; Yang, Y.; Yang, Y.; Chen, S.; Hu, Q.; Liu, X.; Gao, F. HYDRUS simulation of sustainable brackish water irrigation in a winter wheat-summer maize rotation system in the North China plain. Water 2017, 9, 536. [Google Scholar] [CrossRef]
- Richards, L. Capillary conduction of liquids through porous mediums. Physics 1931, 1, 318–333. [Google Scholar] [CrossRef]
- Šimunek, J.; van Genuchten, M. Estimating unsaturated soil hydraulic properties from tension disc infiltrometer data by numerical inversion. Water Resour. Res. 1996, 32, 2683–2696. [Google Scholar] [CrossRef]
- Van Genuchten, M.T. A closed-form equation for predicting the hydraulic conductivity of unsaturated. Soil Sci. Soc. Am. J. 1980, 44, 892–898. [Google Scholar] [CrossRef]
- Mualem, Y. A new model for prediction of the hydraulic conductivity of unsaturated porous media. Water Resour. Res. 1976, 12, 513–522. [Google Scholar] [CrossRef]
- Fredlund, D.; Rahardjo, H. Soil Mechanics for Unsaturated Soils; John Wiley & Sons, Inc.: New York, NY, USA, 1993; p. 517. ISBN 9780471850083. [Google Scholar]
- Šimunek, J.; van Genuchten, M.T. Numerical model for simulating multiple solute transport in variably-saturated soils. In Water Pollution III: Modelling, Measurement, and Prediction; Wrobel, L., Latinopoulos, P., Eds.; Computation Mechanics Publication: Southampton, UK, 1995; pp. 21–30. ISBN 1853123102. [Google Scholar]
- Bear, J. Dynamics of Fluid in Porous Media; Elsevier: New York, NY, USA, 1972; p. 764. ISBN 044400114X. [Google Scholar]
- Millington, R.; Quirk, J. Permeability of porous solids. Trans. Faraday Soc. 1961, 57, 1200–1207. [Google Scholar] [CrossRef]
- Fredlund, D.; Rahardjo, H.; Fredlund, M. Unsaturated Soil Mechanics in Engineering Practice; John Willey & Sons Inc.: Hoboken, NJ, USA, 2012; ISBN 978111813359. [Google Scholar]
- Thornthwaite, C. An approach toward a rational classification of climate. Geogr. Rev. 1948, 38, 55–94. [Google Scholar] [CrossRef]
- Thornthwaite, C.; Hare, F. Climatic classification in forestry. Unasylva 1955, 9, 51–59. [Google Scholar]
- Penman, H. Natural Evapotranspiration from open water, bare soil and grass. Proc. R. Soc. Lond. Ser. A 1948, 193, 120–145. [Google Scholar] [CrossRef]
- Saxton, K.; Rawls, W. Soil water characteristic estimates by texture and organic matter for hydrologic solutions. Soil Sci. Soc. Am. J. 2006, 70, 1569–1578. [Google Scholar] [CrossRef]
- Patil, N.G.; Singh, S.K. Pedotransfer Functions for Estimating Soil Hydraulic Properties: A Review. Pedosphere 2016, 26, 417–430. [Google Scholar] [CrossRef]
- Rawls, W.; Brakensiek, D.; Saxton, K. Estimation of soil water properties. Trans. ASAE 1982, 25, 1316–1320. [Google Scholar] [CrossRef]
- Carsel, R.; Parrish, R. Developing joint probability distributions of soil water retention characteristics. Water Resour. Res. 1998, 24, 755–769. [Google Scholar] [CrossRef]
- Schaap, M.; Leij, F.; van Genuchten, M.T. Rosetta: A computer program for estimating soil hydraulic parameters with hierarchical pedotransfer functions. J. Hydrol. 2001, 251, 163–176. [Google Scholar] [CrossRef]
- Shah, N.; Nachabe, M.; Ross, M. Extinction depth and evapotranspiration from groundwater under selected land covers. Ground Water 2007, 45, 329–338. [Google Scholar] [CrossRef] [PubMed]

Figure 2.
Climate classification for various locations in the province of Alberta.

Figure 3.
The system of soil classification: (a) Canadian; (b) USDA.

Figure 4.
Soil–water characteristic curves for various soils from the United States Department of Agriculture (USDA) textural triangle.
Figure 4.
Soil–water characteristic curves for various soils from the United States Department of Agriculture (USDA) textural triangle.

Figure 5.
Estimated water balance for different climatic conditions: (a) arid, (b) semi-arid, and (c) dry sub-humid.
Figure 5.
Estimated water balance for different climatic conditions: (a) arid, (b) semi-arid, and (c) dry sub-humid.

Figure 6.
Vertical solute displacement over time in different climatic conditions; (a) arid, (b) semi-arid, and (c) dry sub-humid.
Figure 6.
Vertical solute displacement over time in different climatic conditions; (a) arid, (b) semi-arid, and (c) dry sub-humid.

Figure 7.
Measured precipitation intensities over the nine-year period for three different climatic conditions in Alberta.
Figure 7.
Measured precipitation intensities over the nine-year period for three different climatic conditions in Alberta.

Figure 8.
Daily precipitation occurrence over the nine-year period for three different climatic conditions in Alberta.
Figure 8.
Daily precipitation occurrence over the nine-year period for three different climatic conditions in Alberta.

Figure 9.
Calculated daily potential evaporation box–whisker plots for three different climatic conditions in Alberta.
Figure 9.
Calculated daily potential evaporation box–whisker plots for three different climatic conditions in Alberta.

Figure 10.
Estimated water balance in the soil domain for three different climate conditions coarse-grained (a) and fine-grained (b) soil materials.
Figure 10.
Estimated water balance in the soil domain for three different climate conditions coarse-grained (a) and fine-grained (b) soil materials.

© 2018 by the authors. Licensee MDPI, Basel, Switzerland. This article is an open access article distributed under the terms and conditions of the Creative Commons Attribution (CC BY) license (http://creativecommons.org/licenses/by/4.0/).
Share and Cite
MDPI and ACS Style
Bashir, R.; Pastora Chevez, E. Spatial and Seasonal Variations of Water and Salt Movement in the Vadose Zone at Salt-Impacted Sites. Water 2018, 10, 1833. https://doi.org/10.3390/w10121833
AMA Style
Bashir R, Pastora Chevez E. Spatial and Seasonal Variations of Water and Salt Movement in the Vadose Zone at Salt-Impacted Sites. Water. 2018; 10(12):1833. https://doi.org/10.3390/w10121833
Chicago/Turabian StyleBashir, Rashid, and Eric Pastora Chevez. 2018. "Spatial and Seasonal Variations of Water and Salt Movement in the Vadose Zone at Salt-Impacted Sites" Water 10, no. 12: 1833. https://doi.org/10.3390/w10121833
Note that from the first issue of 2016, this journal uses article numbers instead of page numbers. See further details here.