Impact of Lake Morphology and Shallowing on the Rate of Overgrowth in Hard-Water Eutrophic Lakes


1
Department of Ecology and Environmental Protection, Poznan University of Life Sciences, Piątkowska 94C, 60-649 Poznań, Poland
2
Institute of Physical Geography and Environmental Planning, Adam Mickiewicz University, Dzięgielowa 27, 61-680 Poznań, Poland
3
Department of Botany, Poznan University of Life Sciences, Wojska Polskiego 71c, 60-625 Poznań, Poland
*
Author to whom correspondence should be addressed.
Water 2018, 10(12), 1827; https://doi.org/10.3390/w10121827
Submission received: 9 November 2018
/
Revised: 29 November 2018
/
Accepted: 7 December 2018
/
Published: 11 December 2018
(This article belongs to the Section Water Quality and Contamination)
Abstract
:Lake disappearance is one of the results of water eutrophication which leads to lake shallowing and overgrowth, and small and shallow lakes are the most threatened with degradation. We studied the effect of lake shallowing on its overgrowth, taking into account the morphometric parameters of water bodies. The study was performed in 20 lakes located in the central west part of Poland. The degree of lake shallowing was evaluated on the basis of bathymetric maps made in the 1960s and studies carried out presently. Additionally, an analysis of littoral coverage and macrophyte growth forms was investigated. Moreover, the composition, intensity of phytoplankton blooming, and physico-chemical parameters of the lake water were analyzed. Redundancy analysis shows that the lake volume, average depth, shallowing rate, and change in volume were the parameters that most strongly correlated with the share of macrophytes in the lakes. According to the regression analysis, the share of emergent macrophytes was significantly correlated with lake shallowing. No relation was found between phytoplankton abundance and lake shallowing. Conversely, the lakes with the highest rate of shallowing were characterized by the greatest share of vegetation, which suggested that vegetation growth had a significant impact on lake shallowing.
1. Introduction
Lake morphometry plays a key role in ecological processes that occur in water ecosystems [1,2,3]. Subject to continuous change and highly dynamic in their nature, the morphometric properties of a lake depend on the reservoir’s parameters, catchment features, and human activity as well as climate change [1,4,5]. One example of such a change would be the transformation of the shoreline length and surface area of reservoirs [5,6,7]. Some of the processes in question take place underwater, affecting lake-bottom topography, and consequently play a role in the evolution of lakes. In general, lake evolution is driven by the process of eutrophication [7]. It is assumed that any type of landform that is sunken or depressed below the surrounding area, such as a lake basin, will eventually be subject to the accumulation of autochthonous and allochthonous matter [8]. However, the process of eutrophication is also governed by several different factors, such as changes in lake volume and depth, climate change, or anthropogenic activity, such as damming, field irrigation, and agricultural land use in the catchment [9].
Many processes that take place in catchments and lakes have accelerated in the second half of the 20th century as a result of increased anthropopressure on the environment, including intensification of agriculture and irrigation for farming and settlement purposes [10]. Such activities have led to the impoverishment of water resources in terms of both quantity and quality, which is particularly disadvantageous in water-scarce regions. In Poland, this problem mostly occurs in the central-west region, where low annual precipitation (approx. 550 mm year−1) has been observed combined with high temperature and high human impact on water resources. The study conducted by Choiński et al. [6] showed significant changes in water resources in the case of 18 lakes in this region over the last 60 years, with a total decrease in water volume of 3.6 million m3. Yan and Zheng [4] emphasized the dramatic changes in fresh water bodies in mainland China, which are mostly caused by intense human activities, such as excessive use of water resources, land reclamation, and urbanization. On the other hand, new lakes have formed on the Tibetan Plateau as a result of climate change and glacial melting [11].
The reduction of water resources affects the lake area covered by shallow isobaths, which may result in increased plant succession. This process is particularly intense in low-depth polymictic lakes, where light necessary for the development of vegetation can more easily reach the lake bottom [2,12]. On the one hand, it may cause gradual conversion of the reservoir into land, but on the other hand, it may contribute to the improvement of water quality due to the competition between phytoplankton and macrophytes [13]. Excessive biological productivity in water may result in the development of phytoplankton which are deposited on the bottom of the lake, contributing to the shallowing of the reservoir and possibly increasing the rate of development of macrophytes in the long term [14]. These processes may occur with varying intensity. The shift from a turbid, phytoplankton-dominated state to a clear, macrophyte-dominated state, according to the theory of alternative stable states [15,16], is not easy to achieve in the case of hypereutrophic lakes. According to the EU Water Framework Directive (WFD) [17], reduction of the phytoplankton population is the preferred method for improving water quality. However, the WFD does not take into account the impact of lake shallowing on conservation and environmental management.
This study aimed to: (i) assess the impact of lake morphology on the process of lake shallowing and (ii) analyze the impact of such processes on the development of macrophytes in hypereutrophic water basins, taking into consideration the intensity of phytoplankton development.
2. Materials and Methods
An analysis of lake eutrophication and shallowing was performed for 20 lakes located in the central-west part of Poland. The water bodies selected for the study have an area of less than 100 ha (Table S1; [18]) and had bathymetric plans prepared for them in the 1950s and 1960s. The reservoirs studied exhibited high biological productivity, with a Carlson’s Trophic State Index [19] equal to 46–87, which corresponds to the eutrophic and hypereutrophic states.
2.1. Lake Shallowing
The study comprised an analysis of the topography of the lake bottoms. For this purpose, soundings were carried out using a Garmin Fishfinder 100 (200 kHz) echo sounder with simultaneous positioning using a Garmin GPSMap 64s receiver. The collected data were used to determine the current bathymetric plans of the reservoirs, taking into account the water table level. In order to eliminate the measurement error between the two methods (an echo sounder and a sounding line with a 1 kg weight and a 100 cm2 base), additional measurements were performed using the sounding line. The results obtained in 2013–2015 were adjusted according to Choiński [20] in order to compare them with the data from the 1960s.
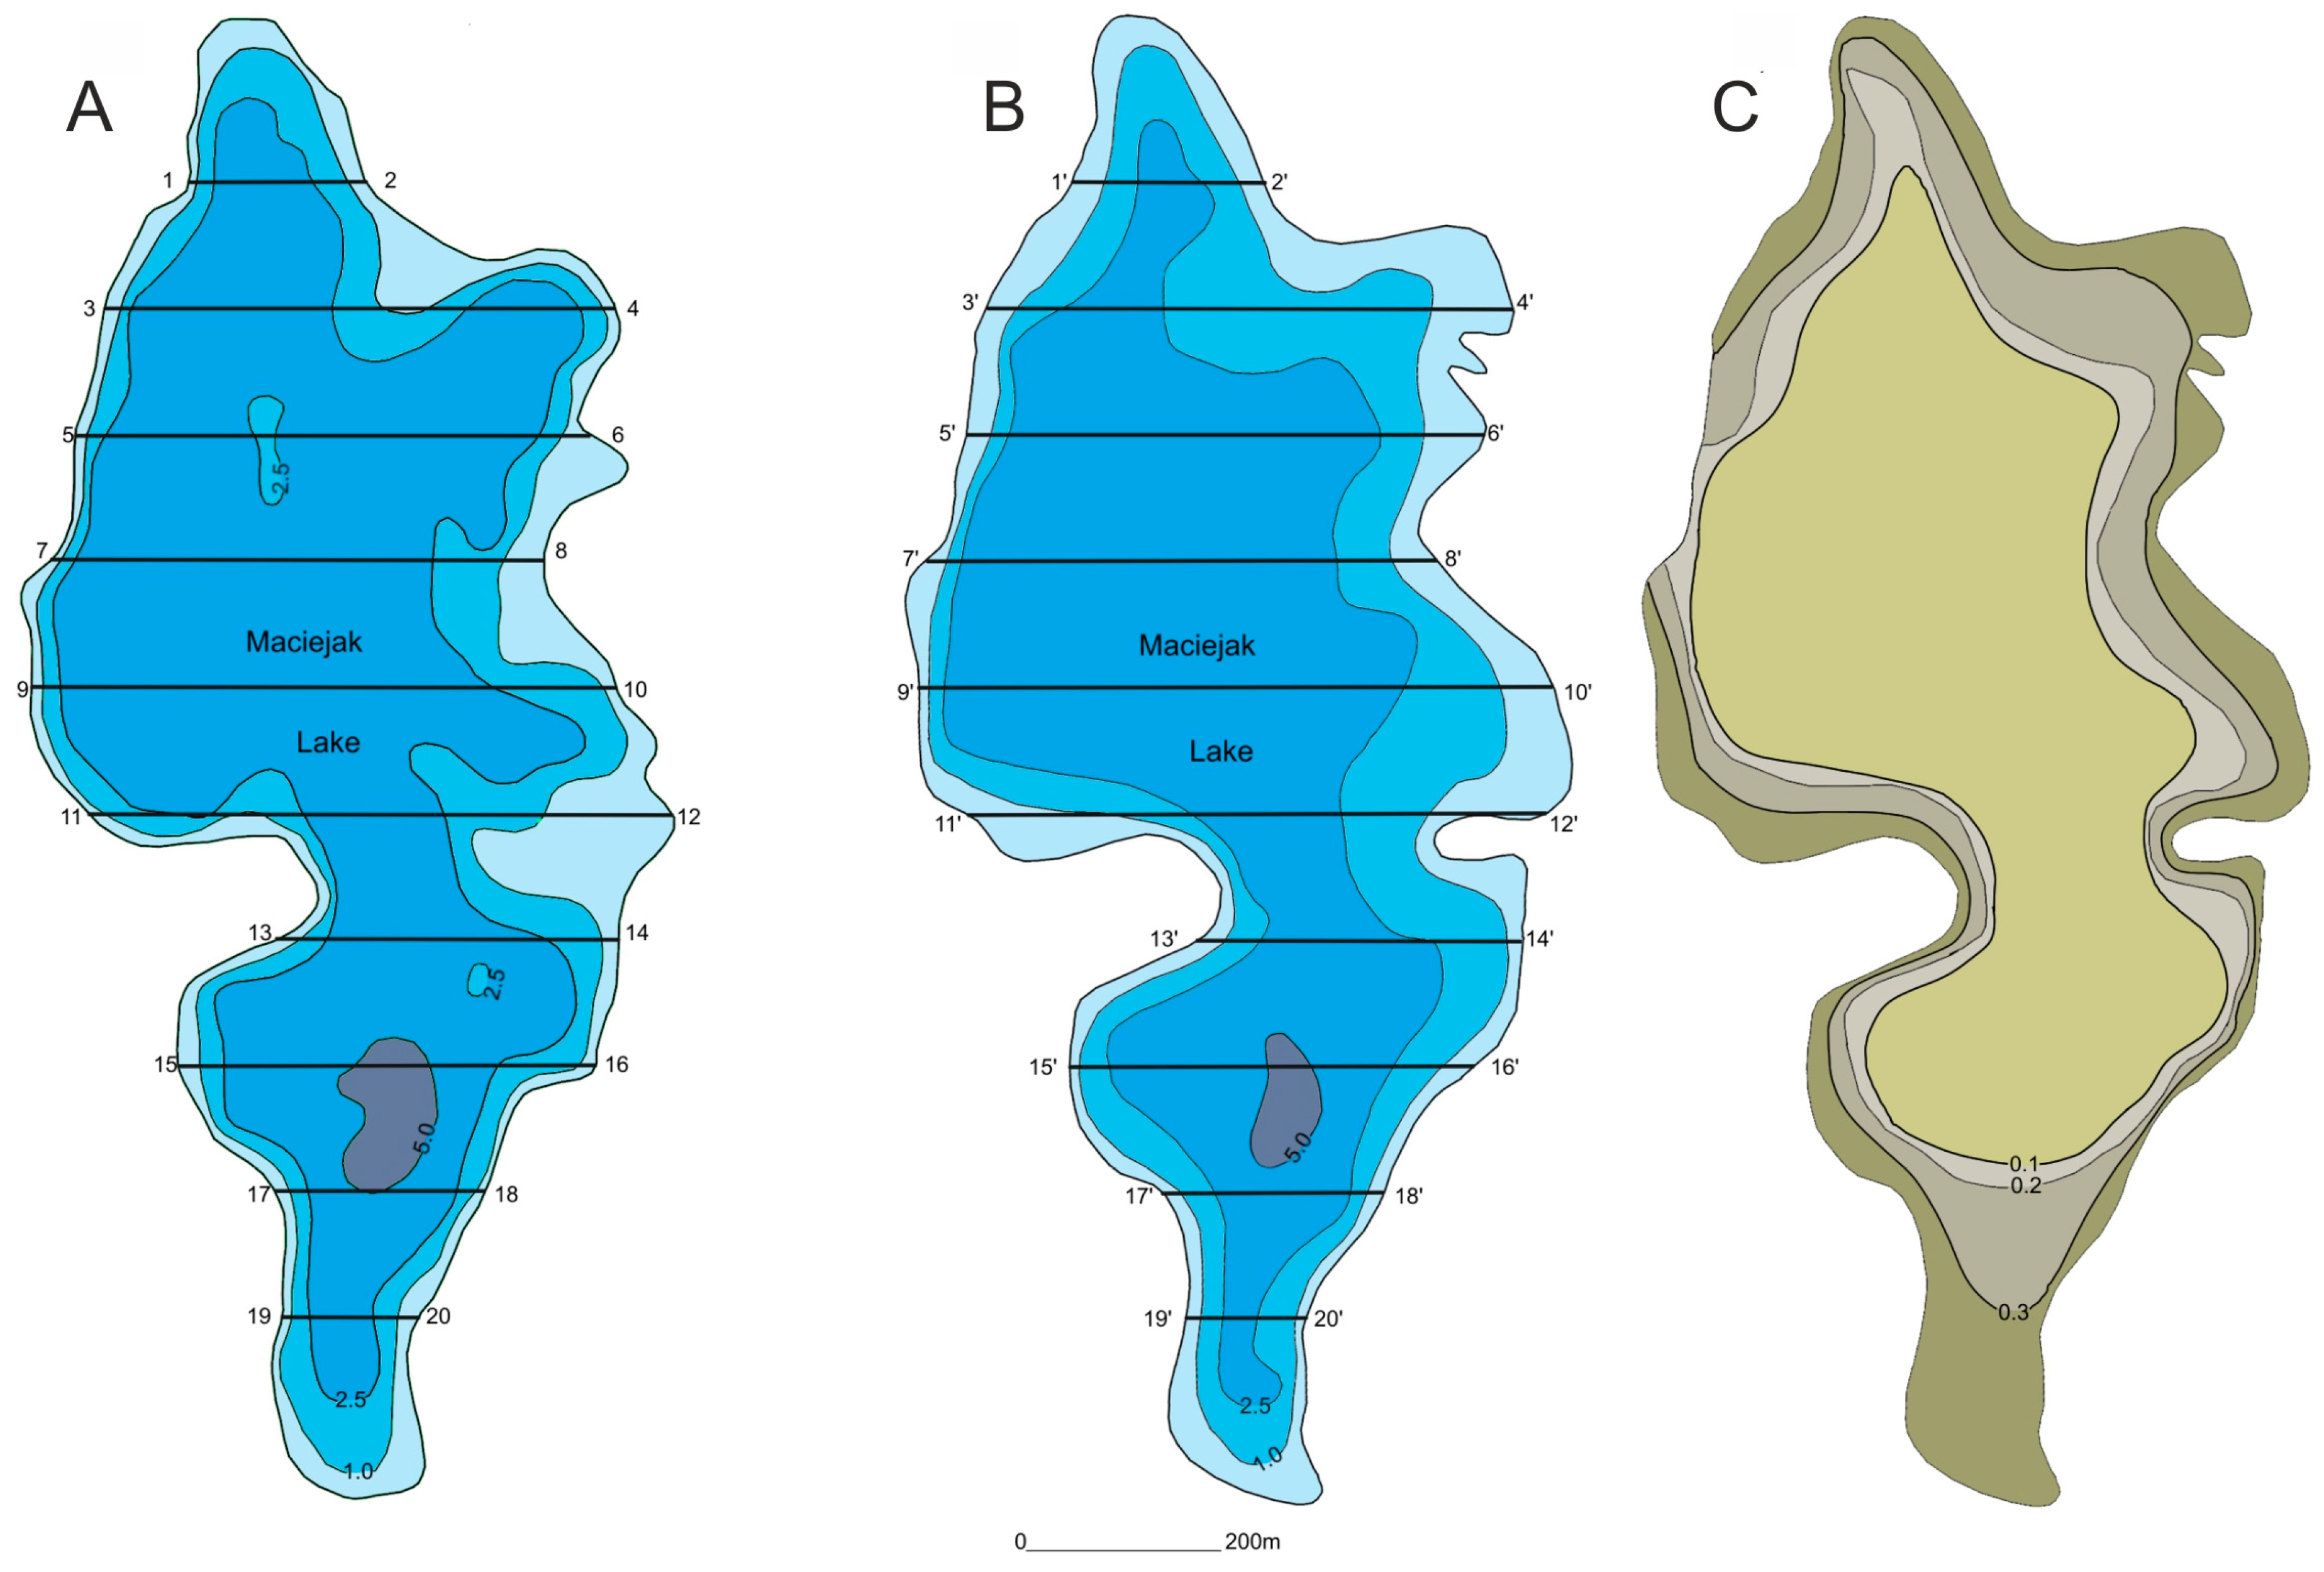
As part of the study, the modern bathymetric plans were compared with the plans prepared by the Stanislaw Sakowicz Inland Fisheries Institute in Olsztyn in the 1960s, in order to assess the changes that have occurred over the past 50 years. For this purpose, the depth of the lake was measured along designated latitudinal cross sections for the two time periods indicated above. A comparative analysis of the bathymetric plans from the two time periods provided a basis for plotting isolines (isopachs), which represent changes in the lake-bottom morphology. Differences between the plans were used for assessing the changes in the bathymetry of the lakes along specific profiles (Figure 1). Using the above-mentioned data, it was possible to determine the shallowing rate and extent in terms of sediment thickness and spatial distribution, assuming a linear process and erosional failure. Having calculated the total area enclosed by specific isopach lines, it was possible to estimate the percentage of the lake area subject to the shallowing process. For the purpose of simplifying the statistical analysis, the results obtained were split into two groups representing low (<0.2 m) and high (>0.2 m) thicknesses of accumulated sediment.
2.2. Lake Overgrowth
The littoral zone area and cover of dominant growth forms of macrophytes in each lake were investigated during the vegetation season. Species composition was determined on the basis of the phytosociological Braun-Blanquet approach using a seven-point scale [21]. The littoral zones, with submerged, floating-leaf and dominant emergent plant assemblages, were mapped using a Garmin GPSMAP 62s receiver.
2.3. Phytoplankton and Nutrient Analysis
Water samples used in phytoplankton and chemical analyses were collected during the summer from the surface of the pelagic zone of each of the lakes under study. Samples for qualitative phytoplankton analysis were collected using a plankton net (mesh size: 30 μm). For quantitative analysis, 1 L of water was collected and preserved using Lugol’s Iodine (2% final conc.) and then reduced to 10–20 mL by sedimentation. Phytoplankton composition was determined using a light microscope, and taxa abundance was calculated using a Fuchs-Rosenthal chamber. Single-cell organisms and algal coenobia were treated as individual organisms. For trichomes, a single individual was considered to be 100 μm long and in the case of colony-forming cyanobacteria, e.g., Aphanothece, and Microcystis, a coverage area of 400 μm2 was taken into account. The dominant taxa were defined as those that accounted for at least 10% of the total phytoplankton abundance in a given sample.
Upon collection, water samples were filtered using Sartorius Cellulose filters with a nominal pore size of 0.45 μm. The in-situ oxygen concentration was measured using a ProfiLine Oxi 3315. The water samples were analyzed using a spectrophotometer (HACH DR/2800) to determine the concentrations of the total phosphorus (TP) (acid persulphate digestion method), orthophosphate (PO43−) (amino acid method), sulphates (SO42−) (colorimetric method), chlorides (Cl−) (Mercury thiocyanate method), total nitrogen (TN) as the sum of organic nitrogen (Kjeldahl method), nitrite (NO2−) (ferrous sulphate method), nitrate (NO3−) (cadmium reduction method), and ammonium (NH4+) (Nessler method). Calcium (Ca2+) and magnesium (Mg2+) concentrations were measured by way of titration with a standardized solution of ethylenediaminetetraacetic acid (EDTA). The water samples were cooled and analyzed at the Department of Ecology and Environmental Protection, Poznan University of Life Sciences, within six hours after collection.
2.4. Statistical Analysis
In order to demonstrate the similarities and differences between the lakes under study in terms of their hydromorphological properties, a heatmap analysis with dendrograms based on a hierarchical cluster analysis (HCA) was applied [22]. The HCA was used to investigate the grouping of the sampling sites. The Euclidean distance formula was used to measure the similarities between the lakes, and the Ward’s minimum variance criterion was used to minimize the total within-cluster variance. Four-dimensional variables were represented by colors. The heatmap analysis was performed using the R computational platform (package “d3heatmap”).
The analysis of variance (ANOVA) and the Kruskal–Wallis test were used for the purpose of explaining the differences in the littoral zone, pelagic zone, and macrophyte content between the selected lake hydromorphology groups. All of the data were tested for normality and homogeneity of variance before processing.
Principal component analysis (PCA) was applied for the purpose of investigating the differences between the selected lake hydromorphology groups in terms of water chemistry. Canonical correspondence analysis was used for the purpose of analyzing the correlation between the biological data (percentage of lake coverage by macrophytes and phytoplankton) and the environmental variables (lake shallowing, mean and average depth, volume, surface area, shallowing rate, total nitrogen, and phosphorus content) and was performed using CANOCO for Windows version 4.5 [23]. Redundancy analysis (RDA) with forward selection was used to reduce the number of environmental variables. The statistical significance of the correlation between the biological data and morphological or chemical variables was evaluated using the Monte Carlo permutation test (499 permutations). All of the data were log-transformed before the analysis [23].
Additionally, linear regression was used for the purpose of establishing the significant correlations between the shallowing rates (high and low) and the overgrowth variations in the studied lakes on the basis of the littoral zone coverage and macrophyte growth forms (emergent and submerged vegetation, and nymphaeids). The model was improved using stepwise regression analysis. In this way, in addition to high or low shallowing rates, selected morphological properties of the lakes (i.e., mean and maximum depths, surface area, and volume) could also be included in the analysis. In the case of the regression analysis, the Levene’s test was used for testing the normal distribution of all of the variables. The results showed asymptotic significance (2-tailed) values (p-values) ranging from 0.137 (surface area change) to 0.951 (lake surface) and all were greater than 0.05, suggesting normal distribution. The variance analysis, PCA, and regression statistics were calculated using the Statistica (StatSoft, Kraków, Poland; version 13) software.
3. Results
3.1. Impact of Morphology on Shallowing
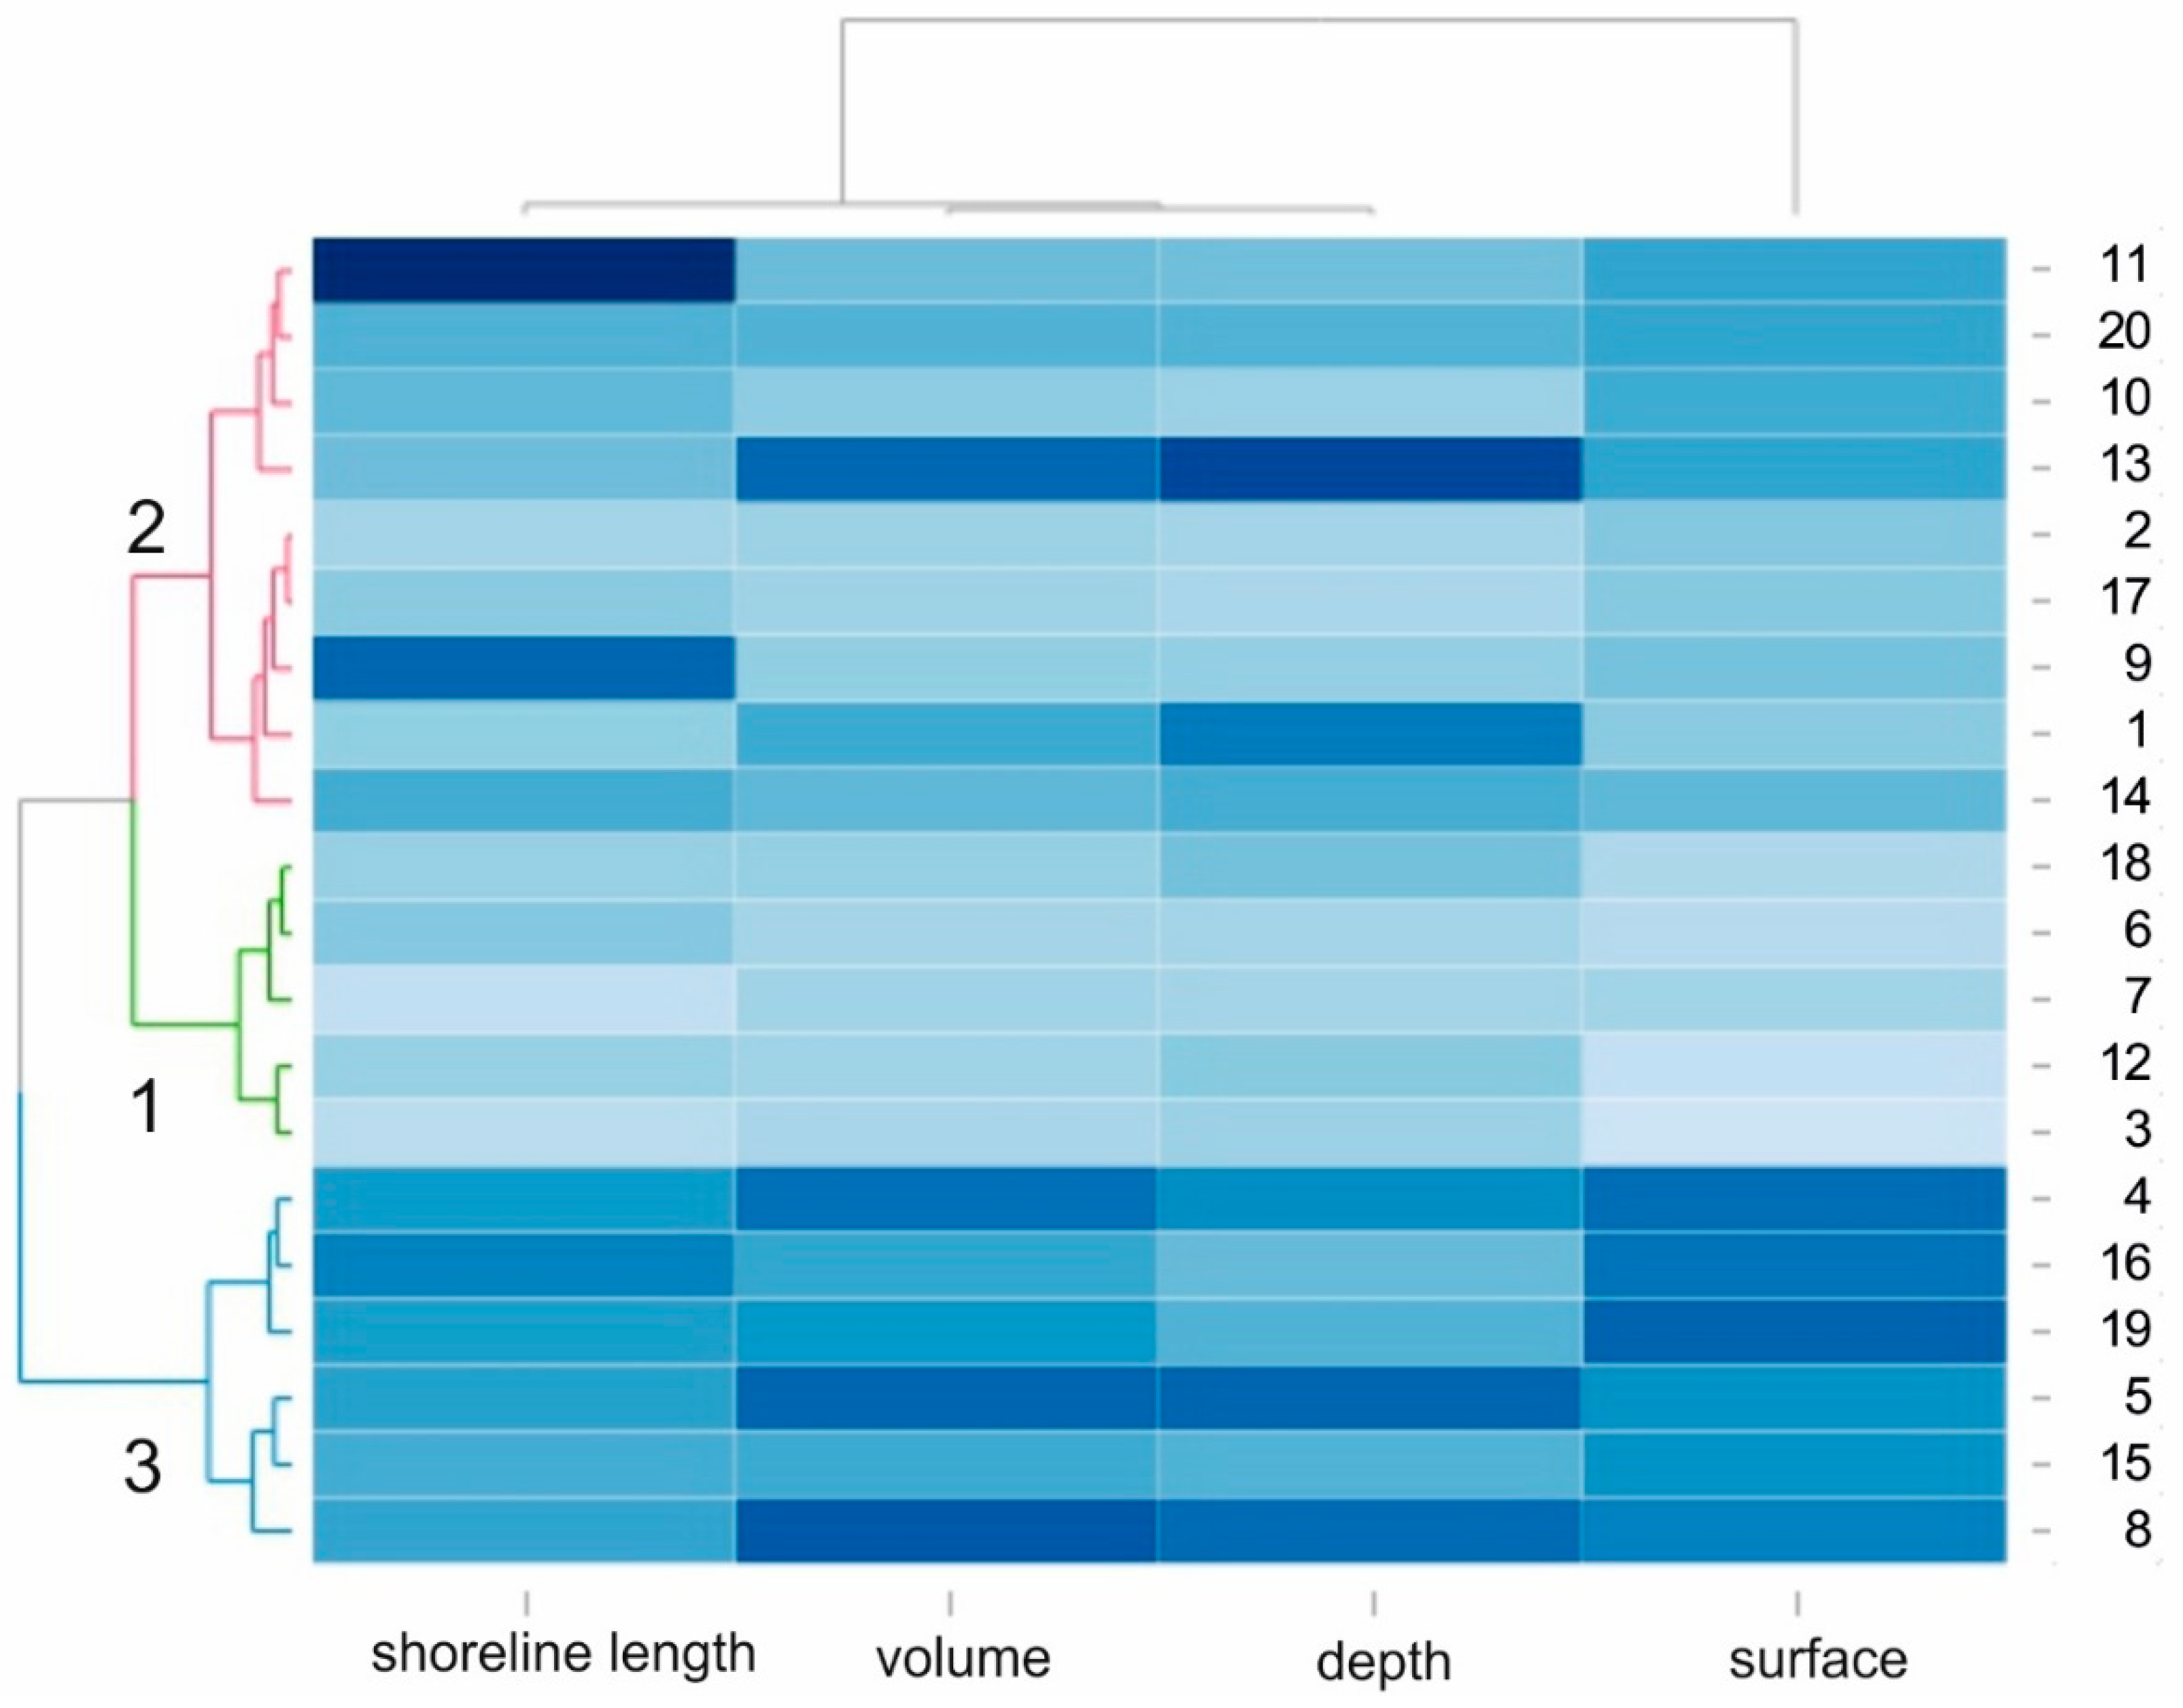
HCA was performed on the basis of the morphometric parameters of the 20 lakes and produced three clusters (Figure 2) differing by surface area. The second group of factors differentiating the studied lakes was composed of the depth, volume, and length of the shoreline. Group 1 comprised (number of lakes N = 6) lakes with the significant greatest surface area (mean: 84.7 ha) and depth (average: 5.30 m) (Figure 2, Table 1). Group 2 (N = 9) had an average surface area of 49.9 ha and an average depth of 3.6 m (Figure 2, Table 1). Group 3 (N = 5) contained the smallest lakes with an average surface area of 22.1 ha and an average depth of 1.8 m. The Kruskal–Wallis ANOVA test revealed statistically significant differences in the mean values of all of the morphological parameters under study: surface area (F = 75.84; p < 0.0001), volume (F = 15.35; p < 0.001), average depth (F = 3.49; p = 0.04), and length of shoreline (F = 3.87; p = 0.03) between the selected lake types. The highest maximum value of the shallowing rate (34.84%) was recorded in the smallest group of lakes (Group 3; Table 1).
The lake area subject to intense shallowing ranged from 13.5 to 30.0 ha. However, the highest variations were recorded in the second group of lakes, i.e., average surface area and depth (Table 1). The sediment was less than 0.2 m thick in 64.36% of the water bodies in the group with the shallowest lakes and 88.33% in the case of the largest water bodies (Group 1). In one of the lakes, a deepening process was observed, although only in the part subject to the effects of the outflow river. Statistically important differences were detected between the smallest (Group 3) and the biggest lakes (Group 1). The spatial distribution analysis of lake shallowing showed that the process of shallowing was the most intense in the river outflow areas and in the areas adjacent to steep littoral slopes. No statistically significant differences in volume and surface area changes between these groups were found. In Groups 2 and 3, both the volume and surface area changes equaled to approximately 20% in the period 1960–2015 and the volume and surface area changes in Group 1 were only 6% and 9%, respectively (Table 1).
3.2. Morphology and Overgrowth
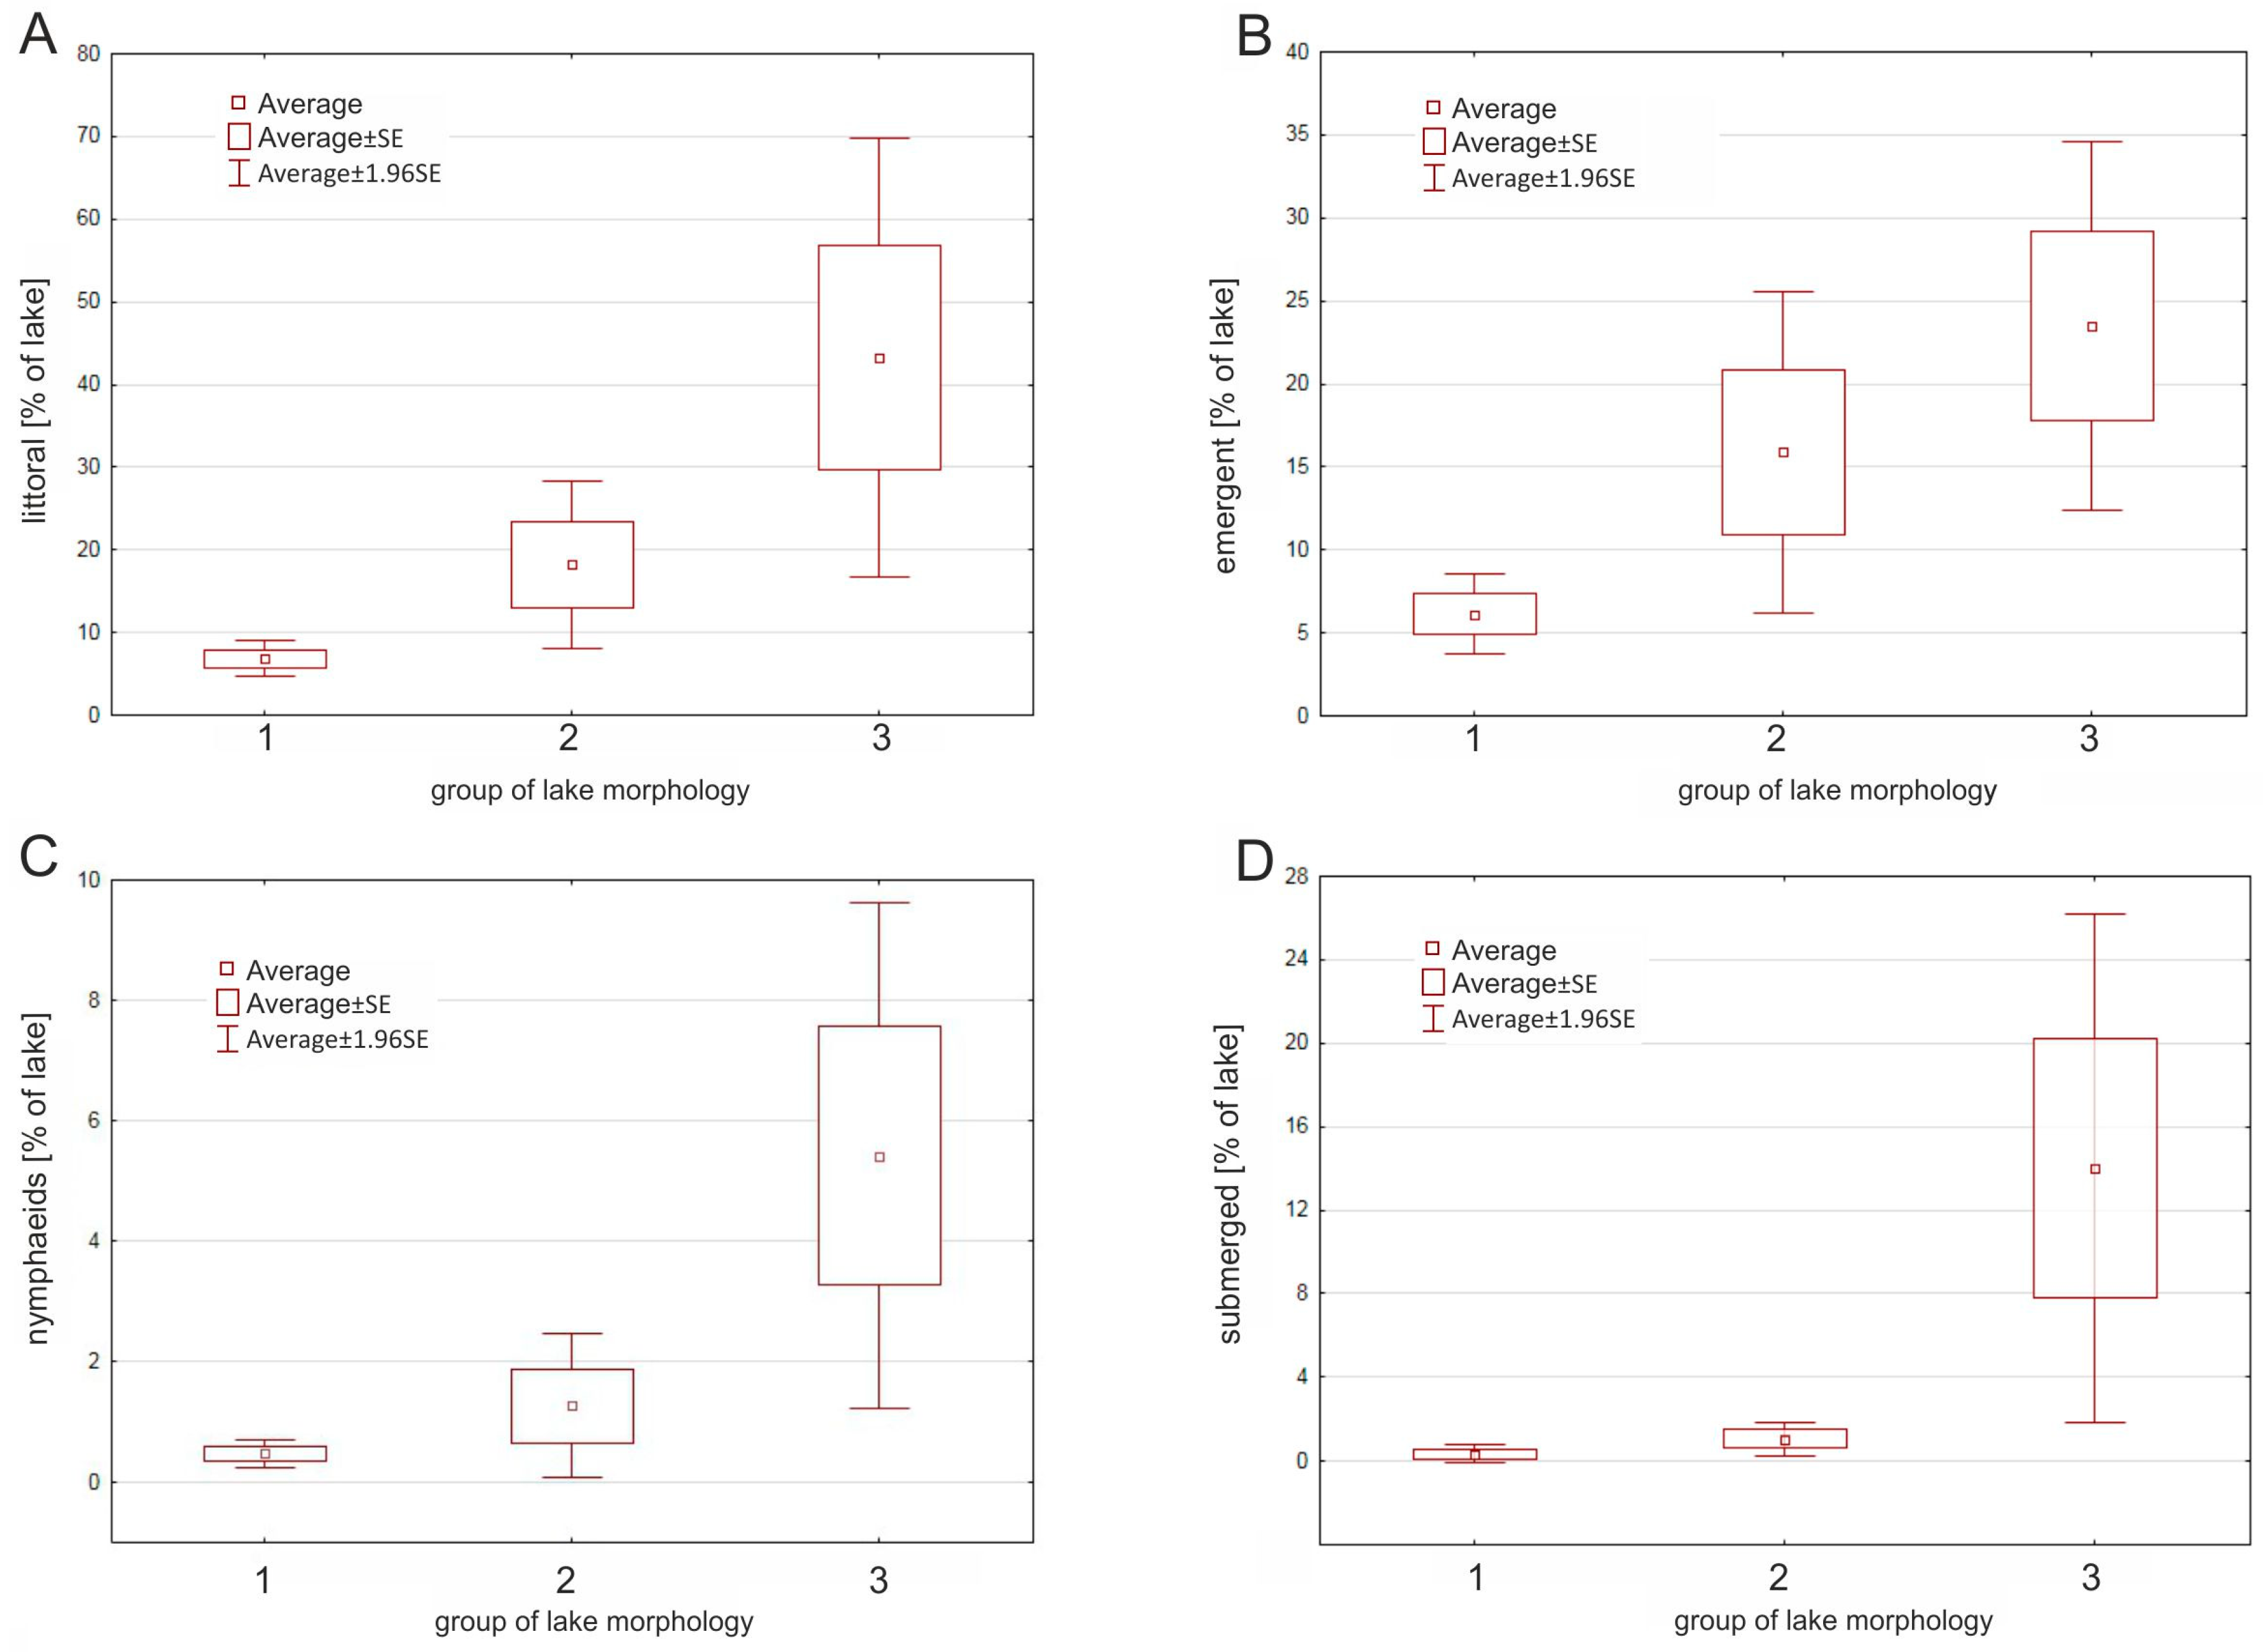
The macrophyte analysis of the lakes showed that the different morphological groups varied in terms of vegetation (Figure 3). However, high variability of macrophyte coverage was detected both within and between groups. In Group 1, the macrophyte coverage was insignificant (8%) and dominated by emergent vegetation. In Group 2, the macrophyte coverage was smaller (18.2%) and dominated by helophytes (15.9%). The smallest reservoirs (Group 3) had the highest rate of macrophyte coverage (43.2% on average) and were dominated by emergent (23.5%) and submerged macrophytes (14.0%). The Kruskal–Wallis test showed significant differences between the three morphological groups of lakes only in terms of the littoral zone cover (F = 7.00; p = 0.030) and open water area (F = 7.10; p = 0.029). The differences between different groups of emergent (F = 5.89; p = 0.053) and submerged vegetation (F = 5.48; p = 0.064) were only marginally significant. However, a clear pattern emerged, in which the macrophyte coverage increased when the morphometric parameters of the lake decreased (Figure 3).
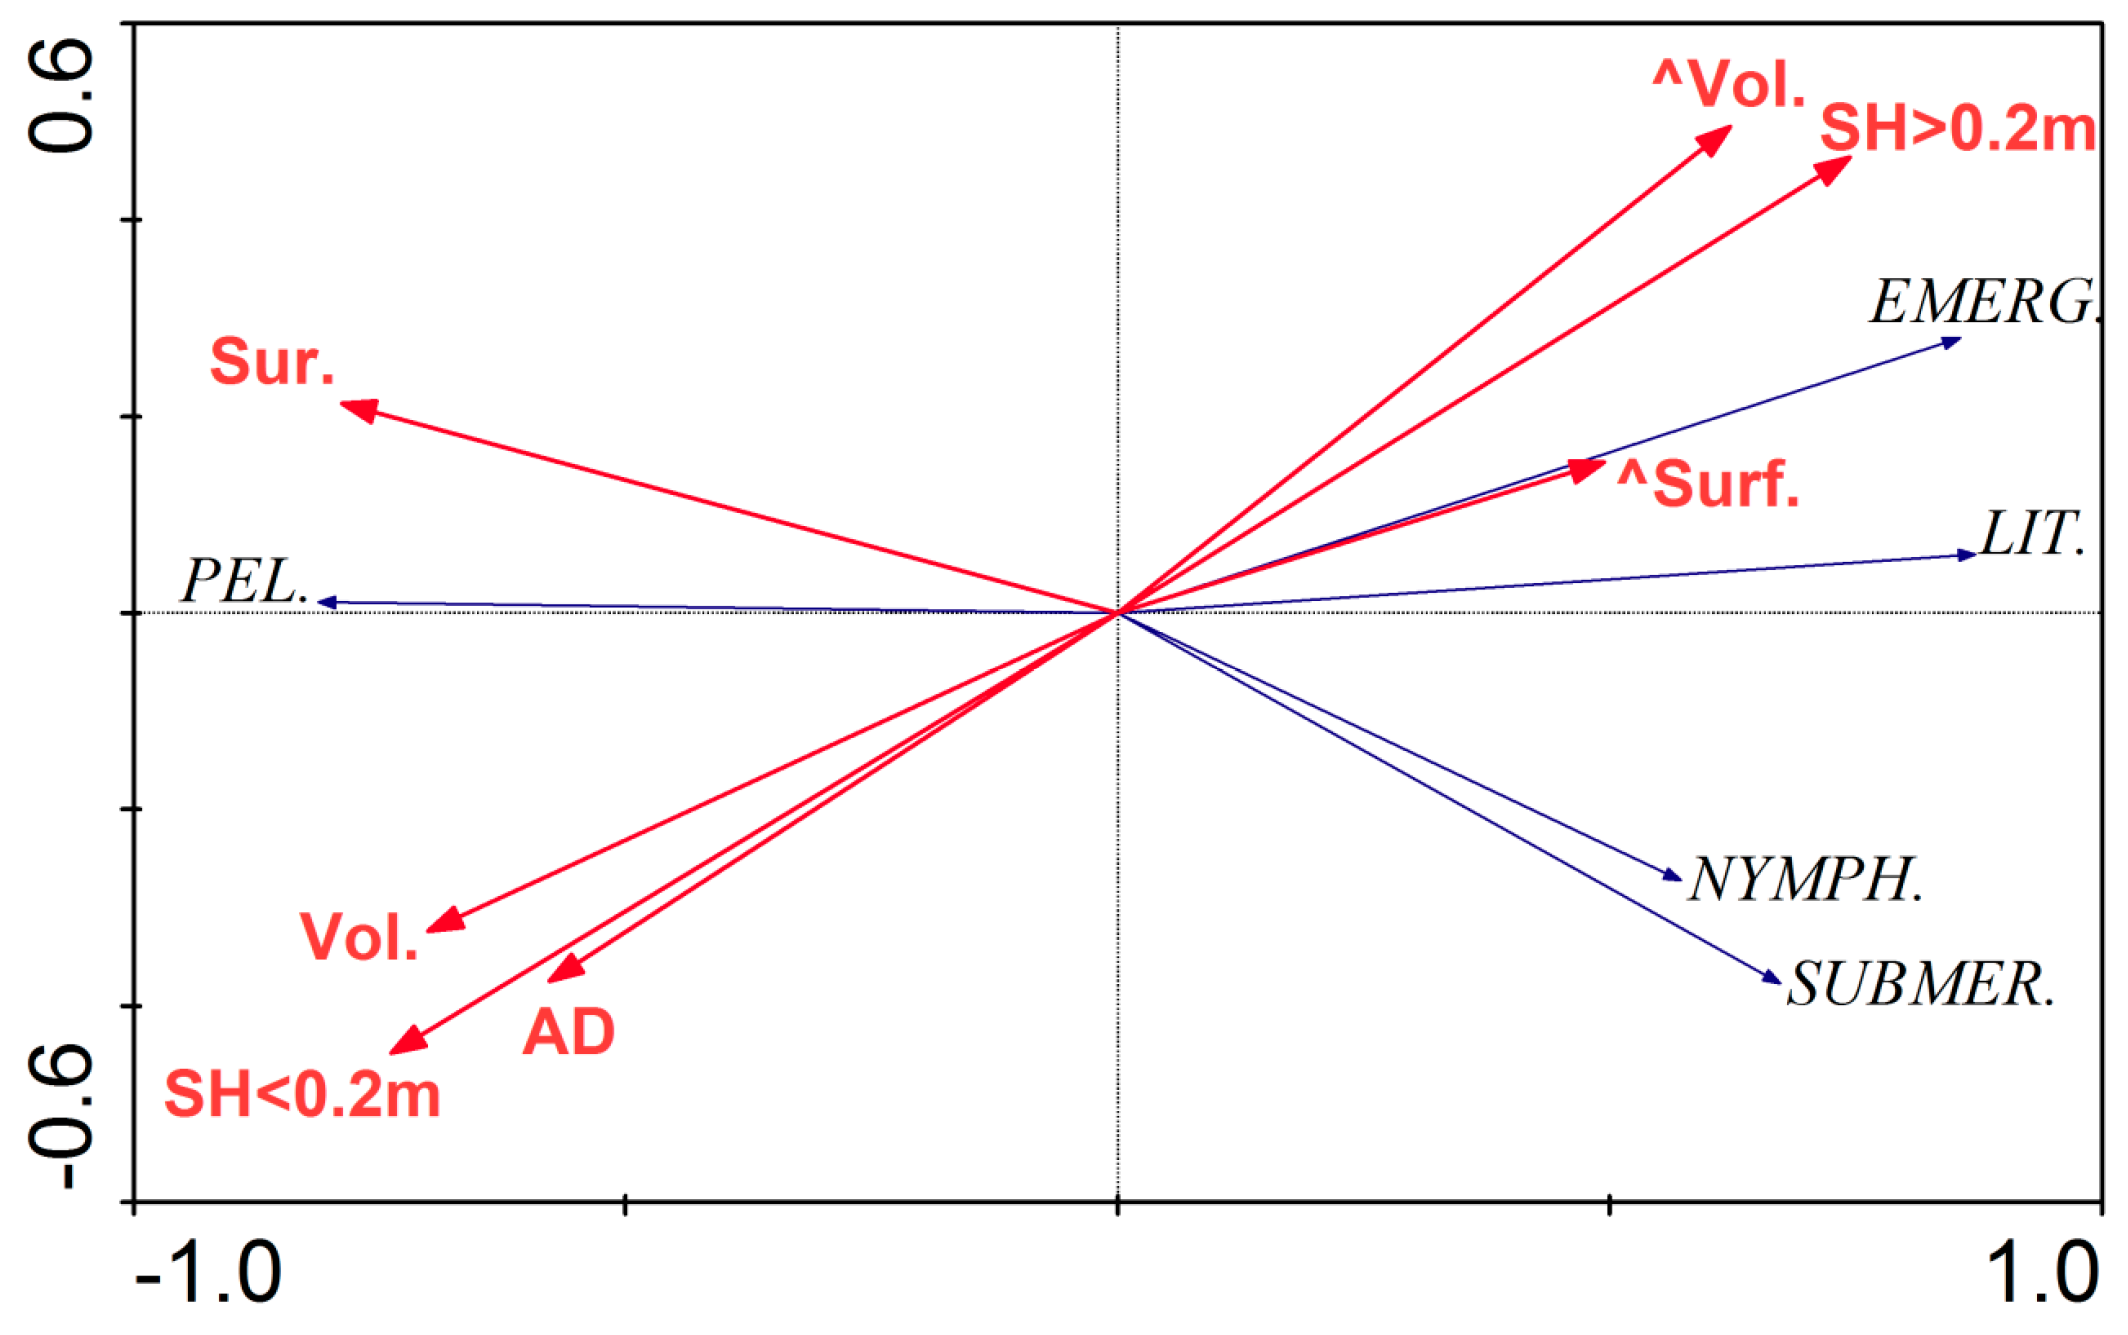
The RDA based on vegetation data and morphological parameters showed that the first two axes explain 64.2% of the variance in the biological data and 91.3% of the variance in the overgrowth rate and environmental impact (Figure 4, Table 2). According to the forward selection results, the volume, average depth, shallowing rate, and volume change were the most statistically significant variables in terms of the macrophyte coverage of the lakes.
Emergent macrophytes were positively correlated with a high rate of lake shallowing and reduction of volume and negatively correlated with the mean depth, lake volume, and a low rate of lake shallowing. Nymphaeids and submerged vegetation were negatively correlated with the lake surface area. The correlation between the macrophytes and the morphometric parameters were statistically significant (the Monte Carlo test of significance of the first canonical axis had F value of 12.09 and p value of 0.002) (Figure 4, Table 2).
3.3. Shallowing and Overgrowth
First, we analyzed the direct effect of the shallowing rate on the macrophyte coverage of the lakes. A simple linear regression showed that the correlation between the size of the littoral zone and a low shallowing rate was significant (F = 12.45; p = 0.002) and explained 41% of the variation (R2 = 0.41). The analysis of macrophyte growth forms showed that emergent vegetation exhibits the strongest and most significant correlation with a low shallowing rate (R2 = 0.54; F = 21.28; p = 0.0002). Other macrophyte forms did not show significant correlation with a low shallowing rate (nymphaeids: R2 = 0.14, p = 0.108; submerged: R2 = 0.13, p = 0.114). A similar correlation between macrophyte coverage and a high shallowing rate was observed. The strongest correlation was observed between the helophytes (R2 = 0.52; F = 19.92; p = 0.0003) and the littoral zone (R2 = 0.37; F = 10.83; p = 0.004). The correlation between a high shallowing rate and the nymphaeids abundance or submerged macrophyte population was low and insignificant.
Second, the effect of the shallowing rate (high and low) and morphological parameters (lake surface area, volume, and mean depth) on the littoral zone (% of lake area) and macrophyte coverage (% of lake area) was analyzed. The regression analyses confirmed that the percentage of the lake covered by the littoral zone and emergent vegetation depended on the rate of lake shallowing and the lake surface area (Table 3).
The models explain 80% and 73% of the variance, respectively. Submerged vegetation and nymphaeids correlated more strongly with the lake surface area (R2 = 0.77 and R2 = 0.53, respectively) than with the rate of lake shallowing which in both cases was insignificant.
3.4. Phytoplankton and Water Chemistry
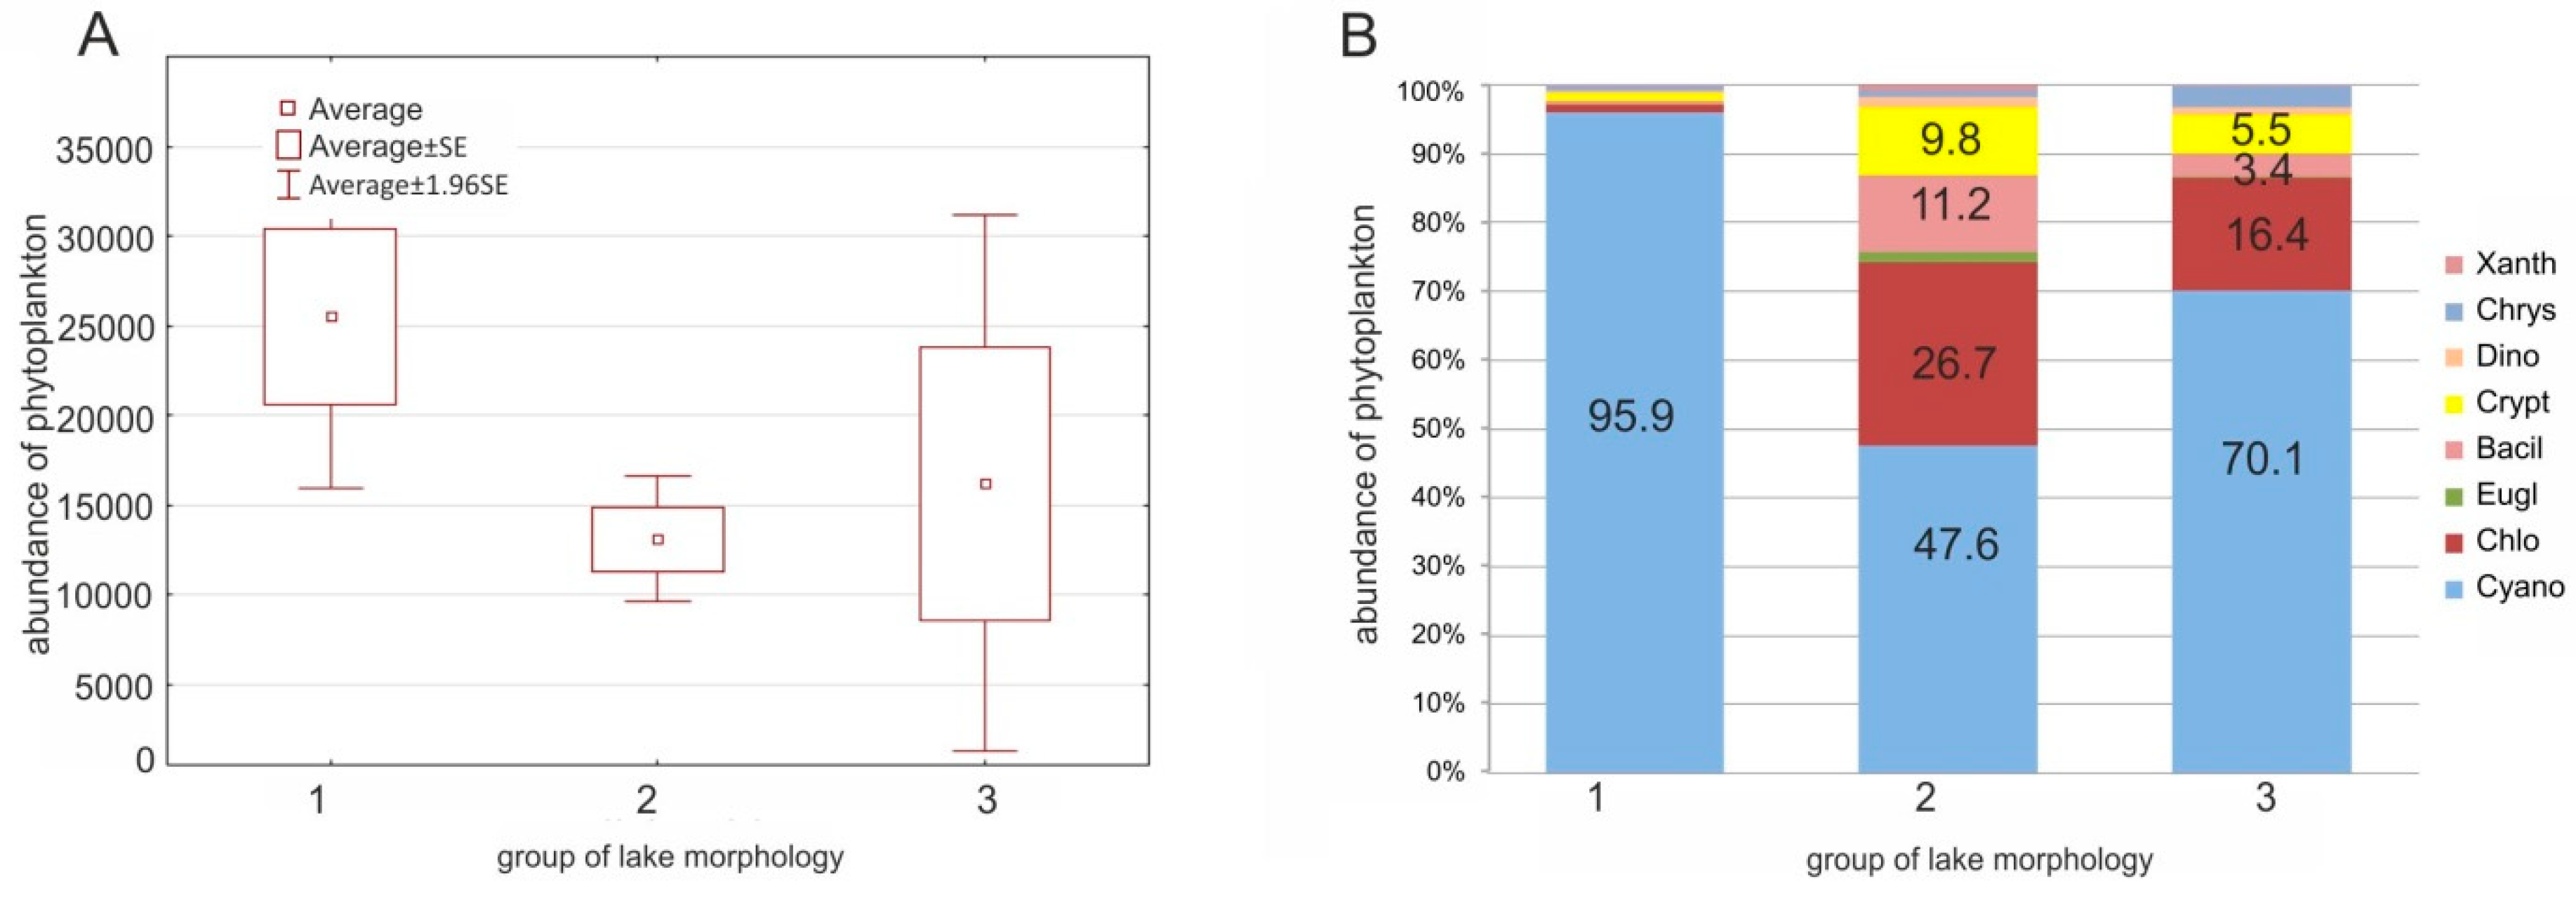
The highest abundance of phytoplankton was observed in the biggest lakes (Group 1), with an average of 2.5 × 10⁴ indiv. mL−1. In the case of the second and the third groups of lakes (Groups 2 and 3), the phytoplankton content was lower than in the first group, with high variations of phytoplankton abundance in the last group. The total phytoplankton abundance was determined by a high percentage of cyanobacteria in the lakes (Figure 5). In the first group, cyanobacteria accounted for nearly all of the phytoplankton content (96% on average). In the second group, the cyanobacteria content was statistically lower than in the first group (Kruskal–Wallis test: H = 7.868, p = 0.0196) and accounted for almost 50% of the total phytoplankton content. In the last group (i.e., the smallest lakes) the growth of cyanobacteria was also intense (an average of 70% of the total phytoplankton abundances) but differed significantly between lakes. In addition to cyanobacteria, a high content of chlorophytes was detected, which accounted for approximately 27% and 16% of the total phytoplankton content in the second and the third groups, respectively. The phytoplankton content was the most diverse in the second group of lakes under study.
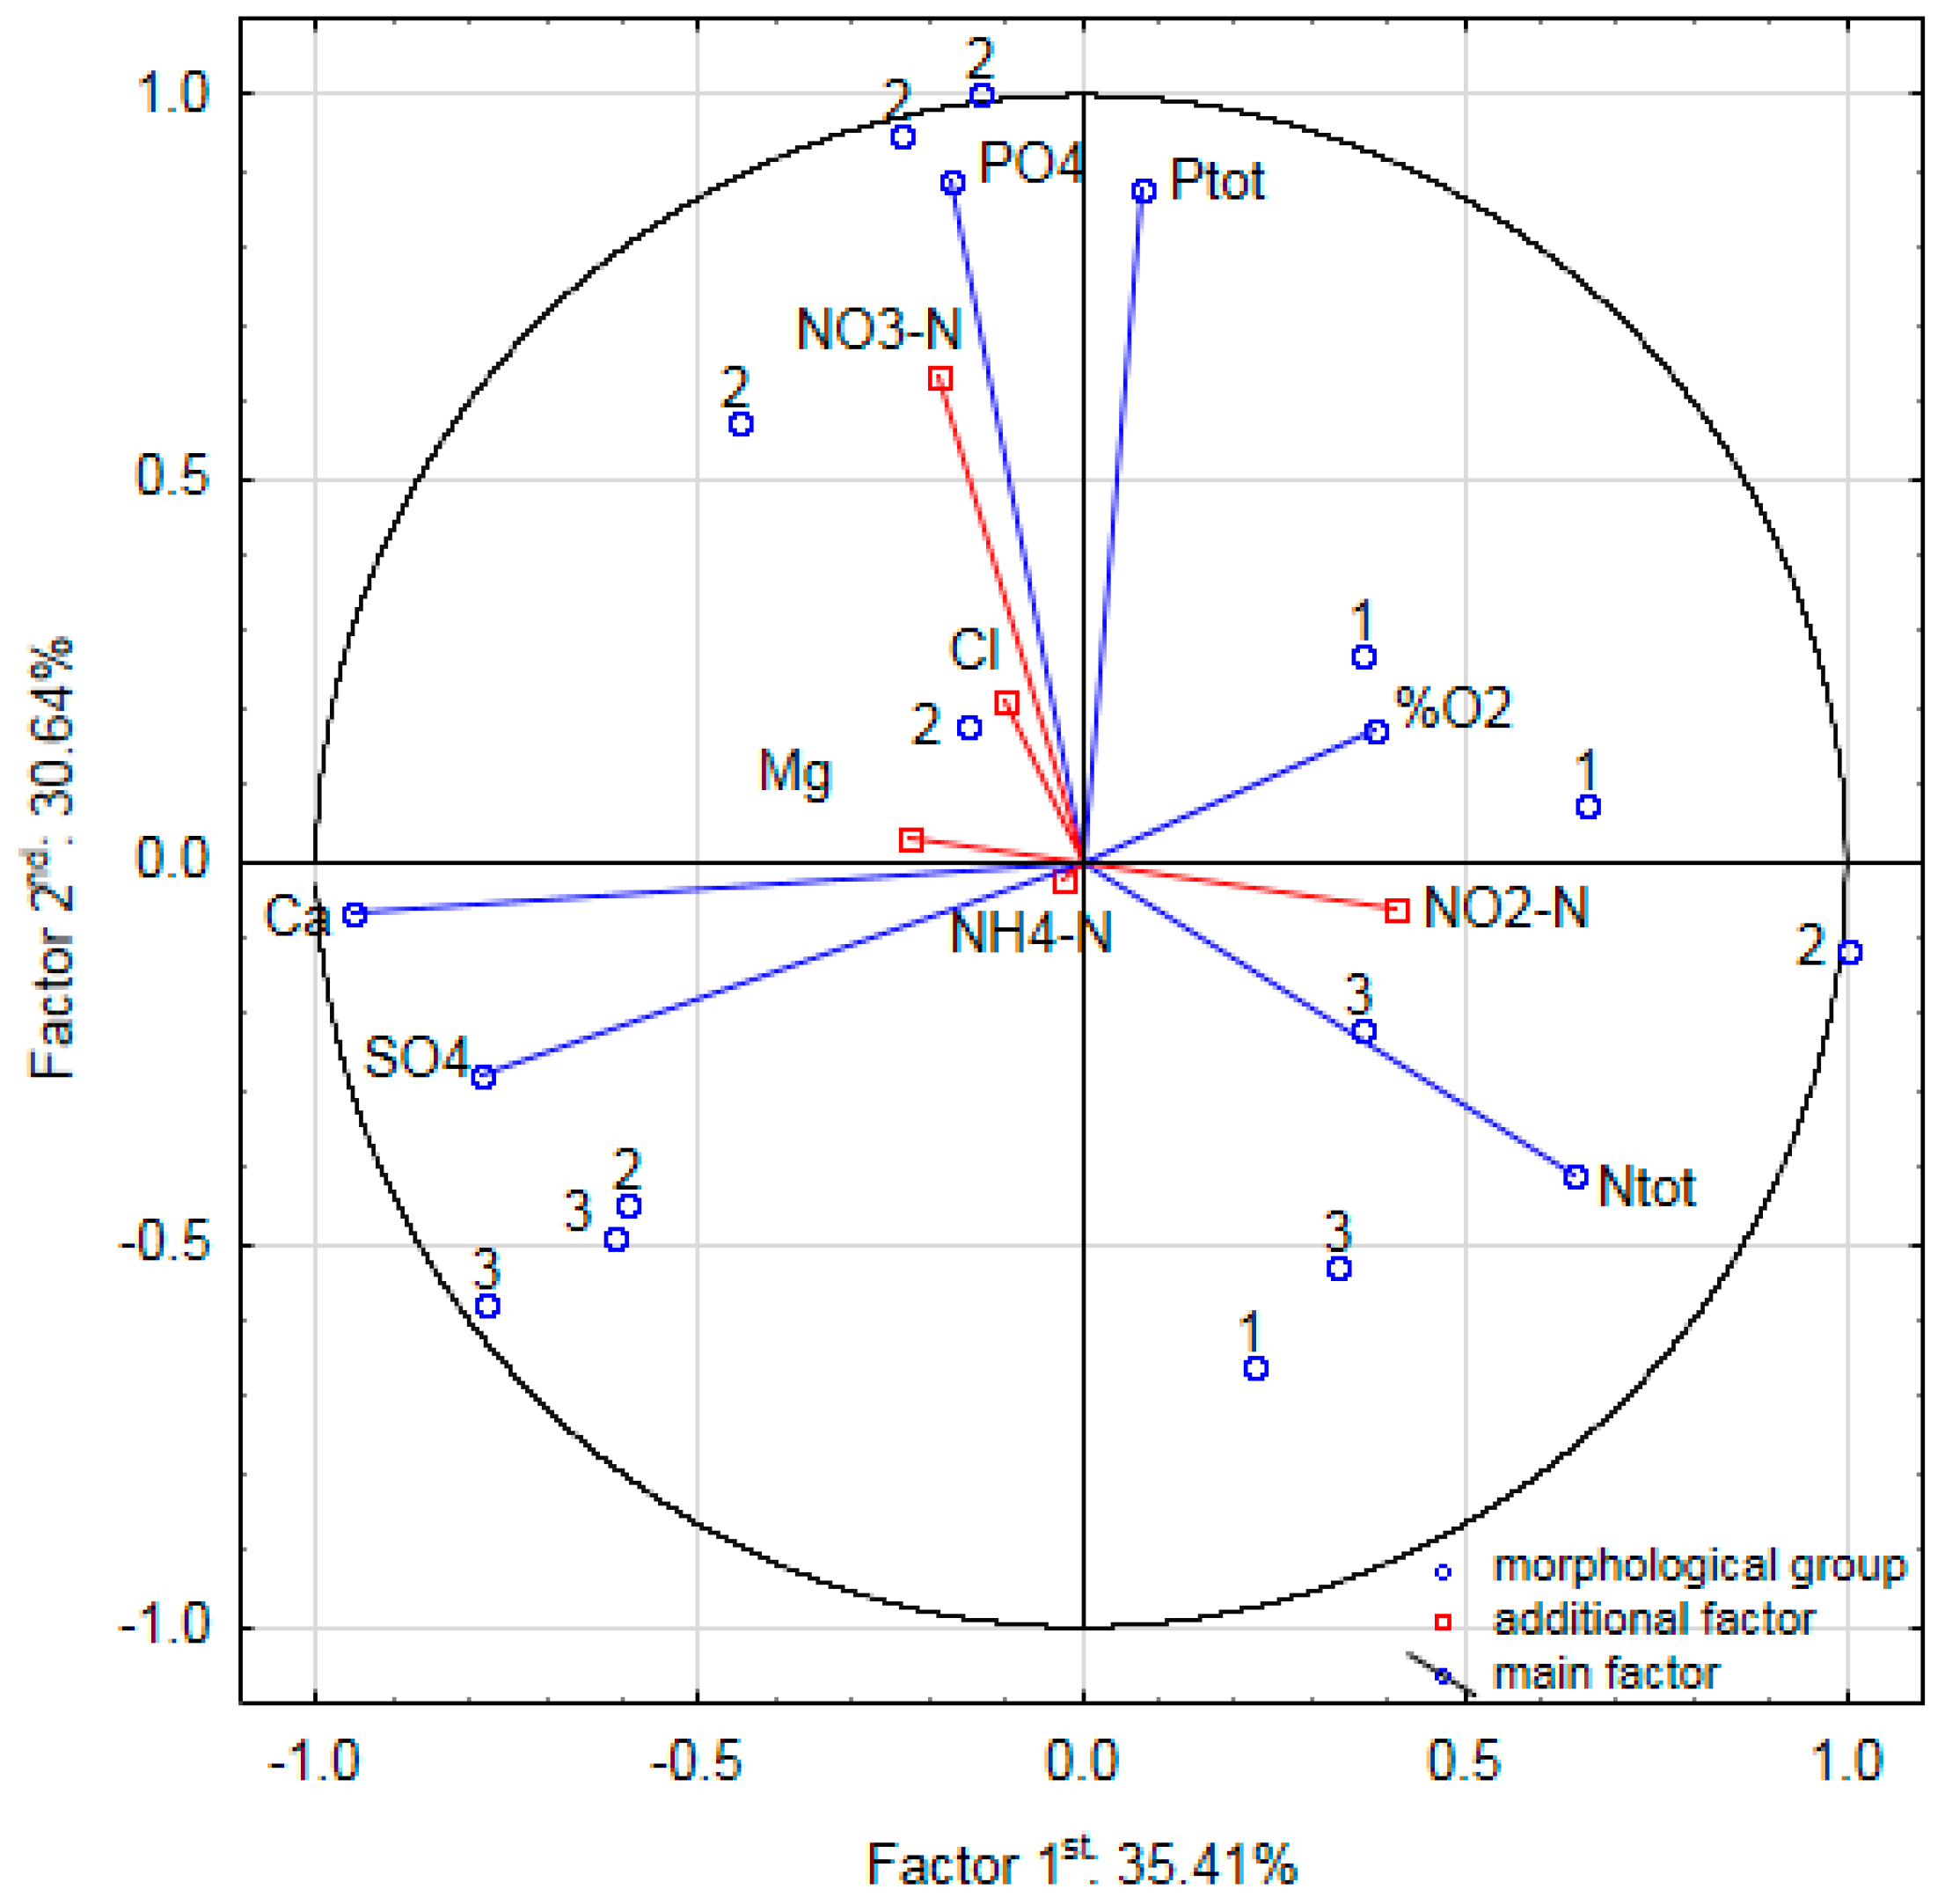
The water in the lakes studied exhibited high biological productivity. The PCA of the measured physico-chemical parameters of the surface water did not reveal any significant differences between the lakes within the morphological groups under study (Figure 6). The first two axes were significant and together accounted for 66% of the variation in the physico-chemical parameters of the water. The first principal axis accounted for 35% of the variation in water quality of the lakes and was negatively correlated with PO43− (r = −0.82) and TP (r = −0.77) and positively correlated with TN (r = 0.41). The second principal axis accounted for an additional 31% of the variation in the water quality of the lakes and was positively correlated with SO42− (r = 0.76) and Ca2+ (r = 0.72) and negatively correlated with oxygen saturation (r = −0.60). The phosphorus content varied between 1 and 12 mg P L−1. The nitrogen content ranged between 15 and 35 mg N L−1. According to Carlson’s Trophic State Index [19], the lakes under study are either eutrophic or hypereutrophic.
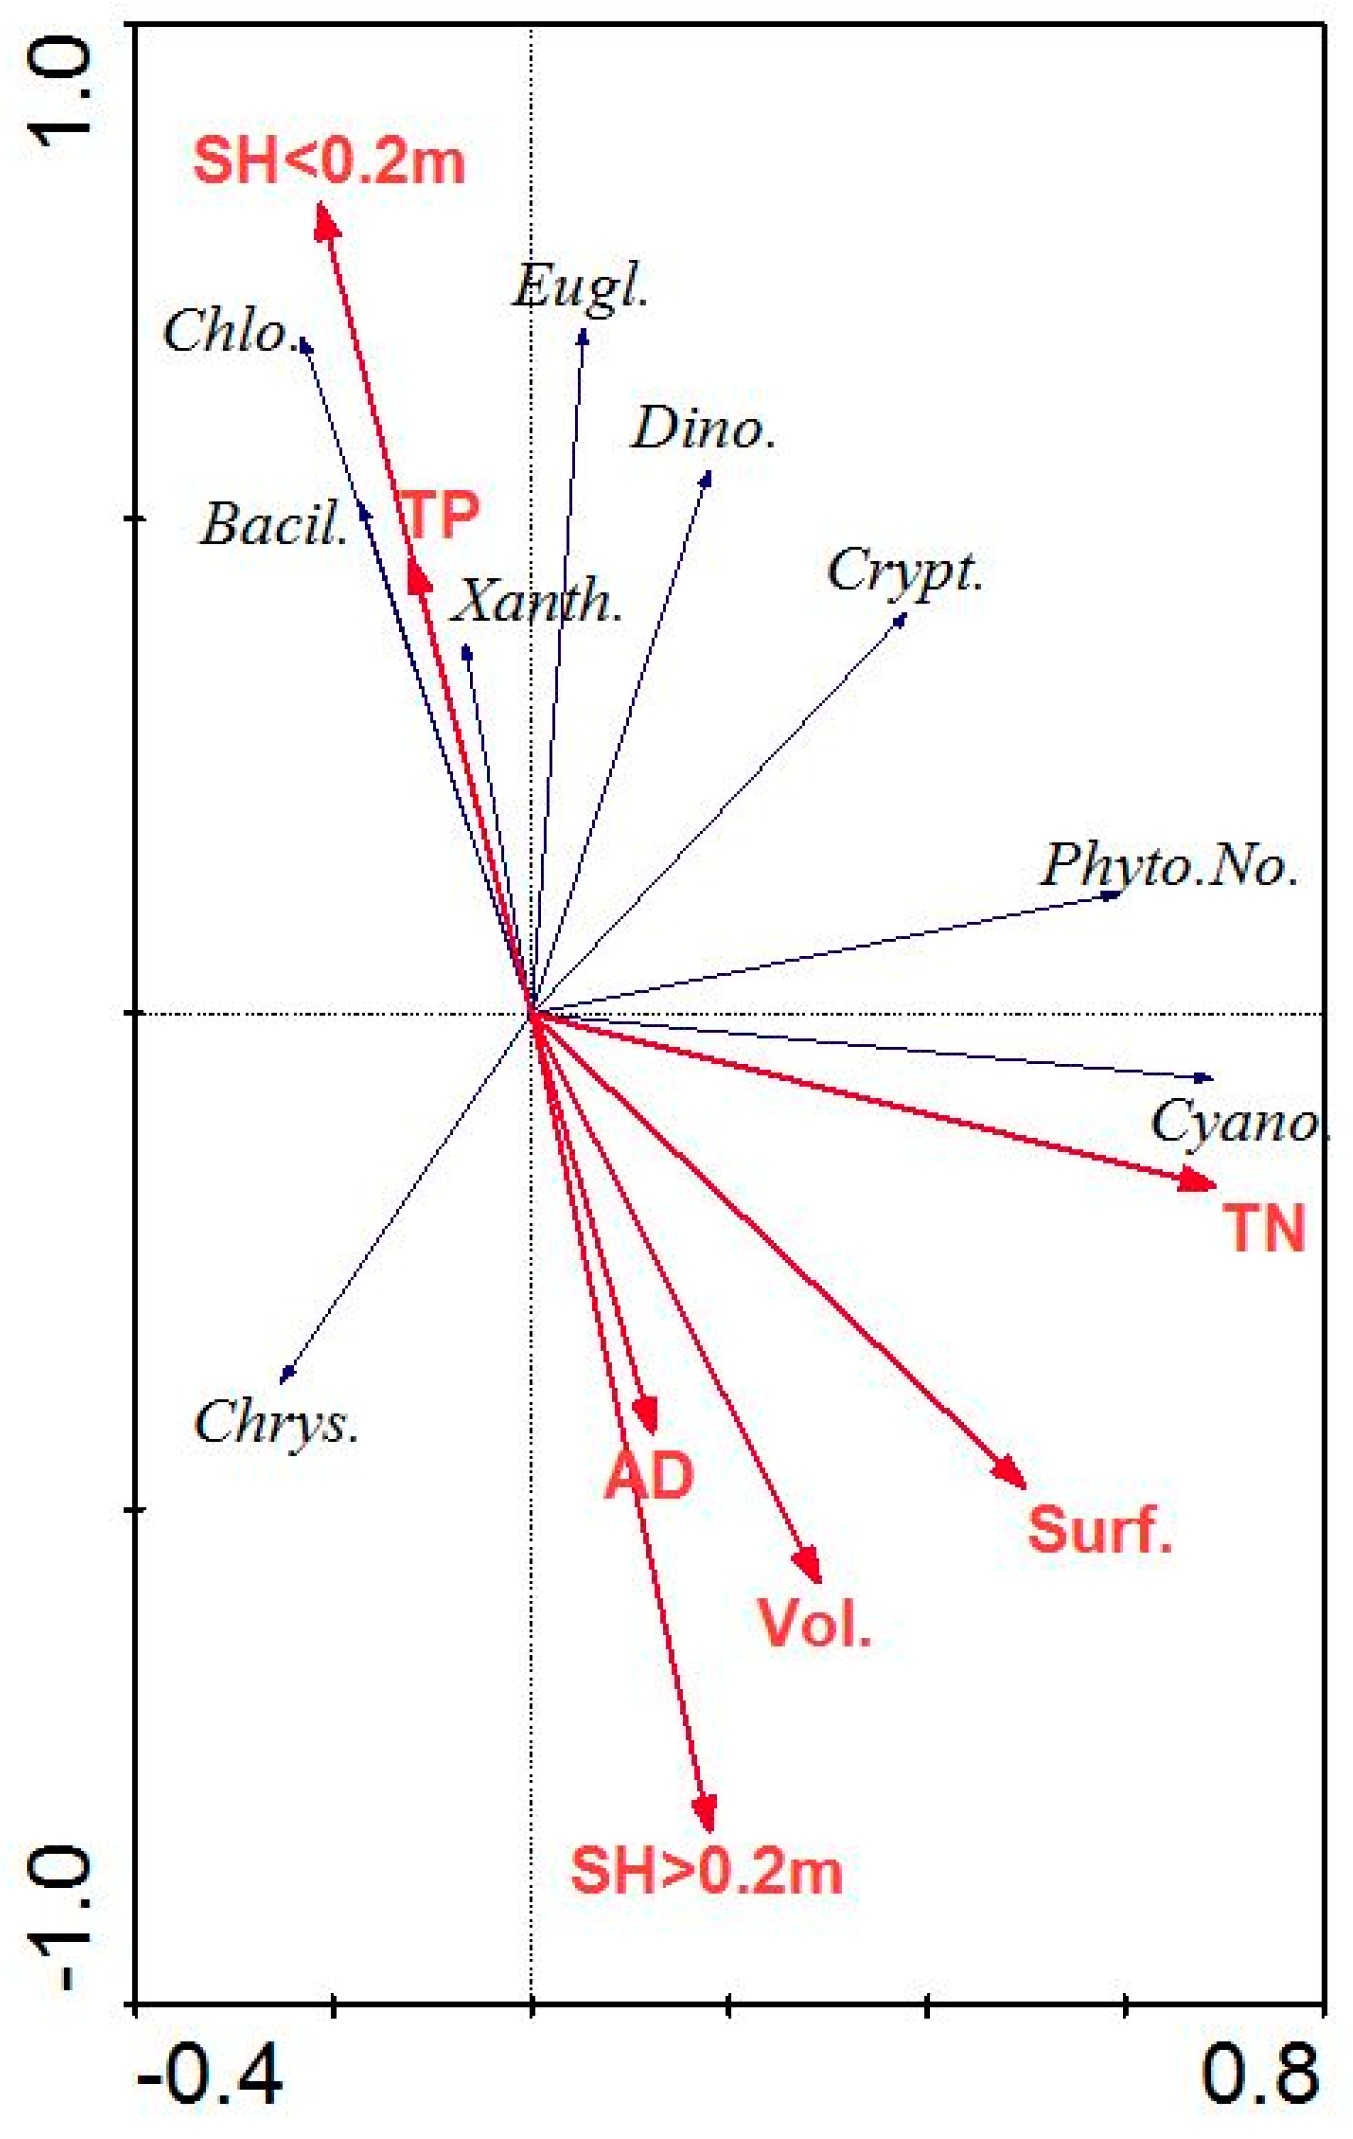
In order to better understand the changes in lake shallowing, we additionally analyzed the phytoplankton content and water quality in terms of the nitrogen and phosphorus content. The RDA showed that the first two axes explain 97.8% of the phytoplankton and environmental variances (Figure 7). The correlation between the phytoplankton content and the environmental variables was statistically significant (test of significance of all canonical axes: F = 4.02; p = 0.04). The canonical coefficients indicate that the first axis is a gradient of the increasing high shallowing rate and decreasing morphological lake parameters and low rate of lake shallowing, whereas the second axis is a gradient of decreasing nitrogen concentrations in the water (Table 4).
High rates of shallowing, volume, and surface area changes were not only positively correlated with the average depth but negatively correlated with the high chlorophyte content (Figure 7). The morphometric parameters of the lakes (lake surface area and volume) and low rate of lake shallowing (<0.2 m) were negatively correlated with most of the phytoplankton groups (Chlorophyta, Euglenophyta, Bacillariophyceae, and Xanthophyceae) and positively correlated with a significant increase of the lake sediment and negatively correlated with P concentration in the water. However, no positive correlation between the total phytoplankton or cyanobacteria content and the morphological parameters of the lakes was observed. The growth of cyanobacteria was correlated with high nitrogen concentration, while other groups of phytoplankton were correlated with high concentrations of phosphates, except Chrysophytes, in the water.
4. Discussion
4.1. Assessment of the Impact of Lake Morphology on the Process of Shallowing
The study showed that the smallest and shallowest lakes exhibited the highest rate of shallowing. The lakes under study varied in terms of the shallowing rate, with the dominant depth of sediment growth equal to 20 cm. The average sedimentation rate was 0.4 cm year−1. On average, this value accounted for 79.2% of the entire process for all of the lakes under study. These results are not surprising, as shallowing lakes are the ecosystems that are most endangered and prone to disappearance [24,25] due to their low resistance to degradation (low depth, long shoreline, and small volume). The highest rate of lake disappearance is observed in vertical and horizontal directions and results from accelerating eutrophication [26], excessive transport of autochthonous matter from the catchment, or decreasing water levels [2]. One of the effects of eutrophication is the intense growth of phytoplankton or submerged macrophytes decay, accelerating the accumulation of organic matter in the sediment. From the 1950s forward, the rate of sedimentation in Lake Apopka, Florida, was estimated to be between 0.9 and 1.5 cm year−1 caused by wave action on the lake bottom following the loss of macrophyte dominance in the lake [27]. For example, the pelagic sediment accumulation in the eutrophic Lake Chimaditida was estimated at <1.0 cm year−1 [24] caused by prolonged water level decrease. An intense sedimentation of 3.0 cm year−1 [28] was also observed in the catchment of wetlands in Louisiana, although it resulted in prolonged eutrophication due to intensive farming in the direct catchment area.
The analysis of the bathymetric plans spanning a 50-year period showed that the shallowing due to the accumulation of 20 cm of sediment occurring mainly in the central parts of the lakes. The shallowing process was more intense in the littoral zones. Two processes, sedimentation and sedentation, including the deposition of organic and mineral matter under the impact of gravity and the deposition of matter as a result of vegetation and phytoplankton growth, affected the shallowing processes in this area. The spatial analysis showed that sites with a high rate of shallowing were affected by the topography of the immediate surroundings of the lake, thus confirming the results of the study conducted by Alahuhta et al. [29]. A good example of this would be Lake Włóknieńskie, where the shallowing was the most intense in the northeastern part of the reservoir featuring a steep slope (over 20 m high), providing an abundant supply of matter as a result of surface runoff [1].
Citterio and Piégay [30] emphasized the importance of the flow properties of the lake for the shallowing process. Depending on the hydraulic relationship between the lake and the river, the size of the river, etc., it is possible that the supply of matter to the lake will increase, resulting in an increase in deposition in the estuary zone. The accumulation of matter is the most intense in the tributary areas, although the lakes under study did not have any deltas characteristic of such reservoirs, only exhibiting greater sediment thickness. This could be due to the low river discharge in the case of the rivers entering the lakes under study. The shallowing process in the river estuary zone was the most intense in Lake Wielkie (tributary of Kanał Boszkowski), Lake Maciejak (tributary of Mała Wełna), and Lake Gąsawskie (tributary of Gąsawka), which exhibit diverse morphological parameters. In some parts of the lakes, we have observed the reverse process, namely lake deepening due to the transfer of suspended sediment by wind or water movement [30,31]. However, in the case of the lakes under study, this process was observed only in some parts of Lake Linicjusz in the estuary zone, which may suggest that the export of previously deposited semi-liquid (and therefore mobile) sediments followed that path.
4.2. The Impact of the Shallowing Process on the Development of Macrophytes
The highest rate of shallowing was observed in the smallest lakes. These results confirm the study by Egerston et al. [32], in which it was shown that shallow lakes are more susceptible to vegetation overgrowth than deep lakes with a high nutrient content. However, larger lakes offer more diverse habitats for vegetation [33,34] which could theoretically accelerate the growth of plants. On the other hand, in the case of larger lakes, wind and wave action significantly reduce succession of vegetation, particularly for emergent plants which are vulnerable to these processes [35,36].
Egerston et al. [32] showed that shallow lakes are more prone to overgrowth by emergent plants. Our study demonstrated that shallow lakes exhibit a high rate of overgrowth by emergent plants. These results were also confirmed by Ptak [37], who stated that shallowing accelerates the processes related to plant succession. Continuous lake-bottom increase in the littoral zone creates favorable conditions for the development of helophytes. Rzętała [38] also observed that the most intense development of the littoral zone takes place in its shallowest parts, resulting in the lake filled with biomass. In boreal lakes, paludification plays an important role in vegetation succession, mostly related to emergent vegetation [7]. Intense development of macrophytes accelerates the accumulation of organic sediments and the shallowing process. In the Florida Everglades, Reddy et al. [39] indicated an accelerated accumulation of organic sediments by 0.25–1.1 cm year−1 for Cladium jamaicense, an emergent macrophyte species similar to Phragmites australis. These results can also explain the higher rate of shallowing in the shallow parts of the lakes studied.
The process of lake shallowing, especially in the case of lakes with significant sediment growth, had a significant impact on the development of rush vegetation in the lakes under analysis. At the same time, the process had little impact on the development of other plant groups (submerged and floating-leaf plants). The regression analysis showed the impact of the shallowing process and the lake surface area on the development of the littoral zone, mainly determined by the intensity of the development of emergent vegetation. Surprisingly, nymphaeids did not respond to the shallowing rate, yet preferred sites with a high content of organic matter [40] and was often the dominant type of vegetation in the shallowing lakes or the shallow parts of deeper lakes (0.5 to 3 m in depth). The preference of nymphaeids for habitats exhibiting intense biological productivity results from the high nutrient content in plant biomass, which is not the case for emergent vegetation [41]. Increased sediment thickness may lead to high plant productivity within the patches, which is particularly important for eutraphent species such as Nuphar lutea [42]. The fact that nymphaeids are not sensitive to shallowing can be partly attributed to intensive growth of emergent macrophytes. Crisman et al. [26] observed intense overgrowth of Lake Chimaditida by emergent macrophytes (Phragmites) which was followed by a decrease of the water level. Moreover, helophyte succession was not caused by shallowing, but rather by the decrease of the water level which resulted in the decrease of water depth. Furthermore, Crisman et al. [43] presented a detailed analysis of water level fluctuations and changes in the reed coverage at Lake Koroni in Northern Greece. The authors stated that the decrease of the water level as a result of groundwater absorption for farming purposes was accompanied by reed expansion. The decrease of the water level was the most important factor for Lake Włóknieńskie which was an integral part of the neighboring Lake Brzeźno in the 19th century. Irrigation-induced decrease of the water level resulted in the division of the reservoir into two separate basins connected by the Dzwonówka watercourse. The parts of Lake Włókna that were exposed as a result of the water level decrease have created favorable conditions for the development of macrophytes. Additionally, in the case of lakes located in the Mediterranean climate zone, the decrease of the water levels results in increased macrophyte coverage [2]. However, intense succession of emergent macrophytes in our studies resulted mostly from eutrophication and not from a decreasing water level.
The percentage of emergent macrophytes in the lakes under study could be estimated on the basis of the shallowing rate and the lake surface area. These results partly support the studies conducted by Smith and Wallsten [33], who demonstrated the possibility of predicting the maximum coverage by emergent vegetation on the basis of the morphological properties of the lakes, such as the surface area, mean depth, and nitrogen concentration, for Swedish lakes. In our study, nutrient content was not the most important factor in the development of macrophytes and thus was not included in the RDA and regression analyses because it did not present any significant correlation with the size of the littoral zone or the abundances of macrophyte forms. The differences between these results may be connected with high nutrient concentrations in the water and sediments in the lakes studied and lack of nutrient limitation that would inhibit plant development.
The analysis of lake overgrowth showed that the lakes with the highest overgrowth rates also exhibited the fastest rates of decline. The shallowing process was the most intense in the case of the shallowest lakes, for which the widest spatial distribution of depths of less than 1 m was recorded. This situation may also be correlated with steeper lake slopes and thus less favorable conditions for the development of coastal vegetation which, after the completion of the growing season, takes part in the process of shallowing in the form of dead matter. However, this parameter was not decisive.
4.3. Intensity of Phytoplankton Blooms in Lakes with Varied Morphology
The analysis of phytoplankton showed a high content of cyanobacteria in all of the lakes under study. This is typical of lakes with high biological productivity that are subject to intense eutrophication [44,45]. The phytoplankton abundance was not correlated with the morphological parameters of the lakes, which has also been confirmed by previous studies [46]. However, phytoplankton was found to prefer high nitrogen content. In general, the dominance of cyanobacteria in the phytoplankton communities is connected with high phosphorus TP concentrations in water [47]. TP is considered to be a better predictor of cyanobacteria levels than TN:TP ratios [48]. The increase of phosphorus levels from 30 to 100 µg L−1 may result in rapid development of cyanobacteria in the lakes. Carvalho et al. [44] indicated almost exactly the same range on the basis of an analysis of more than 800 medium- and high-alkaline lakes and reservoirs that showed nonlinear correlation between the total cyanobacterial biomass and TP and a significant increase from 20 to 100 µg TP L−1. Dolman et al. [48] studied 102 lakes in Germany and observed a significant increase in cyanobacteria blooms with phosphorus concentrations varying from 20 to approximately 50 µg TP L−1. However, this study was based on measurements conducted in the summer only. According to our studies, all of the lakes exhibited high phosphorus concentrations exceeding 30 µg TP L−1, which can explain the dominance of cyanobacteria. The TP concentration was lower than 40 µg TP L−1 in only two lakes, which may indicate a significant risk of blooms [49]. The TP concentration exceeded 130 µg TP L−1 in 70% of the lakes studied. Moreover, nitrogen has recently been recognized as a significant factor inducing the development of harmful cyanobacteria in inland waters [50]. These results explain the impact of the TN concentrations on the development of cyanobacteria in the lakes studied, which could be further accelerated by the absence of P limitations.
In rare cases, lakes with the highest shallowing and decline rates correlated with chlorophytes rather than cyanobacteria. In lakes with high biological productivity, cyanobacteria are the most common [45,46], increasing the rate of shallowing when they die and become sediment. No direct correlation between the shallowing of the lake and the total volume of phytoplankton was found. This may be due to the fact that the lakes analyzed exhibited high biological productivity and variable intensity of phytoplankton development, and thus other factors could affect the shallowing rate, e.g., the development of vegetation, and allopathic interactions. Therefore, it would be necessary to perform a long-term analysis of the phytoplankton content. Such analysis would allow for an assessment of the impact of phytoplankton blooms on the condition of the lakes and the lake shallowing process. Paleobotanical studies of the lakes at different depths and in different parts could also help us to understand these complex processes. In the lakes under study, the phytoplankton population followed a decreasing tendency from the largest to the smallest lakes, but it was not significant. In addition, low phytoplankton volume in small and the most intensely shallowing lakes may result from the abundance of vegetation. This is especially true for submerged plants, which directly compete for nutrients with phytoplankton.
5. Conclusions
The studies show that the growth of sediments and shallowing of the lake basin create favorable conditions for the development of plants, especially coastal vegetation. Macrophytes were found to be sensitive to changes in lake morphometry, especially the process of lake shallowing and changes in the volume and area of the water bodies. The intensity of phytoplankton blooms depended on a high nitrogen content and unlimited access to phosphorus in the water and did not correlate directly with the morphometric parameters of the lakes under study. No direct correlation between the intensity of phytoplankton blooms and the process of lake shallowing was found, despite the high abundance of phytoplankton, mainly cyanobacteria. The process of lake shallowing was found to be progressing most rapidly in the case of the shallowest and smallest reservoirs, which promoted the succession of macrophytes in the lakes in the direction of the pelagic zone. The group of macrophytes that was found to be the most sensitive to changes in the morphometry of lakes were helophytes. The submerged and floating-leaf plants were the most abundant in the shallowest lakes with an average depth of approximately 2 m, which indicates that the main factor limiting the development of plants are the morphological properties of the water bodies. However, in the case of lakes with an average depth of 3.6 m, the hydrophytes population was small, despite the fact that the depth of water was not a limiting factor for their development. Their growth might have been limited by the intensity of phytoplankton blooms, especially at the beginning of the growing season.
Conversely, the lakes with the highest rate of shallowing were characterized by the greatest share of vegetation, which suggested that vegetation growth had a significant impact on lake shallowing, particularly in the range of low-depth zones. Therefore, an evaluation of the degree of lake disappearance should be made, taking into account the processes of shallowing and overgrowth as these two processes take place simultaneously in the lake ecosystem and are intertwined. It was taken into consideration that the productivity of different groups of organisms and the thickness of the organic matter deposited in different parts of lakes and its origin would permit an evaluation of the impact of different groups of organisms on lake shallowing. It should be also considered that changes in abiotic conditions (temperature, and pH), caused by climatic variation and human activity, enhance the rate of lake transformation.
Supplementary Materials
The following are available online at https://www.mdpi.com/2073-4441/10/12/1827/s1. Table S1: Morphological parameters and attitude of the studied lakes.
Author Contributions
A.L.-M., A.C. designed the study; A.L.-M., M.P., A.C. performed the field survey, S.C. performed phytoplankton analyses, A.L.-M. conducted statistical analyses, A.L.-M., M.P. formal analysis and drafted the manuscript; A.L.-M., S.C. reviewed and edited the manuscript. All authors approved the final version before submission.
Funding
This study was financially supported by the National Science Centre (grant No. 2011/03/B/NZ9/03774) titled “The impact of human pressure on overgrowing and shallowing of lakes”.
Acknowledgments
We gratefully acknowledge Krzysztof Achtenberg and Tomasz Maliński for field cooperation, and Barbara Andrzejewska for laboratory work.
Conflicts of Interest
The authors declare no conflicts of interest.
References
- Alahuhta, J.; Kanninen, A.; Hellsten, S.; Vuori, K.M.; Kuoppala, M.; Hämäläinen, H. Variable response of functional macrophyte groups to lake characteristics, land use, and space: Implications for bioassessment. Hydrobiologia 2014, 737, 201–214. [Google Scholar] [CrossRef]
- Jeppesen, E.; Brucet, S.; Naselli-Flores, L.; Papastergiadou, E.; Stefanidis, K.; Nõges, T.; Nõges, P.; Attayde, J.L.; Zohary, T.; Coppens, J.; et al. Ecological impacts of global warming and water abstraction on lakes and reservoirs due to changes in water level and related changes in salinity. Hydrobiologia 2015, 750, 201–227. [Google Scholar] [CrossRef] [Green Version]
- Kolada, A. The effect of lake morphology on aquatic vegetation development and changes under the influence of eutrophication. Ecol. Indic. 2014, 38, 282–293. [Google Scholar] [CrossRef]
- Yan, L.; Zheng, M. The response of lake variations to climate change in the past forty years: A case study of the northeastern Tibetan Plateau and adjacent areas, China. Quat. Int. 2015, 371, 31–48. [Google Scholar] [CrossRef]
- Vitousek, P.M.; Howarth, R.W. Nitrogen Limitation on Land and in the Sea: How Can It Occur? Nitrogen limitation on land and in the sea: How can it occur? Biogeochemistry 2007, 13, 87–115. [Google Scholar] [CrossRef]
- Choiński, A.; Ptak, M.; Ławniczak, A.E. Changes in water resources of Polish lakes as influenced by natural and anthropogenic factors. Pol. J. Environ. Stud. 2016, 25, 1883–1890. [Google Scholar] [CrossRef]
- Partanen, S.; Luoto, M. Environmental determinants of littoral paludification in boreal lakes. Limnologica 2006, 36, 98–109. [Google Scholar] [CrossRef]
- Strayer, D.L.; Findlay, S.E.G. Ecology of freshwater shore zones. Aquat. Sci. 2010, 72, 127–163. [Google Scholar] [CrossRef] [Green Version]
- Dunalska, J.A.; Grochowska, J.; Wiśniewski, G.; Napiórkowska-Krzebietke, A. Can we restore badly degraded urban lakes? Ecol. Eng. 2015, 82, 432–441. [Google Scholar] [CrossRef]
- Lawniczak, A.E.; Zbierska, J.; Nowak, B.; Achtenberg, K.; Grześkowiak, A.; Kanas, K. Impact of agriculture and land use on nitrate contamination in groundwater and running waters in central-west Poland. Environ. Monit. Assess. 2016, 188, 172. [Google Scholar] [CrossRef]
- Bai, J.; Chen, X.; Li, J.; Yang, L.; Fang, H. Changes in the area of inland lakes in arid regions of central Asia during the past 30 years. Environ. Monit. Assess. 2011, 178, 247–256. [Google Scholar] [CrossRef] [PubMed]
- Søndergaard, M.; Phillips, G.; Hellsten, S.; Kolada, A.; Ecke, F.; Mäemets, H.; Mjelde, M.; Azzella, M.M.; Oggioni, A. Maximum growing depth of submerged macrophytes in European lakes. Hydrobiologia 2013, 704, 165–177. [Google Scholar] [CrossRef]
- Mohamed, Z.A. Macrophytes-cyanobacteria allelopathic interactions and their implications for water resources management—A review. Limnologica 2017, 63, 122–132. [Google Scholar] [CrossRef]
- Silliman, J.E.; Schelske, C.L. Saturated hydrocarbons in the sediments of Lake Apopka, Florida. Org. Geochem. 2003, 34, 253–260. [Google Scholar] [CrossRef]
- Scheffer, M.; Hosper, S.H.; Meijer, M.L.; Moss, B.; Jeppesen, E. Alternative equilibria in shallow lakes. Trends Ecol. Evol. 1993, 8, 275–279. [Google Scholar] [CrossRef]
- Hilt, S.; Brothers, S.; Jeppesen, E.; Veraart, A.J.; Kosten, S. Translating Regime Shifts in Shallow Lakes into Changes in Ecosystem Functions and Services. BioScience 2017, 67, 928–936. [Google Scholar] [CrossRef]
- EU. Directive 2000/60/EC of the European Parliament and of the Council of 23 Oct. 2000 Establishing a Frame-Work for Community Action in the Field of Water Policy; The Publications Office of the European Union: Luxembourg, 2000. [Google Scholar]
- Lawniczak-Malińska, A.E.; Achtenberg, K. Indicator values of emergent vegetation in overgrowing lakes in relation to water and sediment chemistry. Water 2018, 10, 498. [Google Scholar] [CrossRef]
- Carlson, R.E. A trophic state index for lakes. Limnol. Oceanogr. 1977, 22, 361–369. [Google Scholar] [CrossRef] [Green Version]
- Choiński, A. Physical Limnology of Poland; Adam Mickiewicz University in Poznań: Poznań, Poland, 2007. [Google Scholar]
- Braun-Blanquet, J. Pflanzensoziologie; Grundzüge der Vegetationskunde; Springer-Verlag Wien: New York, NY, USA, 1964. (In German) [Google Scholar]
- Maimon, O.; Rokach, L. Data Mining and Knowledge Discovery Handbook; Springer: Boston, MA, USA, 2005. [Google Scholar]
- Ter Braak, C.J.F.; Smilauer, P. CANOCO Reference Manual and CanoDraw for Windows User’s Guide Software for Canonical Community Ordination (Version 4.5); Biometris: Wageningen, The Netherlands, 2002. [Google Scholar]
- Brenner, M.; Schelske, C.L.; Keenan, L.W. Historical rates of sediment and nutrient accumulation in marshes of the upper St. Johns River Basin, Florida, USA. J. Paleolimnol. 2001, 26, 241–257. [Google Scholar] [CrossRef]
- Schelske, C.L.; Lowe, E.F.; Kenney, W.F.; Battoe, L.E.; Brenner, M.; Coveney, M.F. How anthropogenic darkening of Lake Apopka induced benthic light limitation and forced the shift from macrophyte to phytoplankton dominance. Limnol. Oceanogr. 2010, 55, 1201–1212. [Google Scholar] [CrossRef] [Green Version]
- Crisman, T.L.; Mitraki, C.; Zalidis, G. Integrating vertical and horizontal approaches for management of shallow lakes and wetlands. Ecol. Eng. 2005, 24, 379–389. [Google Scholar] [CrossRef]
- Bachmann, R.W.; Hoyer, M.V.; Vinzon, S.B.; Canfield, D.E. The origin of the fluid mud layer in Lake Apopka, Florida. Limnol. Oceanogr. 2005, 50, 629–635. [Google Scholar] [CrossRef] [Green Version]
- Trepagnier, C.M.; Kogas, M.A.; Turner, R.E. Evaluation of Wetland Gain and Loss of Abandoned Agricultural Impoundments in South Louisiana, 1978–1988. Restor. Ecol. 1995, 3, 299–303. [Google Scholar] [CrossRef]
- Alahuhta, J.; Luukinoja, J.; Tukiainen, H.; Hjort, J. Importance of spatial scale in structuring emergent lake vegetation across environmental gradients and scales: GIS-based approach. Ecol. Indic. 2016, 60, 1164–1172. [Google Scholar] [CrossRef]
- Citterio, A.; Piégay, H. Overbank sedimentation rates in former channel lakes: Characterization and control factors. Sedimentology 2009, 56, 461–482. [Google Scholar] [CrossRef]
- Tammeorg, O.; Niemistö, J.; Möls, T.; Laugaste, R.; Panksep, K.; Kangur, K. Wind-induced sediment resuspension as a potential factor sustaining eutrophication in large and shallow Lake Peipsi. Aquat. Sci. 2013, 75, 559–570. [Google Scholar] [CrossRef]
- Egertson, C.J.; Kopaska, J.A.; Downing, J.A. A century of change in macrophyte abundance and composition in response to agricultural eutrophication. Hydrobiologia 2004, 524, 145–156. [Google Scholar] [CrossRef]
- Smith, V.H.; Wallsten, M. Prediction of Emergent and Floating-leaved Macrophyte Cover Swedish Lakes. Can. J. Fish. Aquat. Sci. 1986, 43, 2519–2523. [Google Scholar] [CrossRef]
- Vestergaard, O.; Sand-Jensen, K. Aquatic macrophyte richness in Danish lakes in relation to alkalinity, transparency, and lake area. Can. J. Fish. Aquat. Sci. 2000, 57, 2022–2031. [Google Scholar] [CrossRef]
- Riis, T.; Hawes, I. Effect of wave exposure on vegetation abundance, richness and depth distribution of shallow water plants in a New Zealand lake. Freshw. Biol. 2003, 48, 75–87. [Google Scholar] [CrossRef]
- Ogdahl, M.E.; Steinman, A.D. Factors influencing macrophyte growth and recovery following shoreline restoration activity. Aquat. Bot. 2015, 120, 363–370. [Google Scholar] [CrossRef]
- Ptak, M. Historical medium-scale maps as a source of information on the overgrowing of lakes. Limnol. Rev. 2013, 13, 155–162. [Google Scholar] [CrossRef]
- Jagus, A.; Rzetala, M. Influence of Agricultural Anthropopression on Water Quality of the Dam Reservoirs. Ecol. Chem. Eng. S/Chem. I Inzynieria Ekologiczna S 2011, 18, 359–367. [Google Scholar]
- Reddy, K.R.; DeBusk, W.F.; DeLaune, R.D.; Koch, M.S. Long-Term Nutrient Accumulation Rates in the Everglades. Soil Sci. Soc. Am. J. 1993, 57, 1147. [Google Scholar] [CrossRef]
- Schoelynck, J.; Bal, K.; Verschoren, V.; Penning, E.; Struyf, E.; Bouma, T.; Meire, D.; Meire, P.; Temmerman, S. Different morphology of Nuphar lutea in two contrasting aquatic environments and its effect on ecosystem engineering. Earth Surf. Process. Landf. 2014, 39, 2100–2108. [Google Scholar] [CrossRef] [Green Version]
- Lawniczak, A.E.; Zbierska, J.; Choiński, A.; Szczepaniak, W. Response of emergent macrophytes to hydrological changes in a shallow lake, with special reference to nutrient cycling. Hydrobiologia 2010, 656, 243–254. [Google Scholar] [CrossRef] [Green Version]
- Bornette, G.; Puijalon, S. Response of aquatic plants to abiotic factors: A review. Aquat. Sci. 2011, 73, 1–14. [Google Scholar] [CrossRef]
- Crisman, T.L.; Alexandridis, T.K.; Zalidis, G.C.; Takavakoglou, V. Phragmites distribution relative to progressive water level decline in Lake Koronia, Greece. Ecohydrology 2014, 7, 1403–1411. [Google Scholar] [CrossRef]
- Carvalho, L.; Mcdonald, C.; de Hoyos, C.; Mischke, U.; Phillips, G.; Borics, G.; Poikane, S.; Skjelbred, B.; Solheim, A.L.; Van Wichelen, J.; et al. Sustaining recreational quality of European lakes: Minimizing the health risks from algal blooms through phosphorus control. J. Appl. Ecol. 2013, 50, 315–323. [Google Scholar] [CrossRef]
- Descy, J.P.; Leprieur, F.; Pirlot, S.; Leporcq, B.; Van Wichelen, J.; Peretyatko, A.; Teissier, S.; Codd, G.A.; Triest, L.; Vyverman, W.; et al. Identifying the factors determining blooms of cyanobacteria in a set of shallow lakes. Ecol. Inform. 2016, 34, 129–138. [Google Scholar] [CrossRef]
- Izaguirre, I.; Allende, L.; Escaray, R.; Bustingorry, J.; Pérez, G.; Tell, G. Comparison of morpho-functional phytoplankton classifications in human-impacted shallow lakes with different stable states. Hydrobiologia 2012, 698, 203–216. [Google Scholar] [CrossRef]
- Søndergaard, M.; Lauridsen, T.L.; Johansson, L.S.; Jeppesen, E. Nitrogen or phosphorus limitation in lakes and its impact on phytoplankton biomass and submerged macrophyte cover. Hydrobiologia 2017, 795, 35–48. [Google Scholar] [CrossRef]
- Dolman, A.M.; Rücker, J.; Pick, F.R.; Fastner, J.; Rohrlack, T.; Mischke, U.; Wiedner, C. Cyanobacteria and cyanotoxins: The influence of nitrogen versus phosphorus. PLoS ONE 2012, 7, e38757. [Google Scholar] [CrossRef] [PubMed]
- Havens, K.E.; Walker, W.W. Development of a total phosphorus concentration goal in the TMDL process for Lake Okeechobee, Florida (USA). Lake Reserv. Manag. 2002, 18, 227–238. [Google Scholar] [CrossRef]
- Vermonden, K.; Leuven, R.S.E.W.; van der Velde, G.; Hendriks, A.J.; van Katwijk, M.M.; Roelofs, J.G.M.; Lucassen, E.C.H.E.T.; Pedersen, O.; Sand-Jensen, K. Species pool versus site limitations of macrophytes in urban waters. Aquat. Sci. 2010, 72, 379–389. [Google Scholar] [CrossRef] [Green Version]
Figure 1.
Comparative profiles of the two time periods, (A) 1960 and (B) 2015, under analysis along a cross section through the deepest part of the lake; and (C) shallowing rate of Lake Maciejak as an example.
Figure 1.
Comparative profiles of the two time periods, (A) 1960 and (B) 2015, under analysis along a cross section through the deepest part of the lake; and (C) shallowing rate of Lake Maciejak as an example.

Figure 2.
Correlation between the lakes studied with regard to their morphological parameters (heatmap) presented using a hierarchical tree diagram to show the three groups of lakes that are similar in terms of lake surface area, volume, depth, and length of the shoreline.
Figure 2.
Correlation between the lakes studied with regard to their morphological parameters (heatmap) presented using a hierarchical tree diagram to show the three groups of lakes that are similar in terms of lake surface area, volume, depth, and length of the shoreline.

Figure 3.
Differences in the (A) littoral zone coverage and macrophyte growth formations (B) emergent, (C) nymphaeids, and (D) submerged vegetation) in the studied water bodies between different morphological groups.
Figure 3.
Differences in the (A) littoral zone coverage and macrophyte growth formations (B) emergent, (C) nymphaeids, and (D) submerged vegetation) in the studied water bodies between different morphological groups.

Figure 4.
Ordination diagram (biplot) based on the Redundancy analyses (RDA) of macrophyte parameters and selected morphological parameters of the lakes under study. The length of the arrows representing some of the morphological variables emphasizes their significant impact on the distribution of macrophyte development. Abbreviations: SH < 0.2 m—shallowing rate lower than 0.2 m, SH > 0.2 m—shallowing rate higher than 0.2 m, AD—average depth, Vol.—volume, Surf.—surface area, ^Vol.—volume changes (1960–2015), ^Surf.—surface area changes (1960–2015), PEL.—pelagic, LIT.—littoral, EMERG.—emergent, NYMPH.—nymphaeids, SUBMER.—submerged.

Figure 5.
Abundance of phytoplankton (A) and percentage of different phytoplankton groups (B) within the morphological groups of lakes analyzed. Abbreviations: Bacil.—Bacillariophyceae, Chlo—Chlorophyta, Chrys—Chrysophyceae, Crypt.—Cryptophyceae, Cyano—Cyanobacteria, Dino—Dinophyta, Eugl.—Euglenophyta, Xanth—Xanthophyceae.

Figure 6.
Principal Component Analysis of the measured physico-chemical parameters of the surface water in relation to the selected morphological groups. Abbreviations: Ntot—total nitrogen, NO2-N—nitrite, NO3-N—nitrate, NH4-N—ammonium, Ptot—total phosphorus, PO4—orthophosphate, SO4—sulphates, Ca—calcium, Mg—magnesium, Cl—chlorides, %O2—oxygen concentration.

Figure 7.
Ordination diagram (biplot) based on the RDA of phytoplankton parameters and selected morphological parameters of the lakes under study. Abbreviations: SH < 0.2 m—shallowing rate lower than 0.2 m, SH > 0.2 m—shallowing rate higher than 0.2 m, AD—average depth, Vol.—volume, Surf.—surface, TN—total nitrogen, TP—total phosphorus, Bacil.—Bacillariophyceae, Chlo—Chlorophyta, Chrys.—Chrysophytes, Crypt.—Cryptophyceae, Cyano—Cyanobacteria, Dino—Dinophyta, Eugl.—Euglenophyta, Xanth—Xanthophyceae, Phyto.No.—total number of phytoplankton individuals.


Table 1.
Changes in the selected morphological parameters, high and low rates of shallowing, volume, and surface area changes during 1960–2015 between selected morphological groups of lakes. Significant differences are indicated as different letters.
Table 1.
Changes in the selected morphological parameters, high and low rates of shallowing, volume, and surface area changes during 1960–2015 between selected morphological groups of lakes. Significant differences are indicated as different letters.
| Parameter | Unit | Group of Morphology | F | p | ||
|---|---|---|---|---|---|---|
| 1 | 2 | 3 | ||||
| Surface area | ha | 84.7 ± 10.83 a | 49.92 ± 10.26 b | 22.06 ± 6.44 c | 76.73 | 0.000 |
| Volume change | mln m3 | 4.43 ± 1.64 a | 1.86 ± 1.63 b | 0.40 ± 0.18 c | 50.52 | 0.000 |
| Average depth | m | 5.30 ± 2.19 a | 3.59 ± 2.80 b | 1.82 ± 0.61 c | 53.57 | 0.000 |
| Shallowing <0.2 m | m | 88.33 ± 7.10 a | 70.14 ± 22.54 ab | 64.36 ± 14.54 b | 7.00 | 0.006 |
| Shallowing >0.2 m | m | 11.67 ± 7.10 a | 29.86 ± 22.54 ab | 34.84 ± 13.42 b | 7.63 | 0.004 |
| Shoreline length | km | 5.24 ± 0.48 a | 4.84 ± 1.72 b | 3.25 ± 0.47 b | 16.74 | 0.000 |
| Area of isobaths 1 m | % | 8.15 ± 2.55 a | 17.42 ± 8.69 ab | 24.16 ± 8.97 b | 5.88 | 0.011 |
| Volume change (1960–2015) | % | 5.88 ± 5.51 a | 21.08 ± 15.62 a | 19.95 ± 13.58 a | 2.76 | 0.091 |
| Surface area change (1960–2015) | % | 9.37 ± 5.86 a | 22.45 ± 11.37 a | 19.98 ± 9.34 a | 3.53 | 0.052 |
Table 2.
Summary of the results of the RDA including eigenvalues, correlations, and percentage variation explained by two canonical axes (RDA1 and RDA2).
Table 2.
Summary of the results of the RDA including eigenvalues, correlations, and percentage variation explained by two canonical axes (RDA1 and RDA2).
| RDA Axes Summary | RDA1 | RDA2 | Total Variance |
|---|---|---|---|
| Eigenvalues | 0.642 | 0.051 | 1.000 |
| Species–environment correlation | 0.866 | 0.709 | |
| Cumulative percentage variance of species data | 64.2 | 69.4 | |
| of species–environment relation | 91.3 | 98.6 | |
| Sum of all canonical eigenvalues | 0.704 |
Table 3.
Results of regression analyses of the contribution of the littoral zone, forms of plant growth in lakes, and morphological parameters of lakes.
Table 3.
Results of regression analyses of the contribution of the littoral zone, forms of plant growth in lakes, and morphological parameters of lakes.
| Parameter | Model | R2 | F | p |
|---|---|---|---|---|
| Littoral | =42.81 + 30.59shall. − 48.49surf. | 0.80 | 15.25 | 0.00004 |
| Emergent | =−94.59 − 3.13surf. + 4.74shall.2 | 0.73 | 14.48 | 0.00008 |
| Submerged | =102.47 − 24.43surf. + 1.43surf.2 | 0.77 | 28.09 | 0.000004 |
| Nymphaeids | =29.19 − 66.5surf. + 0.37surf.2 | 0.53 | 9.58 | 0.002 |
R2—coefficient of determination, F—degree of freedom, p—significance level.
Table 4.
Summary of the results of the RDA including eigenvalues, correlations, and percentage variation explained by two canonical axes (RDA1 and RDA2).
Table 4.
Summary of the results of the RDA including eigenvalues, correlations, and percentage variation explained by two canonical axes (RDA1 and RDA2).
| RDA Axes Summary | RDA1 | RDA2 | Total Variance |
|---|---|---|---|
| Eigenvalues: | 0.379 | 0.047 | 1.000 |
| Species–environment correlations: | 0.665 | 0.692 | |
| Cumulative percentage variance | |||
| of species data | 37.9 | 42.6 | |
| of species–environment relation | 87.0 | 97.8 | |
| Sum of all canonical eigenvalues | 0.435 |
© 2018 by the authors. Licensee MDPI, Basel, Switzerland. This article is an open access article distributed under the terms and conditions of the Creative Commons Attribution (CC BY) license (http://creativecommons.org/licenses/by/4.0/).
Share and Cite
MDPI and ACS Style
Lawniczak-Malińska, A.; Ptak, M.; Celewicz, S.; Choiński, A. Impact of Lake Morphology and Shallowing on the Rate of Overgrowth in Hard-Water Eutrophic Lakes. Water 2018, 10, 1827. https://doi.org/10.3390/w10121827
AMA Style
Lawniczak-Malińska A, Ptak M, Celewicz S, Choiński A. Impact of Lake Morphology and Shallowing on the Rate of Overgrowth in Hard-Water Eutrophic Lakes. Water. 2018; 10(12):1827. https://doi.org/10.3390/w10121827
Chicago/Turabian StyleLawniczak-Malińska, Agnieszka, Mariusz Ptak, Sofia Celewicz, and Adam Choiński. 2018. "Impact of Lake Morphology and Shallowing on the Rate of Overgrowth in Hard-Water Eutrophic Lakes" Water 10, no. 12: 1827. https://doi.org/10.3390/w10121827
Note that from the first issue of 2016, this journal uses article numbers instead of page numbers. See further details here.