ScoRE—A Simple Approach to Select a Water Quality Model
by
 , ,
, ,
Marcos Mateus
1,* ,
,
Ricardo da Silva Vieira
1 ,
,
Carina Almeida
1,2,
Miguel Silva
2 and
Filipa Reis
2 1
MARETEC, Instituto Superior Técnico, Universidade de Lisboa, 1049-001 Lisboa, Portugal
2
AQUALOGUS, Rua do Mar da China N° 1 Escritório 2.4, Parque das Nações, 1990-137 Lisboa, Portugal
*
Author to whom correspondence should be addressed.
Water 2018, 10(12), 1811; https://doi.org/10.3390/w10121811
Submission received: 26 October 2018
/
Revised: 30 November 2018
/
Accepted: 6 December 2018
/
Published: 9 December 2018
(This article belongs to the Section Water Resources Management, Policy and Governance)
Abstract
:Over the past decades, water quality models have become unique tools in the management of aquatic resources. A consequence of their widespread application is the significant number of models now available. Available methodologies to compare models provide limited support for their choice in the first place, especially to end-users or modelers with limited experience. Here we propose a method to assist in the selection of a particular model from a set of apparently similar models. The method is termed ScoRE, as it grades models according to three main aspects: Scope (aim, simulated processes, constituents, etc.), Record (reference to the model in publications, its range of applications, etc.), and the Experience of using the model from the user perspective (support material, graphical user interface, etc.). End-users define the criteria to be evaluated and their relative importance, as well as the conditions for model exclusion. The evaluation of models is still performed by the modelers, in open discussion with end-users. ScoRE is a complete approach, as it provides guidance not only to exclude models but also to select the most appropriate model for a particular situation. An application of this method is provided to illustrate its use in the choice of a model. The application resulted in the definition of 18 criteria, where 6 of these were defined exclusively by the end-users. Based on these and the relative importance of each criterion, ScoRE produced a ranking of models, facilitating model selection. The results illustrate how the contributions from modelers and end-users are integrated to select a model for a particular task.
Keywords:
water-quality modeling; model choice; CE-QUAL-W2; MIKE HYDRO River; MOHID Water; SIMCAT; SisBaHIA; TOMCAT; QUAL2Kw; WASP71. Introduction
The widespread use of water quality models over the past decades has increased the capacity to manage water quality in both marine and freshwater systems. Water quality models have become important, if not irreplaceable, tools in management, planning and pollution control for government agencies, local authorities and many other entities supervising water resources [1,2,3]. This is evident in the significant number of water quality models produced over the years [4,5,6]. Now, the question is no longer whether to use models in water management but, instead, which models to use. In the current paradigm, the selection of a model is a determinant step in the study for understanding and managing a particular aquatic system or water body [7]. However, the selection process can be a challenge, especially to end-users lacking the modelling, computational or mathematical skills to undertake a thorough evaluation of the models.
Given the implications that model results can have in the selection of management practices, both the model and its selection process must be robust and valid. Transparency and accountability are critical for robustness and essential for validating the method. This is particularly relevant, as most likely stakeholders will be involved at later stages of the water management process, whether in the modelling stages, in the development or evaluation of courses of action, or the implementation processes, and therefore, stakeholders will need to understand which management options are being proposed and why. While the literature is prolific in testing and evaluating models [8,9,10,11,12,13,14], it is quite omissive regarding approaches to assist end-users in the choice of models.
In the present paper, we address the model selection stage. Model selection is usually a small part of the whole decision-making process. Consequently, the same effort put into the entire process of modelling and water management, concerning time, resources and stakeholder involvement, cannot be expected to be reflected in model selection. A simple procedure is required, with a compromise between the degree of participation of stakeholders (and modelers) vs. practicality of this step. The use of participatory approaches in the context of environmental resources decision making and modelling shows an increasing trend [15,16,17]. However, the degree of involvement of end-users and modelers (technical team) at the model selection stage, i.e., whether end-users should be involved in the evaluation of the models and to which degree, is still subject of a debate within the literature (e.g., Solaranta et al. [18] vs. Boorman et al. [19]).
This paper contains a review of the main approaches found in the literature for water quality model selection. This review is discussed from a multicriteria decision analysis perspective. Building on the results from this literature review, we propose an approach for model selection providing more detailed guidance on how to select a model, producing a more flexible process and promoting the dialog between end-users and technical teams. The proposed approach applies only to model selection, and it excludes the socioeconomic and institutional spheres of water management.
Throughout this paper, we refer to the terms model end-user and modelers. By model end-user, we refer to those that will use the model results, such as water managers and other stakeholders. By modeler, technical team or expert, we mean the person who has the knowledge to understand the processes behind the model and knows the modelling approaches.
2. Procedures for Selecting Water Quality Models
One of the earliest guidelines to select water quality models for lakes, rivers or estuaries dates back to a 1976 guidebook developed for governmental use by the US Environmental Protection Agency (EPA) [20]. The volume described a selection process with four levels of criteria. The first two phases allow the elimination of models and the latter two stages rank the remaining models. In brief, the phases are:
- Phase I: eliminatory phase, based on: appropriateness of the model to the problem at hand (type of water body, time variability, discretization, constituents modelled, model input data, driving forces and boundary factors);
- Phase II: eliminatory phase, based on: cost (model acquisition requirements, equipment requirements, data acquisition costs, machine costs, manpower costs);
- Phase III: ranking models, based on: weights attributed to the criteria from phases I and II;
- Phase IV: further ranking of models based on: relevant processes included, accuracy (model representation, numerical stability, dispersion), sufficiency of available documentation, output form and content, data deck design, ease of modification.
Only in the last 15 years have new complete frameworks for water quality model selection started to appear, guiding the whole process of model selection, including the definition of which characteristics of the models are being compared (i.e., defining the criteria of comparison) and how to compare these [18,19,21,22]. Some approaches [18] identify a set of questions to guide the definition of criteria to be used as a means of comparison between models. Some examples are “How well does the model’s output relate to the management task”, “How well is the model suited for sensitivity and uncertainty analyses and how well have these analyses been performed and documented?” or “How are the model’s user manual and tutorial?” In another study [19], authors defined the evaluation criteria itself for model selection, along with some guiding questions for the water manager to help to determine further criteria to be used for model comparison. In this particular study, modelers then evaluated the different models under those criteria. In a more recent protocol for model selection [21], the main aim was to provide a framework to assist inexperienced model users, as well as to provide an auditable process. Although not explicitly identified, this protocol is based on a Multi-Criteria Decision Analysis (MCDA) process. The main distinction of this protocol with the previous work referred to Boorman et al. [19] is that this latter work does not require the involvement of modelers in evaluating the models, just end-users. While modelers make the questions that guide the protocol, it is up to end-users to evaluate criteria through a literature review.
In our review of the literature, we considered the following concepts: (i) criteria: the attributes used to compare the different models; (ii) valuation or scoring: stage in which all models are compared under each criterion, resulting in a model rank for each criterion; (iii) aggregation procedure: process of aggregating the results from the different criteria (i.e., converting all ranks to the same scale in order to be compared), usually by attributing weights to the criteria, which represent the “conversion factors” between them.
2.1. Valuation of Models
There is intense debate in the literature about which stages model users should be involved in. A particular point of disagreement relates to the valuation of models or scoring, a term used in MCDA to refer to the evaluation of the models in each criterion. Some authors [18,20,21,22] claim that the scoring (and the whole model selection process, including choice of criteria and which models to evaluate) should be carried out exclusively by end-users, for transparency reasons and to reduce time and costs of the model selection stage. Chinyama et al. [21], for instance, suggested that model users can score the models on the criteria based on a literature review on the models. Interestingly, in the case study proposed here, authors (modelers), not the end-users, score the criteria. However, no test has been made to evaluate if end-users can access the literature and understand it to be able to score all criteria regarding the models or have the time for such a process. Grimsrud et al. [20], on the other hand, considered that external consultants might be used and, in this case, give planners (end-users) the tools to know what to ask for and what to expect.
Other authors (e.g., Boorman et al. [19]) claimed that end-users might not process all the knowledge necessary to adequately evaluate the models under the criteria defined and, therefore, argued that modelers should conduct the process of assessing models within each criterion. In this particular case ([16]), although the valuation of models is left to the modelers, criteria are still defined by end-users.
It is the opinion of the authors of the present work that knowledge of end-users is essential to score the criteria, but some criteria might require knowledge that some end-users may lack.
2.2. Aggregation Procedures
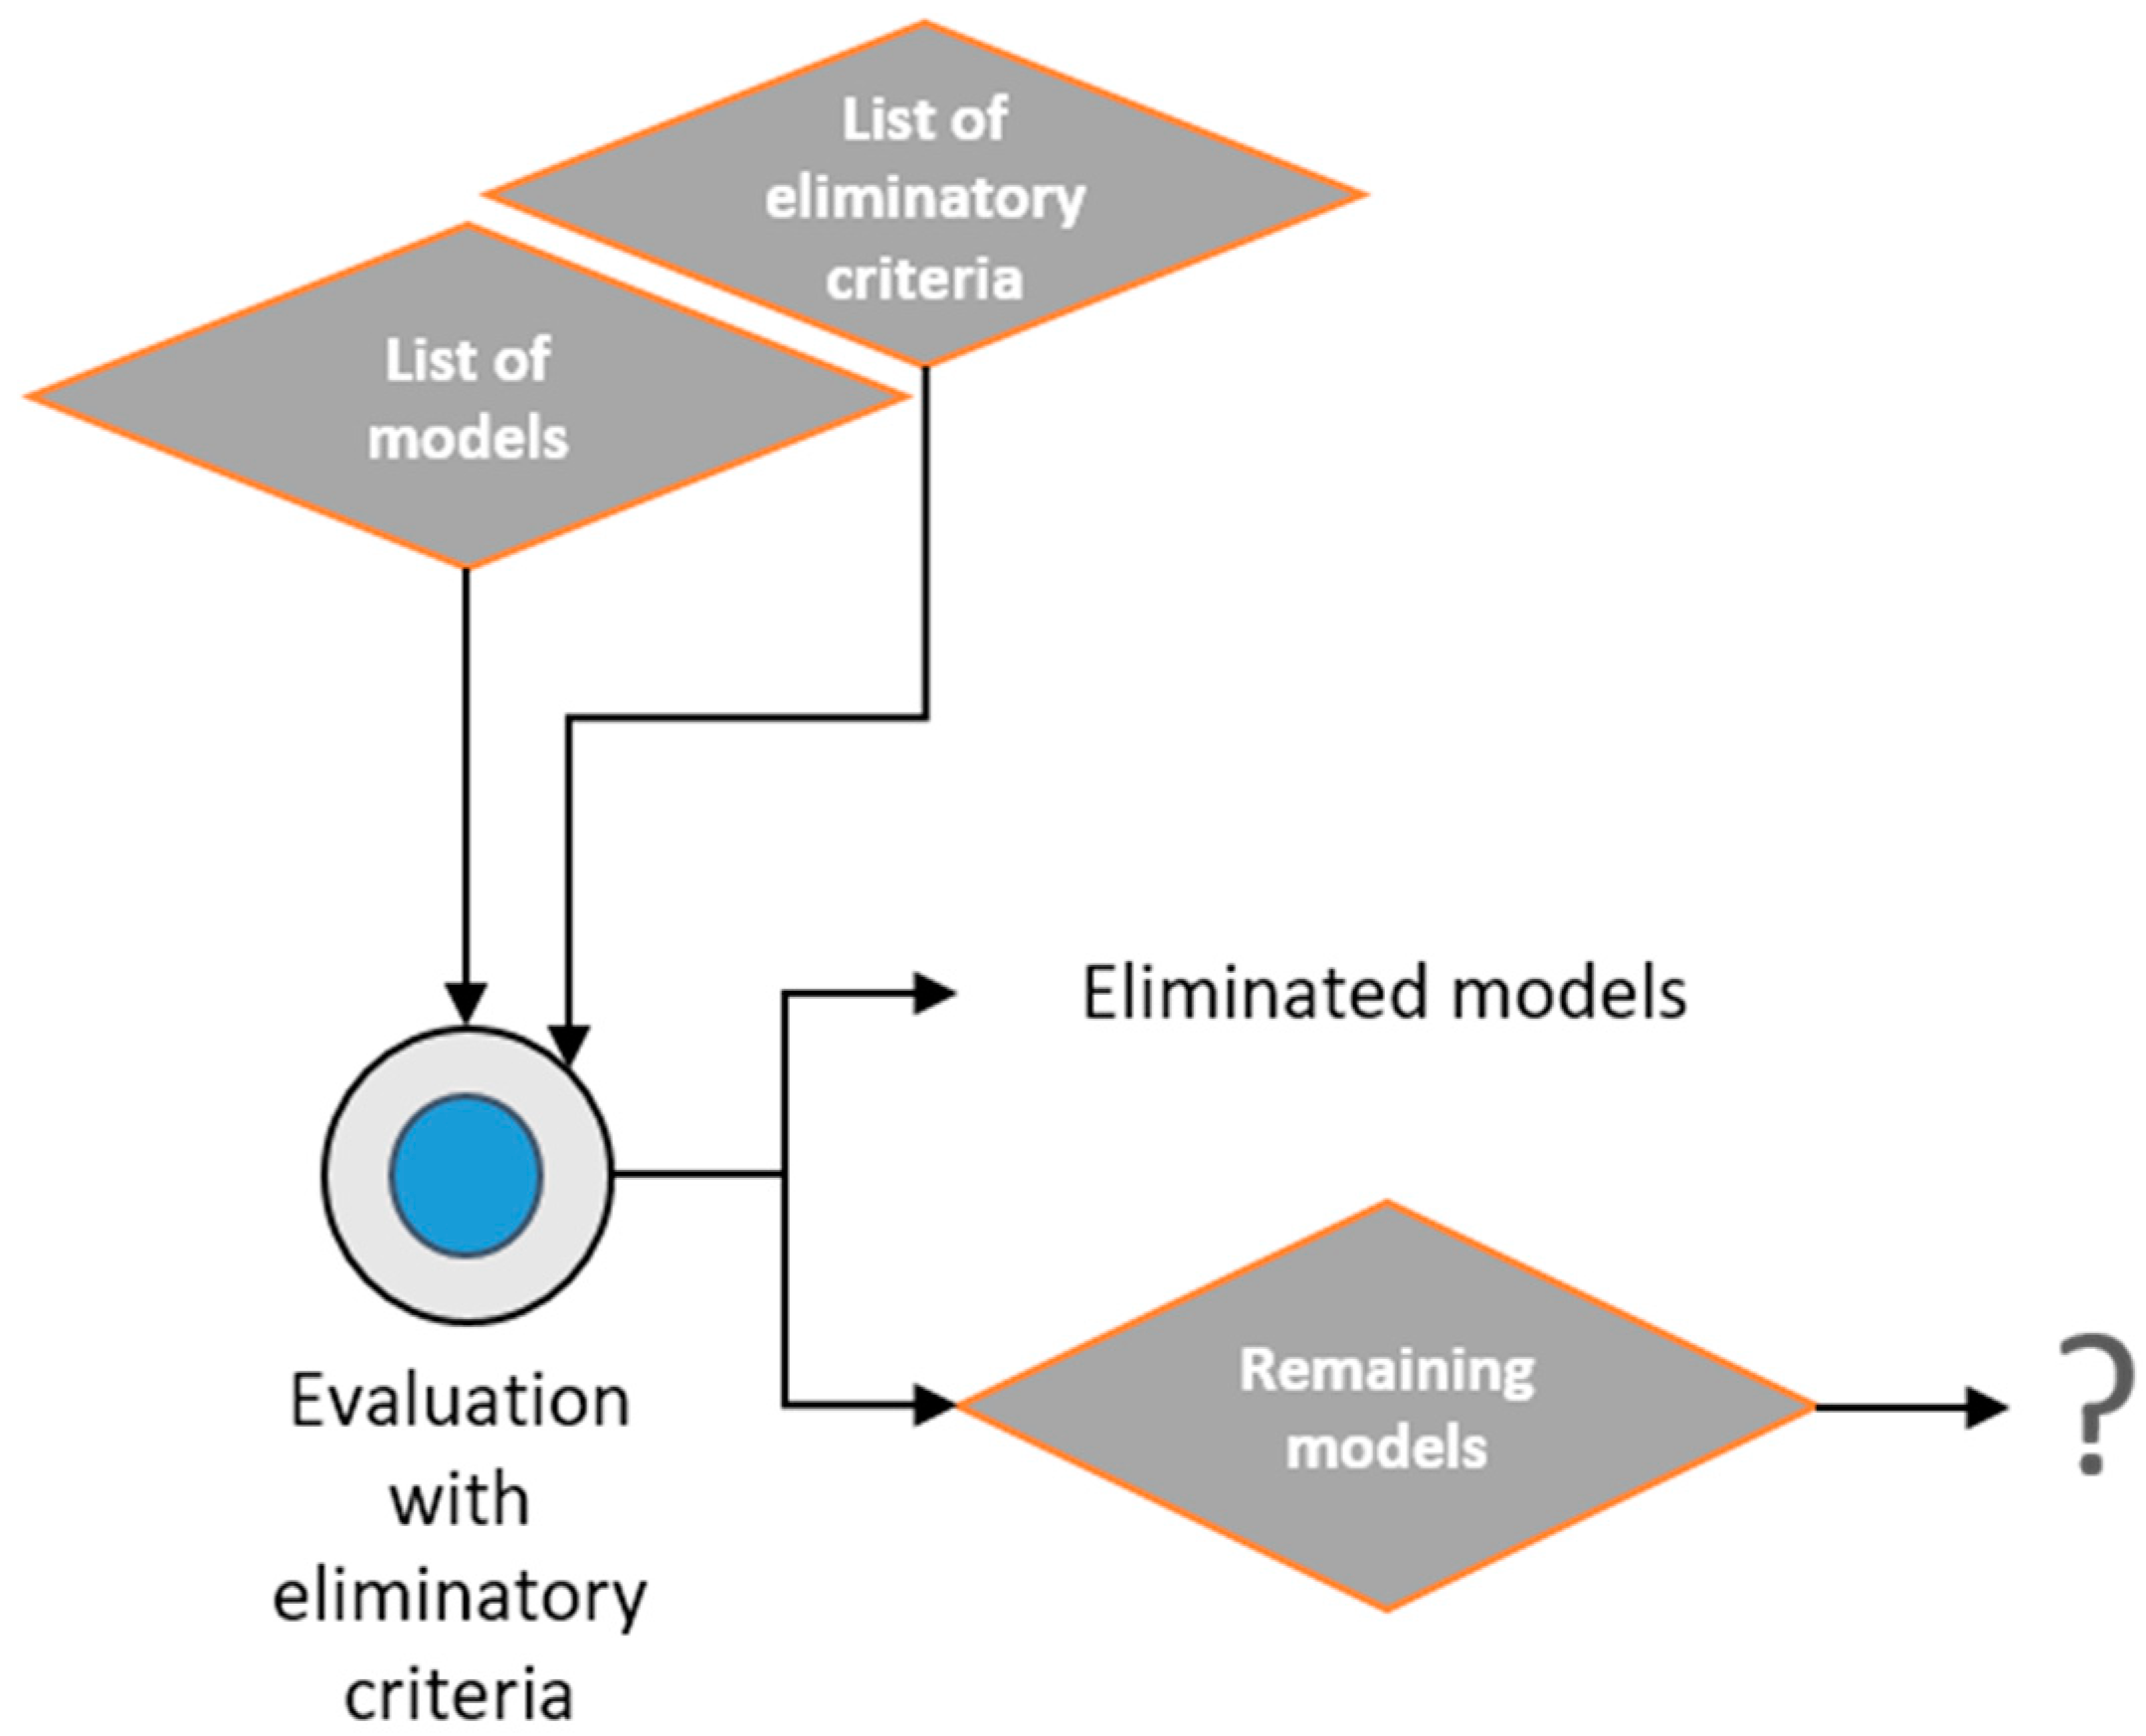
The aggregation procedure corresponds to the phase where the scores of each model in all criteria are aggregated together to obtain a final value per model. The final result is a ranking of the models. The way the scores from models in each criterion are “converted” into a standard unit to be aggregated can vary. Within the literature on water quality model selection, there is a fair degree of similarity between the process of aggregating values from different criteria. Most methods consider eliminatory criteria, setting a minimum base level so that, if not satisfied, the model is excluded from the process [18,19,20,21,22]. No additional guidance is provided to select one model out of the remaining adequate models (Figure 1). With no further guidance, end-users end up with a reduced list of models to choose from. An additional process is required to assist end users to identify which of the remaining models should be selected. Very few studies provide guidance on this [20,22].
The EPA Model Selection Process [20] considers eliminatory criteria (corresponding to Phases I and II from the process). However, they also present weighted criteria (corresponding to Phases III and IV from the process) where (ranges of) weights for the criteria are suggested by the authors for the remaining (not eliminated) models. The aggregation procedure used in this guidance manual is a linear additive process. In Tuo et al. [22], on the other hand, there are some eliminatory criteria, linked with the modelling objective but also to other features such as model complexity. For non-eliminatory criteria, the criteria are assumed to have equal weights, although authors recognize that different weights could be provided to the criteria if the method is compatible with that situation.
The use of eliminatory criteria, as mentioned before, makes the methods non-compensatory or partially compensatory. Compensatory methods are methods where weights are seen as trade-offs, i.e., where a model is selected by being good when judged against one criterion, even if it performs low against another criterion. Non-compensatory methods attribute weights or importance coefficients to criteria, expressing the relative importance of each criterion [23,24].
3. The ScoRE Method
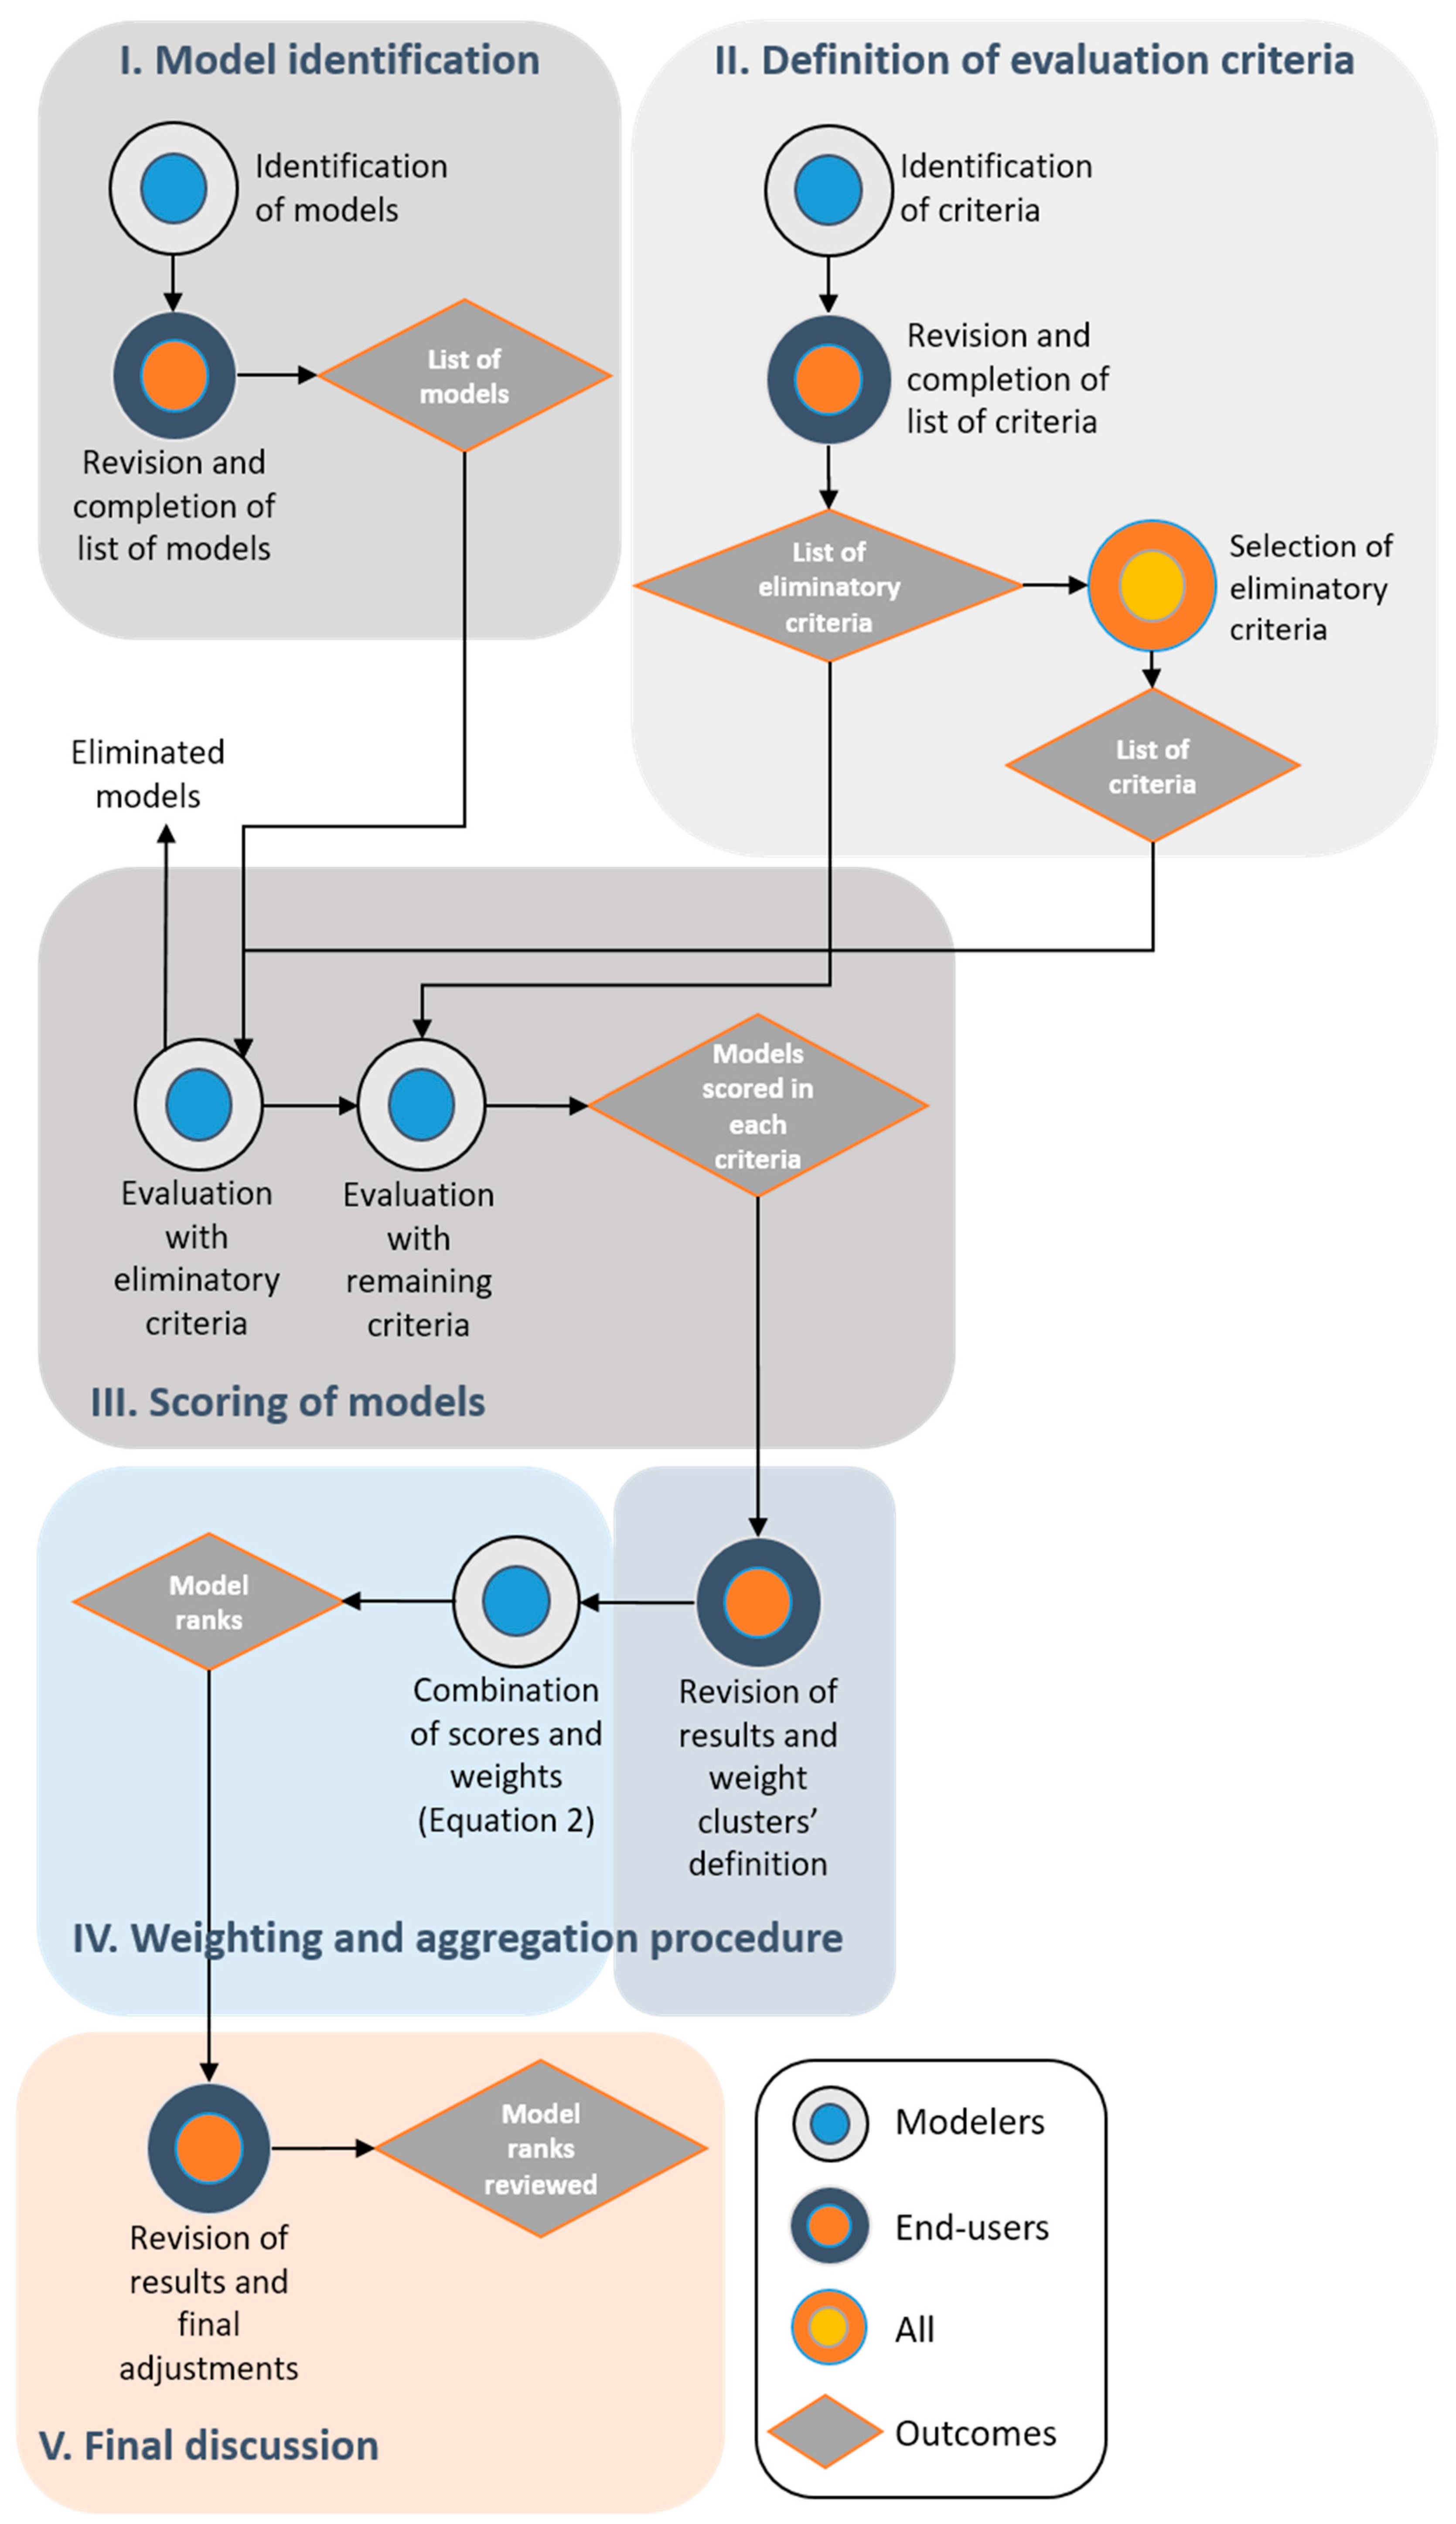
ScoRE is a multicriteria-based method for water quality model selection, applying only to model selection, and excluding the socioeconomic and institutional spheres of water management. The main features of the method are that it provides detailed guidance on how to select a model, it is a more flexible process and promotes the dialog between end-users and technical teams. The method is grounded on a set of three broad clusters (as in Parsons et al. [25]), through which end-users and a technical team define a set of criteria for model evaluation and selection. Water quality models are then evaluated on each criterion by the technical team, which will then discuss the weights for the clusters with end-users. Weights are applied to the clusters to provide a final ranking of the water quality models. ScoRE engages model end-users by involving them in the definition of the criteria, in the selection of models to be evaluated, and in the weighing of the clusters. End-users have the opportunity to go through the whole process and debate the final results with the technical team. Figure 2 provides an overview of ScoRE, and the next sections provide a more detailed description of the process.
3.1. Definition of the Evaluation Criteria
In ScoRE, criteria are defined by the technical team in dialog with end users. The scientific consistency of the criteria choice, a criterion identified as relevant by Loucks and Beek [26], is ensured by the technical team. Model end-users ensure that additional aspects are not left out of the analysis, either related to the particularities of the context being modelled, data availability or any sort of constraints from the user side (e.g., available funds or level of familiarity with modelling techniques). This procedure warrants results to better satisfy the needs of end-users.
The criteria are grouped in three clusters, defined a priori. These are “model Scope”, its “publication/dissemination Record” and the “overall Experience to users”, hence its designation: ScoRE (Scope—Record—Experience). Together, the three clusters aim at assessing the models for a variety of parameters, thus providing an overall evaluation. The cluster Scope addresses the nature of the model (stochastic, deterministic, process-oriented, etc.), its complexity and the range of constituents and processes the model simulates. The cluster Record provides a proxy for the dissemination and acceptance of the model amongst modelers, by quantifying the number of technical publications where a particular model features. The cluster Experience defines the experience of using the model, and how it can be defined as straightforward or difficult, based on the interface and material available to help the model user. A more detailed description of each cluster is offered in the next sections.
3.1.1. Model Scope
Considering that a model is a (simplified) representation of reality, the scope of a model is the purpose for which it was built in the first place. Water quality models, for instance, may be developed to simulate fresh-water systems, brackish environments or marine and coastal waters, focusing on pollutants, ecological processes, water chemistry, etc. Thus, the scope of a model defines its nature, methods, parameterization, processes simulated, and all other components that expresses its validity to simulate any particular system. These include the type of approach (conceptual, empirical, physically based), the nature of the model (deterministic or stochastic), the state (steady-state or dynamic simulations), and its spatial analysis (distributed, lumped), data requirements, dimensions (1D, 2D or 3D), and robustness, among other aspects [3,7].
3.1.2. Publication Record
Publication record is defined in ScoRE as the number of publications in science and engineering journals featuring a particular model. This can be seen as an alternative for the impact of a model, based on the assumption that a widely cited model implies wide acceptance by the scientific community and, consequently, a proxy to its consistency, validity and robustness.
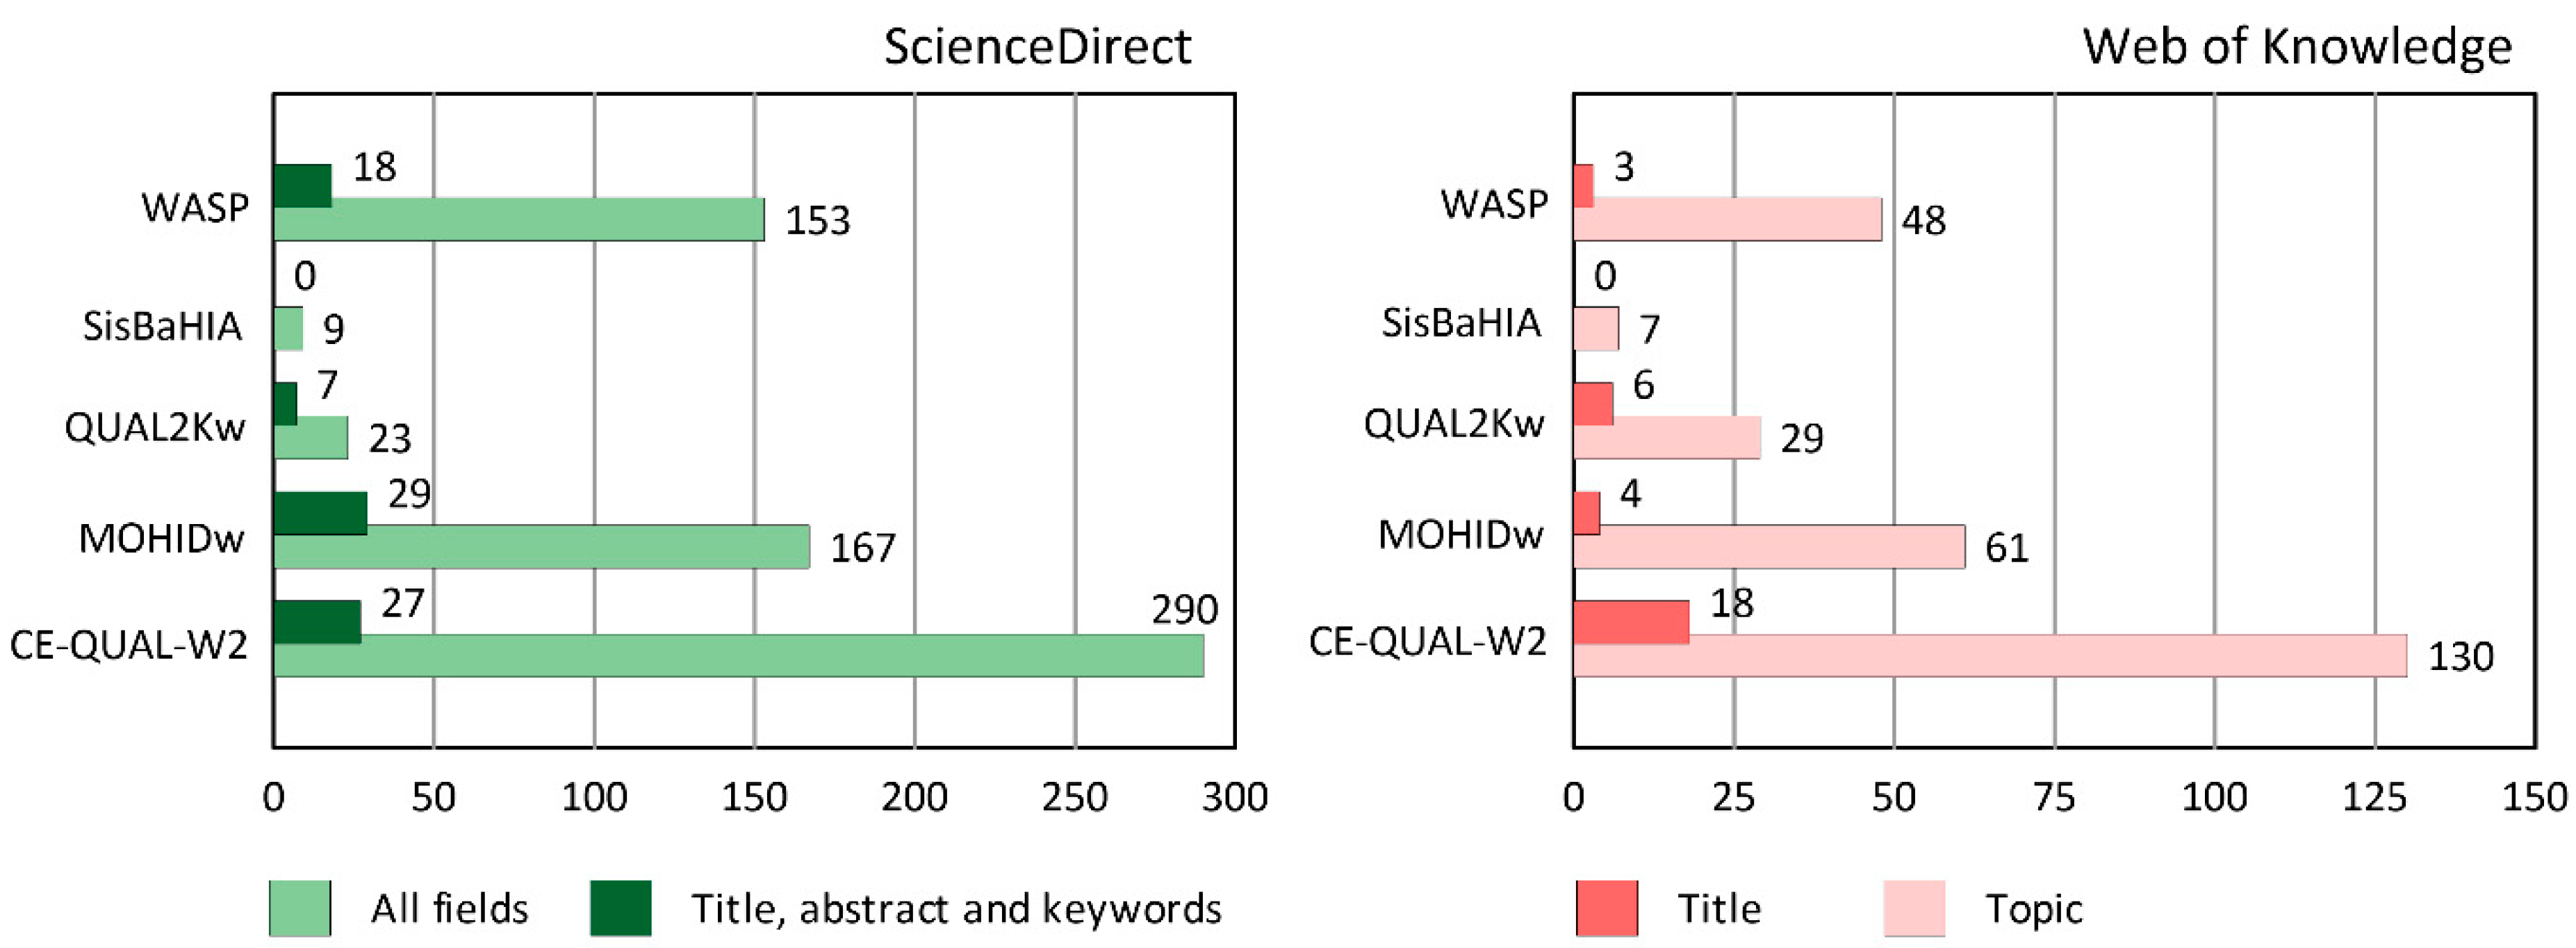
Some examples of criteria within this cluster can be the number of papers featuring the name of the model in the title or in relevant fields such as the summary and keywords, or simply the number of times a given model is mentioned in the text body. The information for this indicator can be retrieved from web services such as ScienceDirect or Web of Knowledge. Also, the type of systems for which the model has been applied to, or its worldwide dissemination, can also be used to assess the model Record.
3.1.3. User Experience
Interface
The experience of using a particular model is strongly conditioned by the graphical user interface (GUI). The GUI aims to facilitate the input of data, running of the model and output visualization, and should provide a user-friendly environment, with graphical elements that allow the user to interact with the software. Most models come with a native GUI but some occasionally have alternative options created by third parties, frequently with additional features such as advanced pre- and post-processing tools, extra visualization options, etc. These alternative GUIs usually require payment for the software or a licensing fee of some kind.
Support Material
Support material is a basic requirement for any model and must be available either online or on paper. Numerical models, like any other software, should have a set of supporting documents containing information on the model structure, description of simulated processes, a list of the parameters, and additional relevant information on its functioning. Commercial models frequently have comprehensive guides while academic software and freeware usually rely on more concise manuals. Thus, user guides vary significantly in detail and quality among models and this difference can weigh on the choice of a model. The model can also have a published detailed model calibration, validation, and parameter assessment.
Technical Support
Technical support is a common service provided by commercial software developing companies, to help users overcome any difficulties or problems they may face when using a product. Since it requires having the staff to interact with the client (by phone, Skype, email, etc.), technical support is frequently a paid service or a service that is offered as part of a paid software package. Alternative ways to provide technical support to users may be less expensive or even cost-free, such as online forums, in which users and developers post technical questions and answers.
Cost
Numerical models, like any other software, are available to the user in many different ways, some of which may require payment of a licensing fee, implying that some models have a cost associated with their use and exploration. The implication of a payment can pose problems to some users, frequently depending on the price, so this criterion can have a significant influence on the selection.
3.2. Defining “Eliminatory Criteria”
“Eliminatory criteria” set the conditions that models need to satisfy in order to proceed to the next stage in the evaluation process. For example, type of water body could be an eliminatory criterion, defining that if a model does not apply to lakes, for example, the model would be excluded. Another example could be whether the model presents a vertical thermal structure of reservoirs, if essential for a particular case, and where models could be excluded from the analysis if they were not able to present such vertical thermal structure.
3.3. Valuation of Criteria
The first step in the valuation of criteria stage is to evaluate all models in the “eliminatory criteria” in order to weed out some of the models. The valuation of criteria is conducted by the technical team (and later discussed with the end-users). After the valuation according to the eliminatory criteria, the remaining models are evaluated in the criteria. All remaining models are compared in each criterion and ranked in a scale from 1 to n (n being the number of models), where 1 is the worst-performing model and n the best-performing model. If models are assumed to be equal for a particular criterion, then the same value can be assigned to both. This process is repeated for each criterion. The result is a rank of models in each criterion (i.e., if the number of criteria defined is nt, then there will be nt ranks).
3.4. The Aggregation Procedure of ScoRE
The aggregation procedure of ScoRE makes use of weights. First, criteria scores within each cluster are averaged:
where S, R and E are the average scores for each cluster, Si, Ri and Ei are the scores of the criteria within each cluster, and ntx is the total number of criteria per cluster. This means that the scores of criteria within the same cluster are seen as equally relevant. ScoRE values can range from 1 to n and so the result from Equation (1) will allow models to be ranked from the less suitable (lower ScoRE) to the more adequate (higher ScoRE), in each of the criteria.
Weights defined by end-users are attributed to each cluster. The aggregation procedure follows a linear additive model to provide a final ranking of models. This is expressed by (2):
where WS, WR and WE are the relative weights of each cluster, provided that WS + WR + WE = 1.
A summary of the main characteristics of ScoRE and its comparison with other studies is presented in Table 1.
4. Using ScoRE in a Real Case
4.1. Study Sites
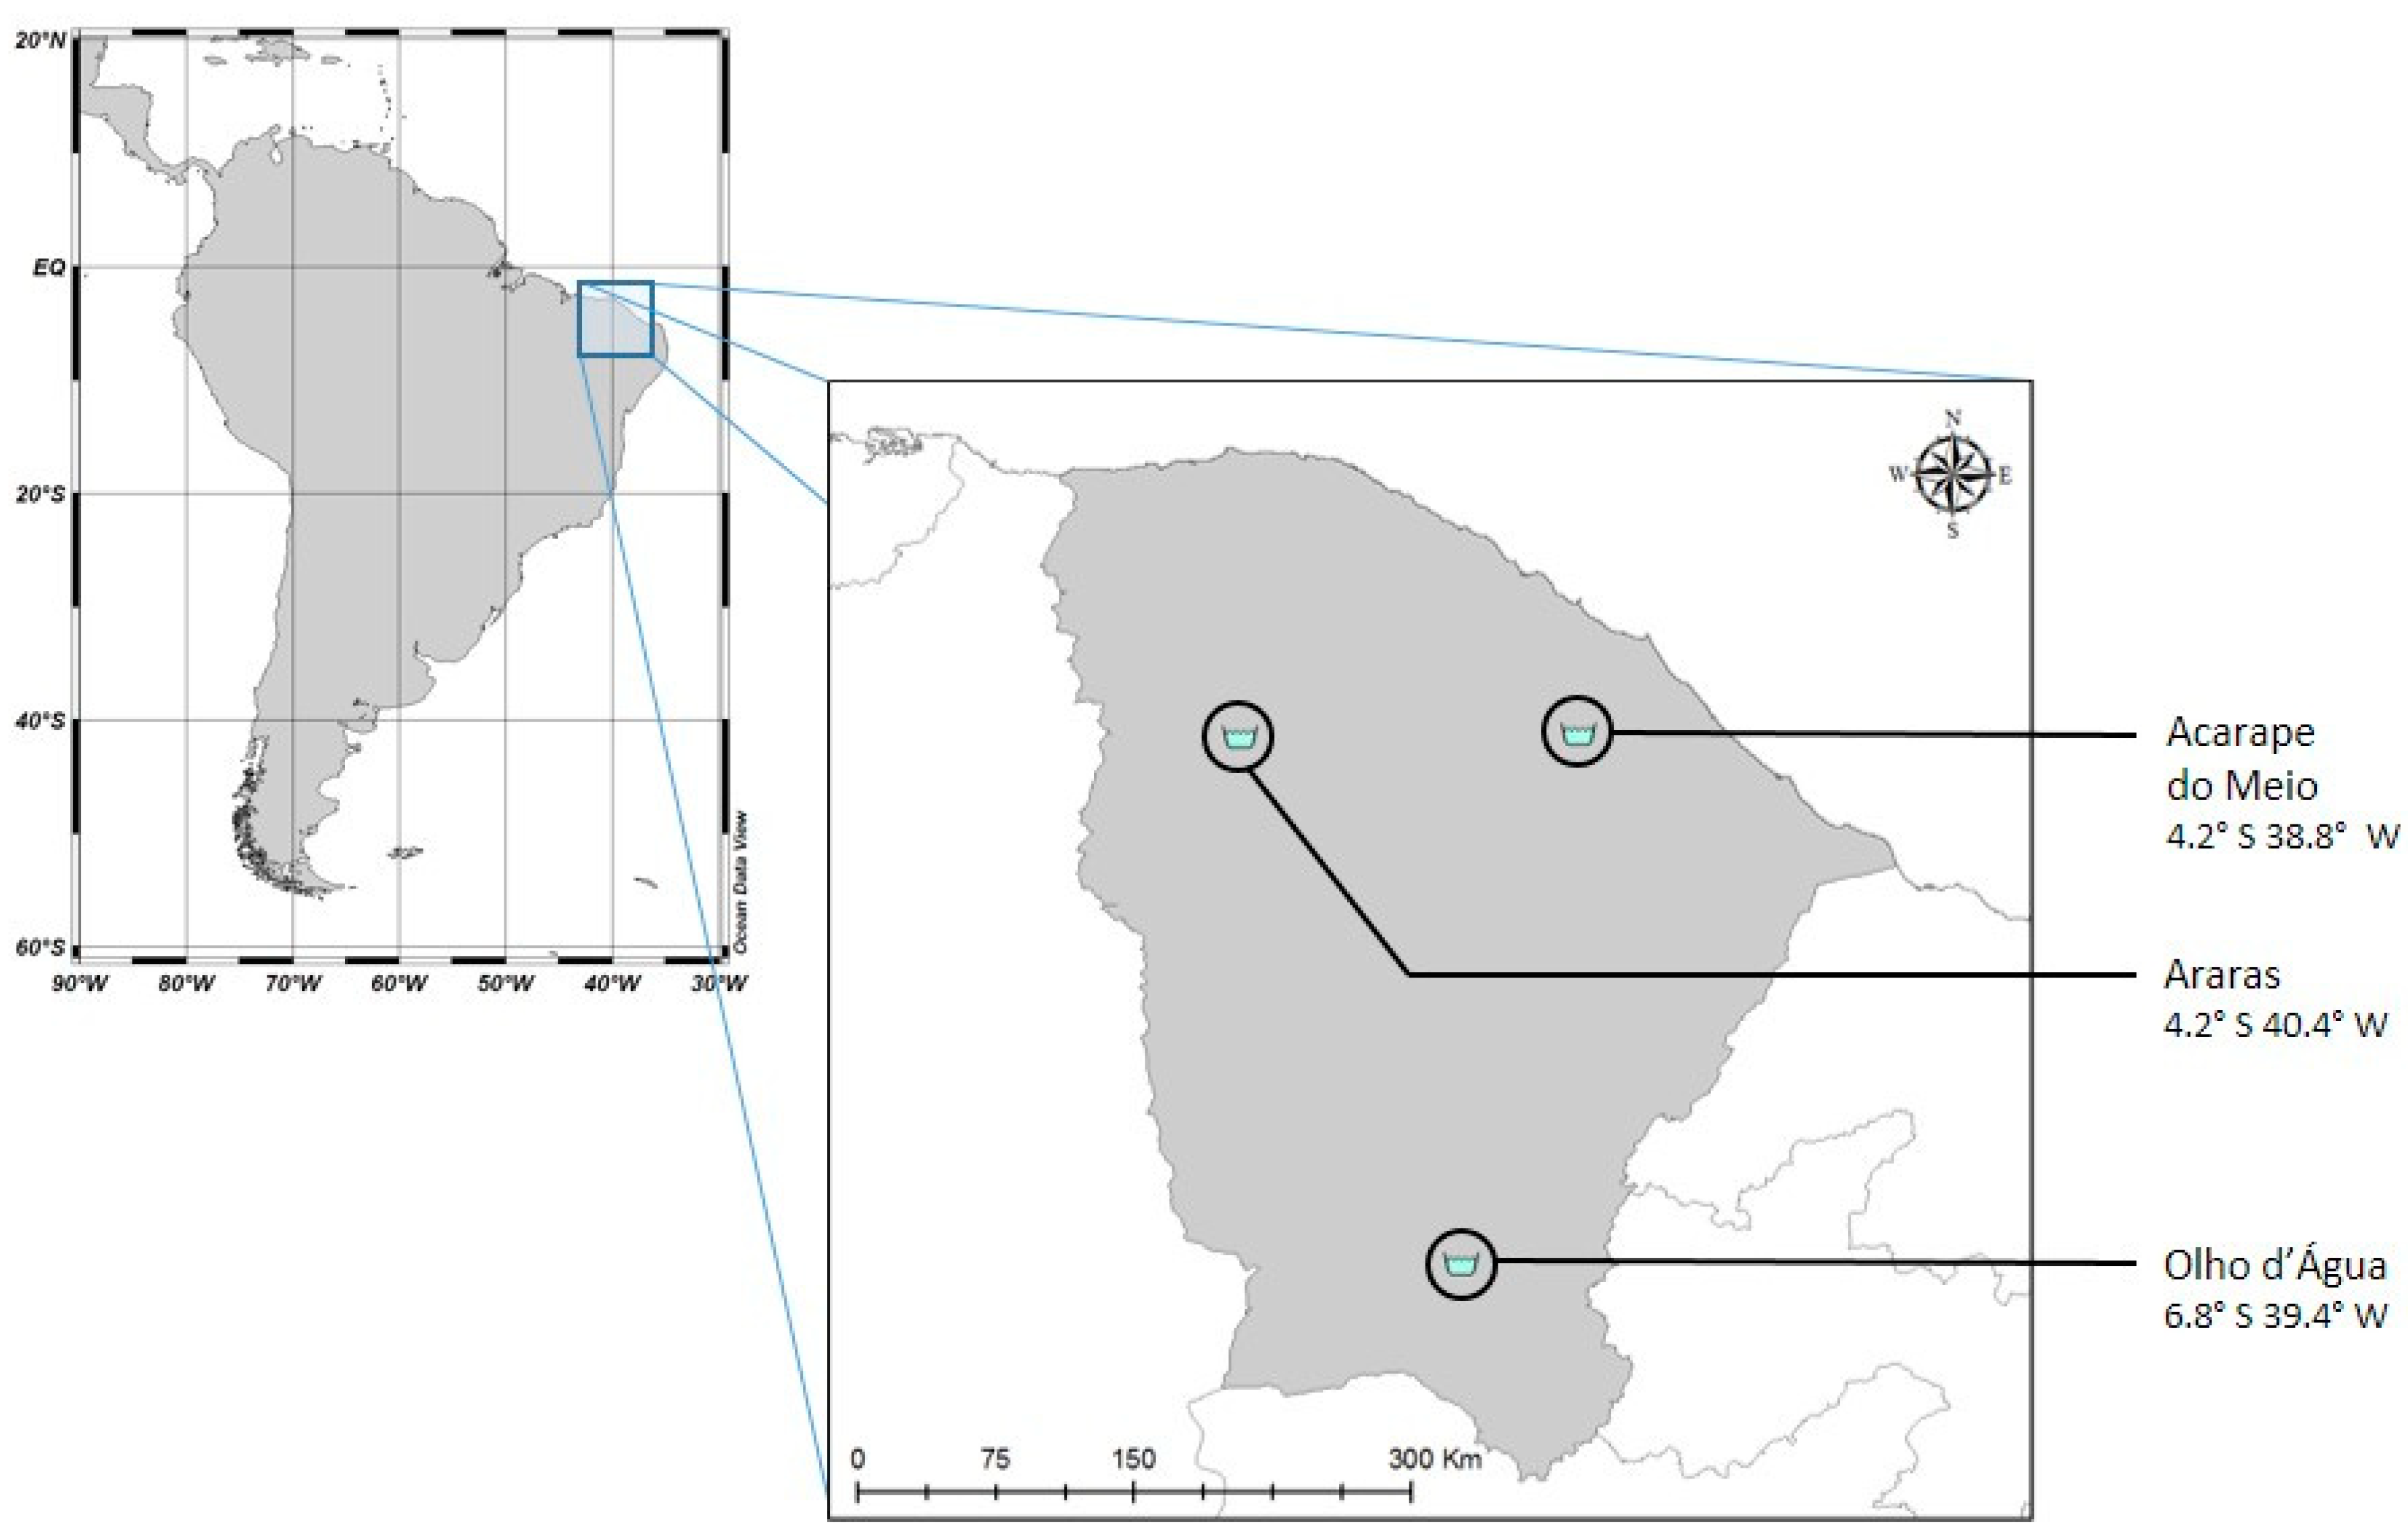
The Ceará State in the northeast region of Brazil is characterized by semi-arid meteorological conditions, frequently leading to water scarcity. As such, a sound management of water resources is critical, requiring decisions from managers and regulators that balance water availability and quality for human and animal consumption. Most available water is stored in reservoirs scattered across the state, the majority of which are under significant pressures originating in the watershed, ranging from intense cultivation to human and industrial effluent discharge. Fundação Cearense de Meteorologia e Recursos Hídricos—FUNCEME (Ceará’s Meteorological and Hydric Resources Foundation)—is the federal organization responsible for managing the water resources in the state, along with Companhia de Gestão dos Recursos Hídricos—COGERH (Water Resources Management Company). Over the past few years, FUNCEME and COGERH have explored new water management strategies, some of which require the use of numerical models. Both organizations were engaged in the choice of a water quality model to study three reservoirs located in the Ceará State, in the northeast region of Brazil: Acarape do Meio, Araras and Olho d’Água. The location of the reservoirs is depicted in Figure 3.
These reservoirs differ in their characteristics, physical setting and pressures originated in the basin. They share, however, some basic features, such as a relatively low mean depth, high water temperatures all year around, the presence of a mild thermocline frequently disrupted by episodes of intense wind-induced mixing, strong vertical chemical stratification, and persistent oxygen-depleted bottom layers.
4.2. Application of ScoRE
The technical staff from FUNCEME and COGERH were the end-users and the modelers consisted of the authors of this paper. Modelers had a background in environmental modeling, ecology of aquatic environments and water quality. The application of ScoRE followed the process described in Section 3, schematized in Figure 2. The process is summarized below:
- End-users were provided with a list of models identified by modelers. This list was defined by modelers taking into account existing validated models. The list was discussed with the end-users, who were given the possibility of including additional models if they had any they wanted to see included.
- The criteria were defined by modelers, based on the conditions of the case study at hand. These criteria were defined taking into account three clusters of ScoRE. The list was discussed with the end-users, who added additional criteria to the list. End-users, together with the modelers, reviewed the criteria to select which of these should be eliminatory criteria.
- Each model was evaluated within the eliminatory criteria first. This allowed the exclusion of some of the models. The remaining models were then evaluated in each of the criteria. The valuation process was conducted by modelers. The result was a rank of the models for each criterion. The resulting scores were discussed with the end-users.
- End-users attributed weights to the clusters of criteria. With the weights, it was then possible for modelers to average scores in each cluster (using Equation (1)) and apply the linear additive model (Equation (2)) to obtain the final rank of the models.
- Final rankings were then discussed with end-users and, when necessary, final adjustments were made to the criteria, scores or weights in accordance.
The process was conducted over two meetings between end users and modelers. The first meeting included steps 1 and 2 and the second meeting included steps 4 and 5. Step three was conducted by the modelers alone and results were taken for discussion in the second meeting.
5. Results
5.1. Models Included in the Evaluation
Eight water quality models were selected by the technical team and reviewed by the end-users. These models were: CE-QUAL-W2, MIKE HYDRO River, MOHID Water, SIMCAT, SisBaHIA, TOMCAT, QUAL2Kw e WASP7 (Table 2). The models are process-based (or process-oriented), have been used worldwide to some extent, and encompass a wide range of complexity, both in parameterization and number of simulated processes. They are briefly described in their basic principles, simulation elements, limitations and intended use. While some have been used extensively in the past, others are less disseminated. A summary of their main features is presented in Table 3 and detailed descriptions can be found in the references provided.
5.1.1. CE-QUAL-W2
CE-QUAL-W2 (Table 2) is a public domain model that has been widely used in the study of stratified water systems, including lakes, reservoirs and estuarine environments [27,28,29,30,31,32]. CE-QUAL-W2 is a two-dimensional (longitudinal-vertical) hydrodynamic and water quality model. The model was originally developed by the U.S. Army Corps of Engineers [33,34], and a comprehensive description of CE-QUAL-W2 can be found in Cole and Wells [35]. The model is based on a finite-difference approximation to the laterally averaged equations of fluid motion and quantifies free surface elevation, pressure, density, vertical and horizontal velocities, and constituent concentration and transport. Explicit numerical schemes are employed to compute velocities, controlling the transport of energy and biochemical constituents. CE-QUAL-W2 simulations are rather fast and require low computational power, but need a significant amount of data. Also, the high number of parameters makes the calibration tasks difficult. Nonetheless, this model has been optimized for water quality in reservoirs and is one of the most used models in the study and management of these aquatic systems [36,37,38,39,40,41].
5.1.2. MIKE HYDRO River
The MIKE HYDRO River model (Table 2) is a one-dimensional modeling tool developed by the Danish Hydraulic Institute (DHI), for the detailed design, management and operation of river and channel systems with different levels of complexity [42]. This model has been widely used in the modeling of rivers and lakes [43,44]. The model is composed of several modules that can be either used together or as stand-alone simulators, including rain fall, hydrodynamic, advection-dispersion, sediment and water quality. The hydrodynamic module is one-dimensional and computes unsteady flow, discharge and water level based on Saint–Venant equations. This model has been optimized for operational modeling in flood forecasting, ecological assessment of water quality in rivers and wetlands, sediment transport and river morphodynamics. However, the MIKE HYDRO River model requires a large amount of data and a proper simulation of some constituents can be difficult to achieve if data are lacking [4]. The model is also highly dependent on bathymetric accuracy.
5.1.3. MOHID Water
MOHID Water (MOHIDw henceforth) is an open-source water modeling system (Table 2) designed for the effective simulation of 3D baroclinic circulation across river-to-ocean scales, using a finite volume approach that solves the primitive continuity and momentum equations for the surface elevation and 3D velocity field for incompressible flows. Temporal discretization is performed by a semi-implicit (ADI) algorithm with two time levels per iteration. MOHID Water couples the hydrodynamic model with two water quality/biogeochemical models with different levels of complexity: a simpler NPZ (nutrient-phytoplankton-zooplankton) model using the EPA formulation [45] and a complex multi-elements model for marine ecological processes [46]. The model was originally developed for marine systems but its modular code configuration allows its use in a variety of spatial and temporal scales to study processes occurring in reservoirs [47], estuaries and coastal lagoons [48,49,50,51,52,53], up to regional scales [54]. More recently the MOHID Land model has been developed for watershed and groundwater processes [55,56], aiming at a future full modeling of the land-to-ocean water continuum [57].
5.1.4. QUAL2KW
QUAL2Kw (Table 2) is the recent development of models in the QUAL 2 series [58,59,60], released by the EPA. QUAL2Kw is a 1D steady-state model for rivers, tributaries and well-mixed lakes. Unlike the previous versions, QUAL2Kw allows for unequal river reaches, and multiple water inputs and abstractions in each segment. The model solves both the advective and dispersion modes of transport in the mass balance of constituents. The model allows the simulation of several parameters: dissolved oxygen (DO), biochemical oxygen demand (BOD), temperature, pH, conductivity, suspended solids, alkalinity, total inorganic carbon, organic nitrogen, ammonia, nitrite, nitrate, organic phosphorus, inorganic phosphorus, algae (chlorophyll a), coliform bacteria, one arbitrary non-conservative constituent solute, and three conservative constituent solutes. QUAL2Kw is a well-documented freeware model and is specially designed for a system where macrophytes play an important role. It has been used to simulate lotic systems [61,62,63].
5.1.5. SIMCAT
SIMCAT (Simulation of Catchments, Table 2), originally developed by the Anglian Water Group, UK, is a one-dimensional, time-invariant (steady-state) model to simulate the fate and transport of solutes in a river [6,64]. SIMCAT is a stochastic model relying on Monte Carlo analysis techniques. The model includes the inputs from point-source effluent discharges including DO, non-conservative substances such as BOD with a decay rate, and conservative substances which are assumed not to decay. The model splits the river into user defined reaches, and in each run, the model randomly selects values for quality and flow from the given distributions for all the inputs. This model excludes processes such as photosynthesis and oxygen consumption in the sediments, thus becoming limited to model the reservoir dynamics. However, it is suited for modeling constituents in freshwater that do not rely on sediment interactions. SIMCAT is easy to use, allows fast runs and requires a relatively small amount of data to operate. The model can easily be applied at the basin scale and used as an evaluation and management tool by trained technicians [65].
5.1.6. SisBaHIA
SisBaHIA® (Sistema Base de Hidrodinâmica Ambiental) (Table 2) was originally developed to simulate coastal and in-land water bodies [66,67], and is composed of a 3D hydrodynamic model coupled to a water quality model. The advection–diffusion equation is solved individually for each constituent, taking into consideration the advective and diffusion terms, together with the transformation terms [68]. The model relies on finite elements and the finite difference approach in the spatial and time discretization, respectively. Turbulent stress is parameterized according to filtering techniques derived from the approaches known as large eddy simulation. The water quality model uses the same basic transformation equations presented in the WASP (Water Quality Analysis Simulation Program) model, and also uses the same spatial grid as the hydrodynamics model. SisBaHIA can have non-restricted used for non-profit applications such as research purposes. However, its use in a commercial activity (e.g., for consultancy purposes) can only be done under the payment of a fee defined by direct agreement with COPPE/UFRJ.
5.1.7. TOMCAT
The TOMCAT (Temporal Overall Model for Catchments) (Table 2) model was advanced in the 1980s by Thames Water, a UK water utility company, to assist in studying and improving effluent quality at all Thames water sites [69,70]. While TOMCAT follows a similar approach to SIMCAT, by assuming a continuous stirred-tank reactor (CSTR) method and Monte Carlo stochastics, it differs by allowing more complex temporal correlations. The model allows for setting the number of parameters by river segment, as well as the length, mean area, cross-section, and depth for each river reach. Equations relating the processes that control the concentration of solutes are identical to SIMCAT, except for temperature and DO. The simpler approach of TOMCAT requires a rather limited amount of data when compared to other models. However, its simpler approach also comes with some limitations, like the number of simulated processes, some of which are relevant for aquatic systems, such as photosynthesis, respiration, and sediment dynamics.
5.1.8. WASP7
The WASP model (Water Quality Analysis Simulation Program) (Table 2) is a freeware model developed by the EPA for surface water quality processes [71]. WASP7 can be coupled to hydrodynamic and sediment transport models that provide flow, depths, current velocities, temperature, salinity and sediment fluxes. As such, the WASP7 model can become a full 3D dynamic model, but linking the model to multi-dimensional hydrodynamic models is not a straightforward task. The model relies on the finite difference method to calculate the temporal and spatial evolution of these constituents in each segment of the computational geometry. WASP models have been applied to address several water quality problems in a variety of aquatic systems, such as ponds, lakes, rivers, reservoirs, estuaries and coastal waters [72,73,74]. WASP7 addresses processes that take place both in the water columns and sediment and is particularly useful to simulate organic chemicals. However, the model does not simulate mixing zones and near-field effects and does not handle the sinking and flotation behavior of some constituents.
5.2. Evaluation Criteria for the Case Study
A list of 16 criteria was defined (Table 4), with two identified as eliminatory criteria: criterion S9 (modelling approach) and criterion E6 (cost). If the modelling approach was CSTR (see Table 3) on criterion S9, then the model was excluded from the evaluation process, since this approach fails to reproduce the vertical thermal structure of the reservoirs, a relevant process for the present case study. The criterion for exclusion, E6, was based on the model not being freeware or open source. This exclusion factor was applied as long as there were enough open source or freeware models suitable for the case study in the evaluation process.
5.3. Valuation of Criteria for the Case Study
Three models were excluded from the evaluation process based on the eliminatory criteria. These were MYKE HYDRO River (criterion E6), SIMCAT (criterion S9) and TOMCAT (criterion S9).
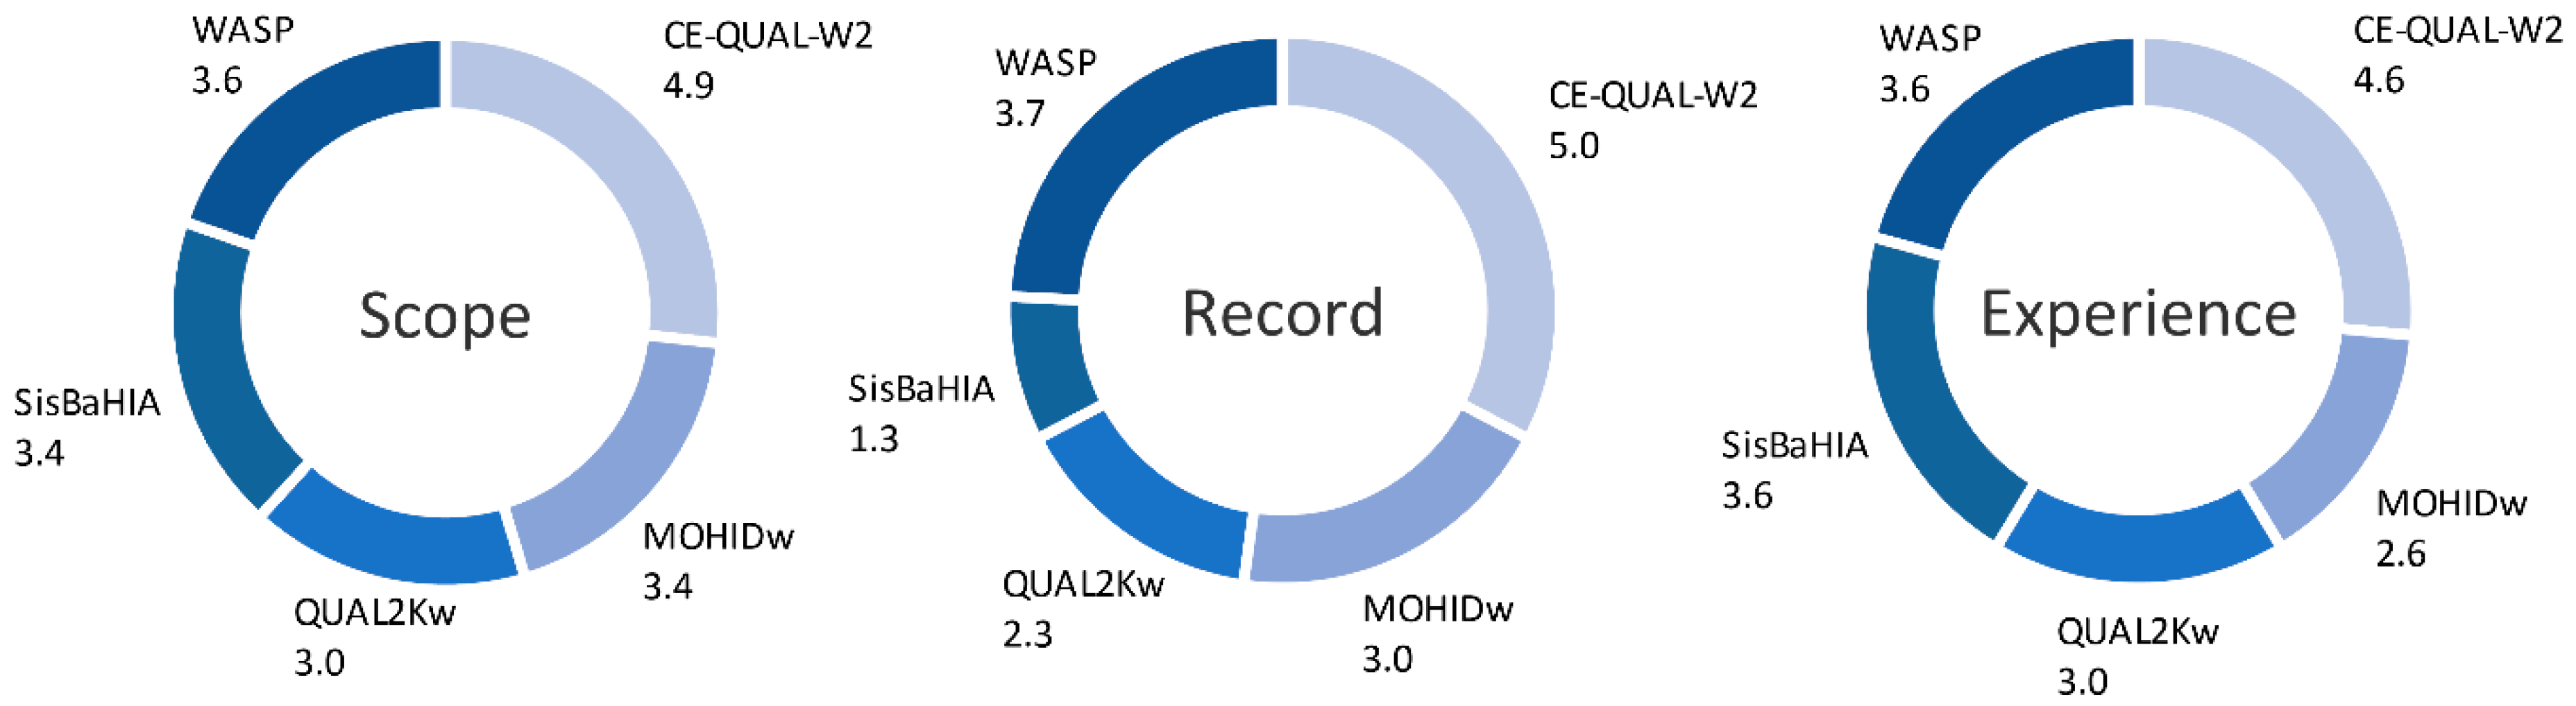
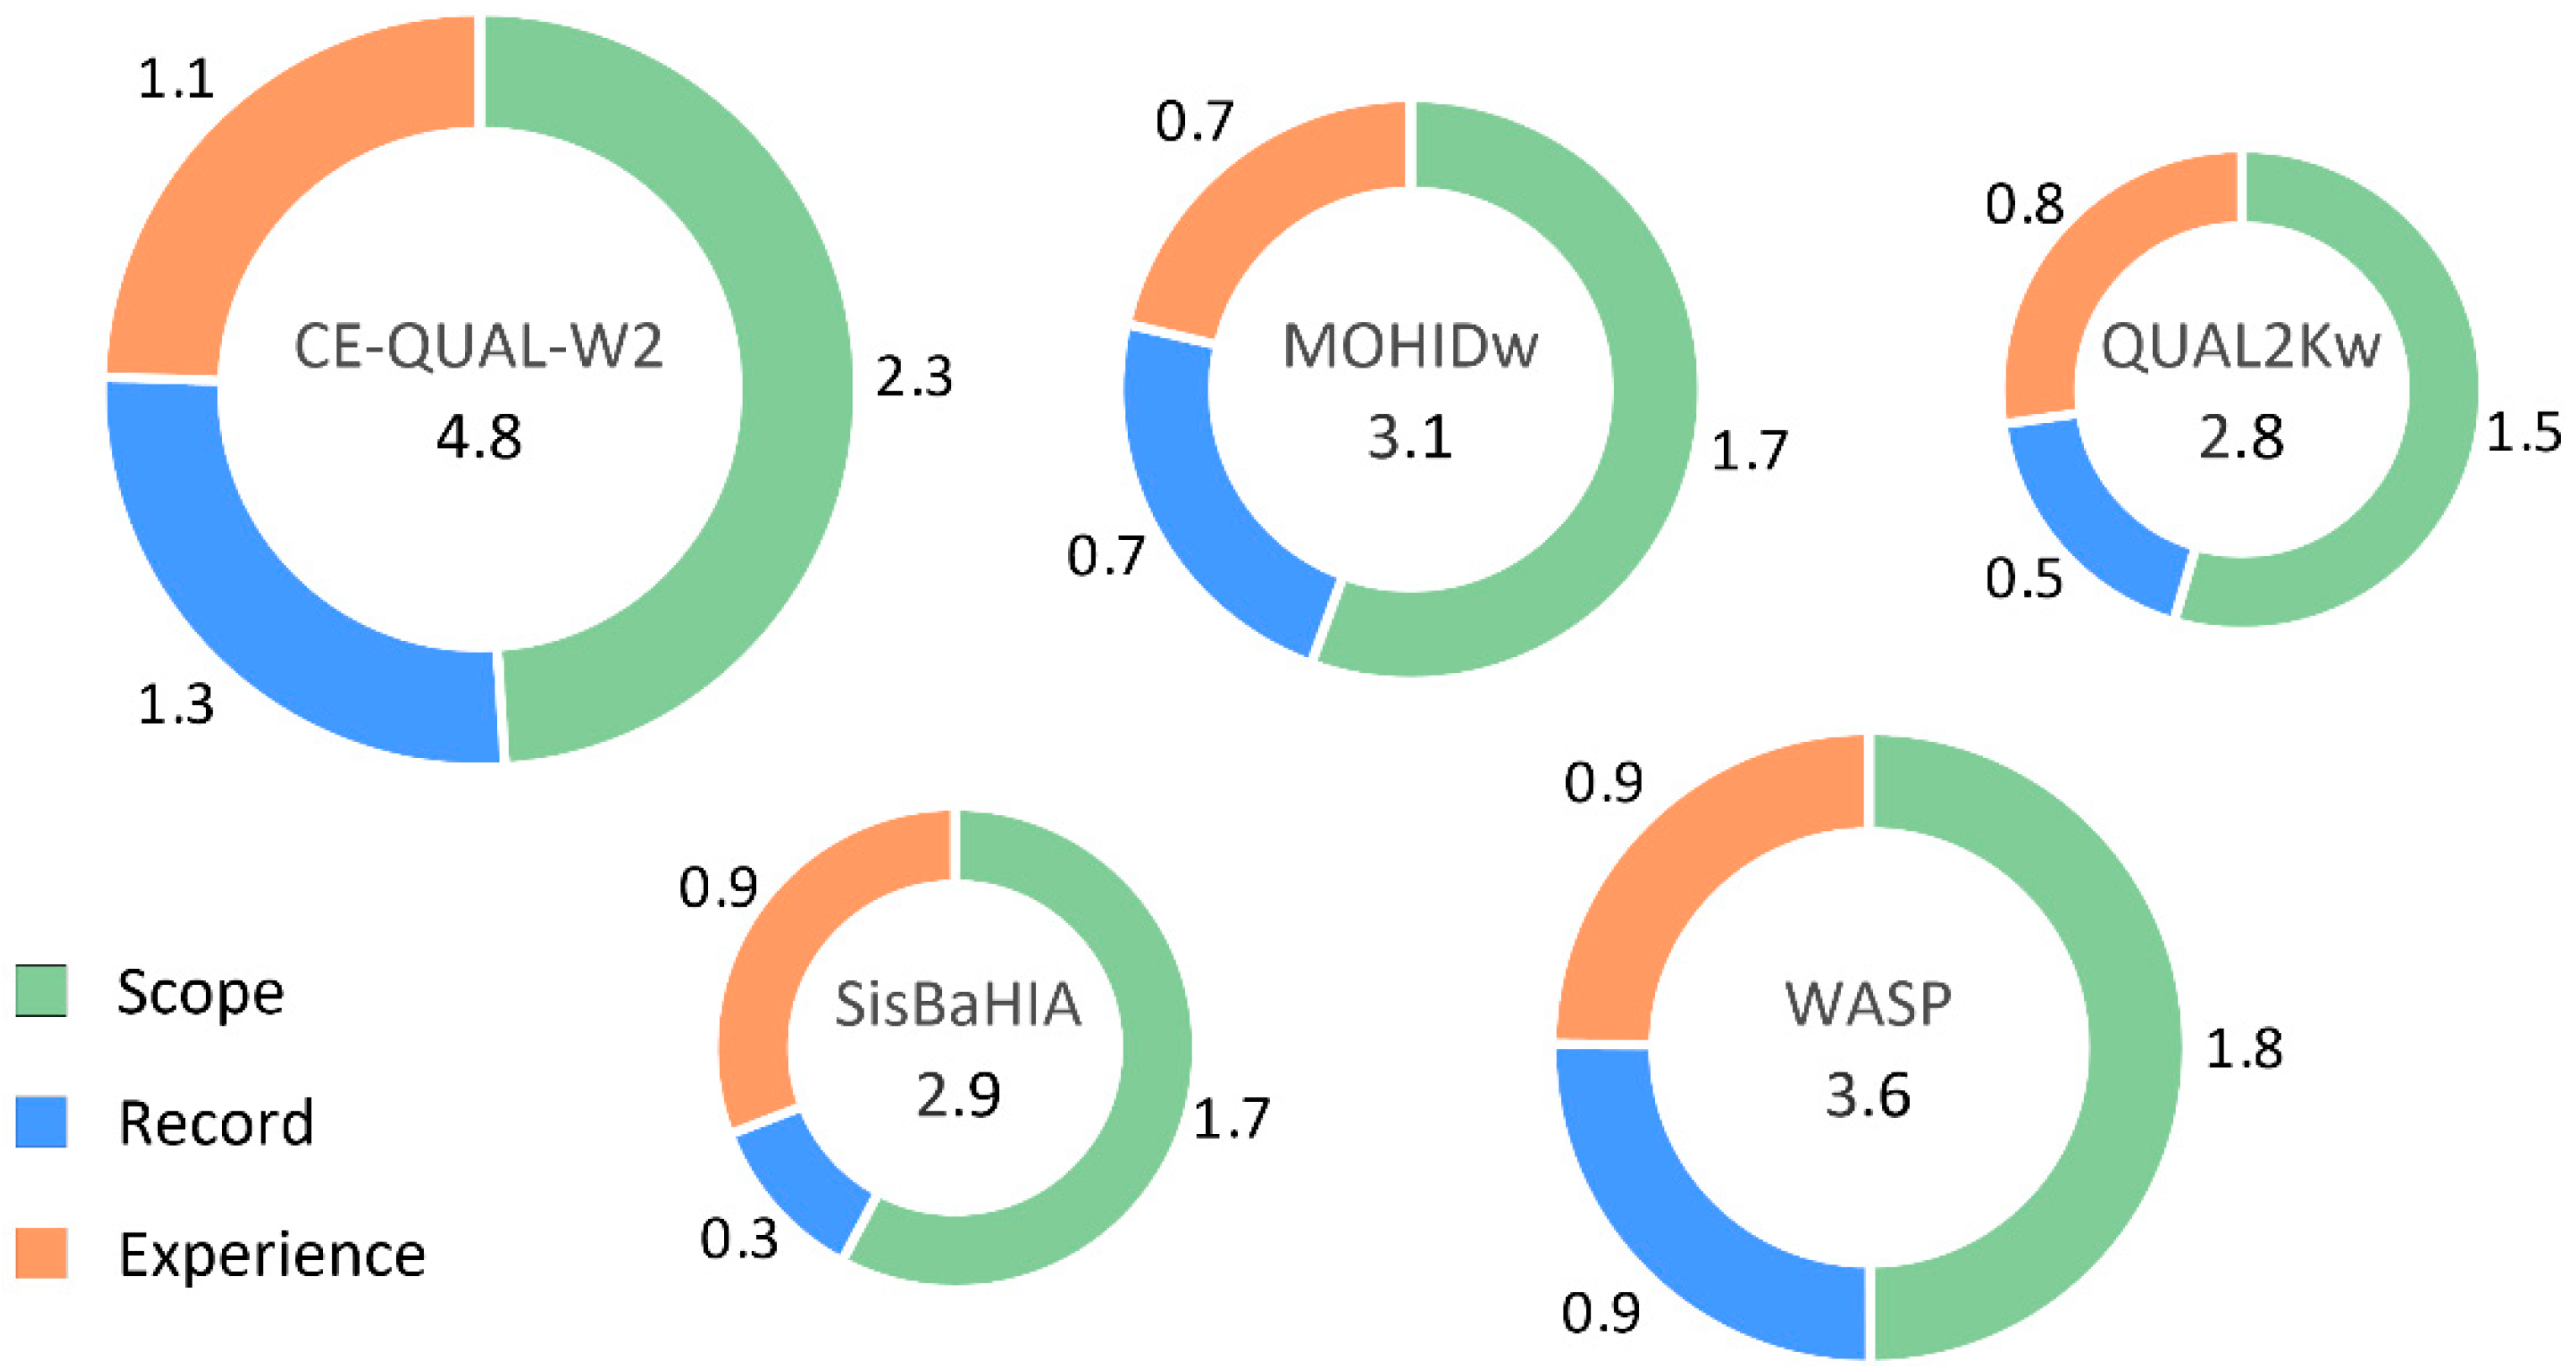
For the remaining models (CE-QUAL-W2, MOHIDw, SisBaHIA, QUAL2KW and WASP7) the results for each cluster are shown in Figure 4 and the values for the ranking of models for each criterion are presented in Table 5. The results show that CE-QUAL-W2 had higher values for all clusters, with a clear gap to the remaining models. The WASP model showed the second-highest mark for all clusters, followed by MOHIDw and SisBaHIA in Scope, MOHIDw in Record and QUAL2Kw in Experience. A brief analysis is presented in the next sections for each cluster.
5.3.1. Evaluation of Model Scope
Considering the criteria in model Scope, CE-QUAL-W2 had the highest score, denoting a better capacity to address all the characteristics of the studied systems under consideration. The WASP model followed in the ranking for Scope, since it also addresses most of the items. Like CE-QUAL-W2, the WASP model was developed for fresh water systems, having a detailed parameterization of chemical reaction characteristics of such water bodies, including sediment processes and water-sediment mass fluxes. MOHIDw and SisBaHIA both have an advantage with their 3D setup, allowing a more realistic simulation of hydrodynamic processes in larger reservoirs. WASP7 also enables the user to work on 3D systems, when coupled with a 3D hydrodynamic model. CE-QUAL-W2, on the other hand, only allows for a 2D setting, relying on the assumption that this approach is suited for most reservoirs. However, MOHIDw and SisBaHIA miss some relevant processes/constituents in fresh water systems.
5.3.2. Evaluation of Model Record
Models were searched for hits in ScienceDirect (SD), in both the combination of ‘Title, abstract and keywords’, and ‘all fields’, and Web of Knowledge (Wok), for both ‘Title’ and ‘Topic’. The results are depicted in Figure 5. According to both portals, CE-QUAL-W2 stands as the model with the highest number of hits, except for ‘Title’ in SD where MOHIDw had the highest score. SisBaHIA was the model with fewer hits on both SD and WoK. Browsing available studies of each model reveals that CE-QUAL-W2 is the most disseminated model, having numerous applications worldwide, followed by WASP and MOHIDw models also with a global reach, but with lesser applications, and finally by SisBaHIA, almost confined to Brazil. CE-QUAL-W2 also ranks higher in the type of water systems, since it has been purposely developed for rivers and reservoirs, unlike other models that were mostly developed for coastal and transitional waters (e.g., MOHIDw and SisBaHIA).
5.3.3. Evaluation of Model Experience
All models provide a GUI interface, support material and running examples, and have user forums where users and developers can post comments and exchange information. These, however, vary in sophistication and completeness between models. CE-QUAL-W2 is the model that offers the more comprehensive user manual, detailed examples of running applications and a dedicated user forum. MOHIDw, for example, is a community model in continuous development by a number of users worldwide and, although a highly complex and comprehensive modeling platform, the support documents are dispersed over several sources and not centralized and updated in the form of a user manual. SisBaHIA has the most intuitive native GUI, followed by CE-QUAL-W2 with a software developed by the community of users. All other models have a suitable GUI, and MOHIDw even provides the use of an advanced GUI, in the form of the commercially licensed software MOHID Studio (Action Modulers: Mafra, Portugal). This software integrates model simulations with the management of field data, among many other modeling support tools. Likewise, CE-QUAL-W2 also has the option of using a GUI with additional options when compared to the native version. SisBaHIA is the only model that offers technical support in the form of a service, the terms of which are decided on a case-by-case basis. Other models offer interspersed support in the form of help to users provided by authors (e.g., CE-QUAL-W2), the institution responsible for the model (e.g., WASP7) or the team of developers (e.g., MOHIDw).
5.4. Model Ranks
Model ranks were obtained using Equation (2), and by assigning the relative weight of 50% to Scope (WS), 25% to Record (WR) and 25% to Experience (WE), according to the end-users.
The ScoRE ranking, determined according to Equation (2) with the calculated values for each cluster (Table 5), showed that CE-QUAL-W2 was the most suited model (ScoRE = 4.8), followed by WASP (ScoRE = 3.6), MOHIDw (ScoRE = 3.1), SisBaHIA (ScoRE = 2.9) and QUAL2Kw (ScoRE = 2.8). In fact, not only did CE-QUAL-W2 perform better overall, it performed better in terms of the three clusters, being the best model in terms of Scope, Record and Experience for this particular case study. The results are graphically illustrated in Figure 6.
6. Discussion
6.1. Criteria Defined in ScoRE
The ScoRE approach starts with only three broad clusters of criteria and a blank list of criteria. Consequently, it imposes less framing regarding criteria definition than other methods found in the literature [18,19,20]. Reducing framing means the list is more flexible and allows new criteria to emerge, but it can also mean relevant criteria might not be identified and used in the analysis. This is the reason why authors propose the involvement of both the technical team and end-users in the criteria definition process; while the technical team has a better understanding of the processes being modelled, end-users have a better grasp of the relevant social, political, institutional and economic context and constraints. However, in the present case, end-users have only defined financial criteria.
A total of 18 criteria were defined. This is a higher number than other studies, which presented on average of 10 criteria [18,19,21,22], with the exception of Grimsrud et al. [20] which offered a total of 24 criteria (Table 6). From Table 4, we can see that half of the criteria were generated from the technical team and half generated from the end-users. Both defined six of the criteria. The criteria outlined by end-users were mostly related with the Experience cluster. This shows that both model users and modelers can contribute meaningfully to the definition of criteria.
The criteria defined in the case study are within the range of criteria found in the literature. Despite the freedom in criteria definition for ScoRE, novel criteria did not emerge from this particular case study. In this sense, ScoRE lead to similar results to those expected if other methods were used for criteria definition. From the literature analyzed, ScoRE was the only approach where the list of criteria is empty at the beginning of the process and where both modelers and end-user define the criteria for the evaluation process. The results obtained show that model users can define criteria for the evaluation, complemented with additional criteria suggested by the modelers. This means that criteria definition can be opened up for discussion between modelers and end users, in addition to the valuation stage.
The range of criteria defined for this particular case did not include, for example, criteria linked with the accuracy of the data and model, if the models include uncertainty or sensitivity analyses to the results, or even on the availability of data [18,20,25]. Such criteria, however, should be part of the criteria list in further studies, given their implications on the use of the model and validity of its results.
6.2. Valuation of Criteria in ScoRE
In ScoRE, the technical team performs the valuation of criteria, not the end-users. The particularity of ScoRE is that values for models in the criteria are discussed with the end-users, in particular, those referring to criteria within the cluster “Experience”. The advantages of having the technical team performing the scoring are that the end-users might not process all the knowledge necessary to adequately evaluate the models under the criteria [19], in particular, the criteria falling under the cluster “Scope”.
The disadvantages of such an approach are that the process can become less transparent (and less accountable), costlier (due to the costs of hiring a technical team) and lengthier [18,20,21,22]. The fact that ScoRE allows the discussion of the scorings with the end-users helps to restore transparency in the model selection process. Furthermore, for this particular project, the decision to use a technical team to model water quality has been made before the decision of whether to involve the technical team on model selection. Therefore, in this particular case, asking the technical team to select the appropriate model for the case study was just an additional small cost to the overall budget.
Another particularity of ScoRE was the use of eliminatory criteria that had two values linked with acceptable and not acceptable scores. Being scored unacceptable in any of these eliminatory criteria meant the elimination of the model from the process. In this case study, two eliminatory criteria were defined which resulted in the elimination of three models from the evaluation. In this regard, the main difference between ScoRE and Tuo et al. [22] is that, for the remaining models, ScoRE presents clear guidance for weight definition.
6.3. The ScoRE Aggregation Procedure
The results show that CE-QUAL-W2 performed better than the remaining four models analyzed (Figure 6). It is important to stress that results are specific for this particular case study, as the choice of criteria and the weights attributed to the clusters can vary from application to application, resulting in different rankings. The outcome of this method reflects the importance that the technical team and the end-users assign to different criteria. Even for a reservoir, for example, SisBaHIA or MOHIDw could have a higher ScoRE than other models, if the focus of the study relied heavily on hydrodynamics, since both achieved better spatial simulation of transport processes [38,75]. Likewise, if an integrated watershed–river–reservoir modelling approach was favored, MOHIDw would be a better option, reaching a higher ScoRE, as it can be coupled with MOHID Land, which describes the transport of water in the watershed [57,76].
In this case study, end-users attributed higher weight to the cluster “Scope,” and equal weights to the clusters “Record” and “Experience” (Section 5.4). These results are not surprising and in line with other works on model selection, in which most of the criteria are related with the cluster “Scope” [19,20,21,25,77], as shown in Table 6. The only literature case analyzed that provided a higher number of criteria to another category rather than “Scope” was Saloranta et al. [18], which defined five criteria for scope, but eight for Experience (and one for record).
Although the clusters Record and Experience had equal weights (25% each, Section 5.4), the cluster Experience scores were higher or similar to the scores from the cluster Record (Figure 6), with a small exception for the model CE-QUAL-W2, where Record value was 0.1 points higher than the value for Experience. Interestingly, the literature shows more criteria related to the cluster Experience, than with the cluster Record [18,19,20,25,77]. Therefore, results obtained here seem to agree with the observed patterns in the literature concerning criteria relevance (Table 6).
The aggregation procedure used in ScoRE to obtain ranking is a procedure which includes a mixture of approaches: from eliminatory criteria [18,19,20,21], averaging scores of criteria (within the same cluster), and consulting with end-users to define weights to the clusters which are then added using a linear additive model (a compensatory aggregation procedure).
The proposed approach requires communication between modelers and end-users, thus promoting the pivotal exchange of information [78]. This, in turn, leads to rational reflection, and potentially, some learning from both sides. Additionally, by making use of a linear additive model for aggregating results, the outcome is more straightforward to understand by end-users, improving the transparency of the method. However, the linear additive procedure is a compensatory method in which weights are recognized as trade-offs. This is an essential issue for sustainability, as certain voices and some ecosystem services should not be traded off [23,79,80]. For models, it can mean that a combination of a high score in the interface with a low score regarding a specific relevant modeled parameter, can exceed a higher score in the referred parameter combined with a lower score on the interface. By using the eliminatory criteria, ScoRE allows reducing some of this compensatory nature, being a partially compensatory approach. However, criteria within each cluster are still averaged. By doing so, one is assuming that all criteria not classified as an eliminatory criterion within the same cluster are equally relevant, which might not always be the case.
In this case study, as in all the approaches reviewed in this paper, end-users are clearly defined and limited in the number of individuals, and it’s not infrequent to have only one decision-maker. Under more complex decisions, with more decision-makers, a discussion on whether weights should or not be used needs to take place to avoid social traps, ensure all relevant voices are included, and ensure that value disparities and conflicts are recognized and managed correctly [16].
6.4. A Word on Robustness, Sensitivy and Transparency of the Process and Results Obtained
Finally, results from ScoRE are discussed with the end-user who can go through the whole process and change it. This way, results are exposed to validation by the end user. Furthermore, ScoRE starts with a clean sheet regarding the criteria to be used for the evaluation (and the relative importance of each criterion—the weights), which allows different end-users (and modelers) to participate in the identification of which criteria to include in the evaluation, potentially accommodating different perspectives in the process. The two factors mentioned help ScoRE to reduce ambiguity in its results and to be seen as potentially more robust than other approaches. This step also entails a sensitivity analysis in which some of the assumptions or parameters included in the model are given a different value, to test whether the final ranking of alternatives changes. This methodology is more in line with the post-normal approach to science (with the use of a peer-review community [81]). It is also in line with other approaches dealing with uncertainty (e.g., Stirling [82]), where the focus is not on accepting scientific inputs uncritically, i.e., without articulating the degree of risk associated with the results or the values that inevitably enter in the presence of uncertainty.
7. Conclusions
For many years, decision-makers have managed water quality in rivers and reservoirs empirically, relying to some extent on scientific tools and input, but frequently based on political motivations. The need for sound decisions, however, has pushed the development of numerical models to address specific environmental and socioeconomic setting. Eventually, this effort resulted in the myriad models that are now available, raising the problem of their choice by users. A model will hardly possess all the required functionalities for a specific application and, consequently, the choice of a model depends upon many conditions and requirements.
Given the significant number of available modeling tools for such tasks, water managers wanting to use numerical tools must, at some point, choose among the myriad options, frequently without any specific criteria or methodology. The debate on how to select water quality models is relatively recent, and only a few approaches to model choice have been proposed. While not being a method to compare models in their essence, ScoRE may be useful for that purpose.
The main advantages of ScoRE are:
- Criteria to compare models are defined in a dialog between the modelers and end-users. Introducing both perspectives into criteria definition can lead to a more comprehensive list.
- ScoRE is a transparent method, as end-users are invited to go through the whole process and to discuss final results with the technical team.
- The guidance on how to select a model when models are not excluded by eliminatory criteria (in contrast with most of the literature found, with some exceptions [22]).
- The final discussion of results with end users, allowing for the refinement of results, and producing a more robust outcome.
ScoRE is not free from limitations, nonetheless. In ScoRE, end-users have little say in the scoring stage, making the process more resource-consuming (concerning time and costs), as a technical team is required for the scoring stage. ScoRE’s weighting procedure is still a complex procedure involving averaging scores within clusters and attributing weights to clusters. This could be further simplified. Finally, more emphasis can be put into eliminatory criteria (higher number of criteria classified as eliminatory). These will be the target of improvement in further stages of this research.
Author Contributions
Conceptualization, M.M. and F.R.; Data curation, M.M. and C.A.; Formal analysis, M.M. and R.d.S.V.; Funding acquisition, F.R. and M.M.; Investigation, M.M. and R.d.S.V..; Methodology, M.M., R.d.S.V., C.A.; Project administration, F.R.; Writing—original draft preparation, M.M., F.R. and M.S.; Writing—review and editing, M.M. and R.d.S.V.
Funding
M.M. and R.V. were funded by ERDF Funds of the Competitiveness Factors Operational Programme—COMPETE and by national funds from the FCT—Foundation for Science and Technology project UID/EEA/50009/2013. Open access publication costs were supported also by this project. F.R., C.A., and M.S. were funded by Projecto de Apoio ao Crescimento económico com redução das desigualdades e sustentabilidade ambiental do Ceará—programa de resultados (PforR), Acordo de Empréstimo N°IBRD 8302-BR.
Acknowledgments
The authors would like to thank to Valdenor Nilo de Carvalho Junior and Gilberto Mobus, both from Fundação Cearense de Meteorologia e Recursos Hídricos (FUNCEME), to Walt Disney Paulino from Companhia de Gestão dos Recursos Hídricos (COGERH), and to Luciano Cota from Azurit Engenharia e Meio Ambiente, for their involvement in the criteria definition stage of this study.
Conflicts of Interest
The authors declare no conflict of interest.
References
- Olsson, J.A.; Andersson, L. Possibilities and problems with the use of models as a communication tool in water resource management. Water Resour. Manag. 2006, 21, 97. [Google Scholar] [CrossRef]
- Silva-Hidalgo, H.; Martín-Domínguez, I.R.; Alarcón-Herrera, M.T.; Granados-Olivas, A. Mathematical Modelling for the Integrated Management of Water Resources in Hydrological Basins. Water Resour. Manag. 2009, 23, 721–730. [Google Scholar] [CrossRef]
- Benedini, M.; Tsakiris, G. Water Quality Modelling for Rivers and Streams; Springer: Berlin, Germany, 2013. [Google Scholar]
- Liangliang, G.; Daoliang, L. A review of hydrological/water-quality models. Front. Agric. Sci. Eng. 2014, 1, 267–276. [Google Scholar] [CrossRef]
- Wang, Q.; Li, S.; Jia, P.; Qi, C.; Ding, F. A Review of Surface Water Quality Models. Sci. World J. 2013, 2013, 7. [Google Scholar] [CrossRef]
- Cox, B.A. A review of currently available in-stream water-quality models and their applicability for simulating dissolved oxygen in lowland rivers. Sci. Total Environ. 2003, 314–316, 335–377. [Google Scholar] [CrossRef]
- Tsakiris, G.; Alexakis, D. Water quality models: An overview. Eur. Water 2012, 37, 33–46. Available online: http://www.ewra.net/ew/pdf/EW_2012_37_04.pdf (accessed on 20 July 2018).
- Kirchner, J.W.; Hooper, R.P.; Kendall, C.; Neal, C.; Leavesley, G. Testing and validating environmental models. Sci. Total Environ. 1996, 183, 33–47. [Google Scholar] [CrossRef]
- Steele, K.; Werndl, C. Model tuning in engineering: Uncovering the logic. J. Strain Anal. Eng. Des. 2016, 51, 63–71. [Google Scholar] [CrossRef]
- Oreskes, N.; Shrader-Frechette, K.; Belitz, K. Verification, Validation, and Confirmation of Numerical Models in the Earth Sciences. Science 1994, 263, 641–646. [Google Scholar] [CrossRef]
- McIntosh, B.S.; Alexandrov, G.; Matthews, K.; Mysiak, J.; van Ittersum, M. Preface: Thematic issue on the assessment and evaluation of environmental models and software. Environ. Model. Softw. 2011, 26, 245–246. [Google Scholar] [CrossRef]
- Matthews, K.B.; Rivington, M.; Blackstock, K.; McCrum, G.; Buchan, K.; Miller, D.G. Raising the bar?—The challenges of evaluating the outcomes of environmental modelling and software. Environ. Model. Softw. 2011, 26, 247–257. [Google Scholar] [CrossRef]
- Alexandrov, G.A.; Ames, D.; Bellocchi, G.; Bruen, M.; Crout, N.; Erechtchoukova, M.; Hildebrandt, A.; Hoffman, F.; Jackisch, C.; Khaiter, P.; et al. Technical assessment and evaluation of environmental models and software: Letter to the Editor. Environ. Model. Softw. 2011, 26, 328–336. [Google Scholar] [CrossRef] [Green Version]
- Jakeman, A.J.; Letcher, R.A.; Norton, J.P. Ten iterative steps in development and evaluation of environmental models. Environ. Model. Softw. 2006, 21, 602–614. [Google Scholar] [CrossRef]
- Basco-Carrera, L.; Warren, A.; van Beek, E.; Jonoski, A.; Giardino, A. Collaborative modelling or participatory modelling? A framework for water resources management. Environ. Model. Softw. 2017, 91, 95–110. [Google Scholar] [CrossRef]
- Garmendia, E.; Gamboa, G. Weighting social preferences in participatory multi-criteria evaluations: A case study on sustainable natural resource management. Ecol. Econ. 2012, 84, 110–120. [Google Scholar] [CrossRef] [Green Version]
- Sandker, M.; Campbell, B.M.; Ruiz-Pérez, M.; Sayer, J.A.; Cowling, R.; Kassa, H.; Knight, A.T. The role of participatory modeling in landscape approaches to reconcile conservation and development. Ecol. Soc. 2010, 15, 13. [Google Scholar] [CrossRef]
- Saloranta, T.M.; Kämäri, J.; Rekolainen, S.; Malve, O. Benchmark Criteria: A Tool for Selecting Appropriate Models in the Field of Water Management. Environ. Manag. 2003, 32, 322–333. [Google Scholar] [CrossRef]
- Boorman, D.B.; Williams, R.J.; Hutchins, M.G.; Penning, E.; Groot, S.; Icke, J. A model selection protocol to support the use of models for water management. Hydrol. Earth Syst. Sci. Discuss. 2007, 11, 634–646. [Google Scholar] [CrossRef] [Green Version]
- Grimsrud, G.P.; Finnemore, E.J.; Owen, H.J. Evaluation of Water Quality Models: A Management Guide for Planners; Office of Air, Land and Water Use, Office of Research and Development, US Environmental Protection Agency: Washington, DC, USA, 1976. [Google Scholar]
- Chinyama, A.; Ochieng, G.M.; Nhapi, I.; Otieno, F.A.O. A simple framework for selection of water quality models. Rev. Environ. Sci. Bio/Technol. 2014, 13, 109–119. [Google Scholar] [CrossRef]
- Tuo, Y.; Chiogna, G.; Disse, M. A Multi-Criteria Model Selection Protocol for Practical Applications to Nutrient Transport at the Catchment Scale. Water 2015, 7, 2851–2880. [Google Scholar] [CrossRef] [Green Version]
- Munda, G. Social multi-criteria evaluation: Methodological foundations and operational consequences. Eur. J. Oper. Res. 2004, 158, 662–677. [Google Scholar] [CrossRef]
- Choo, E.U.; Schoner, B.; Wedley, W.C. Interpretation of criteria weights in multicriteria decision making. Comput. Ind. Eng. 1999, 37, 527–541. [Google Scholar] [CrossRef] [Green Version]
- Parsons, J.E.; Sabbagh, G.J.; Heatwole, C.D.; Evans, R.O. Evaluation Criteria for Water Quality Models. Paper 982194. ASAE Annual International Meeting. Orlando. Available online: http://s1004.okstate.edu/S1004/Regional-Bulletins/Modeling-Bulletin/asaecrit-ed-draft0.html (accessed on 7 February 2018).
- Loucks, D.P.; van Beek, E. Water Resource Systems Planning and Management; The United Nations Educational, Scientific and Cultural Organization: Paris, France, 2017; p. 624. [Google Scholar]
- Martin, J.L. Application of two-dimensional water quality model. J. Environ. Eng. ASCE 1988, 114, 317–336. [Google Scholar] [CrossRef]
- Garvey, E.; Tobiason, J.E.; Hayes, M.; Wolfram, E.; Reckhow, D.A.; Male, J.W. Coliform transport in a pristine reservoir: Modeling and field studies. Water Sci. Technol. 1998, 37, 137–144. [Google Scholar] [CrossRef]
- Gunduz, O.; Soyupak, S.; Yurteri, C. Development of water quality management strategies for the proposed Isikli Reservoir. Water Sci. Technol. 1998, 37, 369–376. [Google Scholar] [CrossRef]
- Kuo, J.-T.; Liu, W.-C.; Lin, R.-T.; Lung, W.-S.; Yang, M.-D.; Yang, C.-P.; Chu, S.-C. Water quality modeling for the Feitsui reservoir in Northern Taiwan. JAWRA J. Am. Water Resour. Assoc. 2003, 39, 671–687. [Google Scholar] [CrossRef]
- Kurup, R.G.; Hamilton, D.P.; Phillips, R.L. Comparison of two 2-dimensional, laterally averaged hydrodynamic model applications to the Swan River Estuary. Math. Comput. Simul. 2000, 51, 627–638. [Google Scholar] [CrossRef]
- Lung, W.-S.; Bai, S. A water quality model for the Patuxent estuary: Current conditions and predictions under changing land-use scenarios. Estuaries 2003, 26, 267–279. [Google Scholar] [CrossRef]
- Kuo, J.-T.; Lung, W.-S.; Yang, C.-P.; Liu, W.-C.; Yang, M.-D.; Tang, T.-S. Eutrophication modelling of reservoirs in Taiwan. Environ. Model. Softw. 2006, 21, 829–844. [Google Scholar] [CrossRef]
- Cole, T.M.; Buchak, E. CE-QUAL-W2: A Two-Dimensional, Laterally Averaged, Hydrodynamics and Water Quality Model, Version 2.0; Portland State University: Vicksburg, MS, USA, 1995. [Google Scholar]
- Cole, T.M.; Wells, S.A. Hydrodynamic Modeling with Application to CE-QUAL-W2. Workshop Notes; Portland State University: Portland, OR, USA, 25 August 2000. [Google Scholar]
- Zouabi-Aloui, B.; Gueddari, M. Two-dimensional modelling of hydrodynamics and water quality of a stratified dam reservoir in the southern side of the Mediterranean Sea. Environ. Earth Sci. 2014, 72, 3037–3051. [Google Scholar] [CrossRef]
- Sullivan, A.B.; Jager, H.I.; Myers, R. Modeling white sturgeon movement in a reservoir: The effect of water quality and sturgeon density. Ecol. Model. 2003, 167, 97–114. [Google Scholar] [CrossRef]
- Deus, R.; Brito, D.; Mateus, M.; Kenov, I.; Fornaro, A.; Neves, R.; Alves, C.N. Impact evaluation of a pisciculture in the Tucuruí reservoir (Pará, Brazil) using a two-dimensional water quality model. J. Hydrol. 2013, 487, 1–12. [Google Scholar] [CrossRef]
- Park, Y.; Cho, K.H.; Kang, J.-H.; Lee, S.W.; Kim, J.H. Developing a flow control strategy to reduce nutrient load in a reclaimed multi-reservoir system using a 2D hydrodynamic and water quality model. Sci. Total Environ. 2014, 466–467, 871–880. [Google Scholar] [CrossRef] [PubMed]
- Mateus, M.; Almeida, C.; Brito, D.; Neves, R. From Eutrophic to Mesotrophic: Modelling Watershed Management Scenarios to Change the Trophic Status of a Reservoir. Int. J. Environ. Res. Pub. He 2014, 11, 3015–3031. [Google Scholar] [CrossRef] [PubMed] [Green Version]
- Noori, R.; Yeh, H.-D.; Ashrafi, K.; Rezazadeh, N.; Bateni, S.M.; Karbassi, A.; Kachoosangi, F.T.; Moazami, S. A reduced-order based CE-QUAL-W2 model for simulation of nitrate concentration in dam reservoirs. J. Hydrol. 2015, 530, 645–656. [Google Scholar] [CrossRef]
- DHI. MIKE 11—A Modeling System for Rivers and Channels—Reference Manual; Danish Hydraulic Institute: Hørsholm, Danmark, 2009. [Google Scholar]
- Doulgeris, C.; Georgiou, P.; Papadimos, D.; Papamichail, D. Ecosystem approach to water resources management using the MIKE 11 modeling system in the Strymonas River and Lake Kerkini. J. Environ. Manag. 2012, 94, 132–143. [Google Scholar] [CrossRef] [PubMed]
- Refsgaard, J.C. Parameterisation, calibration and validation of distributed hydrological models. J. Hydrol. 1997, 198, 69–97. [Google Scholar] [CrossRef]
- EPA. Rates, Constants, and Kinetics Formulations in Surface Water-Quality Modeling; Report EPA/600/3-85/040; US Environmental Protection Agency: Washington, DC, USA, 1985.
- Mateus, M. A process-oriented model of pelagic biogeochemistry for marine systems. Part I: Model description. J. Mar. Syst. 2012, 94, S78–S89. [Google Scholar] [CrossRef]
- Deus, R.; Brito, D.; Kenov, I.A.; Lima, M.; Costa, V.; Medeiros, A.; Neves, R.; Alves, C.N. Three-dimensional model for analysis of spatial and temporal patterns of phytoplankton in Tucurui reservoir, Para, Brazil. Ecol. Model. 2013, 253, 28–43. [Google Scholar] [CrossRef]
- Malhadas, M.; Mateus, M.D.; Brito, D.; Neves, R. Trophic state evaluation after urban loads diversion in a eutrophic coastal lagoon (Óbidos Lagoon, Portugal): A modeling approach. Hydrobiologia 2014, 740, 231–251. [Google Scholar] [CrossRef]
- Vaz, N.; Mateus, M.; Plecha, S.; Sousa, M.C.; Leitão, P.C.; Neves, R.; Dias, J.M. Modeling SST and chlorophyll patterns in a coupled estuary-coastal system of Portugal: The Tagus case study. J. Mar. Syst. 2015, 147, 123–137. [Google Scholar] [CrossRef]
- Franz, G.; Pinto, L.; Ascione, I.; Mateus, M.; Fernandes, R.; Leitão, P.; Neves, R. Modelling of cohesive sediment dynamics in tidal estuarine systems: Case study of Tagus estuary, Portugal. Estuar. Coast. Shelf Sci. 2014, 151, 34–44. [Google Scholar] [CrossRef]
- Mateus, M.; Vaz, N.; Neves, R. A process-oriented model of pelagic biogeochemistry for marine systems. Part II: Application to a mesotidal estuary. J. Mar. Syst. 2012, 94, S90–S101. [Google Scholar] [CrossRef]
- Saraiva, S.; Pina, P.; Martins, F.; Santos, M.; Braunschweig, F.; Neves, R. Modelling the influence of nutrient loads on Portuguese estuaries. Hydrobiologia 2007, 587, 5–18. [Google Scholar] [CrossRef]
- Vaz, N.; Mateus, M.; Dias, J.M. Semidiurnal and spring-neap variations in the Tagus Estuary: Application of a process-oriented hydro-biogeochemical model. J. Coast. Res. 2011, 64, 1619–1623. [Google Scholar]
- Mateus, M.; Riflet, G.; Chambel, P.; Fernandes, L.; Fernandes, R.; Juliano, M.; Campuzano, F.; de Pablo, H.; Neves, R. An operational model for the West Iberian coast: Products and services. Ocean. Sci. 2012, 8, 713–732. [Google Scholar] [CrossRef]
- Simionesei, L.; Ramos, T.B.; Brito, D.; Jauch, E.; Leitão, P.C.; Almeida, C.; Neves, R. Numerical Simulation of Soil Water Dynamics Under Stationary Sprinkler Irrigation with Mohid-Land. Irrig. Drain. 2016, 65, 98–111. [Google Scholar] [CrossRef]
- Bernard-Jannin, L.; Brito, D.; Sun, X.; Jauch, E.; Neves, R.; Sauvage, S.; Sánchez-Pérez, J.-M. Spatially distributed modelling of surface water-groundwater exchanges during overbank flood events—A case tudy at the Garonne River. Adv. Water Resour. 2016, 94, 146–159. [Google Scholar] [CrossRef]
- Campuzano, F.; Brito, D.; Juliano, M.; Fernandes, R.; de Pablo, H.; Neves, R. Coupling watersheds, estuaries and regional ocean through numerical modelling for Western Iberia: A novel methodology. Ocean. Dyn. 2016, 66, 1745–1756. [Google Scholar] [CrossRef]
- Park, S.S.; Lee, Y.S. A water quality modeling study of the Nakdong River, Korea. Ecol. Model. 2002, 152, 65–75. [Google Scholar] [CrossRef]
- Pelletier, G.J.; Chapra, S.C. QUAL2Kw Theory and Documentation (Version 5.1), a Modeling Framework for Simulating River and Stream Water Quality; Department of Ecology: Washington, DC, USA, 2005.
- Pelletier, G.J.; Chapra, S.C.; Tao, H. QUAL2Kw—A framework for modeling water quality in streams and rivers using a genetic algorithm for calibration. Environ. Model. Softw. 2006, 21, 419–425. [Google Scholar] [CrossRef]
- Kannel, P.R.; Kanel, S.R.; Lee, S.; Lee, Y.-S.; Gan, T.Y. A Review of Public Domain Water Quality Models for Simulating Dissolved Oxygen in Rivers and Streams. Environ. Model. Assess. 2010, 16, 183–204. [Google Scholar] [CrossRef]
- Turner, D.F.; Pelletier, G.J.; Kasper, B. Dissolved Oxygen and pH Modeling of a Periphyton Dominated, Nutrient Enriched River. J. Environ. Eng. 2009, 135, 645–652. [Google Scholar] [CrossRef]
- Kannel, P.R.; Lee, S.; Kanel, S.R.; Lee, Y.-S.; Ahn, K.-H. Application of QUAL2Kw for water quality modeling and dissolved oxygen control in the River Bagmati. Environ. Monit Assess. 2007, 125, 201–217. [Google Scholar] [CrossRef] [PubMed]
- Crabtree, B.; Hickman, M.; Martin, D. Integrated water quality and environmental cost-benefit modelling for the management of the River Tame. Water Sci. Technol. 1999, 39, 213–220. [Google Scholar] [CrossRef]
- Crabtree, B.; Seward, A.J.; Thompson, L. A case study of regional catchment water quality modelling to identify pollution control requirements. Water Sci. Technol. 2006, 53, 47–54. [Google Scholar] [CrossRef] [PubMed]
- Cunha, C.d.L.d.N.; Rosman, P.C.C.; Ferreira, A.P.; Carlos do Nascimento Monteiro, T. Hydrodynamics and water quality models applied to Sepetiba Bay. Cont. Shelf Res. 2006, 26, 1940–1953. [Google Scholar] [CrossRef]
- Rosman, P.C.C. Referência técnica do SisBaHiA®. Versão 2013. 2013. Available online: http://www.sisbahia.coppe.ufrj.br/SisBAHIA_RefTec_V92.pdf (accessed on 7 February 2018).
- Sheng, Y.P.; Villaret, C. Modeling the effect of suspended sediment stratification on bottom exchange processes. J. Geophys. Res. Oceans 1989, 94, 14429–14444. [Google Scholar] [CrossRef]
- Bowden, K.; Brown, S.R. Relating effluent control parameters to river quality objectives using a generalized catchment simulation model. Water Sci. Technol. 1984, 16, 197–206. [Google Scholar] [CrossRef]
- Kinniburgh, J.H.; Tinsley, M.R.; Bennett, J. Orthophosphate Concentrations in the River Thames. Water Environ. J. 1997, 11, 178–185. [Google Scholar] [CrossRef]
- Ambrose, R.B.; Wool, T.A. WASP7 Stream Transport Model Theory and User’s Guide; U.S. Environmental Protection Agency: Athens, Greece, 2009.
- Rygwelski, K.R.; Richardson, W.L.; Endicott, D.D. A Screening-Level Model Evaluation of Atrazine in the Lake Michigan Basin. J. Great Lakes Res. 1999, 25, 94–106. [Google Scholar] [CrossRef]
- Tufford, D.L.; McKellar, H.N. Spatial and temporal hydrodynamic and water quality modeling analysis of a large reservoir on the South Carolina (USA) coastal plain. Ecol. Model. 1999, 114, 137–173. [Google Scholar] [CrossRef]
- Stansbury, J.; Admiraal, D.M. Modeling to evaluate macrophyte induced impacts to dissolved oxygen in a tailwater reservoir. JAWRA J. Am. Water Resour. Assoc. 2004, 40, 1483–1497. [Google Scholar] [CrossRef]
- Trento, A.; VinzÓN, S. Experimental modelling of flocculation processes-the case of Paraiba do Sul Estuary. Int. J. Sediment. Res. 2014, 29, 378–390. [Google Scholar] [CrossRef]
- Brito, D.; Campuzano, F.J.; Sobrinho, J.; Fernandes, R.; Neves, R. Integrating operational watershed and coastal models for the Iberian Coast: Watershed model implementation—A first approach. Estuar. Coast. Shelf Sci. 2015, 167, 138–146. [Google Scholar] [CrossRef]
- Fitzpatrick, J.; Imhoff, J.; Burgess, E.; Brashear, R. Water Quality Models: A Survey and Assessment. Final Report for Project 99-WSM-5; Water Environment Research Foundation: Alexandria, VA, USA, 2001. [Google Scholar]
- Cartwright, S.J.; Bowgen, K.M.; Collop, C.; Hyder, K.; Nabe-Nielsen, J.; Stafford, R.; Stillman, R.A.; Thorpe, R.B.; Sibly, R.M. Communicating complex ecological models to non-scientist end users. Ecol. Model. 2016, 338, 51–59. [Google Scholar] [CrossRef]
- Daly, H.E. Toward some operational principles of sustainable development. Ecol. Econ. 1990, 2, 1–6. [Google Scholar] [CrossRef]
- Neumayer, E. Weak Versus Strong Sustainability—Exploring the Limits of Two Opposing Paradigms, 4th ed.; Edward Elgar: Cheltenham, UK; Northampton, MA, USA, 2013. [Google Scholar]
- Funtowicz, S.O.; Ravetz, J.R. Science for the post-normal age. Futures 1993, 25, 739–755. [Google Scholar] [CrossRef]
- Stirling, A. Risk, precaution and science: Towards a more constructive policy debate. EMBO Rep. 2007, 8, 309. [Google Scholar] [CrossRef]
Figure 1.
The use of eliminatory criteria on model selection for water quality.

Figure 2.
A schematic representation of the ScoRE process.

Figure 3.
Location of the study sites in the Ceará State, Brazil.

Figure 4.
Scoring of models within each cluster, according to Equation (1) applied to their defining criteria (see text for details).
Figure 4.
Scoring of models within each cluster, according to Equation (1) applied to their defining criteria (see text for details).

Figure 5.
Number of hits obtained for each model in ScienceDirect and Web of Knowledge by 20 December 2016. Conditions for search: all journals and books available in ScienceDirect (SD) and available papers in Web of Knowledge (WoK); WASP model versions from 4 to 7 were considered.
Figure 5.
Number of hits obtained for each model in ScienceDirect and Web of Knowledge by 20 December 2016. Conditions for search: all journals and books available in ScienceDirect (SD) and available papers in Web of Knowledge (WoK); WASP model versions from 4 to 7 were considered.

Figure 6.
The ScoRE results for the evaluated models. Scope, Record and Experience values are calculated in Table 5. ScoRE was determined using Equation (2), with the following relative weights: WS = 50%, WR = 25% and WE = 25%.
Figure 6.
The ScoRE results for the evaluated models. Scope, Record and Experience values are calculated in Table 5. ScoRE was determined using Equation (2), with the following relative weights: WS = 50%, WR = 25% and WE = 25%.


Table 1.
ScoRE compared to other approaches.
| Approaches | Criteria Definition | Who Conducts the Valuation of Models in Each Criterion | Aggregation Procedures |
|---|---|---|---|
| Saloranta et al. [18] | Predefined questions to guide criteria definition | End-users | Eliminatory criteria |
| Boorman et al. [19] | Predefined questions to guide criteria definition | Modelers | Eliminatory criteria |
| Grimsrud et al. [20] | Predefined | End-users with possibility of hiring modelers | Eliminatory criteria and detailed guidance for how to proceed for the non-eliminated models (weighting process) |
| Chinyama et al. [21] | Predefined questions to guide criteria definition | End-users | Eliminatory criteria |
| Tuo et al. [22] | Predefined | End-users | Eliminatory criteria. Some insights into how to proceed for non-excluded models |
| ScoRE | No pre-definitions. Criteria defined between modelers and end-users | Modelers. Results discussed with end-users | Eliminatory criteria. Detailed guidance for how to proceed for the non-eliminated models (weighting process) |
Table 2.
Models evaluated.
| Model | Origin and model website |
|---|---|
| CE-QUAL-W2 | US Army Corps of Engineers/Portland State University, Portland, USA http://www.ce.pdx.edu/w2/ |
| MIKE HYDRO River | Danish Hydraulic Institute, Hørsholm, Denmark http://www.mikepoweredbydhi.com/products/mike-hydro-river |
| MOHID Water | Instituto Superior Técnico, Lisbon, Portugal http://www.mohid.com |
| QUAL2KW | Washington State Department of Ecology, Olympia, WA, USA http://www.ecy.wa.gov/programs/eap/models.html |
| SIMCAT | Environment Agency, Rotherham, UK |
| SisBaHIA | Fundação COPPETEC - COPPE/UFRJ, Rio de Janeiro, Brazil http://www.sisbahia.coppe.ufrj.br/ |
| TOMCAT | Environment Agency, Rotherham , UK |
| WASP7 | The United States Environmental Protection Agency, Washington, DC, USA http://www.epa.gov/athens/wwqtsc/html/wasp.html |
Table 3.
Summary of the main characteristics of the selected water quality models (adapted from [7,61]).
| Features | CE-QUAL-W2 | MIKE HYDRO River | MOHID Water | QUAL2KW | SIMCAT | SisBaHIA | TOMCAT | WASP7 |
|---|---|---|---|---|---|---|---|---|
| Dimensions/Types | 2D, dynamic | 1D, dynamic | 3D, dynamic | 1D, steady-flow | 1D, steady-state (time-invariant), stochastic | 3D, dynamic | 1D, steady-state (time-invariant) | 3D, dynamic |
| Modeling approach | ADE, unequal river reaches, river branches | ADE, unequal river reaches, | Regular grid, finite elements | ADE, unequal river reaches, | CSTR | Non-structured grid, finite differences | CSTR | ADE, dynamic compartmental |
| Element cycles | O, C, N, P, Si, Fe | O, N, P | O, N, P | O, C, N, P | O, N | O, N, P | O, N | O, N, P, Si |
| Constituents/processes | Temperature, pH, N (ON, NO2, NO3, NH3), P (OP, PO4), DO, CBOD, TIC, alkalinity, phytoplankton (4 groups), bottom-algae, SOD, detritus | User defined (ECO Lab module) | Temperature, N (ON, NO2, NO3, NH3), P (OP, PO4), DO, phytoplankton, detritus | Temperature, pH, N (ON, NO2, NO3, NH3), P (OP, PO4), DO, CBOD, TIC, alkalinity, phytoplankton, bottom-algae, SOD, detritus | DO, CBOD, ammonia, user defined conservative parameter | Temperature, pH, N (ON, NO2, NO3, NH3), P (OP, PO4), DO, phytoplankton, detritus | DO, CBOD, ammonia, chloride, user defined parameter | Temperature, pH, N (ON, NO2, NO3, NH3), P (OP, PO4), DO, CBOD, TIC, alkalinity, salinity, phytoplankton, bottom-algae, SOD, detritus, OCHEM |
| Open | Yes | No | Yes | Yes | - | No | - | Yes |
| Strength | Optimized for reservoir modeling; detailed parameterization of sediment diagenesis | Extensive support material | Full hydrodynamic simulation | Auto-calibration | Simulations requiring low computational time with limited data, auto-calibration | Grid adaptation to complex domain geometries | Simulations requiring low computational time with limited data, auto-calibration | Organic and heavy metal pollution |
| Weakness | Requires extensive data | Requires extensive data | Computational demand | Does not simulates branches | Over-simplistic | Limited number of users | Over-simplistic | Requires extensive data |
Note: ADE: advection dispersion equation, CSTR: continually stirred tank reactor in series, DO: dissolved oxygen, CBOD: carbonaceous biochemical oxygen demand, OCHEM: organic chemicals, ON: organic nitrogen, OP: organic phosphorus, SOD: sediment oxygen demand, TIC: total inorganic carbon.
Table 4.
Set of criteria defined for each cluster used in the evaluation of the models. Criteria defined by the technical team (T) and/or the end-users (E).
Table 4.
Set of criteria defined for each cluster used in the evaluation of the models. Criteria defined by the technical team (T) and/or the end-users (E).
| Clusters | Criteria |
|---|---|
| Scope | S1: model outputs for chlorophyll (besides biomass) for a direct validation with field data T,E S2: explicit simulation of different functional groups of primary producers, including cyanobacteria T,E S3: inclusion of iron, given its role in the quality of water for human consumption E S4: simulation of pH, for its relevance on fresh water chemical reactions T,E S5: O, N and P cycles T S6: carbon dynamics T S7: sediment-water fluxes, with detailed parameterization of processes occurring in the sediment T,E S8: adequate spatial description and hydrodynamics processes to simulate thermal stratification and related water movement T S9: modelling approach T |
| Record | R1: number of publications T R2: model dissemination (local vs. global applications) T,E R3: type of water systems (higher to lower score: reservoirs, rivers, estuaries/coastal lagoons) T |
| Experience | E1: quality of the Graphical User Interface E E2: availability and quality of support manuals E E3: examples of running applications T,E E4: user forums E E5: technical support by the developing team E E6: costs E |
Table 5.
ScoRE impact matrix. The scale represents the number of models under evaluation and, consequently, ranges from 1 (inferior) to 5 (better). Overall results for Scope, Record, and Experience are calculated according to Equation (1).
Table 5.
ScoRE impact matrix. The scale represents the number of models under evaluation and, consequently, ranges from 1 (inferior) to 5 (better). Overall results for Scope, Record, and Experience are calculated according to Equation (1).
| Criteria/Item | CE-QUAL-W2 | MOHIDw | QUAL2Kw | SisBaHIA | WASP |
|---|---|---|---|---|---|
| S1: chlorophyll | 5 | 3 | 3 | 3 | 4 |
| S2: cyanobacteria | 5 | 3 | 3 | 3 | 4 |
| S3: iron | 5 | 4 | 4 | 4 | 4 |
| S4: pH | 5 | 3 | 3 | 4 | 3 |
| S5: O, N and P cycles | 5 | 3 | 4 | 3 | 4 |
| S6: carbon dynamics | 5 | 3 | 4 | 3 | 3 |
| S7: sediment-water fluxes | 5 | 3 | 1 | 2 | 4 |
| S8: hydrodynamic processes | 4 | 5 | 2 | 5 | 3 |
| Scope | 4.9 | 3.4 | 3.0 | 3.4 | 3.6 |
| R1: publications | 5 | 4 | 2 | 1 | 3 |
| R2: model dissemination | 5 | 3 | 2 | 1 | 4 |
| R3: type of water systems | 5 | 2 | 3 | 2 | 4 |
| Record | 5.0 | 3.0 | 2.3 | 1.3 | 3.7 |
| E1: GUI | 4 | 1 | 2 | 5 | 3 |
| E2: support manuals | 5 | 2 | 4 | 3 | 5 |
| E3: examples | 5 | 4 | 5 | 4 | 5 |
| E4: user forums | 5 | 4 | 3 | 1 | 2 |
| E5: technical support | 4 | 2 | 1 | 5 | 3 |
| Experience | 4.6 | 2.6 | 3.0 | 3.6 | 3.6 |
Table 6.
Number of criteria identified in ScoRE and in other approaches (approximate numbers).
| Number of Criteria Related with | Saloranta et al. [18] | Boorman et al. [19] | Grimsrud et al. [20] | Chinyama et al. [21] | Tuo et al. [22] | ScoRE |
|---|---|---|---|---|---|---|
| Scope | 5 | 8 | 13 | 5+(a) | 3 | 9 |
| Record | 1 | 1 | 0 | 0 | 0 | 3 |
| Experience | 8 | 3 | 11 | 4 | 1 | 6 |
| Total | 14 | 12 | 24 | 9+ | 4 | 18 |
(a) the guiding questions proposed can give origin to more than five criteria.
© 2018 by the authors. Licensee MDPI, Basel, Switzerland. This article is an open access article distributed under the terms and conditions of the Creative Commons Attribution (CC BY) license (http://creativecommons.org/licenses/by/4.0/).
Share and Cite
MDPI and ACS Style
Mateus, M.; Vieira, R.d.S.; Almeida, C.; Silva, M.; Reis, F. ScoRE—A Simple Approach to Select a Water Quality Model. Water 2018, 10, 1811. https://doi.org/10.3390/w10121811
AMA Style
Mateus M, Vieira RdS, Almeida C, Silva M, Reis F. ScoRE—A Simple Approach to Select a Water Quality Model. Water. 2018; 10(12):1811. https://doi.org/10.3390/w10121811
Chicago/Turabian StyleMateus, Marcos, Ricardo da Silva Vieira, Carina Almeida, Miguel Silva, and Filipa Reis. 2018. "ScoRE—A Simple Approach to Select a Water Quality Model" Water 10, no. 12: 1811. https://doi.org/10.3390/w10121811
Note that from the first issue of 2016, this journal uses article numbers instead of page numbers. See further details here.