Water Quality Monitoring in Northern India for an Evaluation of the Efficiency of Bank Filtration Sites


1
Institute for Water Chemistry, TU Dresden, 01062 Dresden, Germany
2
Division of Water Sciences, University of Applied Sciences Dresden, 01069 Dresden, Germany
*
Author to whom correspondence should be addressed.
Water 2018, 10(12), 1804; https://doi.org/10.3390/w10121804
Submission received: 30 October 2018
/
Revised: 5 December 2018
/
Accepted: 6 December 2018
/
Published: 8 December 2018
(This article belongs to the Special Issue Efficiency of Bank Filtration and Post-Treatment)
Abstract
:The study presents results of five sampling campaigns at riverbank filtration sites at the Yamuna and Ganges Rivers in Uttarakhand, Uttar Pradesh and New Delhi 2015–2018. Samples were analyzed for organic micropollutants and general water quality parameters. In New Delhi and Uttar Pradesh, 17 micropollutants were detected frequently at relevant concentrations. Out of the detected micropollutants, 1H-benzotriazole, caffeine, cotinine, diclofenac, diuron, gabapentin and paracetamol were frequently detected with concentrations exceeding 1000 ng/L. Sites in Uttarakhand showed only infrequent occurrence of organic micropollutants. The mean concentration of micropollutants in the well water was lower compared to the river water. For all sites, removal rates for all micropollutants were calculated from the obtained data. Thereby, the capacity of riverbank filtration for the removal of organic micropollutants is highlighted, even for extremely polluted rivers such as the Yamuna.
1. Introduction
The appearance of organic micropollutants (OMPs) in surface water bodies on a global scale is an unwelcome reality [1,2]. Micropollutants may find their way into water bodies either from point or diffuse sources [3,4]. Conventional wastewater treatment plants are unable to remove all micropollutants and discharge contaminated effluents directly into surface water bodies [1]. This discharge of contaminated effluents is called a point source. Diffuse sources like agriculture are even more difficult to control and pose a further risk for the water quality. Due to this issue, it is of major interest for water companies to know about the water quality of the source water to produce safe drinking water without risks for human health. The number of known trace compounds in the environment is ever-increasing due to further development of more sensitive analytical and sample preparation methods. With these modern methods it is also possible to measure so called emerging micropollutants. This group includes polar and persistent or pseudo-persistent (degradable, but always occurring due to continuous input) compounds, such as pharmaceutical, personal care and industrial compounds as well as pesticides and their transformations products [5,6]. All these compounds pose a potential risk for human health, if present in drinking water. So far, there are no limits or threshold concentrations defined for many emerging pollutants in water quality guidelines. Therefore, a comprehensive water quality monitoring is necessary to determine potential problems and risks concerning drinking water quality and to adapt the water treatment technology.
The available data regarding the occurrence of emerging pollutants in northern India are insufficient. The presence of emerging pollutants in source water at riverbank filtration (RBF) sites in northern India and their removal by RBF has only been investigated for an extremely polluted stretch of the Yamuna River in central Delhi [7] and their removal by RBF has only been monitored sporadically for some sites. Apart from several studies on general water quality parameters and heavy metals [8,9,10,11], only a few studies have shown the occurrence of OMPs. In this context, monitoring data for organochlorine pesticides have mainly been published [12,13,14,15,16,17,18]. Studies on other micropollutants like pharmaceuticals were carried out rarely [19]. The existing drinking water treatment technologies are not sufficient to remove all micropollutants from source water [15,20,21]. Consequently, and in light of the imminent risk from OMPs, the selection of source water has to be done very carefully, especially if surface water is directly abstracted for drinking water production. In case of polluted river water, RBF provides a pre-treatment for the removal of, among others, OMPs [10,22]. The removal rate depends on compound-specific properties (biodegradability and adsorption behavior) as well as on water quality, geochemical composition of aquifer material and hydraulic boundary conditions [23].
The aim of the presented study is to expand the knowledge of organic and inorganic water quality at RBF sites over four years in the upper part of the Ganges and Yamuna Rivers. This includes the occurrence and removal of organic micropollutants as well as general inorganic water quality parameters. Furthermore, the efficiency of RBF at these sites to remove OMPs is characterized for the first time (other than Delhi [7]). For this purpose, different general parameter (e.g., main anions and cations, DOC) and selected typical anthropogenic organic micropollutants were analyzed.
2. Materials and Methods
2.1. Study Sites
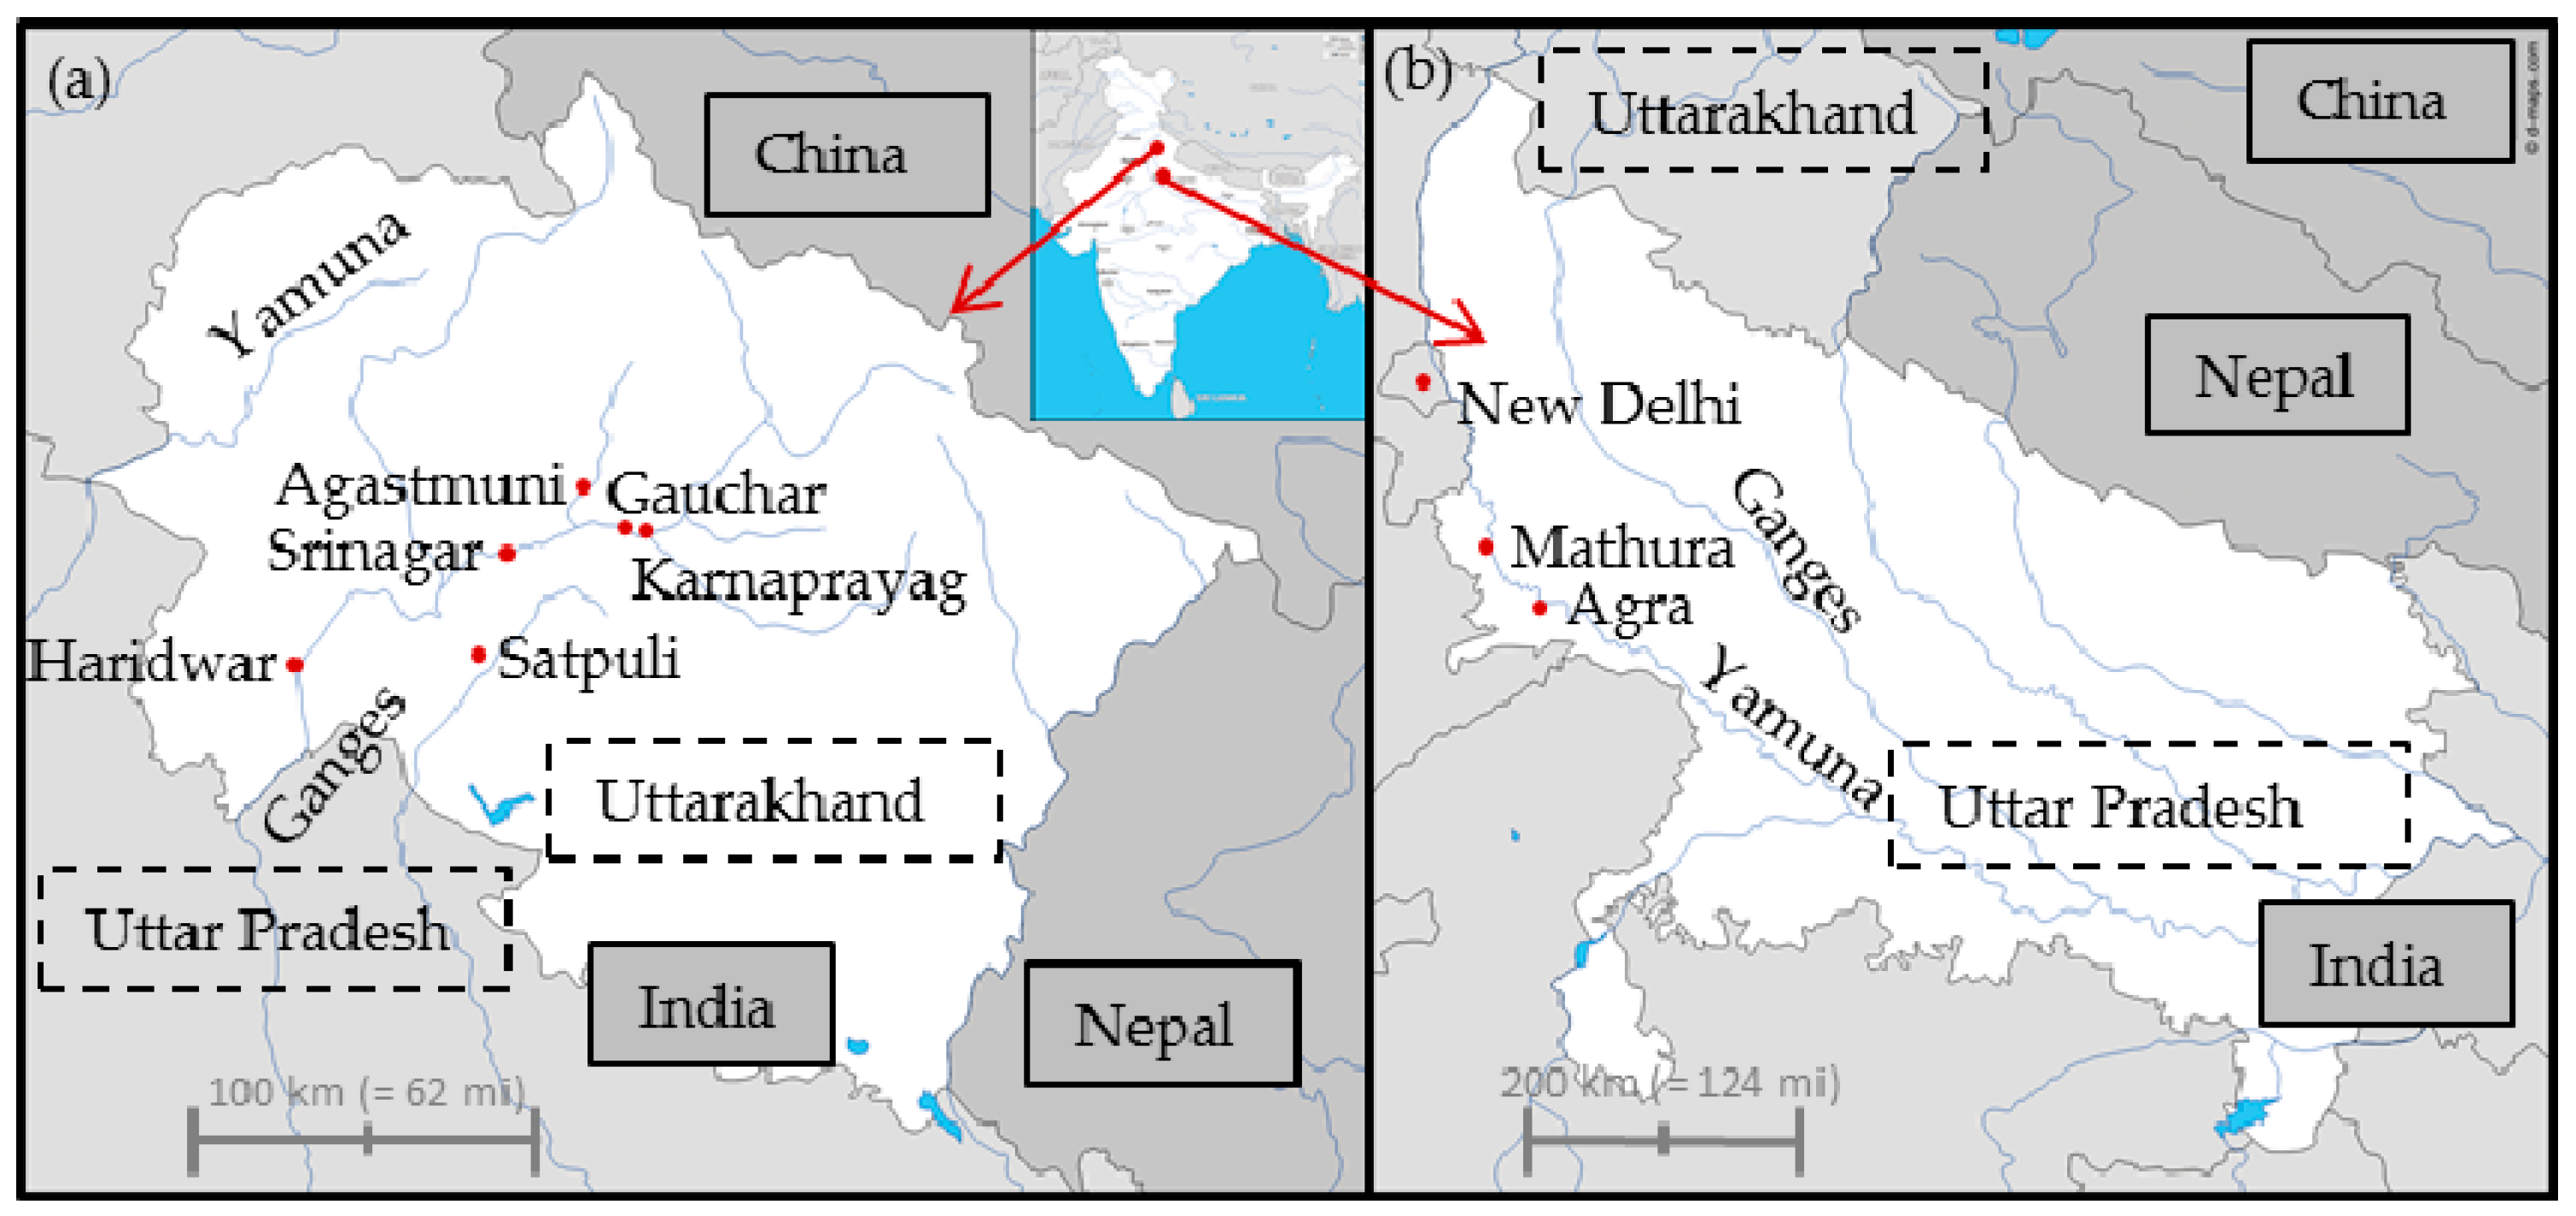
The monitoring was done at nine selected sites in Uttarakhand, Uttar Pradesh and in New Delhi, India (Figure 1, Table 1). At every site one surface water sample and one well water sample was taken. The sites are located along the rivers Yamuna, Ganges and their tributaries. Depending on the distance from the riverbank, the production rate and duration of operation (h/day), the wells abstract a low (Agastmuni) to high (Haridwar) portion of bank filtrate. Due to the lower density of population and industry in Uttarakhand, the six sites there (Haridwar, Srinagar, Agastmuni, Gauchar, Karnaprayag and Satpuli) should show a lower level of contamination compared to the three sites in New Delhi, Mathura and Agra. Overall five sampling campaigns were conducted in September 2015, May and September 2016, September 2017 and June 2018. The wells in Agra and Mathura were constructed in 2017. Because of the relatively low number of repeated measurements the obtained results are giving a first general overview of the water quality in this region but give little information about the interim periods between the sampling campaigns. Furthermore, in this part of India the monsoon can have an influence on the concentration of water constituents due to dilution effects. The obtained data do not allow deeper statements regarding this topic.
2.2. Analytical Methods
Sampling was done wearing gloves to prevent any contamination of the sample with trace compounds for example from hand cream. For the micropollutants samples, a glass vial was rinsed with the sampling water two times and emptied. A second glass vial was rinsed two times too and filled half. From the second vial a volume of 5 mL was taken and transferred to the first vial. 250 µL of an internal standard was added using a Hamilton syringe. The vial was closed and shaken. The spiked sample was taken with a one-way syringe and filtered through a 0.45 µm membrane filter (Chromafil® Xtra RC-20/25, Macherey-Nagel, Düren, Germany) and filled into a HPLC analysis vial after the first ml was wasted. Samples for main anions and cations were filtered as well (Chromafil® GF/PET-45/25, Macherey-Nagel, Düren, Germany). Samples for cations were preserved using nitric acid. All samples were cooled until analysis.
The analysis of 32 micropollutants (Table 2) was carried out with a LC-MS/MS (6500+ QTRAP®, Sciex, Framingham, MA, USA) using a Luna® Omega 1.6 µm Polar C18 column (Phenomenex, Torrance, CA, USA) and a H2O/ACN eluent (0.02% CH3COOH). The samples of the first two sampling campaigns were measured using a 3200 QTRAP® (Sciex, Framingham, MA, USA) after samples were enriched using SPE cartridges (SiliaPrepX HLB, SiliCycle Inc., Quebec City, QC, Canada). Acesulfame could not be enriched and was not measured here. Main anions (Table 3) were analyzed by IC (DX-100, Dionex/Thermo Fisher Scientific, Waltham, MA, USA) and cations (Table 3) by ICP-MS (4500, Agilent, Santa Clara, CA, USA). Dissolved organic carbon (DOC) was determined as non-purgeable organic carbon with a TOC-5000 (Shimadzu, Kyōto, Japan) according to the standard DIN EN 1484 H3 [28].
3. Results
3.1. Main Ions and DOC
As expected, water quality at the study sites varied widely because of the strong differences in demographic density and industrial settlements. The sites in Uttarakhand rarely showed a critical contamination from OMP (Appendix B, Table A3) whereas data for New Delhi, Mathura and Agra pointed out much higher contamination. This difference in water quality is confirmed by the DOC concentrations in Appendix Table A1 and Table A4 for all sites. DOC concentrations measured in river water samples from New Delhi, Mathura and Agra are six time higher than in river water samples from Uttarakhand. The DOC is the sum of all dissolved organic carbon in the water, including the organic carbon from the targeted OMP. It can be assumed, that input of waste water is connected with increased organic content as well as occurrence of higher concentrations of OMP [29]. Therefore, DOC can be used as an indicator for the organic pollution of water bodies. Nevertheless, the natural organic background always has to be considered. The monitoring of main anions and cations is largely unobtrusive and indicates a good water quality (Appendix A Table A1). Known issues like a high nitrate concentration in Srinagar (cmax = 78.9 mg/L, Appendix B Table A4) [9] and relatively high arsenic concentrations for example in New Delhi, Mathura and Agra (cmax = 0.01–0.10 mg/L) can be confirmed [30]. Furthermore, high concentrations of nitrite (cmax = 1.95–4.34 mg/L) and manganese (cmax = 0.07–2.25 mg/L) were detected at Mathura and Agra (Appendix A Table A1). These concentrations for nitrate, nitrite and manganese exceed the threshold concentrations given by the German and Indian Drinking Water Ordinance. The threshold concentrations are 45–50 mg/L, 0.01 mg/L and 0.05–0.1 mg/L, respectively.
3.2. Micropollutants
In the well sample from Haridwar in September 2017 unusual high concentrations of diclofenac (2000 ng/L) and gabapentin (4090 ng/L) were measured. At the same time a relatively high chloride concentration of 133 mg/L was measured. Normally, well water in Haridwar shows chloride concentrations around 12.5 mg/L. This would indicate a temporal infiltration of urban waste water into the well. Here, the consistently polluted sites are described and discussed in detail with a focus on removal rates during RBF. In New Delhi, Mathura and Agra, 17 micropollutants were detected nearly in every sample. Mean and maximum concentrations for each compound and site are shown in Appendix A Table A2.
3.3. Pharmaceuticals
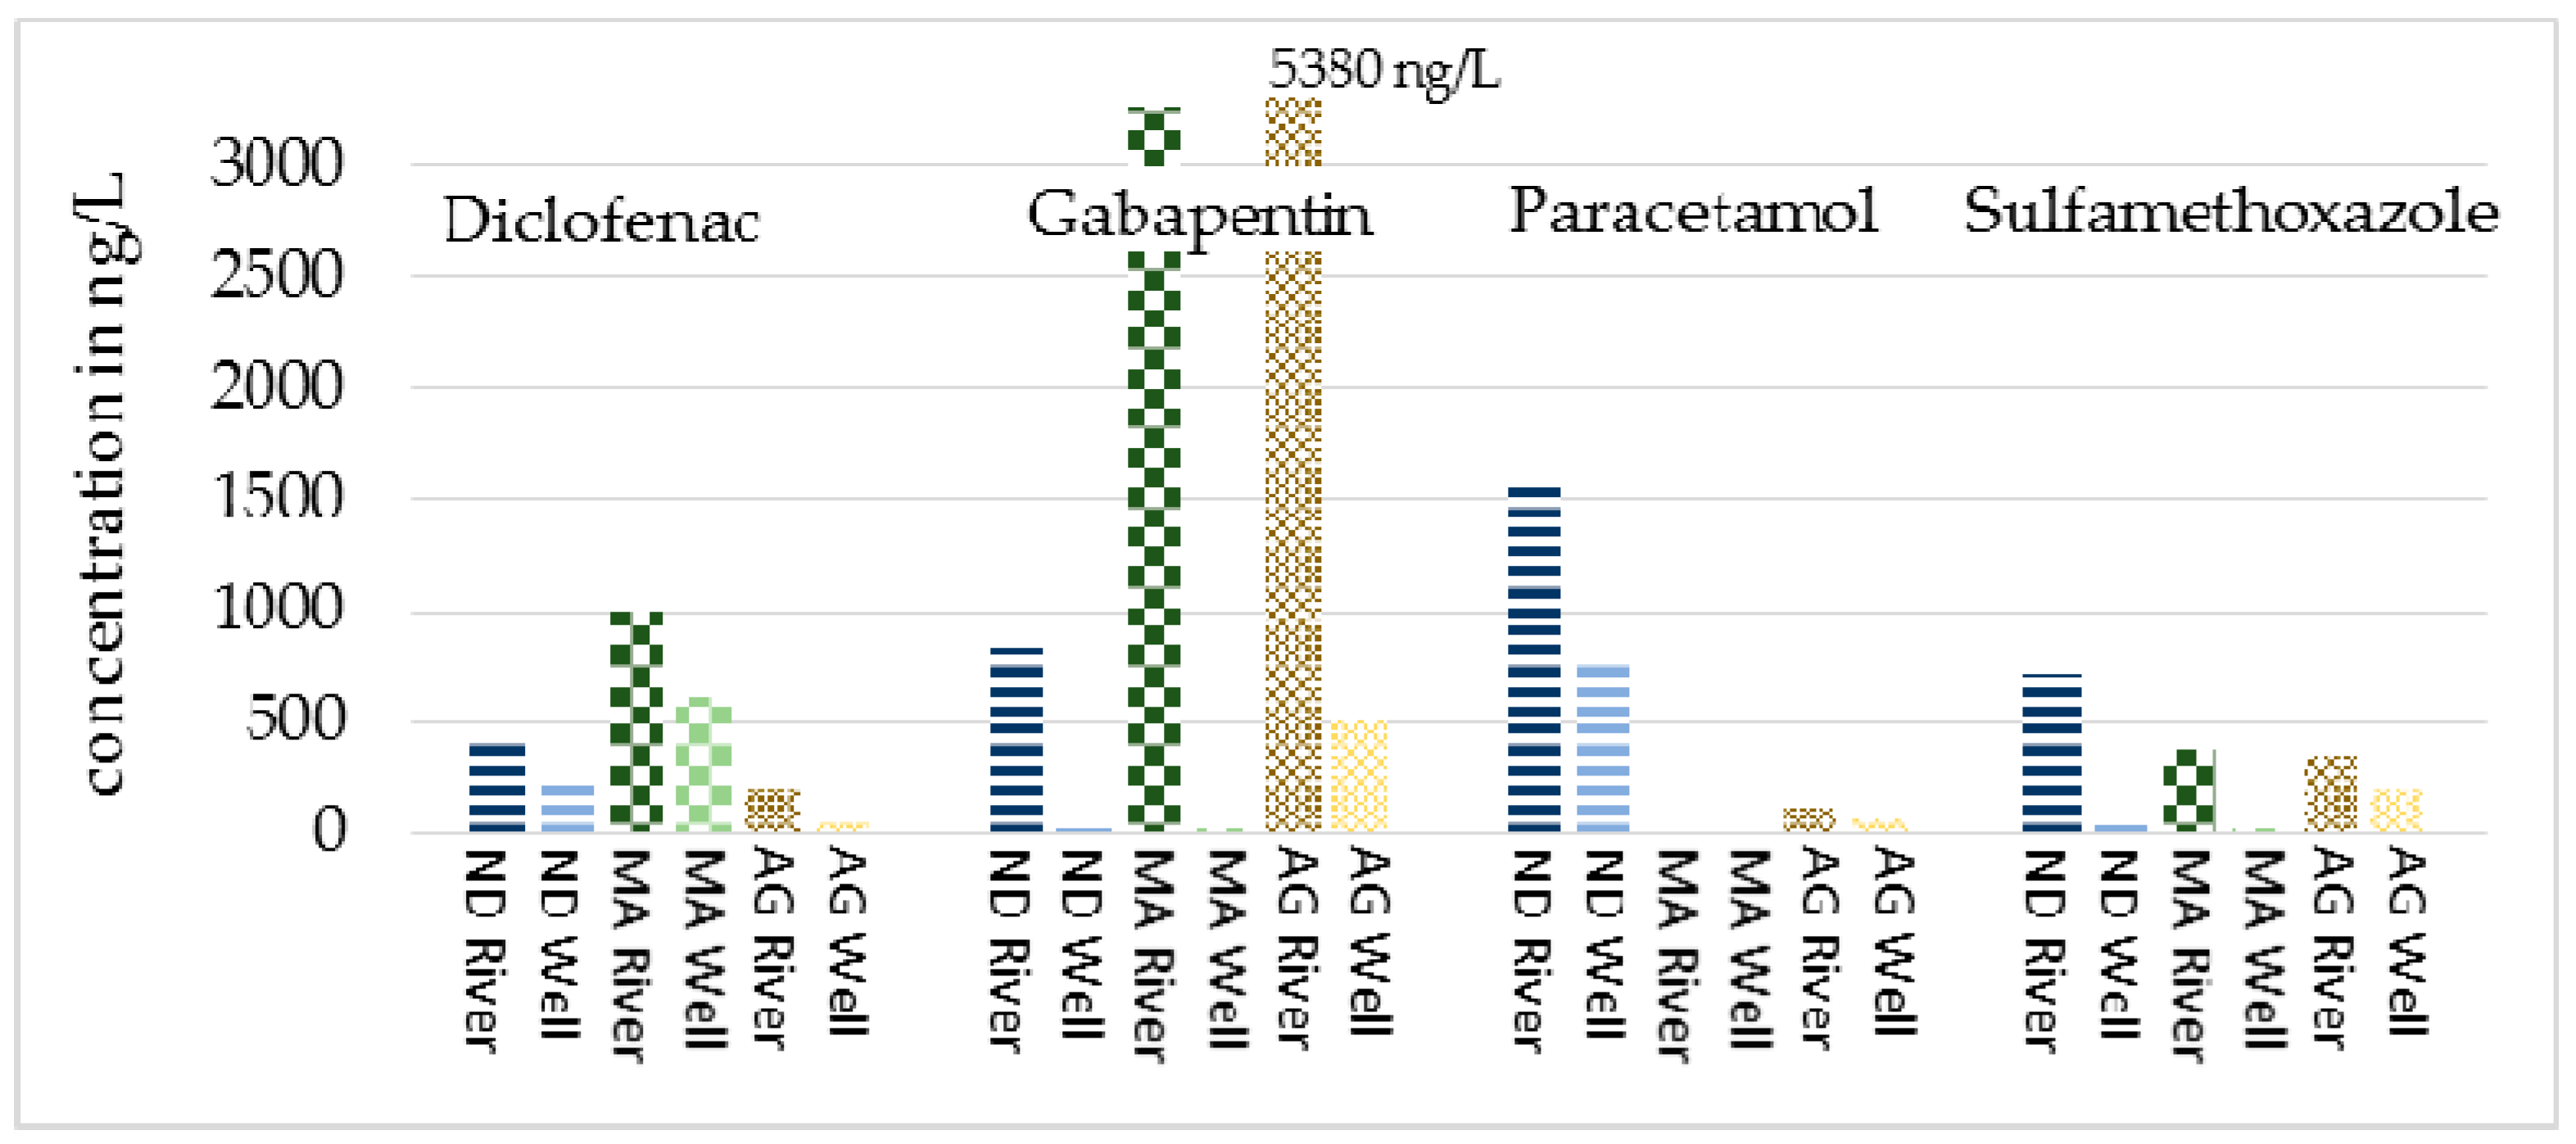
Out of 16 analyzed pharmaceuticals eight compounds were found to be regularly present in both river and well water at all three sites. Gabapentin was found with the highest mean concentrations from 832 to 5380 ng/L followed by paracetamol (114–1550 ng/L), sulfamethoxazole (733–1260 ng/L) and diclofenac (199–994 ng/L). Whereby, paracetamol was never detected in samples from Mathura (Figure 2). The mean concentration of gabapentin in river samples from Agra (5380 ng/L) exceeds the scale of the bar chart of Figure 2. Four additional pharmaceuticals were detected frequently but at lower concentrations (Figure 3). Naproxen, metoprolol, ibuprofen and carbamazepine showed mean concentrations of 102–423 ng/L, 171–395 ng/L, 9–333 ng/L and 96–112 ng/L, respectively. In all cases the concentration of the detected pharmaceuticals was substantially lower in the RBF well samples compared to the river samples. The well water showed a decreased mean concentration by 91–100% for gabapentin, 46–50% for paracetamol, 41–95% for sulfamethoxazole, 37–80% for diclofenac, 39–100% for naproxen, 78–100% for metoprolol, 19–74% for ibuprofen and 15–73% for carbamazepine.
3.4. Herbicides and Pesticides
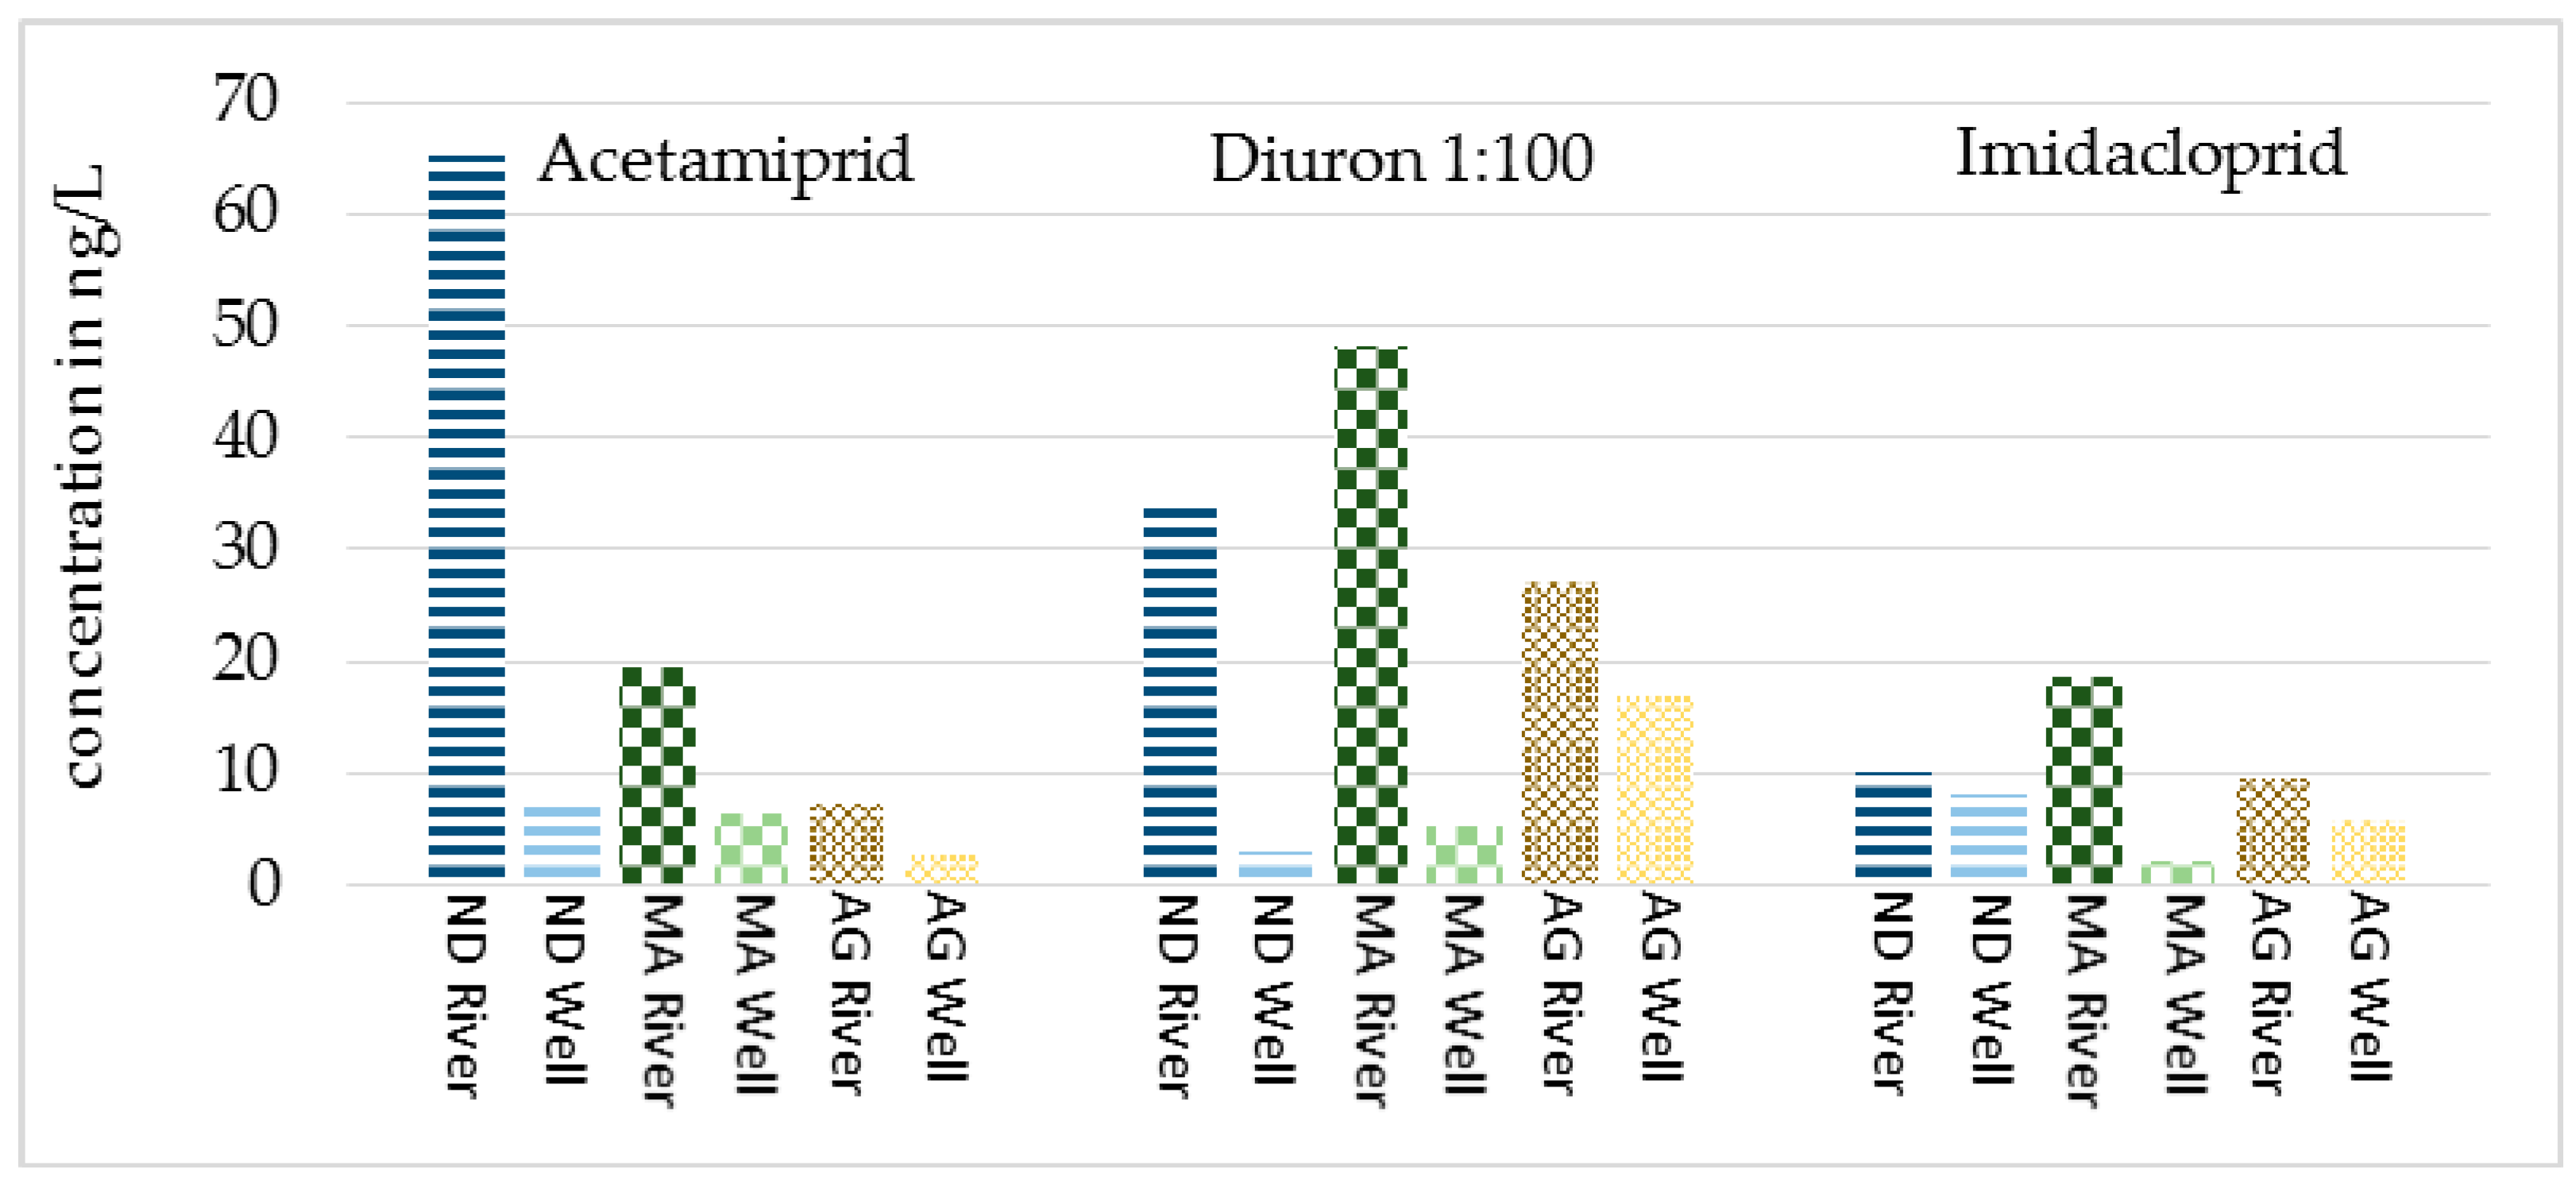
Out of nine analyzed herbicides and pesticides only acetamiprid, diuron and imidacloprid were detected frequently in river and well water. The highest concentrations by far were determined for diuron (Figure 4). In surface water, diuron reached mean concentrations from 2710 ng/L in Agra to >3450 ng/L in New Delhi and to 4810 ng/L in Mathura. Acetamiprid and imidacloprid were detected in river water with a 100 times lower concentration of 7–65 ng/L and 9–18 ng/L, respectively. RBF well water samples showed a decreased mean concentration by 37–91% for diuron, 64–88% for acetamiprid and 22–89% for imidacloprid. Pesticide concentrations at all sites in Uttarakhand were found to be much lower, except in Srinagar, where bank filtrate has a very long flow path and is affected by inputs from the urban area and agriculture [10].
3.5. Industrial Products
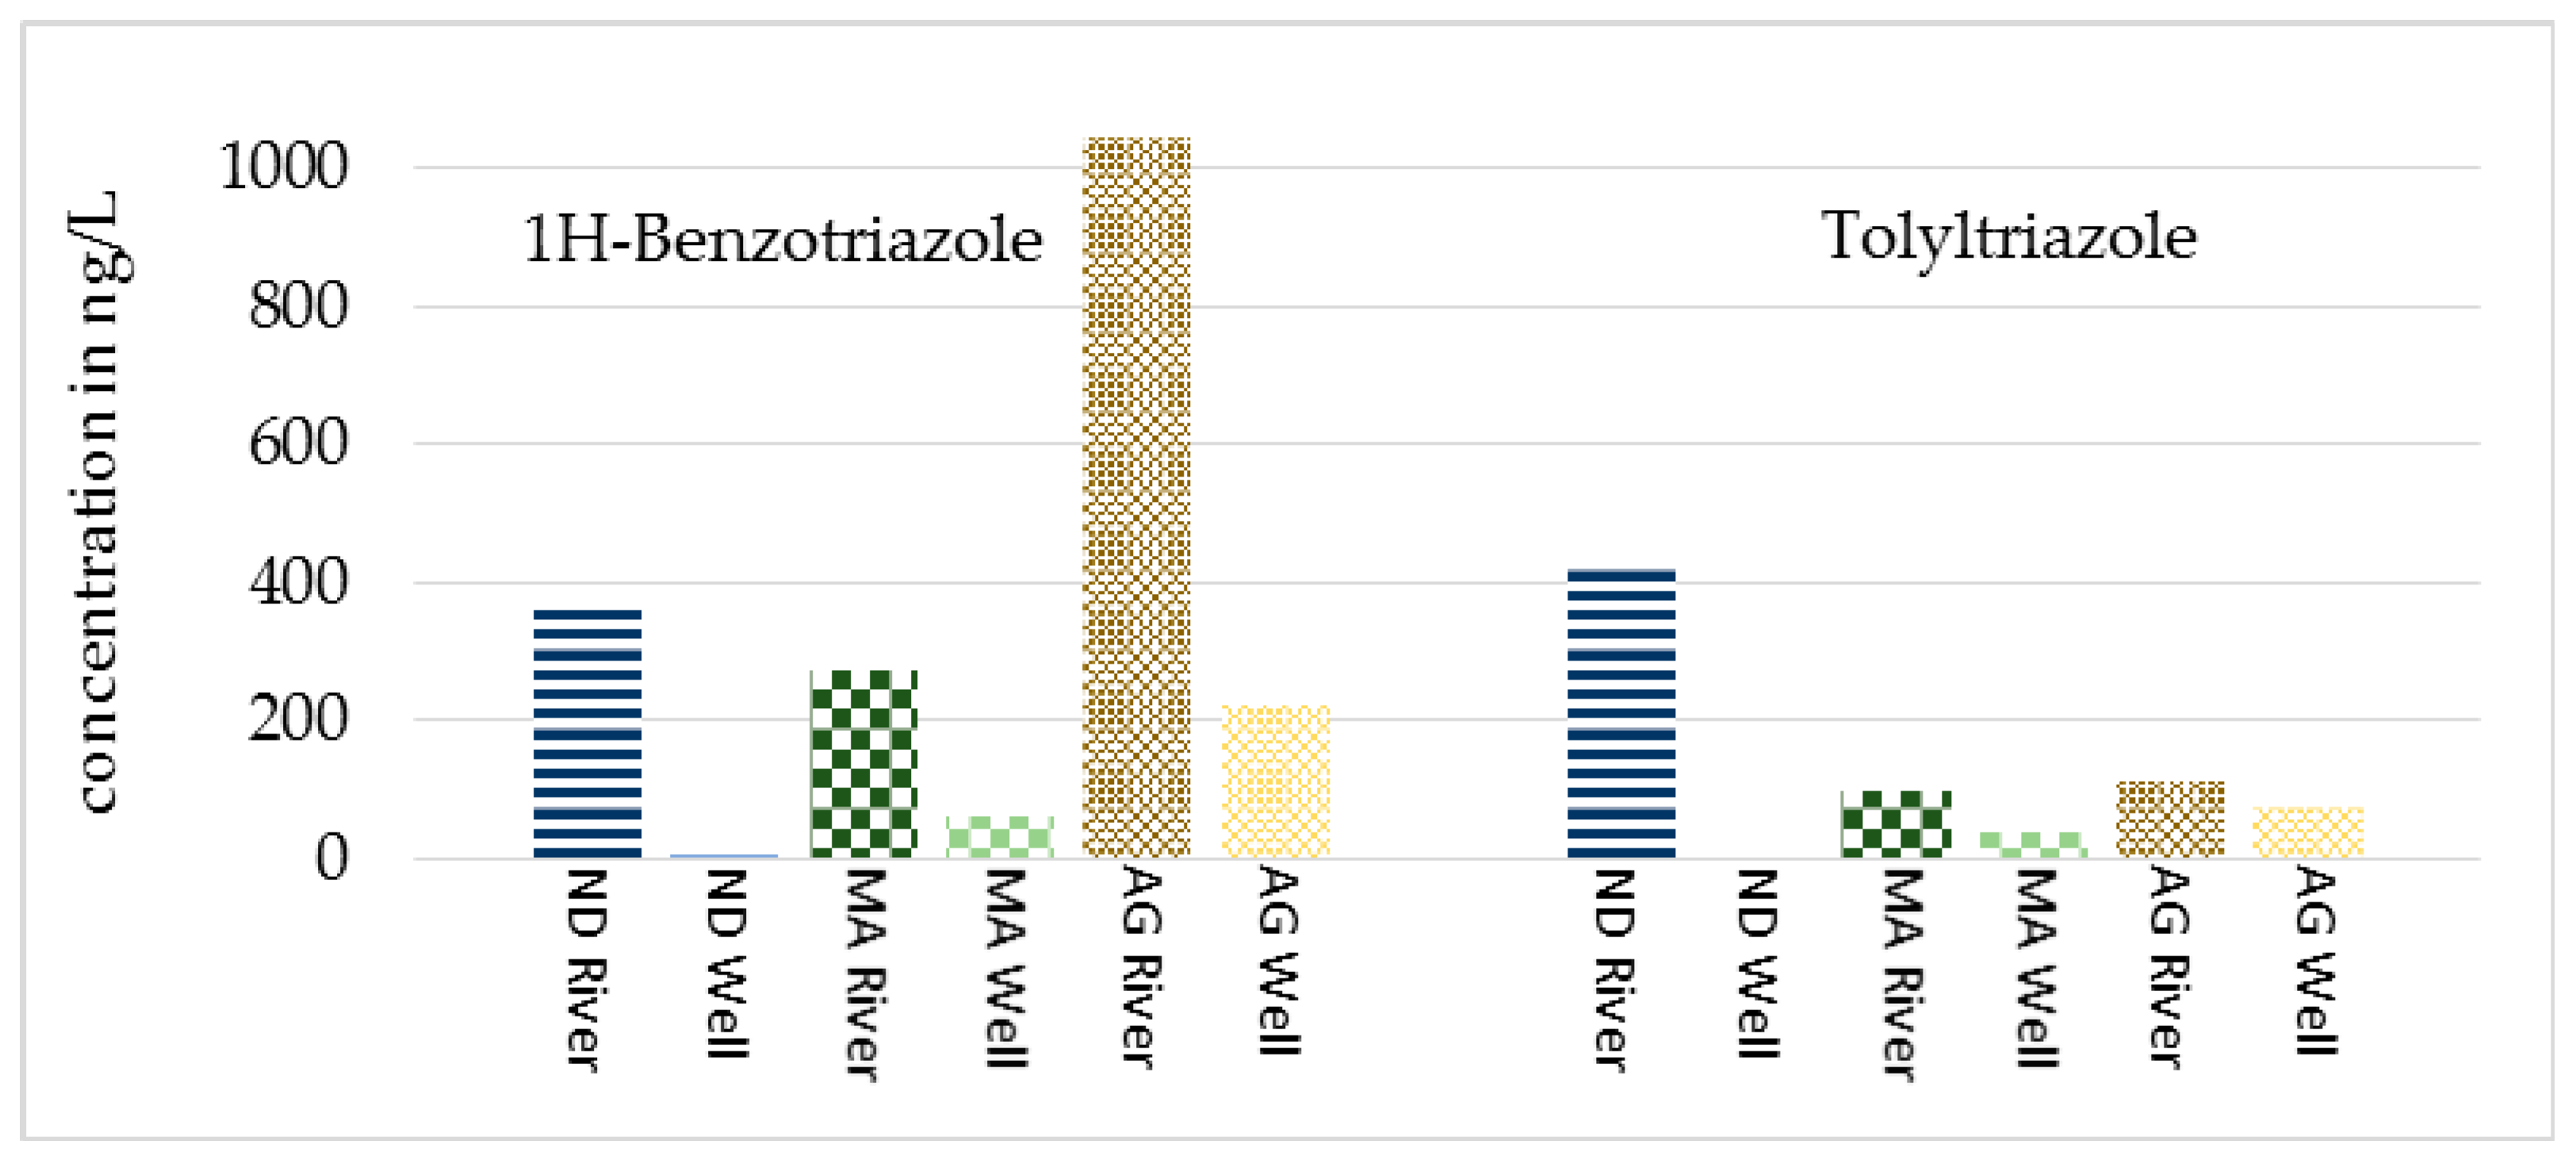
1H-benzotriazole and tolyltriazole were detected in all surface and well water samples from New Delhi, Mathura and Agra. Bisphenol A only was detected sporadically. 1H-benzotriazole showed higher mean concentrations than tolyltriazole (Figure 5). The mean concentrations of 1H-benzotriazole in river water were 271–1050 ng/L and of tolyltriazole 98–418 ng/L. The concentration levels in RBF well water were in all cases lower than in surface water. 1H-benzotriazole showed a decrease in concentration by 77–98% and tolyltriazole by 33–100%.
3.6. Other Micropollutants
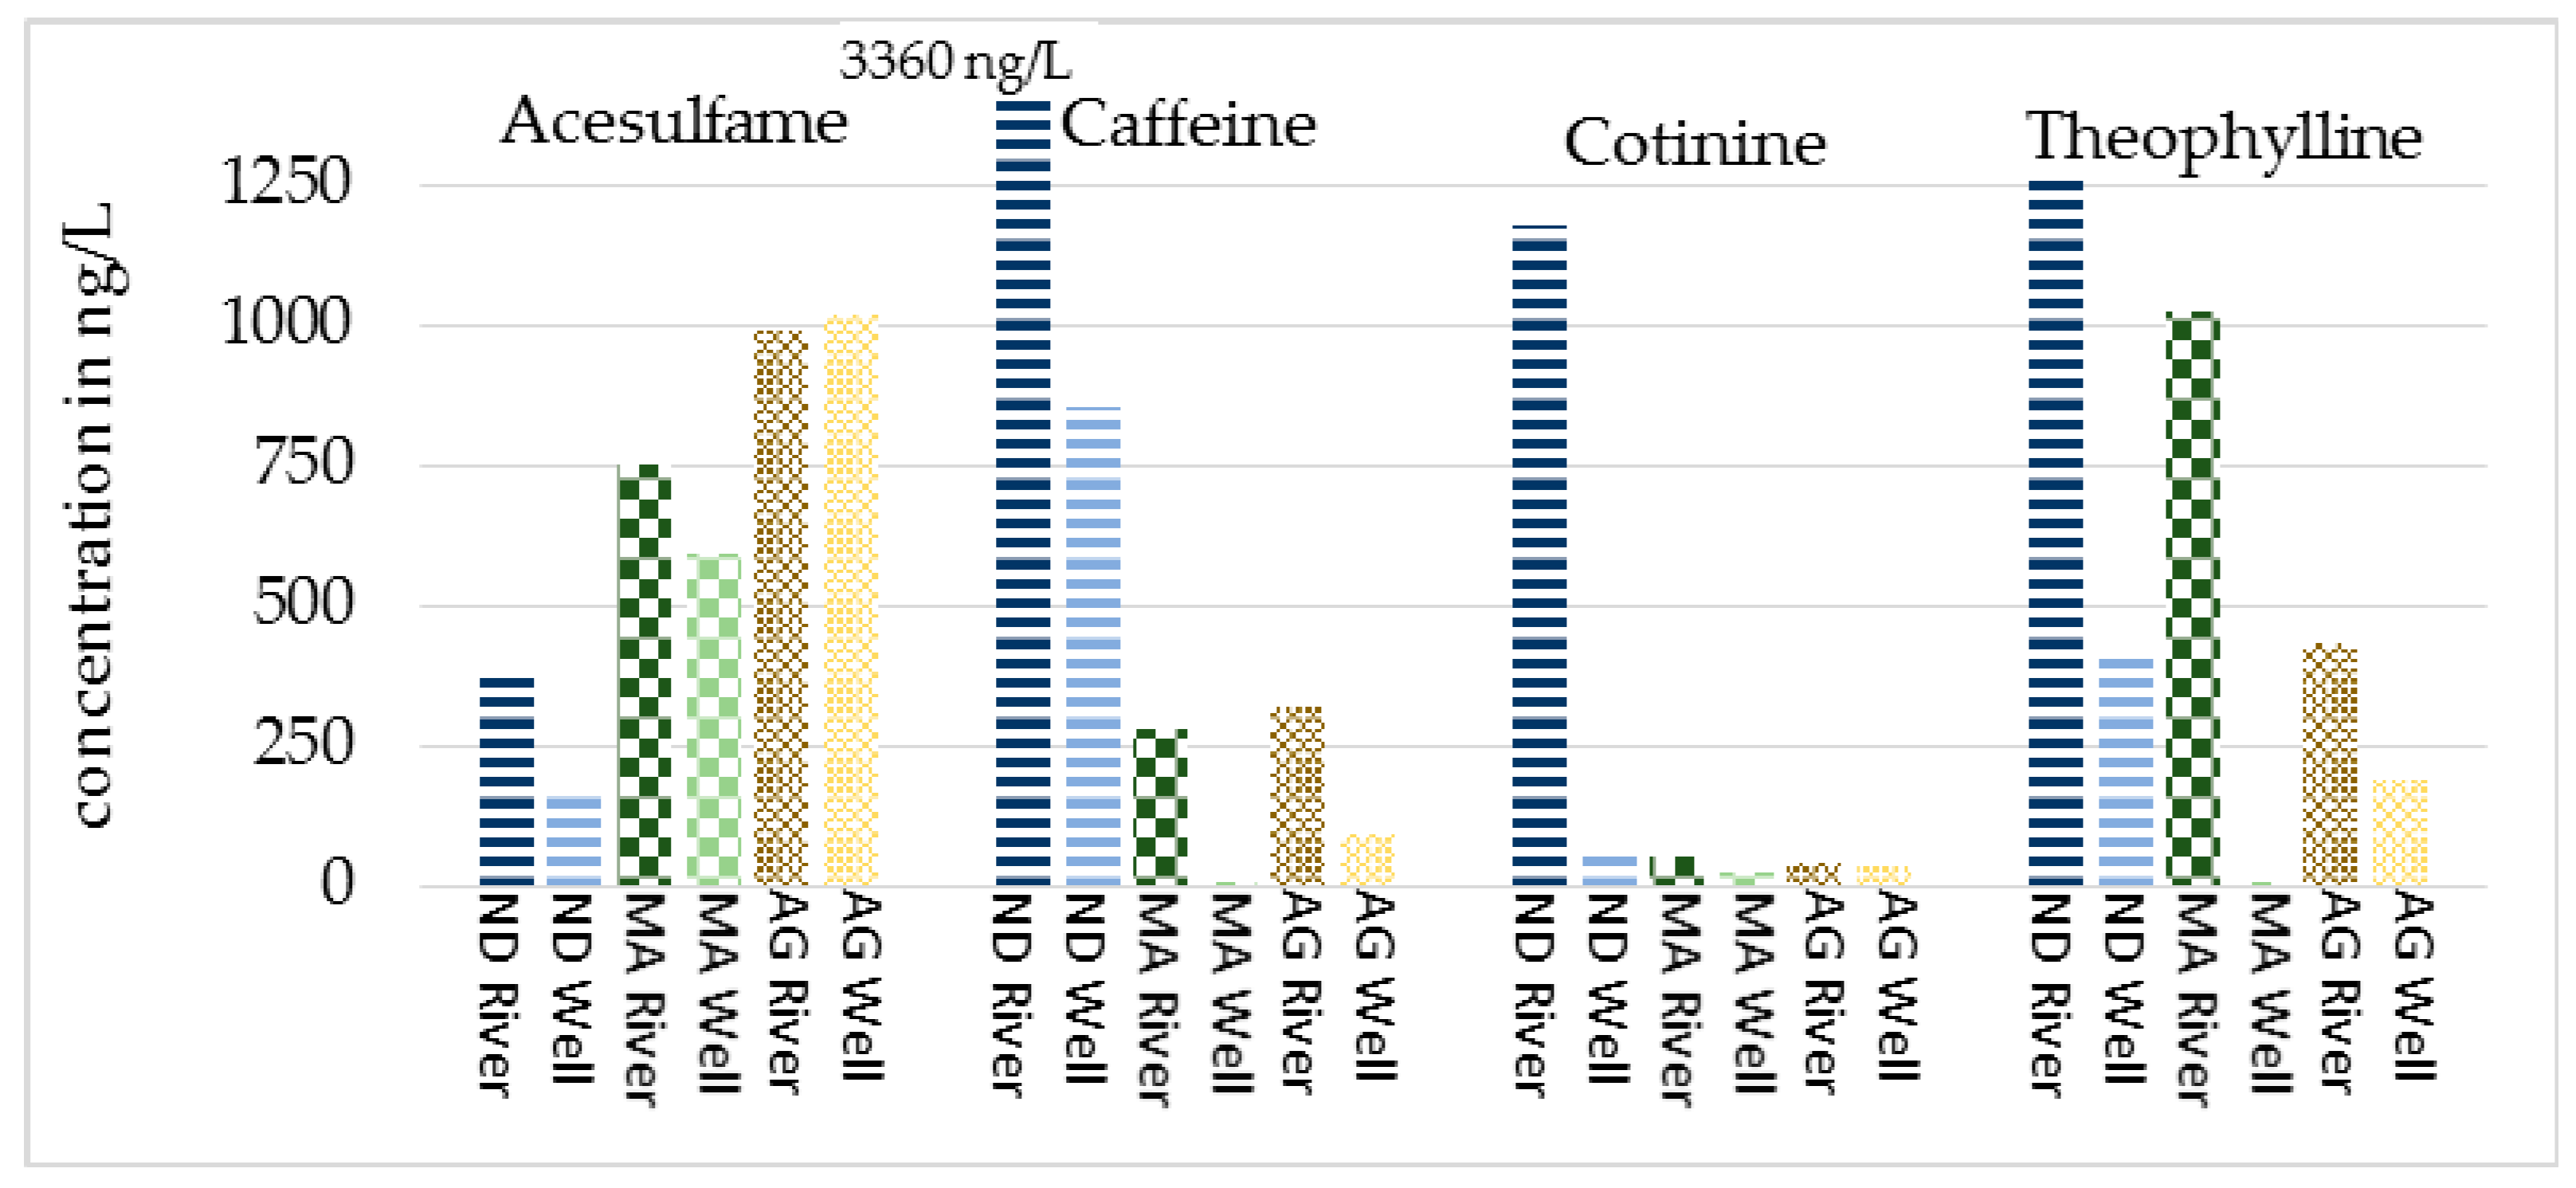
Acesulfame, caffeine, cotinine and theophylline were detected in all river water samples in New Delhi, Mathura and Agra with mean concentrations of 376–988 ng/L, 279–3360 ng/L, 38–1180 ng/L and 431–1350 ng/L, respectively (Figure 6). The mean concentration of caffeine in the river sample from New Delhi (3360 ng/L) exceeds the scale of the bar chart of Figure 6. The mean concentrations for the compounds caffeine, cotinine and theophylline decreased in the RBF well water samples by 71–99%, 5–95% and 56–99%, respectively. The mean concentrations of the artificial sweetener acesulfame in samples of RBF wells are in the same or lower range in comparison to the river water samples in Agra, New Delhi and Mathura (Figure 6). The findings from Mathura, with a short travel time and >75% bank filtrate, underline the very low removal of acesulfame.
4. Discussion
4.1. Acesulfame
Acesulfame is persistent and shows low degradation during wastewater treatment [29,31]. Therefore, acesulfame is found in waters influenced by anthropogenic activities and became a favorable indicator for domestic wastewater. It can be used to estimate the portion of bank filtrate in the wells at RBF sites, assuming no occurrence of acesulfame in the groundwater [32]. Mean concentrations of acesulfame in the Yamuna River and RBF wells at the three sites would indicate a mean portion of bank filtrate of 46% in New Delhi, 79% in Mathura and around 100% in Agra. Apparently, the calculated removal rates in Mathura and Agra are influenced not only by adsorption and biodegradation in the aquifer but also by dilution of the bank filtrate with land-side groundwater.
4.2. Pharmaceuticals
Most of the regarded pharmaceuticals possess a wide variety of functional groups and are therefore medium to highly polar and very mobile in water. Adsorption on suspended particles and sediment is limited. Furthermore, many pharmaceuticals are resistant to degradation in the human body as well as in wastewater treatment plants to a great extent [3,5]. Consequently, 50% of the targeted pharmaceuticals were found in river water and bank filtrate at a high frequency. Only two of them, azithromycin and roxithromycin, could not be detected at all at the sampling points in northern India.
The calculated mean removal rate for pharmaceuticals in New Delhi and Mathura is nearly 80% and significantly higher than in Agra (51%) comparing only river water and RBF well water. One reason for this will be the different portion of bank filtrate in the well water. Based on data for acesulfame and supported by data for chloride and other ions (Appendix A Table A1), the portion of bank filtrate is near to 100% in Agra, thus there is no effect of mixing with less polluted groundwater. Higher removal rates can be expected also for sites with longer flow paths and travel times.
Diclofenac showed with around 39% the lowest removal rate in New Delhi and Mathura. In Agra, a significantly higher removal rate of 80% was observed. This shows that apart from flow path length and travel time of bank filtrate, other parameters can have an influence of the removal of micropollutants as well. Additionally, the attenuation of organic micropollutants depends on redox conditions during RBF. For example, diclofenac shows significantly higher removal rates during aerobic and denitrifying conditions [33] whereas carbamazepine is better removed under anaerobic conditions [32]. Carbamazepine shows removal rates in New Delhi and Mathura of 73% and 46%, in Agra only 15%. Thus, removal rates for diclofenac and carbamazepine indicate anaerobic conditions during RBF in New Delhi and Mathura and aerobic/denitrifying conditions in Agra. Strong differences in occurrence of paracetamol in river and well samples at the sites New Delhi and Mathura were observed. Analyzed concentrations of this analgesic in New Delhi were frequently in µg/L-range. In contrast, this compound was never determined in samples from Mathura (detection limit: 2 ng/L). Paracetamol shows a relatively good biodegradability particularly at aerobic conditions. Possibly due to longer residence times and the availability of sufficient oxygen in Mathura, a complete degradation already in the river can occur. In Delhi, other boundary conditions may limit degradation processes and/or higher input from industry is possible.
The concentrations of X-ray contrast media (e.g., iomeprol) was found to be low in comparison to many European rivers [34]. This may be associated with the different level of medical care or with the use of other contrast agents in India.
4.3. Herbicides and Pesticides
Out of all analyzed herbicides and pesticides, only three compounds were detected frequently. Two of them, acetamiprid and imidacloprid, were found with very low concentrations. But diuron was detected with a maximum concentration of >10,000 ng/L in the Yamuna River at New Delhi. Even with a high removal rate of 91% in New Delhi, 89% in Mathura and 37% in Agra, mean concentrations between 299 and 1700 ng/L were determined in the RBF well water samples. Applications in sugar cane production (common in the region) are assumed to be the major source of diuron. If river water having such high concentration has to be used as raw water for drinking water production, an extensive post-treatment is needed, since diuron is potentially carcinogenic [35]. The German Drinking Water Ordinance gives threshold concentrations for a single herbicide or pesticide of 100 ng/L and for the sum of all compounds out of this group of 500 ng/L. The diuron concentrations are exceeding this threshold concentration in river and well water.
4.4. Industrial Products
Especially in New Delhi, the occurrence of 1H-benzotriazole and tolyltriazole in the river water should not be a problem for the drinking water production if RBF is used. As a result of a removal rate for 1H-benzotriazole of 100% and for tolyltriazole of 98% the bank filtrate is nearly free of these complexing agents used in the industry. In Mathura und Agra the removal rates do not exceed 80%. Therefore, despite a relatively high removal rate, these industrial products were found in the RBF well water in Mathura and Agra. Studies show that both compounds should be relatively stable only with a certain potential for biodegradation under aerobic conditions [36]. However, through cometabolic processes at higher DOC, the biodegradation can be enhanced [29]. Since the DOC at the sites is relatively high, this could be an explanation for the high removal rates.
4.5. Other Micropollutants
Caffeine, its degradation product theophylline, and cotinine that is a degradation product of nicotine, can be regarded as qualitative indicators for untreated wastewater. In New Delhi, Mathura and Agra those three compounds were found in nearly every sample. This is clear evidence for inadequate wastewater management in these areas. Caffeine, theophylline and cotinine are usually degradable to a high degree during RBF [37,38,39,40]. This fact was confirmed within this study for Delhi, Mathura and Agra (Appendix A Table A2), Haridwar, Srinagar and Karnaprayag (Appendix B Table A4). In Agastmuni, higher concentrations of caffeine were observed in RBF wells than in river water, indicating potential contamination via local wastewater input.
5. Conclusions
Five sampling campaigns from 2015 to 2018 provided an overview of the organic and inorganic water quality of the surface water and RBF well water at selected sites in Uttarakhand, Uttar Pradesh and New Delhi along the Ganges and Yamuna rivers. While pollution by the selected organic micropollutants was found to be very low in Uttarakhand, it was significant higher in New Delhi and Uttar Pradesh. The potential of RBF to remove organic trace pollutants was demonstrated particularly for the more polluted sites. The results support findings from RBF sites worldwide proving the pre-treatment efficiency of RBF to significantly improve raw water quality for drinking water production. Nevertheless, micropollutants were frequently detected in the RBF well water samples in New Delhi, Mathura and Agra due to a very high pollution of the river water. Diuron, 1H-benzatriazole, acesulfame, theophylline, diclofenac, gabapentin and paracetamol are the compounds with highest relevance at these sites. Thus, post-treatment such as activated carbon or advanced oxidation should be mandatory, which are less costly and easier to maintain if RBF is used for pre-treatment. The results provide a good basis for further sophisticated and comprehensive investigations, whereby a higher frequency of sampling, an extension of micropollutants spectrum, and the stringent consideration of meteorological data and geological material properties are scheduled.
Author Contributions
Conceptualization and project administration, H.B. and T.G.; Literature review, H.G. and H.B.; Selection of the study sites, C.S. and H.G.; Sampling, H.G. and C.S., Analyses, H.G., Writing Original Draft H.G.; Editing, H.B., C.S., T.G.
Funding
This research was funded by the Federal Ministry of Education and Research Germany (BMBF) within the project NIRWINDU (02WCL1356C). The financing of the LC-MS/MS system was supported by European Fund for Regional Development and by the Free State of Saxony.
Acknowledgments
The authors are very grateful to Dr. Gopal Krishan of the National Institute of Hydrology Roorkee for providing logistical support to the sampling in Delhi, Mathura and Agra.
Conflicts of Interest
The authors declare no conflict of interest.
Appendix A

Table A1.
Mean (Ø) and maximum concentrations in mg/L of main anions and cations and DOC in the river and RBF well water at sampling points in Uttar Pradesh and New Delhi, 2015–2018 (n.d.—not determined), κ = conductivity.
Table A1.
Mean (Ø) and maximum concentrations in mg/L of main anions and cations and DOC in the river and RBF well water at sampling points in Uttar Pradesh and New Delhi, 2015–2018 (n.d.—not determined), κ = conductivity.
| Parameter in mg/L | New Delhi (n = 5) | Mathura (n = 2) | Agra (n = 2) | ||||
|---|---|---|---|---|---|---|---|
| River | Well | River | Well | River | Well | ||
| As3+ | Ø | 0.02 | 0.02 | 0.01 | 0.02 | 0.01 | 0.03 |
| Max | 0.04 | 0.03 | 0.01 | 0.03 | 0.02 | 0.10 | |
| Ca2+ | Ø | 97.2 | 76.2 | 48.3 | 69.7 | 59.0 | 109 |
| Max | 124 | 107 | 74.9 | 106 | 78.4 | 136 | |
| Fe2+ | Ø | 0.07 | 0.05 | <0.02 | 0.18 | <0.02 | 0.75 |
| Max | 0.21 | 0.19 | 0.03 | 0.63 | <0.02 | 2.97 | |
| Mg2+ | Ø | 30.4 | 29.0 | 22.6 | 27.0 | 28.8 | 46.3 |
| Max | 34.3 | 42.4 | 43.9 | 40.3 | 47.1 | 59.5 | |
| Mn2+ | Ø | 0.52 | 0.33 | 0.04 | 0.42 | 0.07 | 0.58 |
| Max | 0.60 | 0.59 | 0.07 | 1.12 | 0.23 | 2.25 | |
| Na+ | Ø | 79.3 | 101 | 92.9 | 86.7 | 97.1 | 122 |
| Max | 82.5 | 104 | 95.5 | 88.7 | 103 | 132 | |
| Cl− | Ø | 170 | 120 | 234 | 215 | 212 | 252 |
| Max | 237 | 209 | 352 | 228 | 354 | 376 | |
| F− | Ø | 0.29 | 0.31 | 0.36 | 0.41 | 0.37 | 0.33 |
| Max | 0.39 | 0.60 | 0.53 | 0.77 | 0.61 | 0.63 | |
| NO3− | Ø | 3.73 | 13.0 | 3.50 | 0.55 | 9.25 | 12.5 |
| Max | 10.5 | 23.5 | 3.9 | 1.3 | 15.4 | 30.5 | |
| NO2− | Ø | 0.17 | 0.03 | 2.87 | 0.01 | 2.68 | 0.49 |
| Max | 0.50 | 0.07 | 4.34 | 0.04 | 3.53 | 1.95 | |
| PO43− * | Ø | 1.24 | <0.004 | 2.40 | 0.33 | 0.92 | 0.66 |
| Max | 3.03 | <0.004 | 4.58 | 1.33 | 2.94 | 2.62 | |
| SO42− | Ø | 84.1 | 46.8 | 81.2 | 58.4 | 82.9 | 79.7 |
| Max | 118 | 63.4 | 93.2 | 125 | 107 | 123 | |
| DOC | Ø | 6.48 | 1.78 | 8.41 | 1.85 | 8.59 | 5.18 |
| Max | 8.80 | 2.38 | 10.6 | 2.38 | 9.80 | 8.30 | |
| κ in µS/cm | Ø | 1410 | 1190 | 1250 | 1390 | 1340 | 1370 |
| Max | 1560 | 1270 | 1370 | 1860 | 1730 | 1500 | |
* No data in May 2016.
Table A2.
Mean (Ø) and maximum concentrations in ng/L of the most prominent organic micropollutants in the river and RBF well water at sampling points in Uttar Pradesh and New Delhi, 2015–2018 (n.d.—not determined).
Table A2.
Mean (Ø) and maximum concentrations in ng/L of the most prominent organic micropollutants in the river and RBF well water at sampling points in Uttar Pradesh and New Delhi, 2015–2018 (n.d.—not determined).
| Parameter in ng/L | New Delhi (n = 5) | Mathura (n = 2) | Agra (n = 2) | ||||
|---|---|---|---|---|---|---|---|
| River | Well | River | Well | River | Well | ||
| 1H-Benzotriazole | Ø | 376 | <6 | 271 | 61.9 | 1050 | 224 |
| Max | 378 | <6 | 427 | 161 | 1850 | 266 | |
| Tolyltriazole | Ø | 418 | n.d. | 98.6 | 38.1 | 113 | 75.2 |
| Max | 733 | n.d. | 157 | 38.2 | 179 | 88.5 | |
| Acetamiprid | Ø | 65.3 | 7.52 | 19.5 | 6.4 | 7.20 | 2.56 |
| Max | 125 | 13.9 | 30.9 | 6.8 | 7.33 | 4.11 | |
| Diuron | Ø | 3450 | 299 | 4810 | 512 | 2710 | 1700 |
| Max | >10,000 | 599 | 5860 | 855 | 4670 | 4200 | |
| Imidacloprid | Ø | 10.2 | 7.97 | 18.6 | <2 | 9.59 | 5.93 |
| Max | 19.4 | 14.9 | 19.9 | <2 | 18.2 | 7.57 | |
| Acesulfame | Ø | 377 | 172 | 749 | 592 | 989 | 1020 |
| Max | 584 | 255 | 873 | 709 | 1060 | 1160 | |
| Caffeine | Ø | 3360 | 852 | 279 | <2 | 322 | 93.8 |
| Max | >10,000 | 1700 | 308 | <2 | 674 | 187 | |
| Cotinine | Ø | 1180 | 64.2 | 49.9 | 22.6 | 38.7 | 36.8 |
| Max | 3260 | 128 | 74.1 | 39.1 | 91.5 | 54.4 | |
| Theophylline | Ø | 1350 | 402 | 1020 | <6 | 431 | 188 |
| Max | 3810 | 800 | 1700 | <6 | 977 | 239 | |
| Carbamazepine | Ø | 96.0 | 25.7 | 109 | 59.4 | 112 | 95.1 |
| Max | 185 | 56.0 | 122 | 106 | 114 | 124 | |
| Diclofenac | Ø | 410 | 248 | 995 | 623 | 199 | 40.5 |
| Max | 1220 | 267 | 2040 | 1990 | 232 | 92.4 | |
| Gabapentin | Ø | 833 | <8 | 3260 | <8 | 5380 | 508 |
| Max | 1200 | <8 | 5340 | <8 | 10,000 | 527 | |
| Ibuprofen | Ø | 334 | 101 | 3.83 | <1 | 59.9 | 48.8 |
| Max | 346 | 202 | 9.50 | <1 | 164 | 117 | |
| Metoprolol | Ø | 233 | 9.0 | 395 | <1 | 172 | 37.3 |
| Max | 420 | 27.1 | 609 | <1 | 436 | 62.2 | |
| Naproxen | Ø | 424 | <2 | 87.4 | <2 | 113 | 68.7 |
| Max | 424 | <2 | 102 | <2 | 128 | 85.7 | |
| Paracetamol | Ø | 1550 | 771 | n.d. | n.d. | 115 | 61.7 |
| Max | 2990 | 771 | n.d. | n.d. | 199 | 61.7 | |
| Sulfamethoxazole | Ø | 719 | 37.1 | 381 | 18.4 | 347 | 205 |
| Max | 1260 | 73.2 | 742 | 35.8 | 733 | 205 | |
Appendix B
Table A3.
Mean (Ø) and maximum concentrations in ng/L of most prominent organic micropollutants in the river and RBF well water at sampling points in Uttarakhand, 2015–2018 (n.d.—not determined).
Table A3.
Mean (Ø) and maximum concentrations in ng/L of most prominent organic micropollutants in the river and RBF well water at sampling points in Uttarakhand, 2015–2018 (n.d.—not determined).
| Parameter in ng/L | Haridwar (n = 5) | Srinagar (n = 5) | Karnaprayag (n = 5) | Gauchar (n = 5) | Agastmuni (n = 5) | Satpuli (n = 5) | |||||||
|---|---|---|---|---|---|---|---|---|---|---|---|---|---|
| River | Well | River | Well | River | Well | River | Well | River | Well | River | Well | ||
| 1H-Benzotriazole | Ø | <6 | n.d. | <6 | 55.1 | <6 | <6 | <6 | <6 | <6 | <6 | <6 | <6 |
| Max | <6 | n.d. | <6 | 61.7 | <6 | <6 | <6 | <6 | <6 | <6 | <6 | <6 | |
| Tolyltriazole | Ø | n.d. | 31.7 | 32.1 | 13.8 | 12.5 | n.d. | n.d. | n.d. | 42.6 | <4 | n.d. | n.d. |
| Max | n.d. | 60.3 | 56.6 | 27.6 | 15.6 | n.d. | n.d. | n.d. | 90.6 | <4 | n.d. | n.d. | |
| Diuron | Ø | <4 | 72.8 | <4 | 759 | <4 | <4 | n.d. | n.d. | 95.5 | 273 | <4 | n.d. |
| Max | <4 | 143 | <4 | 1510 | <4 | <4 | n.d. | n.d. | 280 | 407 | <4 | n.d. | |
| Imidacloprid | Ø | n.d. | n.d. | n.d. | 2.60 | 7.14 | <2 | <2 | n.d. | <2 | <2 | <2 | <2 |
| Max | n.d. | n.d. | n.d. | 4.19 | 10.2 | <2 | <2 | n.d. | <2 | <2 | <2 | <2 | |
| Acesulfame | Ø | 22.4 | 11.6 | 30.5 | 29.2 | 45.5 | 27.8 | <2 | 97.2 | 20.5 | 270 | 56.2 | 51.5 |
| Max | 43.9 | 22.1 | 60.1 | 57.5 | 50.1 | 54.5 | <2 | 144 | 40.0 | 429 | 58.6 | 54.6 | |
| Caffeine | Ø | 436 | <2 | 674 | <2 | 158 | <2 | <2 | <2 | 6.40 | 11.1 | <2 | <2 |
| Max | 1310 | <2 | 2020 | <2 | 393 | <2 | <2 | <2 | 17.2 | 21.1 | <2 | <2 | |
| Cotinine | Ø | n.d. | n.d. | n.d. | n.d. | 6.0 | n.d. | n.d. | n.d. | n.d. | 11.2 | n.d. | n.d. |
| Max | n.d. | n.d. | n.d. | n.d. | 11.0 | n.d. | n.d. | n.d. | n.d. | 11.2 | n.d. | n.d. | |
| Theophylline | Ø | <6 | <6 | 53.3 | <6 | 164 | <6 | <6 | <6 | 66.5 | 108 | <6 | <6 |
| Max | <6 | <6 | 102 | <6 | 204 | <6 | <6 | <6 | 128 | 210 | <6 | <6 | |
| Diclofenac | Ø | <1 | 1000 | <1 | <1 | <1 | <1 | <1 | <1 | 106 | <1 | <1 | <1 |
| Max | <1 | 2000 | <1 | <1 | <1 | <1 | <1 | <1 | 210 | <1 | <1 | <1 | |
| Gabapentin | Ø | <8 | 2050 | <8 | 294 | <8 | <8 | <8 | <8 | <8 | 42.0 | <8 | <8 |
| Max | <8 | 4090 | <8 | 581 | <8 | <8 | <8 | <8 | <8 | 77.0 | <8 | <8 | |
| Ibuprofen | Ø | 53.9 | <1 | <1 | <1 | n.d. | <1 | <1 | <1 | 50.1 | 52.9 | <1 | <1 |
| Max | 107 | <1 | <1 | <1 | n.d. | <1 | <1 | <1 | 50.1 | 105 | <1 | <1 | |
| Paracetamol | Ø | 107 | <2 | 14.2 | <2 | 10.4 | n.d. | <2 | 17.5 | 18.5 | <2 | <2 | n.d. |
| Max | 147 | <2 | 27.5 | <2 | 19.7 | n.d. | <2 | 17.5 | 36.0 | <2 | <2 | n.d. | |
| Sulfamethoxazole | Ø | <1 | <1 | <1 | 31.6 | 15.1 | <1 | <1 | n.d. | n.d. | <1 | <1 | <1 |
| Max | <1 | <1 | <1 | 59.1 | 29.2 | <1 | <1 | n.d. | n.d. | <1 | <1 | <1 | |
Table A4.
Mean (Ø) and maximum concentrations in mg/L of main cations and anions and DOC in the river and RBF well water at sampling points in Uttarakhand, 2015–2018 (n.d.—not determined; * no data in May 2016), κ = conductivity.
Table A4.
Mean (Ø) and maximum concentrations in mg/L of main cations and anions and DOC in the river and RBF well water at sampling points in Uttarakhand, 2015–2018 (n.d.—not determined; * no data in May 2016), κ = conductivity.
| Parameter in mg/L | Haridwar (n = 5) | Srinagar (n = 5) | Karnaprayag (n = 5) | Gauchar (n = 5) | Agastmuni (n = 5) | Satpuli (n = 5) | |||||||
|---|---|---|---|---|---|---|---|---|---|---|---|---|---|
| River | Well | River | Well | River | Well | River | Well | River | Well | River | Well | ||
| As3+ | Ø | 0.00 | n.d. | 0.01 | 0.02 | 0.00 | 0.03 | 0.00 | 0.00 | n.d. | n.d. | n.d. | n.d. |
| Max | 0.01 | n.d. | 0.05 | 0.03 | 0.01 | 0.13 | 0.01 | 0.01 | n.d. | n.d. | n.d. | n.d. | |
| Ca2+ | Ø | 16.9 | 36.2 | 60.8 | 33.9 | 15.5 | 23.1 | 26.5 | 33.6 | 15.6 | 24.6 | 13.1 | 13.1 |
| Max | 23.0 | 64.0 | 236 | 42.7 | 29.7 | 33.4 | 53.7 | 51.3 | 36.2 | 33.9 | 16.3 | 22.1 | |
| Fe2+ | Ø | 0.02 | <0.02 | <0.02 | <0.02 | <0.02 | 0.06 | <0.02 | 0.05 | 0.03 | 0.02 | <0.02 | 0.06 |
| Max | 0.05 | 0.03 | 0.05 | 0.04 | 0.03 | 0.28 | 0.03 | 0.18 | 0.11 | 0.05 | <0.02 | 0.23 | |
| Mg2+ | Ø | 4.50 | 8.14 | 17.4 | 10.2 | 3.82 | 6.70 | 7.34 | 8.72 | 2.54 | 6.56 | 4.28 | 3.97 |
| Max | 6.39 | 17.1 | 72.6 | 11.8 | 7.70 | 10.8 | 16.9 | 14.5 | 8.05 | 11.9 | 6.09 | 8.48 | |
| Mn2+ | Ø | <0.002 | 0.02 | 0.01 | 0.02 | 0.01 | 0.04 | 0.00 | 0.01 | 0.01 | 0.02 | <0.002 | 0.00 |
| Max | 0.01 | 0.04 | 0.03 | 0.04 | 0.02 | 0.21 | 0.01 | 0.01 | 0.01 | 0.10 | <0.002 | 0.01 | |
| Na+ | Ø | 2.33 | 4.11 | 1.44 | 6.96 | 1.34 | 5.62 | 2.48 | 3.80 | 4.09 | 9.09 | 5.83 | 7.49 |
| Max | 2.86 | 7.12 | 2.10 | 7.60 | 2.13 | 18.2 | 5.42 | 5.17 | 12.3 | 16.0 | 8.47 | 12.9 | |
| Cl− | Ø | 3.08 | 51.3 | 8.25 | 2.85 | 1.64 | 10.4 | 2.85 | 11.0 | 8.53 | 12.6 | 3.34 | 6.53 |
| Max | 8.35 | 133 | 36.3 | 2.95 | 4.64 | 45.3 | 7.13 | 35.6 | 39.5 | 17.4 | 5.69 | 14.5 | |
| F− | Ø | 0.60 | 0.45 | 0.43 | 0.34 | 0.40 | 0.43 | 0.44 | 0.19 | 0.26 | 0.24 | 0.49 | 0.47 |
| Max | 1.40 | 0.83 | 1.31 | 0.38 | 1.35 | 1.39 | 1.44 | 0.55 | 0.73 | 0.51 | 1.23 | 1.23 | |
| NO3− | Ø | 6.5 | 11.9 | 17.0 | 4.6 | 3.06 | 15.9 | 6.95 | 27.0 | 1.08 | 23.4 | 0.84 | 7.54 |
| Max | 21.5 | 26.1 | 78.9 | 6.0 | 11.5 | 66.8 | 19.0 | 88.0 | 2.48 | 36.9 | 1.65 | 26.7 | |
| NO2− | Ø | 0.01 | 0.04 | 0.01 | <0.004 | <0.004 | 0.04 | 0.01 | <0.004 | 0.02 | 0.01 | <0.004 | <0.004 |
| Max | 0.02 | 0.15 | 0.03 | <0.004 | 0.01 | 0.16 | 0.01 | 0.01 | 0.06 | 0.05 | <0.004 | 0.01 | |
| PO43− * | Ø | <0.004 | <0.004 | <0.004 | n.d. | <0.004 | <0.004 | <0.004 | <0.004 | <0.004 | <0.004 | <0.004 | <0.004 |
| Max | <0.004 | <0.004 | <0.004 | n.d. | <0.004 | <0.004 | <0.004 | <0.004 | <0.004 | <0.004 | <0.004 | <0.004 | |
| SO42− | Ø | 16.5 | 24.9 | 13.2 | 36.7 | 15.2 | 16.4 | 11.6 | 8.7 | 9.07 | 10.8 | 7.48 | 9.62 |
| Max | 23.5 | 35.0 | 18.3 | 37.9 | 23.1 | 27.5 | 20.2 | 15.2 | 13.5 | 15.6 | 11.8 | 14.2 | |
| DOC | Ø | 1.36 | 0.87 | 1.36 | 1.43 | 1.03 | 1.31 | 0.87 | 0.73 | 0.97 | 0.93 | 1.61 | 1.10 |
| Max | 3.54 | 1.64 | 2.36 | 1.60 | 1.40 | 1.90 | 1.20 | 0.95 | 1.47 | 1.24 | 2.48 | 1.28 | |
| κ in µS/cm | Ø | 159 | 581 | 156 | 911 | 144 | 289 | 136 | 517 | 88 | 334 | 82 | 136 |
| Max | 194 | 940 | 229 | 1290 | 155 | 312 | 148 | 705 | 95 | 372 | 107 | 160 | |
References
- Kim, M.-K.; Zoh, K.-D. Occurrence and removals of micropollutants in water environment. Environ. Eng. Res. 2016, 21, 319–332. [Google Scholar] [CrossRef] [Green Version]
- Duan, W.; He, B.; Takara, K.; Luo, P.; Nover, D.; Sahu, N.; Yamashiki, Y. Spatiotemporal evaluation of water quality incidents in Japan between 1996 and 2007. Chemosphere 2013, 93, 946–953. [Google Scholar] [CrossRef] [PubMed]
- Schwarzenbach, R.P.; Escher, B.I.; Fenner, K.; Hofstetter, T.B.; Johnson, C.A.; von Gunten, U.; Wehrli, B. The challenge of micropollutants in aquatic systems. Science 2006, 313, 1072–1077. [Google Scholar] [CrossRef] [PubMed]
- Duan, W.; He, B.; Nover, D.; Yang, G.; Chen, W.; Meng, H.; Zou, S.; Liu, C. Water Quality Assessment and Pollution Source Identification of the Eastern Poyang Lake Basin Using Multivariate Statistical Methods. Sustainability 2016, 8, 133. [Google Scholar] [CrossRef]
- Lapworth, D.J.; Baran, N.; Stuart, M.E.; Ward, R.S. Emerging organic contaminants in groundwater: A review of sources, fate and occurrence. Environ. Pollut. 2012, 163, 287–303. [Google Scholar] [CrossRef] [PubMed] [Green Version]
- Deblonde, T.; Cossu-Leguille, C.; Hartemann, P. Emerging pollutants in wastewater: A review of the literature. Int. J. Hyg. Environ. Health 2011, 214, 442–448. [Google Scholar] [CrossRef] [PubMed]
- Kumar, P.; Mehrotra, I.; Gupta, A.; Kumari, S. Riverbank Filtration: A Sustainable Process to Attenuate Contaminants during Drinking Water Production. J. Sustain. Dev. Energy Water Environ. Syst. 2017, 6, 150–161. [Google Scholar] [CrossRef] [Green Version]
- Rana Rajender, S.; Singh, P.; Singh, R.; Sanjay, G. Assessment of physico-chemical pollutants in pharmaceutical industrial wastewater of pharma city, Selaqui, Dehradun. Int. J. Res. Chem. Environ. 2014, 4, 136–142. [Google Scholar]
- Gupta, A.; Ronghang, M.; Kumar, P.; Mehrotra, I.; Kumar, S.; Grischek, T.; Sandhu, C.; Knoeller, K. Nitrate contamination of riverbank filtrate at Srinagar, Uttarakhand, India: A case of geogenic mineralization. J. Hydrol. 2015, 531, 626–637. [Google Scholar] [CrossRef]
- Bartak, R.; Page, D.; Sandhu, C.; Grischek, T.; Saini, B.; Mehrotra, I.; Jain, C.K.; Ghosh, N.C. Application of risk-based assessment and management to riverbank filtration sites in India. J. Water Health 2015, 13, 174–189. [Google Scholar] [CrossRef]
- Krishan, G.; Singh, S.; Sharma, A.; Sandhu, C.; Grischek, T.; Gosh, N.C.; Gurjar, S.; Kumar, S.; Singh, R.P.; Glorian, H.; et al. Assessment of water quality for river bank filtration along Yamuna river in Agra and Mathura. Int. J. Environ. Sci. 2016, 7, 56–67. [Google Scholar]
- Aleem, A.; Malik, A. Genotoxicity of the Yamuna River water at Okhla (Delhi), India. Ecotoxicol. Environ. Saf. 2005, 61, 404–412. [Google Scholar] [CrossRef] [PubMed]
- Kaushik, C.P.; Sharma, H.R.; Jain, S.; Dawra, J.; Kaushik, A. Pesticide residues in river Yamuna and its canals in Haryana and Delhi, India. Environ. Monit. Assess. 2008, 144, 329–340. [Google Scholar] [CrossRef] [PubMed]
- Kumar, B.; Singh, S.K.; Mishra, M.; Kumar, S.; Sharma, C.S. Assessment of polychlorinated biphenyls and organochlorine pesticides in water samples from the Yamuna River. J. Xenobiotics 2012, 2, 6. [Google Scholar] [CrossRef] [Green Version]
- Mukherjee, I.; Gopal, M. Organochlorine insecticide residues in drinking and ground water in and around Delhi. Environ. Monit. Assess. 2002, 76, 185–193. [Google Scholar] [CrossRef]
- Mutiyar, P.K.; Mittal, A.K.; Pekdeger, A. Status of organochlorine pesticides in the drinking water well-field located in the Delhi region of the flood plains of river Yamuna. Drink. Water Eng. Sci. 2011, 4, 51–60. [Google Scholar] [CrossRef] [Green Version]
- Mutiyar, P.K.; Mittal, A.K. Status of organochlorine pesticides in Ganga river basin: Anthropogenic or glacial? Drink. Water Eng. Sci. 2013, 6, 69–80. [Google Scholar] [CrossRef]
- Singh, R.P. Comparison of organochlorine pesticide levels in soil and groundwater of Agra, India. Bull. Environ. Contam. Toxicol. 2001, 67, 0126–0132. [Google Scholar] [CrossRef]
- Mutiyar, P.K.; Gupta, S.K.; Mittal, A.K. Fate of pharmaceutical active compounds (PhACs) from River Yamuna, India: An ecotoxicological risk assessment approach. Ecotoxicol. Environ. Saf. 2018, 150, 297–304. [Google Scholar] [CrossRef]
- Thacker, N.; Bassin, J.; Deshpande, V.; Devotta, S. Trends of organochlorine pesticides in drinking water supplies. Environ. Monit. Assess. 2008, 137, 295–299. [Google Scholar] [CrossRef]
- Sharma, H.R.; Trivedi, R.C.; Akolkar, P.; Gupta, A. Micropollutants levels in macroinvertebrates collected from drinking water sources of Delhi, India. Int. J. Environ. Stud. 2003, 60, 99–110. [Google Scholar] [CrossRef]
- Ghosh, N.C.; Mishra, G.C.; Sandhu, C.S.S.; Grischek, T.; Singh, V.V. Interaction of Aquifer and River-Canal Network near Well Field. Groundwater 2015, 53, 794–805. [Google Scholar] [CrossRef] [PubMed]
- Gutiérrez, J.P.; van Halem, D.; Rietveld, L. Riverbank filtration for the treatment of highly turbid Colombian rivers. Drink. Water Eng. Sci. 2017, 10, 13–26. [Google Scholar] [CrossRef] [Green Version]
- Glorian, H.; Schmalz, V.; Lochyński, P.; Fremdling, P.; Börnick, H.; Worch, E.; Dittmar, T. Portable Analyzer for On-Site Determination of Dissolved Organic Carbon—Development and Field Testing. Int. J. Environ. Res. Public. Health 2018, 15, 2335. [Google Scholar] [CrossRef] [PubMed]
- Wintgens, T.; Nättorp, A.; Elango, L.; Asolekar, S.R. (Eds.) Natural Water Treatment Systems for Safe and Sustainable Water Supply in the Indian Context, Saph Pani; IWA Publishing: London, UK, 2016; ISBN 978-1-78040-710-4. [Google Scholar]
- Ronghang, M.; Gupta, A.; Mehrotra, I.; Kumar, P.; Patwal, P.; Kumar, S.; Grischek, T.; Sandhu, C. Riverbank filtration: A case study of four sites in the hilly regions of Uttarakhand, India. Sustain. Water Resour. Manag. 2018. [Google Scholar] [CrossRef]
- Krishan, G.; Singh, S.; Sharma, A.; Sandhu, C.; Kumar, S.; Kumar, C.P.; Gurjar, S. Assessment of river Yamuna and groundwater interaction using isotopes in Agra and Mathura area of Uttar Pradesh, India. Int. J. Hydrol. 2017, 1, 86–89. [Google Scholar] [CrossRef]
- DIN Deutsches Institut für Normung e.V., Arbeitsausschuss Chemische Terminologie (AChT). D. I. für Normung, DIN EN 1484–1997: Anleitungen zur Bestimmung des Gesamten Organischen Kohlenstoffs (TOC) und des Gelösten Organischen Kohlenstoffs (DOC); Beuth Verlag GmbH: Berlin, Germany, 1997. [Google Scholar]
- Reemtsma, T.; Miehe, U.; Duennbier, U.; Jekel, M. Polar pollutants in municipal wastewater and the water cycle: Occurrence and removal of benzotriazoles. Water Res. 2010, 44, 596–604. [Google Scholar] [CrossRef] [PubMed]
- Groeschke, M.; Frommen, T.; Taute, T.; Schneider, M. The impact of sewage-contaminated river water on groundwater ammonium and arsenic concentrations at a riverbank filtration site in central Delhi, India. Hydrogeol. J. 2017, 25, 2185–2197. [Google Scholar] [CrossRef]
- Scheurer, M.; Storck, F.R.; Brauch, H.-J.; Lange, F.T. Performance of conventional multi-barrier drinking water treatment plants for the removal of four artificial sweeteners. Water Res. 2010, 44, 3573–3584. [Google Scholar] [CrossRef]
- Jekel, M.; Dott, W. RISKWA Leitfaden: Polare Organische Spurenstoffe als Indikatoren im Anthropogen Beeinflussten Wasserkreislauf; DECHEMA e.V.: Frankfurt, Germany, 2013. [Google Scholar]
- Schmidt, C.K.; Lange, F.T.; Brauch, H.-J. Assessing the impact of different redox conditions and residence times on the fate of organic micropollutants during riverbank filtration. In Proceedings of the 4th International Conference on Pharmaceuticals and Endocrine Disrupting Chemicals in Water, Minneapolis, MN, USA, 13–15 October 2004; Volume 13, p. 2004. [Google Scholar]
- Ens, W.; Senner, F.; Gygax, B.; Schlotterbeck, G. Development, validation, and application of a novel LC-MS/MS trace analysis method for the simultaneous quantification of seven iodinated X-ray contrast media and three artificial sweeteners in surface, ground, and drinking water. Anal. Bioanal. Chem. 2014, 406, 2789–2798. [Google Scholar] [CrossRef]
- ECHA Classifications-CL Inventory-Diuron. Available online: https://echa.europa.eu/de/information-on-chemicals/cl-inventory-database/-/discli/details/446 (accessed on 18 October 2018).
- Liu, Y.-S.; Ying, G.-G.; Shareef, A.; Kookana, R.S. Biodegradation of three selected benzotriazoles under aerobic and anaerobic conditions. Water Res. 2011, 45, 5005–5014. [Google Scholar] [CrossRef] [PubMed] [Green Version]
- Regnery, J.; Wing, A.D.; Alidina, M.; Drewes, J.E. Biotransformation of trace organic chemicals during groundwater recharge: How useful are first-order rate constants? J. Contam. Hydrol. 2015, 179, 65–75. [Google Scholar] [CrossRef] [PubMed] [Green Version]
- Bertelkamp, C.; Reungoat, J.; Cornelissen, E.R.; Singhal, N.; Reynisson, J.; Cabo, A.J.; van der Hoek, J.P.; Verliefde, A.R.D. Sorption and biodegradation of organic micropollutants during river bank filtration: A laboratory column study. Water Res. 2014, 52, 231–241. [Google Scholar] [CrossRef] [PubMed]
- Bertelkamp, C.; Schoutteten, K.; Vanhaecke, L.; Vanden Bussche, J.; Callewaert, C.; Boon, N.; Singhal, N.; van der Hoek, J.P.; Verliefde, A.R.D. A laboratory-scale column study comparing organic micropollutant removal and microbial diversity for two soil types. Sci. Total Environ. 2015, 536, 632–638. [Google Scholar] [CrossRef] [PubMed]
- Nivala, J.; Kahl, S.; Boog, J.; van Afferden, M.; Reemtsma, T.; Müller, R.A. Dynamics of emerging organic contaminant removal in conventional and intensified subsurface flow treatment wetlands. Sci. Total Environ. 2019, 649, 1144–1156. [Google Scholar] [CrossRef] [PubMed]
Figure 1.
Sampling locations in (a) Uttarakhand and (b) Uttar Pradesh and New Delhi, India (adapted from [24]).
Figure 1.
Sampling locations in (a) Uttarakhand and (b) Uttar Pradesh and New Delhi, India (adapted from [24]).

Figure 2.
Pharmaceuticals with highest mean concentrations in New Delhi (ND), Mathura (MA) and Agra (AG) in river and RBF well water.
Figure 2.
Pharmaceuticals with highest mean concentrations in New Delhi (ND), Mathura (MA) and Agra (AG) in river and RBF well water.

Figure 3.
Mean concentrations of four pharmaceuticals with lower concentration in New Delhi (ND), Mathura (MA) and Agra (AG) in river and RBF well water.
Figure 3.
Mean concentrations of four pharmaceuticals with lower concentration in New Delhi (ND), Mathura (MA) and Agra (AG) in river and RBF well water.

Figure 4.
Mean concentrations of herbicides and pesticides in New Delhi (ND), Mathura (MA) and Agra (AG) in river and RBF well water; Diuron is shown in a scale 1:100, the sample was measured undiluted.
Figure 4.
Mean concentrations of herbicides and pesticides in New Delhi (ND), Mathura (MA) and Agra (AG) in river and RBF well water; Diuron is shown in a scale 1:100, the sample was measured undiluted.

Figure 5.
Mean concentrations of industrial products in New Delhi (ND), Mathura (MA) and Agra (AG) in river and RBF well water.
Figure 5.
Mean concentrations of industrial products in New Delhi (ND), Mathura (MA) and Agra (AG) in river and RBF well water.

Figure 6.
Mean concentrations of other micropollutants in New Delhi (ND), Mathura (MA) and Agra (AG) in river and RBF well water.
Figure 6.
Mean concentrations of other micropollutants in New Delhi (ND), Mathura (MA) and Agra (AG) in river and RBF well water.

Table 1.
Summary of RBF sites in this study, and wells that were monitored (adapted from [25]).
Table 1.
Summary of RBF sites in this study, and wells that were monitored (adapted from [25]).
| Location | River | Well Type (# of Wells) | Total Production of all Wells at Site (m3/d) | Depth (m) | Distance: River–Nearest Well(s) (m) | Portion of Bank Filtrate (%) |
|---|---|---|---|---|---|---|
| Agastmuni [26] | Mandakini | V (1) | >280 | 30 | 33 | 25–35 |
| Karnaprayag (Kaleshwar) | Alaknanda | C (1) and V (1) M | 5760 | 14.7 (C) 20 (V) | ≤1**–25* | n.d.; assumed > 50 |
| Gauchar | Alaknanda | C (1) and V (1) M | 4320 | 14.7 | 61 | n.d. |
| Srinagar [26] | Alaknanda | V (7) | 1300–8000 | 18–44 | 10**–102* | 36–72 |
| Satpuli [26] | East Nayar | V (1) | 756 | 26 | 43–45 | 95–100 |
| Haridwar [10] | Ganga and UGC | C (22) (well #18 M) | 59,000–67,000 | 7–10 | 4–110 | 40–90 |
| New Delhi [7] | Yamuna | R (8) (well #P4 M) | n.d. | 19–31 | ~1300 (well #P4) | n.d. |
| Mathura | Yamuna | V (1) | n.d. | (under construction) | n.d. | |
| Agra [27] | Yamuna | V (1) | n.d. | 20 | 140 | n.d. |
M well(s) that were monitored; * during non-monsoon; ** during monsoon; C: caisson well; V: vertical well; R: radial collector well; UGC: Upper Ganga Canal; n.d.: not determined yet as these wells were constructed in 2016–2017 and became operational in 2017–2018.
Table 2.
List of analyzed micropollutants and range of quantification.
| Compound | Limit of Determination in ng/L | Compound | Limit of Determination in ng/L |
|---|---|---|---|
| Pharmaceuticals Azithromycin | 800 | Pesticides Acetamiprid | 2 |
| Bezafibrate | 2 | Atrazine | 10 |
| Carbamazepine | 1 | Dimethoate | 1 |
| Clarithromycin | 60 | Diuron | 4 |
| Diclofenac | 1 | Imidacloprid | 2 |
| Erythromycin | 60 | Irgarol | 1 |
| Fluoxetine | 1 | Isoproturon | 1 |
| Gabapentin | 8 | Nicosulfuron | 2 |
| Ibuprofen | 1 | Terbutryn | 6 |
| Iomeprol | 1 | Industrial chemicals | |
| Metoprolol | 1 | 1H-Benzotriazole | 6 |
| Naproxen | 2 | Bisphenol A | 6 |
| Paracetamol | 2 | Tolyltriazole | 4 |
| Roxithromycin | 1 | Other micropollutants | |
| Sulfamethoxazole | 1 | Acesulfame | 2 |
| Triclosan | 60 | Caffeine | 2 |
| Cotinine | 2 | ||
| Theophylline | 6 |
Table 3.
List of main anions and cations analyzed and range of quantification.
| Cation | Limit of Determination in mg/L | Anion | Limit of Determination in mg/L |
|---|---|---|---|
| Arsenic (As3+) | 0.0005 | Chloride (Cl−) | 0.127 |
| Calcium (Ca2+) | 0.1 | Fluoride (F−) | 0.028 |
| Iron (Fe2+) | 0.02 | Nitrate (NO3−) | 0.022 |
| Magnesium (Mg2+) | 0.1 | Nitrite (NO2−) | 0.004 |
| Manganese (Mn2+) | 0.002 | Phosphate (PO43−) | 0.004 |
| Sodium (Na+) | 0.1 | Sulfate (SO42−) | 0.020 |
© 2018 by the authors. Licensee MDPI, Basel, Switzerland. This article is an open access article distributed under the terms and conditions of the Creative Commons Attribution (CC BY) license (http://creativecommons.org/licenses/by/4.0/).
Share and Cite
MDPI and ACS Style
Glorian, H.; Börnick, H.; Sandhu, C.; Grischek, T. Water Quality Monitoring in Northern India for an Evaluation of the Efficiency of Bank Filtration Sites. Water 2018, 10, 1804. https://doi.org/10.3390/w10121804
AMA Style
Glorian H, Börnick H, Sandhu C, Grischek T. Water Quality Monitoring in Northern India for an Evaluation of the Efficiency of Bank Filtration Sites. Water. 2018; 10(12):1804. https://doi.org/10.3390/w10121804
Chicago/Turabian StyleGlorian, Heinrich, Hilmar Börnick, Cornelius Sandhu, and Thomas Grischek. 2018. "Water Quality Monitoring in Northern India for an Evaluation of the Efficiency of Bank Filtration Sites" Water 10, no. 12: 1804. https://doi.org/10.3390/w10121804
Note that from the first issue of 2016, this journal uses article numbers instead of page numbers. See further details here.