An Integrated Multicriteria Analysis Tool for Evaluating Water Resource Management Strategies


1
Laboratory of Hydrology and Aquatic Systems Analysis, Department of Civil Engineering, University of Thessaly, Pedion Areos, 38334 Volos, Greece
2
Department of Rural and Surveying Engineering, Aristotle University of Thessaloniki, 54124 Thessaloniki, Greece
*
Author to whom correspondence should be addressed.
Water 2018, 10(12), 1795; https://doi.org/10.3390/w10121795
Submission received: 11 September 2018
/
Revised: 28 November 2018
/
Accepted: 4 December 2018
/
Published: 7 December 2018
(This article belongs to the Collection Water Policy Collection)
Abstract
:Water is involved, directly or indirectly, with many activities and needs that have to be met. The large scale and importance of water projects, the investments needed, the difficulty in predicting the results, and the irreversible character of the decisions have made decision making a complex scientific process. This paper presents a multicriteria analysis (MCA) tool for evaluating water resource management (WRM) strategies and selecting the most appropriate among them, using as an example a Greek area based on agricultural economy, which faces water scarcity problems. Seven alternative strategies were evaluated under hydrological and economic criteria. Four techniques were used—multi attribute utility theory (MAUT), analytic hierarchy process (AHP), elimination and choice expressing reality (ELECTRE), and technique for order of preference by similarity to ideal solution (TOPSIS)—based on the main MCA techniques (utility theory, analytical hierarchy, outranking theory, and classification theory, respectively), to compare their performance, and to reach the most appropriate and ‘fitting’ method for the examined problem. The weightings extracted from two samples, (i) a sample of decision makers/stakeholders and (ii) a group of WRM experts, were used to compare the results. The process was carried out for each questionnaire, and thus the model shows the uncertainty of each sample group and of each method, as well as the overall uncertainty. The results illustrate the reality of the WRM problems of the watershed, enlighten their roots, and have further strengthened our conviction that the cooperation between the scientific community and the authorities is vital for more sustainable and efficient WRM.
1. Introduction
Complex management problems can be solved by a number of alternative strategies (decisions, policies, or actions), with different characteristics and consequences. They also may not have common comparison measures, so it becomes difficult to say which one of the alternatives is the most profitable [1,2]. The complexity and difficulty of the problems lies in the multidimensional nature of the impacts, and the uncertainty surrounding the data and the alternatives [3,4]. Decisions are the result of an organized and complex process that uses information and criteria to prioritize and identify the most appropriate solution [5]. Every decision includes purposefulness [6], and due to the increment of their importance, the decision making process has become more ‘scientificated’ over time [7,8]. Multicriteria analysis (MCA) or multicriteria decision analysis (MCDA) is the process used for finding the most appropriate decision, as it introduces criteria that reflect the objectives of the problem’s alternatives. Recent technological developments have provided better, faster, and more reliable computing tools for the implementation of the methodological developments of MCA in decision support systems. The different approaches and techniques may vary, and they do not respond in the same way for every problem. Thus, many decision support systems (DSS) with different definitions have been developed [9,10,11,12,13]. Today, the term DSS has prevailed to be the interactive system (software) that uses computational multicriteria analysis techniques to assist decision makers (DMs) [14]. The selection of the most appropriate technique depends on the nature and characteristics of the problem, the scope of the decision making process, and other factors, such as the ease of handling each approach and the type of information required [15].
The conversion of the status of aquatic systems to cover water demand in the most sustainable and profitable way is actually a complex decision making process [16,17]. Decisions on water resource management issues refer to great scale works, demand large investments in money, affect a big part of the population, and are hardly reversible [18]. These decisions also have significant consequences on both the environment and the characteristics of the areas concerned (e.g., land use, economic and social conditions, etc.). Another important peculiarity of water management decisions is the weakness at predicting their social approval and the pressures that they will bring [19,20]. The above make it clear that such decisions must be carefully planned, and that they have to be scientifically approached [21,22]. MCA techniques have been successfully implemented in water resource management [23,24]. The main uses of MCA in water policy concern water allocation in river basins and watersheds (land uses, reservoirs, economy, etc.), studies for the optimum exploitation of aquifers, studies of project appraisal, water policy and supply planning, water quality management, and marine protected area management [25,26,27]. MCA techniques have also been implemented in the field of water economics [28,29]. The most appropriate method is not known a priori, and it needs to be analyzed. Tecle [30] used an innovative approach, using MCA to evaluate 15 different MCA methods applied in water resource management. Several comparative studies of MCA methods on water resource management have been carried out [31,32,33]. A general conclusion from the above is that no method is better than another overall, nor is any superior by its nature [34].
Hence, an integrated approach that will provide the analyst with the possibility to examine more techniques and tools may be more useful in a specific problem. To the best of our knowledge, there is no model consisting of different MCA techniques that approach the same problem, nor a model that integrates many different methods. Herein, a DSS tool that combines four MCA methods for the evaluation of water resource management strategies is presented. Seven strategies for sustainable water demand management are examined in the form of alternative management scenarios. Their evaluation is based on hydrological and economic criteria, such as water balance, net profit, and full cost of water. The different MCA techniques combined in the model are the multi attribute utility theory (MAUT) [35], analytic hierarchy process (AHP) [36], elimination and choice expressing reality (ELECTRE) [37], and technique for order of preference by similarity to ideal solution (TOPSIS) [38]. The weightings were extracted from two samples, a sample group of decision makers/stakeholders and a sample group of experts on water resource management, in contrast with most approaches where the users (farmers) constitute the sample. This is an innovative element of the study, as the opinion and perception of the actual policy makers is retrieved.
In this study, seven (7) alternative strategies or management scenarios were developed and four (4) MCA methods were applied, aiming to reduce the irrigation water demand of the watershed according to sustainable water resource management principles, and proposing more efficient operation of the local economy. A watershed in Greece, which is based on agricultural economy and faces water scarcity problems, was used as a case study. The design of the approach, with the factors considered, arose from the general need for more rational water resource management in Greece, and is an innovative case study application. After analysis of the model’s results, the performance of different methods and different samples could be compared. Thus, an integrated and impartial DSS is provided, as it is able to suggest the most appropriate method for the examined problem and to provide a well-rounded point of view regarding the questioned sample. It also contributes to completing and expanding the decision makers’ knowledge, as well as helping and supporting their decision making process, and includes the experts’ opinion.
2. The Studied Problem
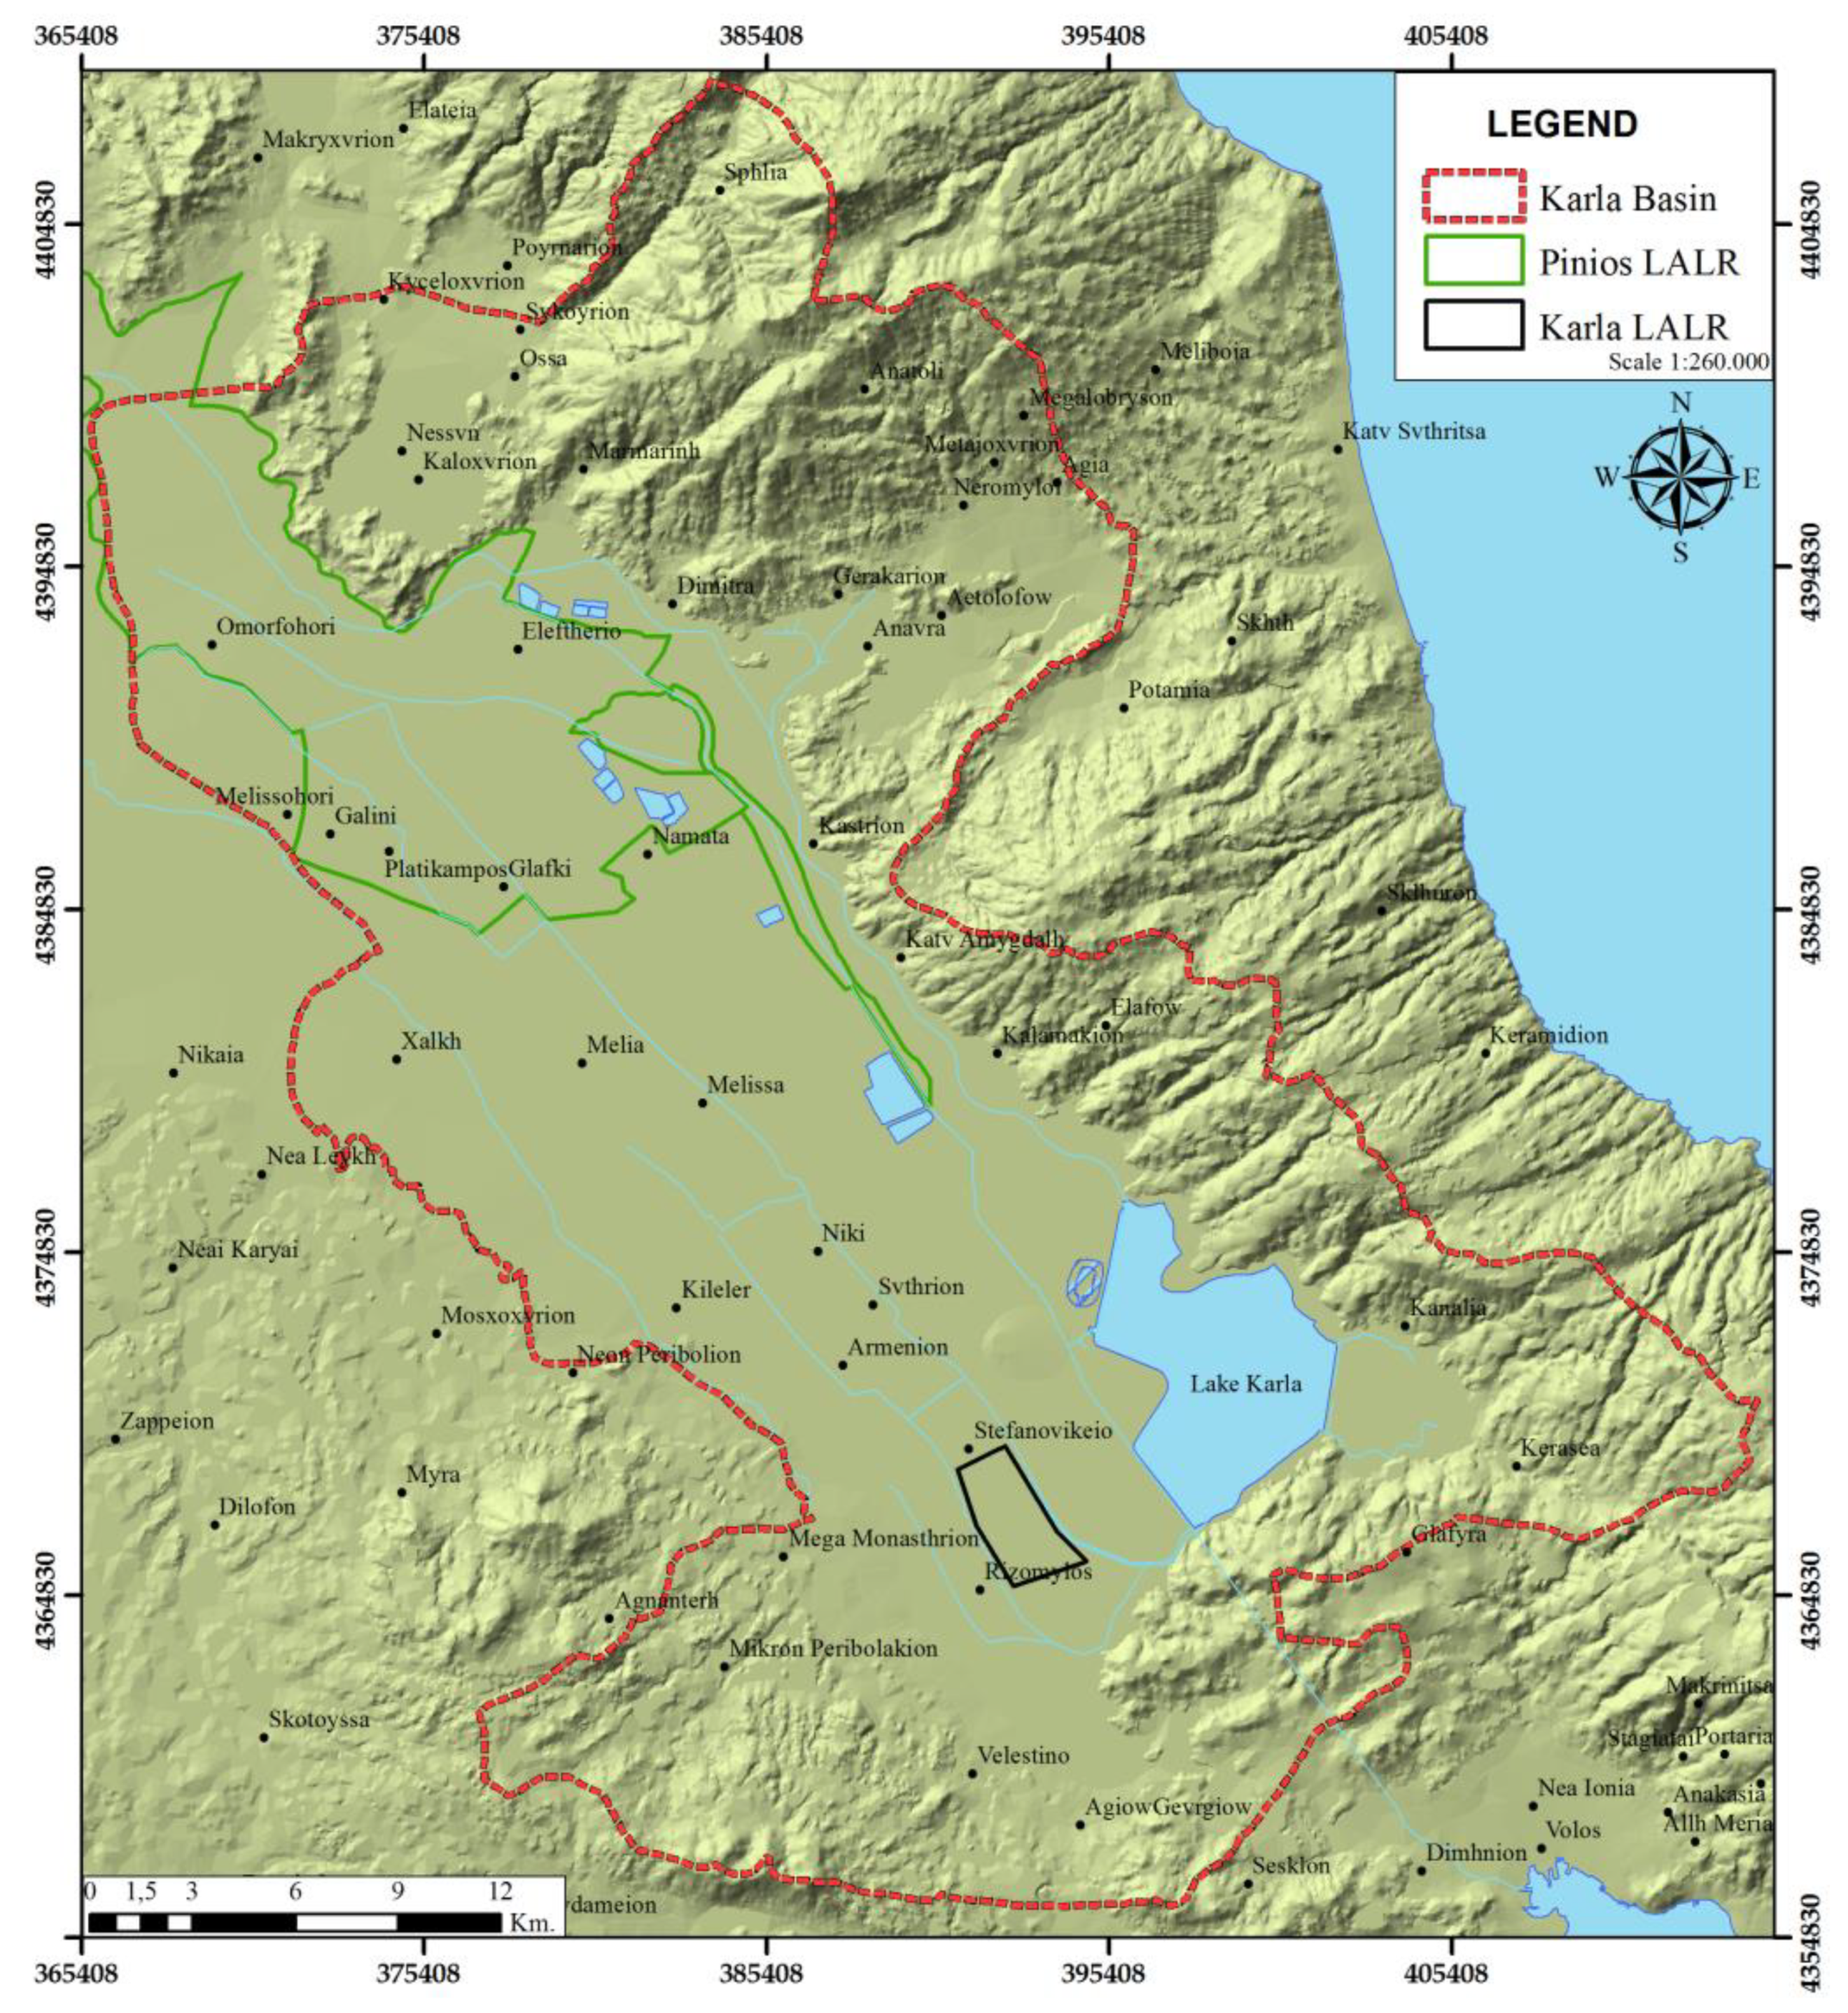
One of the most important problems in South Europe, and also worldwide, is water scarcity. Whether as quantitative deficit or qualitative degradation, whether in terms of lack of economic tools and investments to exploit the available water resources, coverage of the demand is becoming tougher. The policies of increasing water supply, treating water as a non-depleting good, especially in the agricultural sector, have brought significant environmental impacts. Greek irrigated agriculture faces such problems, too. Agriculture is the largest water consumer, with difficulties in its management and high productive and economic objectives. Thus, it is essential to provide solutions able to achieve economic objectives under environmental constraints. The studied case application concerns a contemporary problem of irrigation water management. The study area is Lake Karla Watershed, located in central Greece (Figure 1), in the southeast of the Water District of Thessaly, between Volos and Larissa. Its main water supply source for irrigation water use is the aquifer, which is severely overexploited, and the Pinios River. The natural Lake Karla was drained in 1962 for flood protection and more farmland. However, a number of environmental problems occured, such as depletion of the underlying aquifer, pollution of the groundwater, floods, and extreme climatic events. Due to severe over-pumping of the aquifer, the groundwater level fell about 200 m below the earth surface. Most of the water is pumped from the permanent groundwater stock [39]. These problems led to the decision to reconstitute the former lake, by constracting a reservoir and irrigation network to use the reservoir stored water for irrigation of the agricultural fields adjacent to the reservoir and, consequently, stop the groundwater pumping.
The restoration works begun in 1981 and completed in 2010. Today, the reservoir is being refilled from the Pinios River until it is ready to operate and irrigate an area which is currently served from groundwater, deteriorating the aquifer further. The authorities responsible for water management in the watershed are the Local Administration of Land Reclamation (LALR) of Pinios (which serves an area of 154 km2, mostly covered with a surface irrigation network) and Karla LALR (which serves an area of about 10 km2 and the future localized pipe irrigation network). The LALR’s management is very poor, without complete databases, records, and economic management tools. Furthermore, the water balance of the watershed is negative [40,41], while the irrigation water use is not billed at all, providing no incentives for conservation [42].
Seven alternative strategies (management scenarios) were developed, aiming to reduce the irrigation water demand of the watershed according to sustainable water resource management principles, and to support more efficient operation of the local economy. It should be clarified that, today, the Lake Karla reservoir has been constructed and receives water inputs, but it does not operate to supply irrigation water to the adjacent agricultural fields because the irrigation network of Karla LALR is under construction. There are a number of funding and management issues that should be resolved before the reservoir operates as planned. For this reason, the non-operation of Lake Karla reservoir is considered in the following future scenarios and strategies (i.e., scenarios 1a and 1b). The strategies used were simulated in our previous works [41,43]:
- Scenario 1a: Reducing water irrigation losses in the current situation. The Karla reservoir is not active yet. Water needs are covered from the groundwater aquifer and from the Pinios River. This can be practically achieved by cleaning and maintaining the irrigation canals.
- Scenario 1b: Replacing irrigation methods with more efficient methods than the current situation. Previous field surveys have shown that the majority of the basin’s farmers are using sprinklers. This scenario was developed based on the assumption that sprinklers are replaced with drip irrigation, which is more efficient.
- Scenario 2: Future situation (operation of the reservoir and the new Karla network). Some new irrigation areas can be served from the reservoir’s surface water (instead of the underlying aquifer). To implement this scenario, the local authorities need to ensure that the water from Pinios will reach to the reservoir.
- Scenario 2a: Replacement of 25% of cotton crops with winter wheat, in Scenario 2.
- Scenario 2b: Replacement 20% of cotton crops with 10% winter wheat and 10% maize. The development of the crop replacement scenarios was based on the crop distribution of the watershed during the past ten years, and on some factors that affect the farmers’ decisions on what to cultivate (e.g., subsidies and product prices timeseries). The trends are also in agreement with the objectives set by the Common Agricultural Policy (CAP 2015–2020), which provides more incentives for cultivating less water consuming crops [44].
- Scenario 2c: Reducing water irrigation losses in Scenario 2, in the same way that was considered in Scenario 1a.
- Scenario 2d: Replacing irrigation methods with more efficient methods in Scenario 2, according to Scenario 1b.
The proposed DSS evaluates the above scenarios, using the MCA techniques mentioned in the introduction section, under the following criteria:
- Criterion 1: Water balance. The water supply, the crop distribution and areas, and the water demand of the watershed was estimated. The irrigation water requirements were calculated by using CROPWAT 8.0. software [45] and were adjusted for the water supply network and the irrigation method efficiency, which were estimated from a field survey. Thus, the water balance was calculated [41].
- Criterion 2: Net Profits. Data concerning crop distribution, average yields, product prices, subsidies, and production costs, were collected. A simple logistic model was developed and implemented in order to calculate the net profits from the agricultural activities [43].
- Criterion 3: Full cost of water. According to the European Framework Directive 2000/60, and of course the Greek Ministry of Environment [44], the full cost of water has to be taken into account in every water resource management plan. It is the sum of the three following costs:
- ○
- Monetary (or direct) cost: the cost for the water supply company. The financial data of the annual balance sheets of Pinios and Karla LALRs were collected and used in order to estimate the capital cost, the cost of maintenance and operation, and the administrative cost (at their present value).
- ○
- Natural resource cost: the cost associated with damage or negative impact on the aquatic environment in terms of water scarcity or resource misallocation. It was treated as: (a) the opportunity cost (lost profits) due to the exploitation of the water resources faster than their natural rate of renewal [46]. This was estimated as the net profit that occurs if the deficit water (from the water balance) is distributed to the existing crop pattern. (b) The opportunity cost, since the water may be not allocated to its optimum use, but to other less profitable uses [46]. Then, the natural resource cost expresses the difference between the current and the optimum water allocation [47]. The optimum use is actually the optimum crop distribution resulting from a net profit maximization problem, with environmental constraints.
- ○
- Environmental cost: the cost associated with the damage of use, or negative impact on the aquatic environment in terms of qualitative degradation. The environmental damage is equal with the cost needed to bring the environment back to its original state [46], and therefore associated with the cost of restoring the quality of the water used in its original condition (maximum allowed pollutant concentrations for irrigation) [44].
These specific criteria were chosen because they are the most appropriate and representative to illustrate the sample’s opinion, perception, and comprehension of the environmental (water balance) and economic (net profit) components of the system. The usage of terms like full cost of water is interesting for checking how familiar the decision makers are with these new concepts that are about to be implemented, and how they connect it with their decisions. Using the minimum possible number of criteria demands less effort from the decision maker and makes the analysis simpler. The exclusion of other criteria (e.g., water quality, irrigation water costs, efficiency indices, etc.) has been done after a correlation test among them. Thus, the independence and sufficiency of the examined criteria was ensured. The performance values of the management scenarios under the selected criteria were calculated as described above, and the results are presented in the following Table 1.
Although Scenario 2C seems to be the most beneficial regarding the results, it cannot be considered to be the most appropriate solution a priori. Nothing is obvious, as most of the respondents did not consider the same criteria important. The high values of Criterion 3 for the alternatives 1B and 2D, for example, are due to the high installation cost of drip irrigation, which many consider will be covered by a state subsidy. Furthermore, in some other cases, scenarios 2B and 2A were considered more appropriate, as some respondents (mainly from the authorities of the decision makers group) believed that they will be more profitable, in long term.
3. Methodology
As mentioned before, the model consists of four MCA methods (MAUT, AHP, ELECTRE and TOPSIS), for the evaluation of alternative management strategies (scenarios). At an earlier stage, more methods were tested. It was considered better to present these four methods, as they suited better to the problem and are based on the four most representative theories of the MCA, and to list their advantages and disadvantages as recommendations for application to similar problems, rather than to directly provide the most appropriate one. The weightings were retrieved through a questionnaire survey from a sample of experts and decision makers/stakeholders. The questionnaire was formed based on the weighting method, which is necessary for the implementation of each MCA method. The following scheme (Figure 2) describes the logic of the analysis.
Hereafter, the theoretical background of the techniques used is explained. Firstly, MAUT is based on Utility Theory, a fundamental of the theoretical development and practical implementation of MCA [48,49]. The studies of von Neumann and Morgenstern, and Savage in 1940–1950, modelled a value-weight system, similar to a decision maker’s logic [50]. MAUT became the most indicative example of using utility functions [35,51,52]. Today the additive utility function is its most widely used form [53], where the alternative with the highest utility is considered to be the most appropriate. The method uses sub-criteria (in contrast with the other three techniques used) for the developement of the utility functions, so for Criterion 1, three sub-criteria were developed: sub-criterion 1.1 for the water balance of the areas serviced by Pinios River, sub-criterion 1.2 for the water balance of the areas serviced by the aquifer and sub-criterion 1.3 for the water balance of the areas serviced by the new Karla reservoir. For Criterion 2, two sub-criteria were developed: sub-criterion 2.1 for the gross revenue, and sub-criterion 2.2 for the total production cost. Finally, for Criterion 3, three sub-criteria were developed: sub-criterion 3.1 for the monetary cost, sub-criterion 3.2 for the natural resource cost, and sub-criterion 3.3 for the environmental cost. Table 2 shows their performances.
Again, the independence and the sufficiency of the examined sub-criteria was ensured, combined with the rationale of including the concept of the natural resource cost, as a necessary factor to ask. In line with the findings of other researchers [54,55,56,57,58] on how realistic it is to achieve the preferential independence assumption, some test runs were done without the sub-criteria of the resource cost and production cost, and the results were almost the same. We preferred to present this set of sub-criteria for the sake of completeness [59]. The performance values of the alternatives under every sub-criterion were normalized (on a 0–10 scale). These normalized values were multiplied by the respective weights for each sub-criterion. The sub-criteria values were added for each criterion. Thus, for each one of our three criteria arose seven values that correspond to each alternative. For each criterion, the values (vi) of the sums of the above step (which correspond to each alternative), were multiplied with the alternatives’ weights (wi), and the sum-product of the above was found (additive utility function—U(i)):
The second method used in the model was the analytical hierarchy process (AHP), which classifies the alternative solutions in a way that ranks them by assigning and distributing weights of significance of the defined criteria [36]. The method was developed by Thomas Saaty (1980) in an attempt to fill the knowledge gap of easily understandable and applicable methods of complex decision making processes, and since then the method has been widely used. The advantage of the method is summed up by the fact that it facilitates the organization of the problems and the formation of the complexity, the measurement and the synthesis of the rankings [60]. The alternatives’ ranking is accomplished with binary comparisons based on the preferences of the stakeholders, regarding the criteria and the alternatives under each criterion. The decision makers can characterize a specific comparison as ‘equal’, ‘marginally strong’, ‘very strong’, and ‘extremely strong’ [36]. The degree of randomness of the answers is expressed by the Consistency Ratio (C.R), which has to be smaller than 10%. For the studied problem, the respondents gave weights to a 3 × 3 criteria matrix, and to three 7 × 7 alternatives matrices, one for each criterion. The right principal eigenvector was calculated for the comparison matrices. Subsequently, the synthesis of these preferences were carried out to determine which variable presented the higher priority and effect on the estimated results [61]. Through the comparison relations the alternatives were weighted (aij), for each criterion (3 criteria—wj), and a value occurred for each alternative (i), as follows:
The alternatives were ranked in descending order of the resulting values (), i.e., in order of suitability.
The third method of the model is based on the outranking theory, developed by Roy [37,62,63] by his studies on the methods of the ELECTRE family (elimination et choix traduisant la realité). The methodology of ELECTRE uses a series of comparisons between the alternatives. The superiority (outranking) relation is a mathematical expression that represents the decision maker’s preferences. Overall weightings or preference threshold can be used to consider an alternative superior to another [64]. In the studied problem, the overall weightings were used for the formation of the outranking relations, since they were available from the questionnaires. The ELECTRE method allows the general ranking of alternatives, while also allowing separate pairs of alternatives to remain non-comparable, when it is not possible due to insufficient information. On the contrary, any of the theories described above provides a single ‘score’ for each alternative, requiring all options to be directly comparable, even when such comparisons are questionable due to lack of appropriate data [65]. In further detail, the development of the outranking relationships takes place in two phases, dealing with two principles: concordance test and discordance test (indices). The principles are evaluating the claim that an alternative prevails (or not) over another. The principle of the agreement requires that a majority of criteria, after calculating their relative importance, support the claim (majority principle). On the other hand, the principle of disagreement requires that within the minority of criteria which do not support the claim, none of them is strongly against the claim (principle of respect for minorities). Finally, the synthesis of these relations and the results occurs from a credibility matrix. The method needs weights for each criterion j (wj) in order to calculate the concordance index C(a, b) for each pair of options (a, b):
This is based on a general comparison of the performances of option a and option b over all the criteria. Parameter cj(a, b) varies from 0 to 1, with a value of 0 indicating that alternative a is worse than alternative b for all criteria, and a value of 1 indicating that there is no criterion for which b is better than a. The discordance index D(a, b) is calculated respectively, in order to express the disagreement to the claim. The credibility matrix (Sj) indicates the reliability of the outranking hypothesis. If the concordance index is higher than or equal to the discordance index for all criteria, then degree of credibility is equal to concordance index. If the concordance index is strictly below the discordance index, then the degree of credibility is equal to the concordance index, lowered in direct relation to the importance of those discordances:
where π(a, b) is the set of criteria for which Dj (a, b) > Cj (a, b).
One of the advantages of MCA compared to the optimization theory is the classification of the alternatives, using their performance on already established standards (criteria). For this purpose, the developed model also includes the TOPSIS method, established by Hwang and Yoon [66], as a simpler and easier-to-use alternative method to ELECTRE. It sets the best and the worst solutions as comparison measures. Firstly, it calculates the ideal (R+) and the worst (R−) solution for the examined problem. This can be calculated by giving the highest weighting for each criterion, according to its theoretically maximized (A+) or minimized value (A−) [38]. The alternatives are ordered between the best and the worst solution, based on the distances of their respective performances under the criteria’s weights. These distances are calculated by the Euclidean Metric [67], with the following equation, indicatively for the ideal solution:
The worst solution (R)− is calculated accordingly. Thus, the most appropriate alternative is the one that is closest to the ideal solution. The closeness index (C.I.) expresses this similarity with the optimal solution [68]:
This direct comparison of the alternatives in TOPSIS, using their performances, is also similar to utility theory [69]. According to Kim et al. [70] and Shih et al. [71], this mathematical approach of TOPSIS represents human logic with a simple calculating process. These key advantages make TOPSIS one of the main MCA techniques. Table 3 presents the theoretical background, the weighting method, and the way each MCA technique was used in the studied problem.
Each of the methods in this model was applied for each respondent separately. As mentioned before, the total sample (60 respondents) was divided into a group of (32) experts and a group of (28) decision makers. The group of experts consisted of members of the Laboratory of Hydrology and Aquatic Systems Analysis of the University of Thessaly (Professors, Teaching Assistants, Post-Doctoral Researchers, PhD and Master Students). The contribution of Professors working in the field of Water Resources from other Greek Universities was also significant. The group of decision makers consisted of all the authorities responsible for water management of the area, namely, the Decentralized Management Agency (Water Directorate), the Department of Hydro-Economy from the Region of Thessaly, the Management Agency of the broader Karla watershed, the Agricultural Agency of Land Reclamation (AALR) of Thessaly, Pinios and Karla LALRs, and the Institute of Industrial and Livestock Plants (IILP) of Larisa. This approach aimed to evaluate and compare the results of the two groups, in order to provide useful outcomes regarding the existing policy of the area. The beliefs of the authorities on what they considered to be more beneficial for the study area, as expressed through the MCA process, provided a measure for their own assessment, something that has not been considered in the approaches so far. Their weightings expressed their perceptions of the situation and their priorities on dealing with the existing problems. The resulting uncertainty focused on the weights (ranges of different preferences) of the respondents, and the different results of the techniques used.
4. Results and Discussion
4.1. Results of MAUT Method
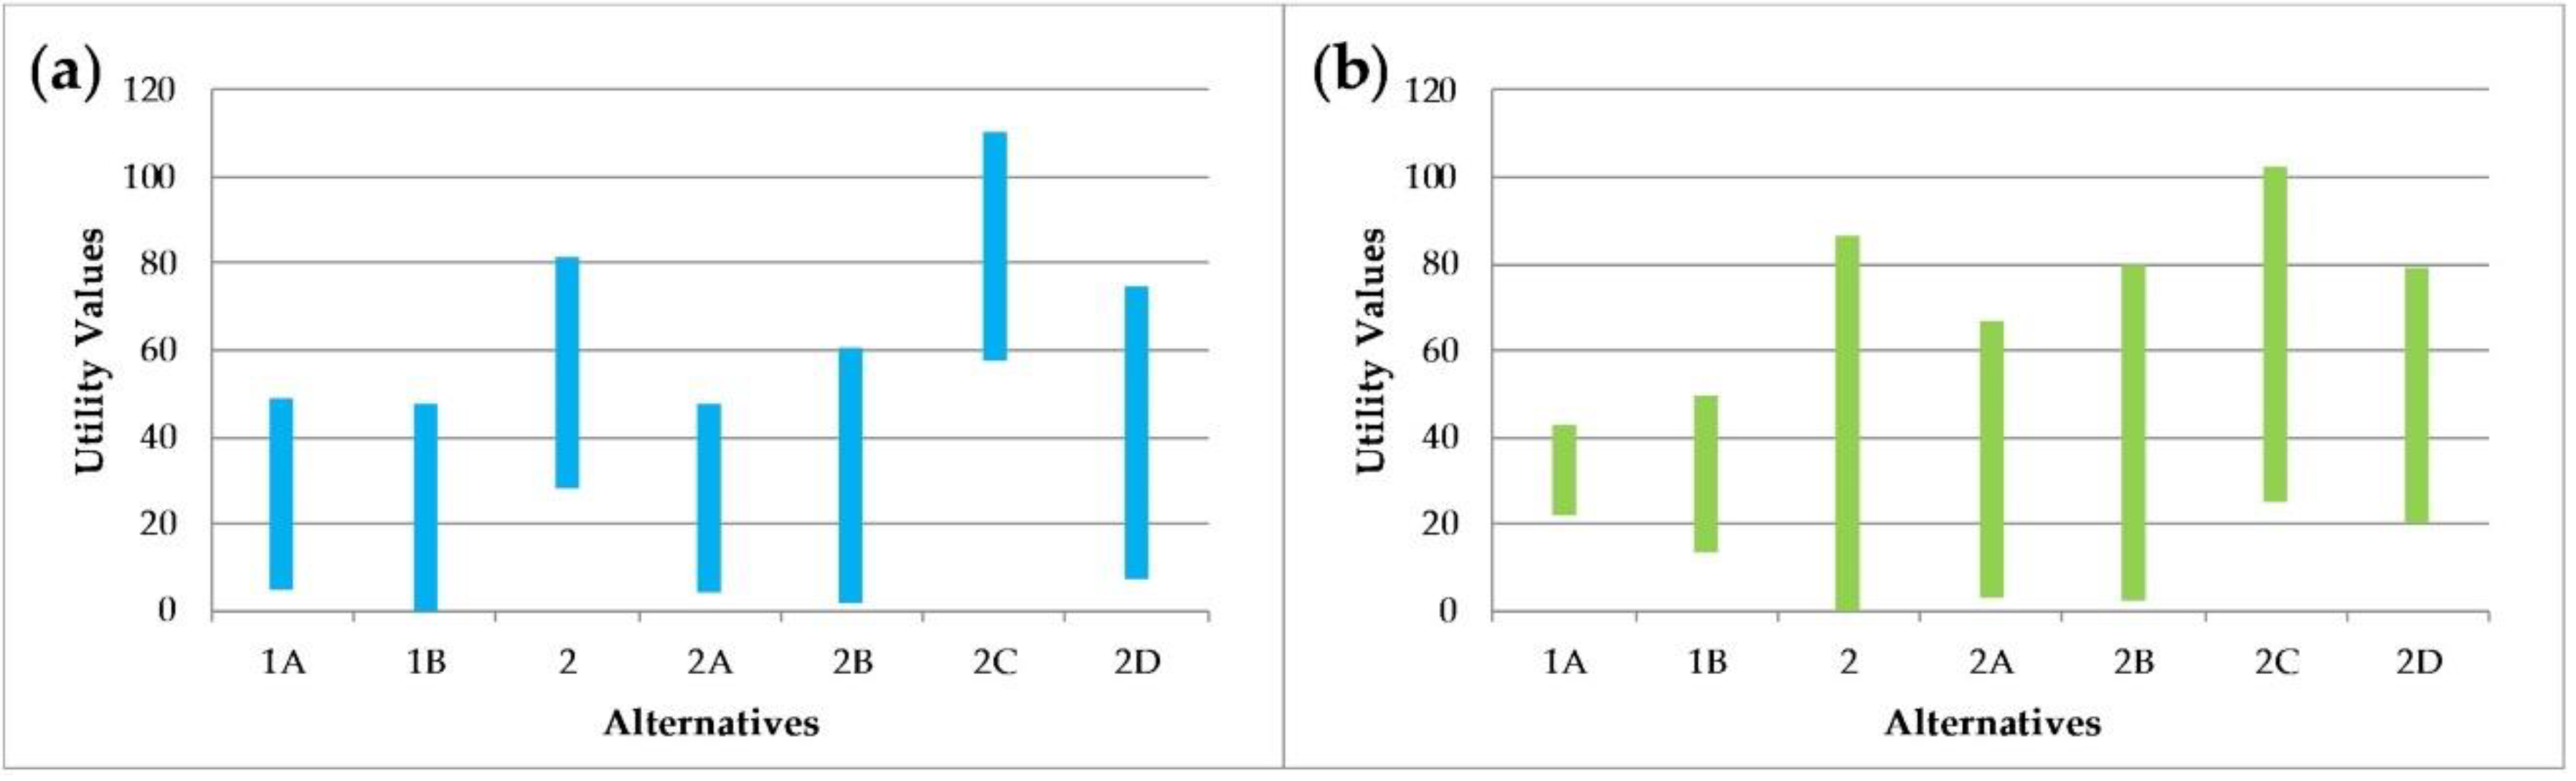
For the needs of the MAUT method, the sample was asked to give weights for the described criteria’s sub-criteria. The alternatives were thus evaluated from the two sample groups, following the procedure described in the methodology section, as shown in Figure 3.
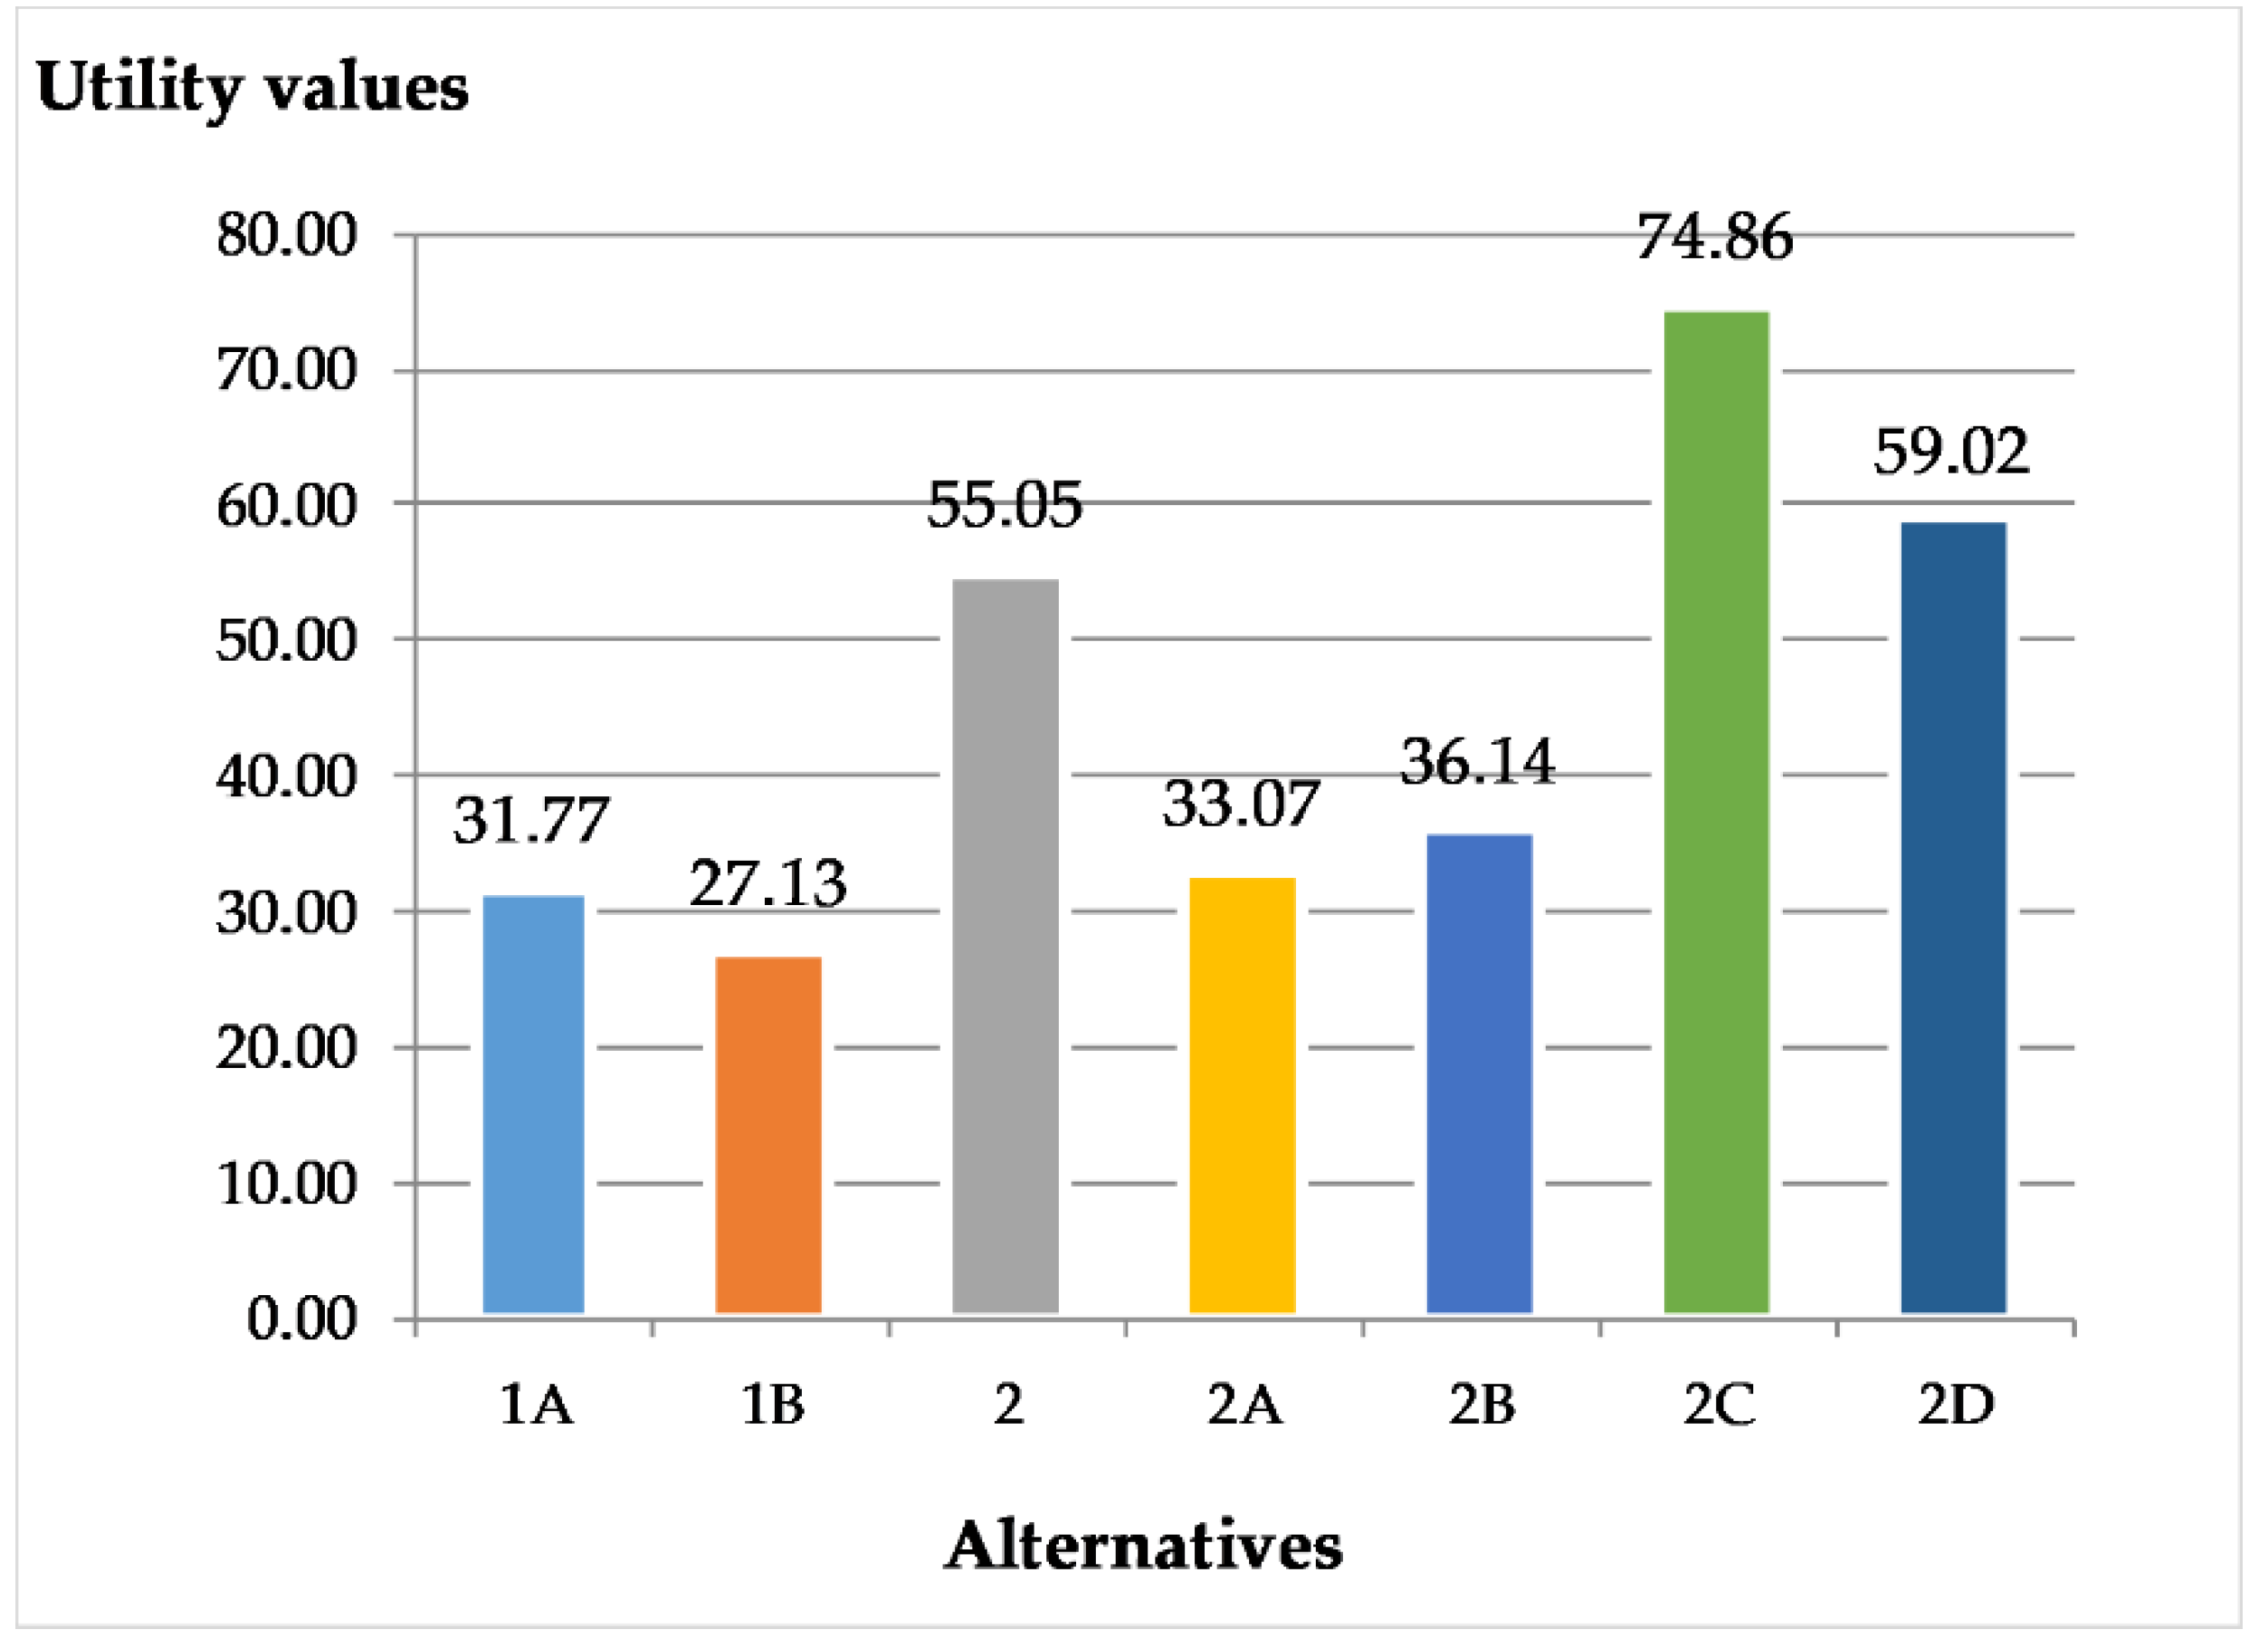
The distribution of the results was similar for the two sample groups. For the whole sample, the alternative 2C seemed to be the most appropriate, followed by the alternatives 2D, 2, 2B, 2A, 1A and finally 1B (Figure 4).
From the data processing, it was observed that the group of experts considered the ‘environmental’ sub-criteria more important, as opposed to the DMs, who showed a preference for the ‘economic’ sub-criteria (Figure 5). The DMs considered that the water balance was also important, but with a wider range of weightings, while the concepts of the full cost of water were still less understandable.
The above charts also show the agreement (or not) of the respondents to a sub-criterion. That is, a zero range would theoretically mean complete agreement, and vice versa, a wide range would mean that the opinions differed.
4.2. Results of AHP Method
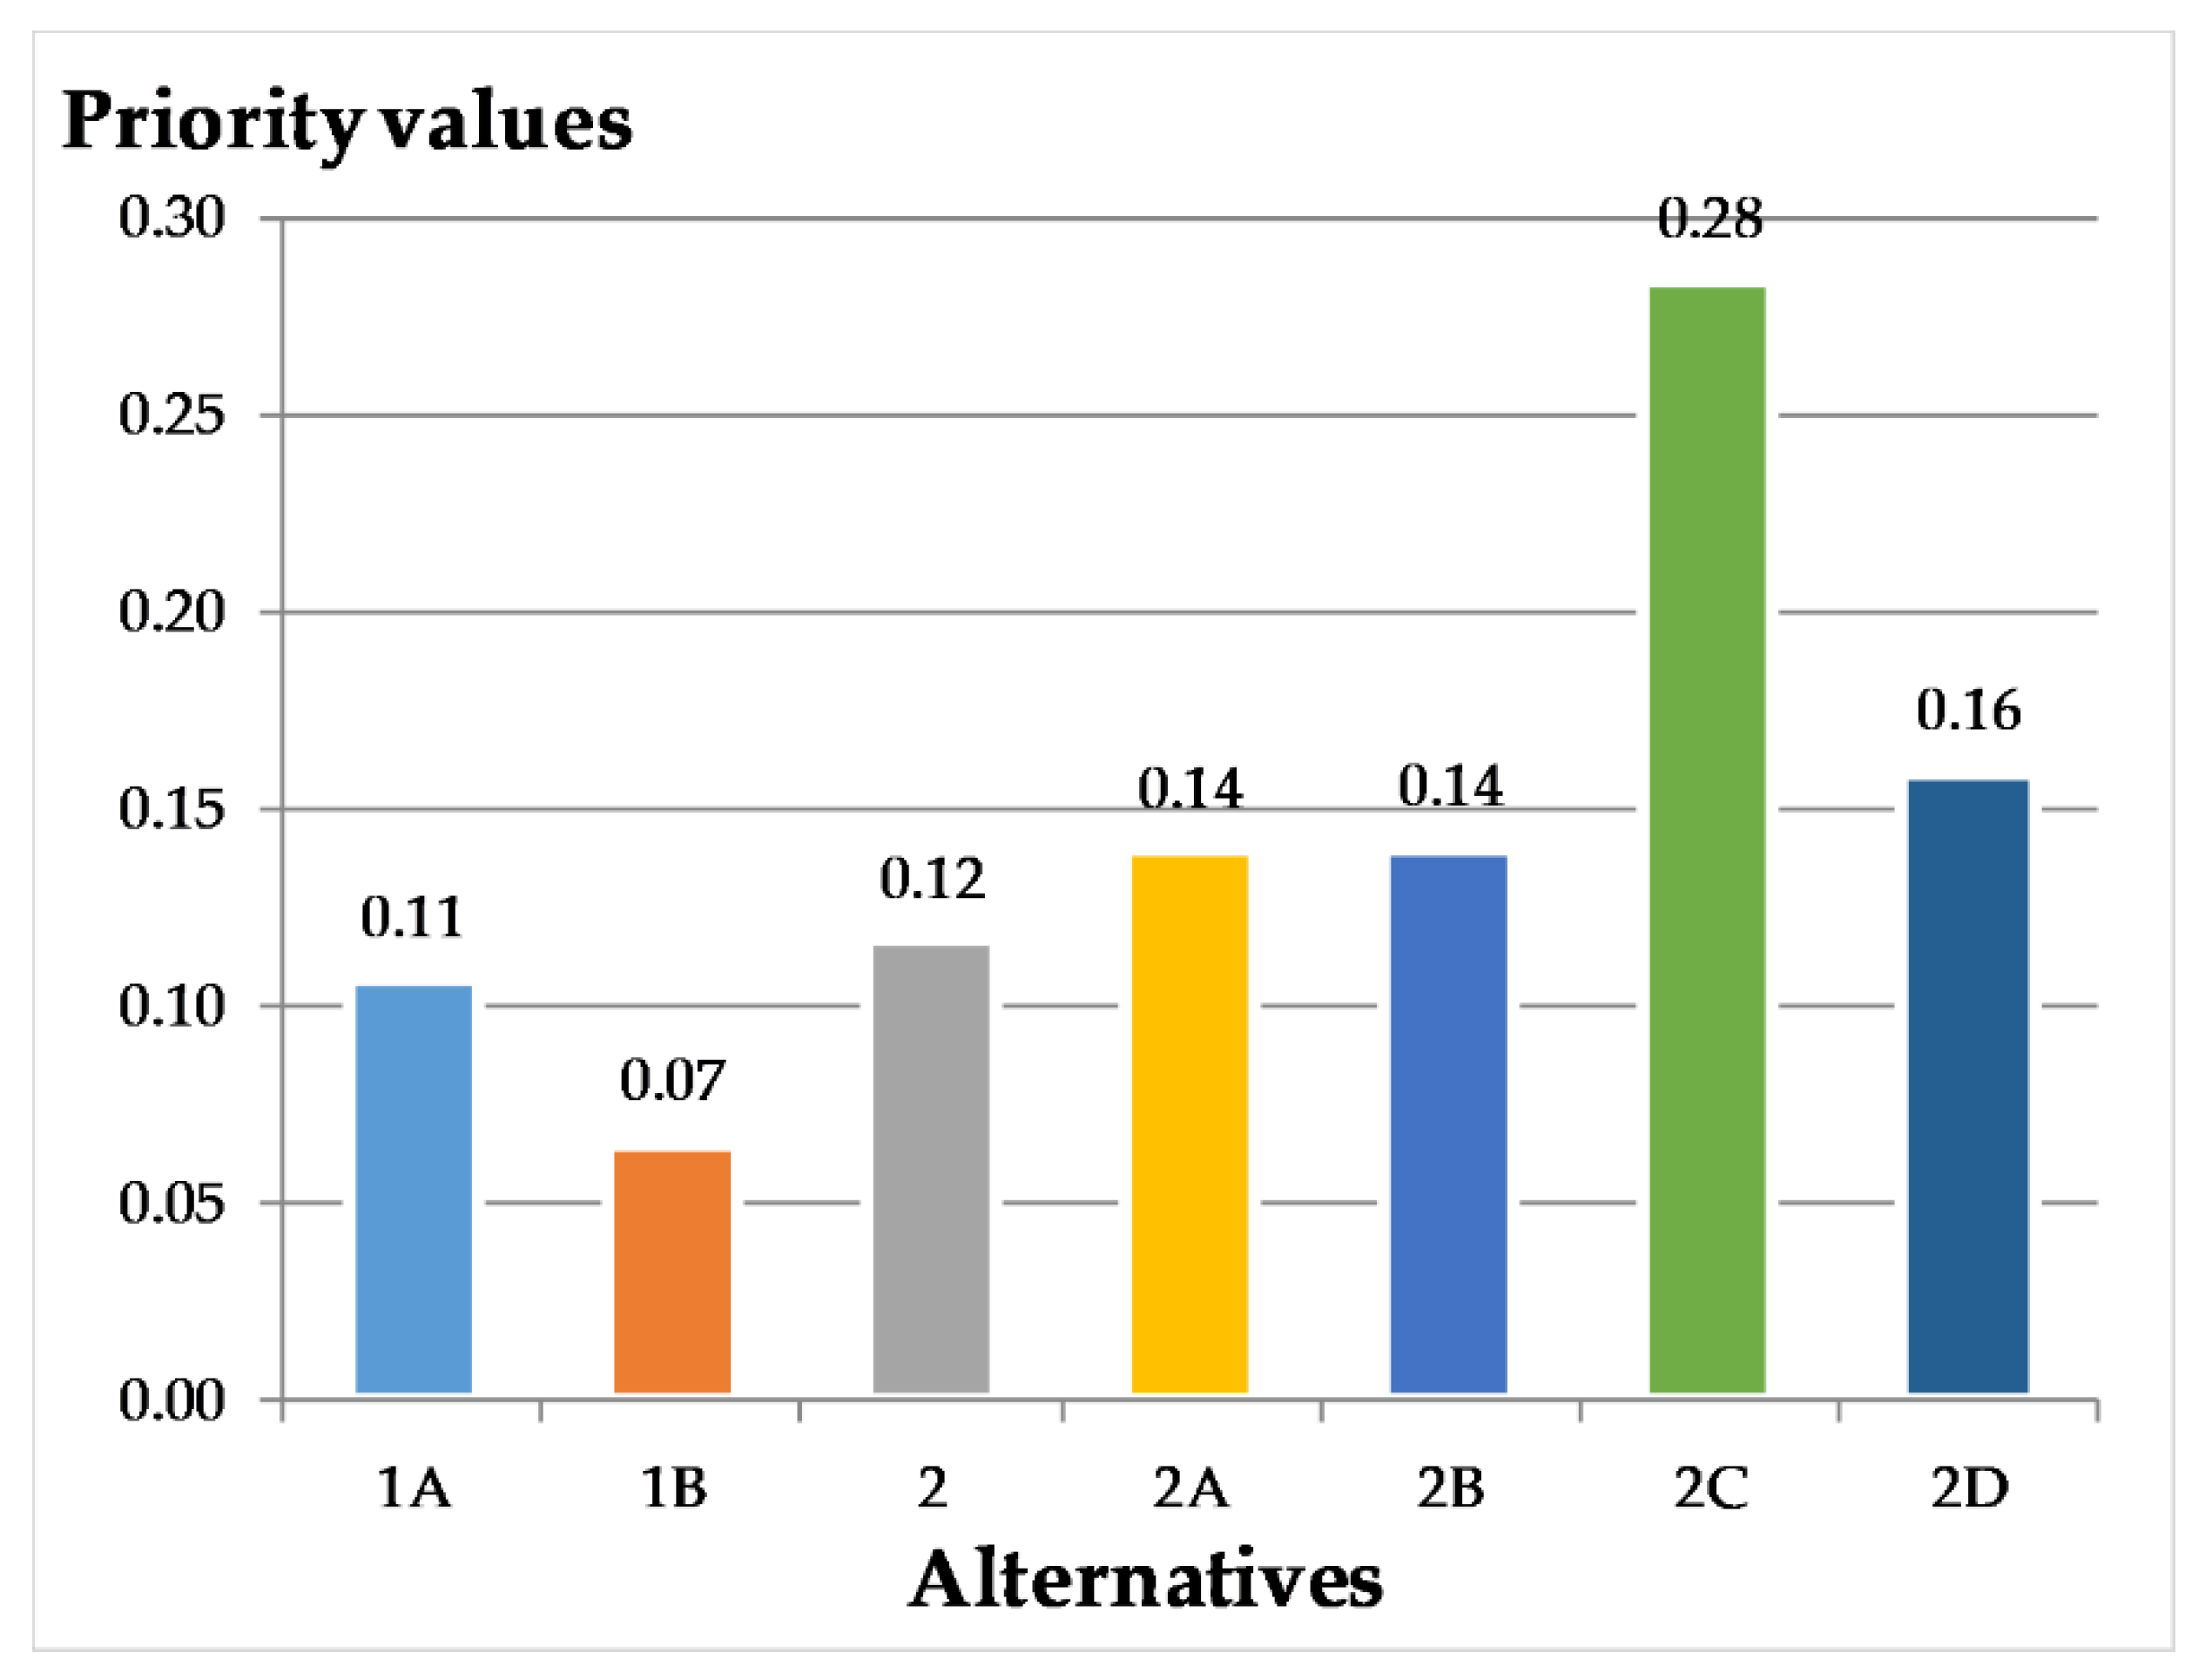
The results of the procedure are shown in the following diagrams. Figure 6 represents the results’ range for the two sample groups, while Figure 7 shows the overall priority values. The results of the group of experts gave a smaller range of priority values than those of the DMs. The results of the DMs showed slightly higher disagreement on the priority values of the alternatives 2 and 1A, but mainly on the alternative 2B. The alternative 2B had such high range values because some respondents considered it to be a very profitable solution.
The hierarchical order shows differences between the two groups, which are explained by the values that each alternative prevailed for each respondent. In the sample of experts, 2C prevailed more times with higher priority values. In the DMs group, 2C had lower values every time it prevailed, in contrast with the higher scores reached by 2D, 2B and 2A. In general, the results of the DMs were more one dimensional, since the alternative prevailed each time, and had much higher scores than the experts’.
4.3. Results of ELECTRE Method
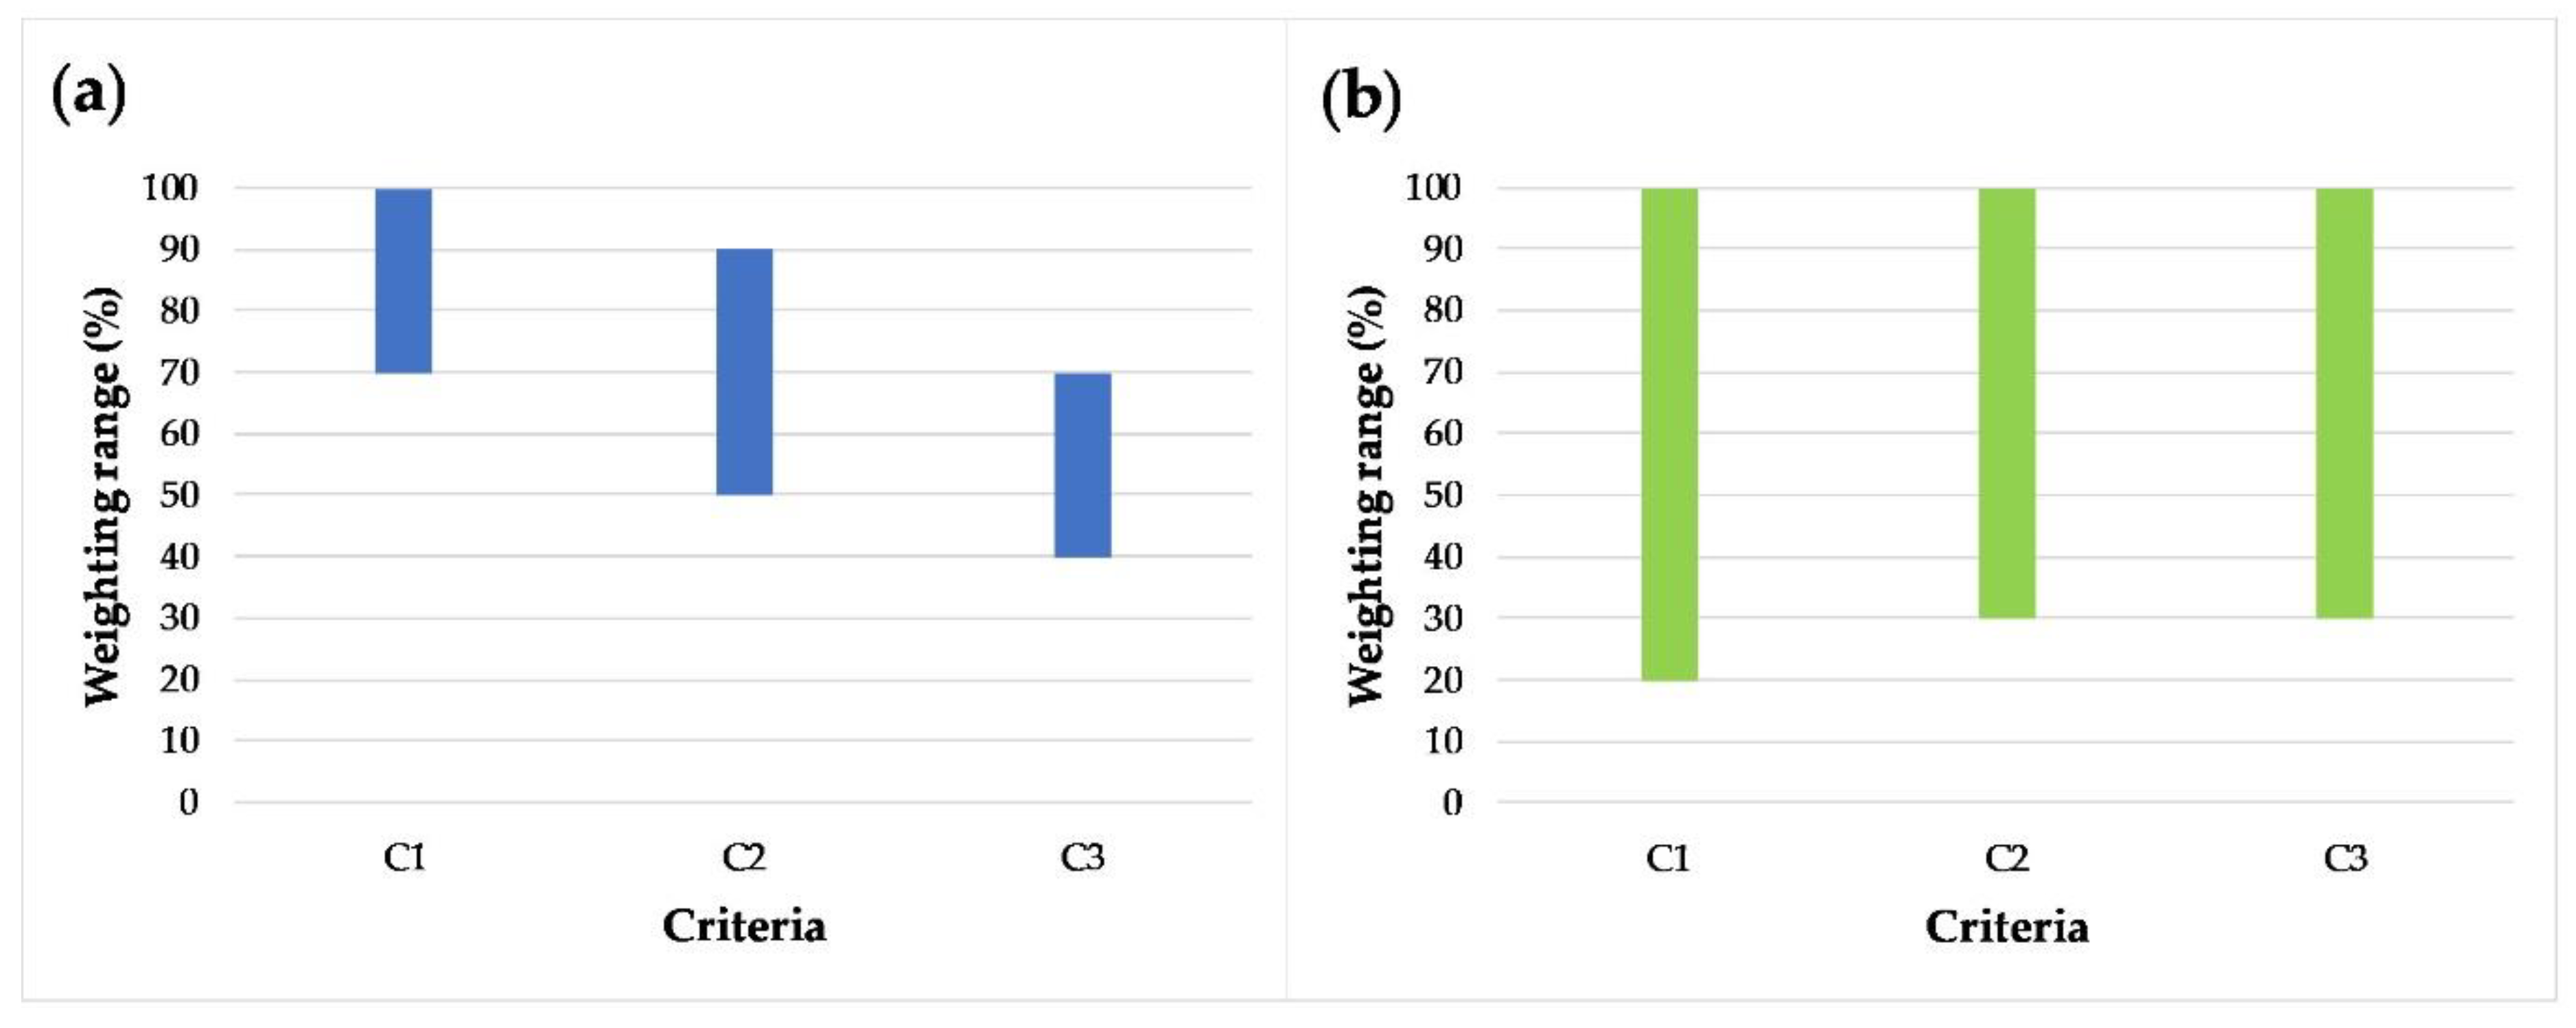
This method does not give values to evaluate each alternative. The outcome of the process only shows which alternative prevailed (outranked the others) through a process of pairwise comparisons. The results of both sample groups, as well as the total results, are in agreement that Scenario 2C is the most appropriate management strategy. An interesting statistic of the method is the range of each criterion’s weightings (Figure 8). This grading was a result of the common questionnaire of the ELECTRE and TOPSIS methods, so the following statistics are representative for the TOPSIS method as well. As is also explained in the MAUT method, the study of the weightings’ range can give useful insights for the significance, the preference of the criteria, and the agreement among the respondents of the same group.
The experts gave a constant range to their answers, and there was a general agreement among them. This also shows an agreement in the conceptual perception of the criteria. In the experts’ weightings, there was a clear preference for the first criterion, so they strongly believed that the improvement of the water balance should be a managerial priority. Thus, a lower water cost will also be achieved, so their second priority was clearly the profits. The DMs group cannot be characterized with the same uniformity in its weightings, and most of them considered the net profit as the most important factor.
4.4. Results of TOPSIS Method
In this method the results of the two sample groups were almost equal, and the alternatives’ ranking was the same. It was commonly agreed that Scenario 2C was the closest to the optimum solution (=100), and Scenario 1B was the closest to the worst solution (=0). In second place was Scenario 1A, indicating that improvement can be achieved in the system just by reducing the losses. The alternatives 2A, 2D, 2B and 2 followed (Table 4). The ranges of the results from the whole sample were small, indicating the method’s low uncertainty. For example, the closeness index range for alternative 1A was 0.486, for 2 it was 6.357, for 2A it was 4.558, for 2B it was 5.634, for 2D it was 3.189, while for 2C and 1B it was 0.
So, it was unanimously accepted how close each alternative was to the predefined optimum and worst performances of the system. Scenario 2C owes its first place to the impact of the loss reduction, and also to the impact of the reservoir operation. Reducing the losses will have a higher short-term impact on the water balance, but the reservoir’s operation will have a long term impact on the enrichment of the aquifer.
The higher environmental benefits of Scenario 2 when compared with Scenario 1A cannot be illustrated by the results of TOPSIS. The closeness index may result in low uncertainties, due to the use of distances strictly based on the performances of the alternatives, but this can be temporary. To overcome some modeling weaknesses or defined settings, such as in this case, a deeper knowledge of the studied system and understanding of the simulated problem is needed.
4.5. Overall Results
The ranking of the examined management strategies for all four MCA techniques used was quite similar and they did not vary much. In order to have an estimate of the uncertainty of the idividual responses on the results, 60 runs (all the individual stakeholder and expert responses) were run for each MCA method. Table 5 shows how many times each alternative prevailed out of 60 runs for each MCA method, the aggregated results for all MCA methods, and the total number of runs (i.e., 4 methods × 60 responses = 240 runs).
Overall, 2C came first with 72.5%, followed by 2D with 7.9%. In the third place, Scenario 2B took 2.5%, followed by 2 with 2.1%, 2A with 1.25%, and 1A with 0.84%. Scenario 1B came last with an overall percentage of 0.42%. An interesting fact from the above Table is that the experts had a higher percentage of agreement on their results than the DMs. For example, the total ‘wins’ of the alternatives 1A, 1B, 2A, and 2D resulted from the group of DMs. The alternatives 2 and 2B prevailed only one time each, in the group of experts.
5. Concluding Remarks
This work provides an integrated decision support tool for evaluating water resource management strategies. The problem of the water resource management of a rural watershed facing water scarcity and poor management was used as an example. Four MCA techniques were combined to evaluate seven alternative policies under the criteria of water balance, net profit, and full cost of water, thus providing a useful and applicable tool for similar problems. A questionnaire was formed, based on the weighting technique required by each MCA method. Two sample groups were used for evaluation of the criteria and the alternatives, an expert and a decision maker group. This division of the sample was followed in order to illustrate the differences in the perception of the problems, and the solution approach, expressed by the responsible authorities and by experts in the field of water management. The main difficulty of the study was the implementation of the methodology through interviews. Even though the questionnaire had an average completion time of 20 minutes, the response, especially from the decision makers, was initially poor. Most of the decision makers who work in the responsible authorities for the water management of the watershed are not well trained, adequately aware of the concepts of water resource management, or informed on the about-to-come measure of the full cost of water. Also, some of them consider that as it is possible to irrigate the farms of the watershed at the moment, there is no need to discuss the issue. Subsequently, it was time-consuming to explain the situation, the nature of the survey, and finally to gather a sufficient sample who were willing to cooperate. The group of experts showed largest interest and was more willing to respond.
Regarding the techniques used, all of them agreed as to the most appropriate alternative. They resulted in different values for the ranking of the alternatives, however, the decision on the most appropriate alternative was clearly ‘unanimous’. Thus, all the methods could be used for the specific problem, but the most fitting was the one that best represented the situation and the sample’s opinions. A way to evaluate these methods is the usage of randomness, consistency, and reliability tests, when they exist. In MAUT, a reliability test can only be carried out indirectly, while TOPSIS and ELECTRE do not allow any tests [72].
AHP needs randomness and consistency tests, as it is the only method that examines pair-wise comparisons, so it is a method in which inconsistency may arise. On the other hand, the disadvantage of AHP was its usability, due to the repetitions needed to reach the acceptable consistency limits, and the difficulty or inability of some respondents to understand the problem and the weighting relationships. Another disadvantage of the AHP method is that, in the specific problem, it is based only on the weightings of the respondents and the performances of the alternatives are not used, although they are known. The exclusion of the alternatives’ performances for a water resource management problem can be a solution when these results include high uncertainties (from the earlier simulation stages) but in general, as well as in the studied problem, this is not the most reliable way to make decisions.
Based on outranking theory, the results of ELECTRE I are actually the outranking relationships among the alternatives, thus showing which alternative prevailed over the other for every pairwise comparison (for each respondent). Therefore, it resulted only the ‘best’ alternative, without providing a ranking for the rest of the alternatives or a matrix with the overall comparison results (for the whole sample). Beside the fact that the decision was certainly alternative 2C, the above are serious disadvantages for a water resource management problem.
TOPSIS resulted a very clear ranking of the alternatives, with small range of results. A disadvantage of TOPSIS is that the results are based on the optimum possible solution, which is a theoretical evaluation measure. As the results showed, strict evaluation of the alternatives based on their performances may be misleading in water resource management problems, as the simulation and the respondents’ perception of the problem may not refer to the same measures. The approach of TOPSIS may reduce sample uncertainties of the problem, but it does not ensure that the optimum and worst solution, or the similarity of the alternatives to the ideal solution, do not include other uncertainties (e.g., from the hydro-economic simulation).
The optimum and most fitting approach to the studied problem should be a combination of the most important advantages of the above, and an approach that avoids some of the disadvantages. MAUT combines a consideration of the performances of the alternatives and the preferences of the sample. This combination is an important advantage for water resource management problems. The approach seemed to be more ‘direct’, holistic and easy to implement. This implies a better response to the questionnaire, and hence more representative results of reality. A more systematic evaluation of the MCA techniques that were used herein, and all those which were tested, is planned to be examined in our further research. More specifically, the generalization of the examined methods regarding their suitability in water resource management problems is under consideration through suitability indices [73,74].
Regarding the sample, their results were not totally in agreement, but the majority agreed on the most appropriate alternative. The differences among the other solutions’ rankings are due to method uncertainties, other randomnesses, different priorities set from the sample, and their weaknesses in understanding the problem. The results show that it is commonly acceptable that the biggest problem of the watershed is the degradation of the water resources [75]. In practice, only the experts clearly set the water balance as their first priority (Criterion 1). The existence of the three selected criteria was significant, as it led to the conclusion that the experts had a better perception than the DMs of the concept of the full cost of water, and also on the effects of each alternative. The main priority of the majority of the DMs was the achievement of higher net profits (Criterion 2), without excluding the importance of water availability. This shows that there have been several steps in the watershed to move from an overexploitation of the environment approach to a combined policy of achieving economic goals with environmental constraints. The overall differences in the results of the two sample groups indicate higher general agreement among the experts than the DMs. Consequently, it was proven that the experts felt surer about the connection of the factors involved, and thus of what they consider most appropriate and why. The usage of two sample groups proved to be useful, as if the problem had been solved by only one group’s weightings, we might have been led to misleading conclusions. One of the innovative elements of the study was the comparison of the two groups’ results through the inclusion of the expert group. For important decisions on water resource management, those on a large scale, it is strongly recommended to take into consideration the opinions of experts. Even in cases where the intention of the stakeholders is overall beneficial, the experts can contribute, providing appropriate means for the achievement of desirable objectives. Thus, the consultation process between experts and decision makers has to be further strengthened. The opinion of the farmers of the watershed is planned to be retrieved as well in our further research, with another survey. This will be a difficult and time-consuming task, but very useful in order to inform more people about the situation, and to correlate their priorities and opinions with the ones of the existing sample. Thus, the research will contribute to the enforcement of public participation in water resource management decisions, supported by integrated—and not subjective—tools and approaches like the one proposed in this article.
Author Contributions
A.A. designed the study, conducted the modeling, performed the analysis with D.G., and drafted the manuscript. N.M. and A.L. supervised the research, contributed ideas during analysis and interpretation, and edited the paper.
Funding
The preparation of the article has been co-financed—via a programme of State Scholarships Foundation (IKY)—by the European Union (European Social Fund—ESF). This research was funded by Greek State Scholarships Foundation through the action entitled “Scholarships programme for postgraduate studies–2nd Study Cycle” in the framework of the Operational Programme “Human Resources Development Program, Education and Lifelong Learning” of the National Strategic Reference Framework (NSRF) 2014–2020.
Acknowledgments
The authors would also like to thank all those who participated in the survey, as well as the three reviewers of the paper for their constructive comments. Their remarks help the authors to improve the quality of the paper.
Conflicts of Interest
The authors declare no conflict of interest.
References
- Janssen, R. Multiobjective Decision Support for Environmental Management; Kluwer Academic: Dortrecht, The Netherlands, 1992. [Google Scholar]
- Rahman, M.A.; Rusteberg, B.; Uddin, M.S.; Saada, M.A.; Rabi, A.; Sauter, M. Impact Assessment and Multicriteria Decision Analysis of Alternative Managed Aquifer Recharge Strategies Based on Treated Wastewater in Northern Gaza. Water 2014, 6, 3807–3827. [Google Scholar] [CrossRef] [Green Version]
- Voogd, H. Multiple Criteria Evaluation for Urban and Regional Planning; Pion: London, UK, 1983. [Google Scholar]
- Meerkhan, H.; Teixeira, J.; Espinha Marques, J.; Afonso, M.J.; Chaminé, H.I. Delineating Groundwater Vulnerability and Protection Zone Mapping in Fractured Rock Masses: Focus on the DISCO Index. Water 2016, 8, 462. [Google Scholar] [CrossRef]
- Andreoli, M.; Tellarini, V. Farm sustainability evaluation: Methodology and practice. Agric. Ecosyst. Environ. 2000, 77, 43–52. [Google Scholar] [CrossRef]
- Funtowicz, S.O.; Ravetz, J. Uncertainty and Quality in Science for Policy; Kluwer: Dortrecht, The Netherlands, 1990. [Google Scholar]
- Mendoza, G.A.; Prabhu, R. Multiple criteria decision making approaches to assessing forest sustainability using criteria and indicators: A case study. For. Ecol. Manag. 2000, 131, 107–126. [Google Scholar] [CrossRef]
- Brown, C.; Werick, W.; Leger, W.; Fay, D. A decision-analytic approach to managing climate risks: Application to the upper great lakes. J. Amer. Water Res. Assoc. 2011, 47, 524–534. [Google Scholar] [CrossRef]
- Little, J.D.C. Models and Managers: The Concept of a Decision Calculus. Manag. Sci. 1970, 16, B466–B485. [Google Scholar] [CrossRef]
- Keen, P.G.W.; Scott-Morton, M.S. Decision Support Systems: An Organizational Perspective; Addison-Wesley: Reading, MA, USA, 1978; ISBN 0-201-03667-3. [Google Scholar]
- Sprague, R.H.; Carlson, E.D. Building Effective Decision Support Systems; Appeared in DSS News, February 11 2001; Prentice-Hall, Inc.: Englewood Cliffs, NJ, USA, 1982; Volume 2. [Google Scholar]
- Andriole, S.J. Handbook for the Design, Development, Evaluation, and Application of Interactive Decision Support Systems; Petrocelli: Princeton, NJ, USA, 1989. [Google Scholar]
- Sage, A.P. Decision Support Systems Engineering; Wiley: New York, NY, USA, 1991. [Google Scholar]
- Adelman, L. Evaluating Decision Support and Expert Systems; xvi+234pp; Wiley: New York, NY, USA, 1992; 234p, ISBN 0-471-54801-4. [Google Scholar]
- Demirel, M.C.; Koch, J.; Mendiguren, G.; Stisen, S. Spatial Pattern Oriented Multicriteria Sensitivity Analysis of a Distributed Hydrologic Model. Water 2018, 10, 1188. [Google Scholar] [CrossRef]
- Mylopoulos, N. Water Resources Management, Teaching Notes; University of Thessaly, Department of Civil Engineering: Volos, Greece, 2006. [Google Scholar]
- Figueira, J.; Salvatore, G.; Ehrgott, M. Multiple Criteria Decision Analysis: State of the Art Surveys; Springer: Berlin/Heidelberg, Germany; New York, NY, USA, 2005; p. 1045. [Google Scholar]
- Pohekar, S.D.; Ramachandran, M. Application of multi-criteria decision making to sustainable energy planning—A review. Renew. Sustain. Energy 2004, 8, 365–381. [Google Scholar] [CrossRef]
- Dunning, D.J.; Ross, Q.E.; Merkhofer, M.W. Multiattribute utility analysis; best technology available; adverse environmental impact. Clean Water Act, Section 316(b). Environ. Sci. Policy 2000, 3, 7–14. [Google Scholar] [CrossRef]
- Romero, C.; Rehman, T. Natural resource management and the use of multiple criteria decision making techniques: A review. Eur. Rev. Agric. Econ. 1987, 14, 61–89. [Google Scholar] [CrossRef]
- UNESCO. IWRM Guidelines at River Basin Level—Part 2-1: The Guidelines for IWRM Coordination; unesco.org; UNESCO IHP Secretariat: Paris, France, 2009. [Google Scholar]
- UNESCO. IWRM Guidelines at River Basin Level—Part 2-4: The Guidelines for Managing Environmental Sustainability; unesco.org; UNESCO IHP Secretariat: Paris, France, 2009. [Google Scholar]
- Cohon, J.L.; Marks, D.H. A review evaluation of multiobjective programming techniques. Water Resour. Manag. 1975, 11, 208–220. [Google Scholar] [CrossRef]
- Singh, A. Decision support for on-farm water management and long-term agricultural sustainability in a semi-arid region of India. J. Hydrol. 2010, 391, 63–76. [Google Scholar] [CrossRef]
- Pegram, G.; Li, Y.; Le Quesne, T.; Speed, R.; Li, J.; Shen, F. River Basin Planning: Principles, Procedures and Approaches for Strategic Basin Planning; UNESCO IHP Secretariat: Paris, France, 2013. [Google Scholar]
- UNEP. The UN-Water Status Report on the Application of Integrated Approaches to Water Resources Management; UN-Water Reports; UNEP: Athens, Greece, 2012. [Google Scholar]
- Hajkowicz, S.; Collins, K. A Review of Multiple Criteria Analysis for Water Resource Planning and Management. Water Resour. Manag. 2007, 21, 1553–1566. [Google Scholar] [CrossRef]
- Steuer, R.E.; Na, P. Multiple criteria decision making combined with finance: A categorized bibliographic study. Eur. J. Oper. Res. 2003, 150, 496–515. [Google Scholar] [CrossRef]
- Lee, C.S.; Chang, S.P. Interactive fuzzy optimization for an economic and environmental balance in a river system. Water Res. 2005, 39, 221–231. [Google Scholar] [CrossRef] [PubMed]
- Tecle, A. Selecting a multicriterion decision making technique for watershed resources management. Water Resour. Bull. 1992, 28, 129–140. [Google Scholar] [CrossRef]
- Gershon, M.; Duckstein, L. Multiobjective approaches to river basin planning. J. Water Resour. Plan. Manag. 1983, 109, 13–28. [Google Scholar] [CrossRef]
- Ozelkan, E.C.; Duckstein, L. Analysing water resource alternatives and handling criteria by multi criterion decision techniques. J. Environ. Manag. 1996, 48, 69–96. [Google Scholar] [CrossRef]
- Eder, G.; Duckstein, L.; Nachtnebel, H.P. Ranking water resource projects and evaluating criteria by multicriterion Q-analysis: An Austrian case study. J. Multi-Criteria Decis. Anal. 1997, 6, 259–271. [Google Scholar] [CrossRef]
- Alhumaid, M.; Ghumman, A.R.; Haider, H.; Al-Salamah, I.S.; Ghazaw, Y.M. Sustainability Evaluation Framework of Urban Stormwater Drainage Options for Arid Environments Using Hydraulic Modeling and Multicriteria Decision-Making. Water 2018, 10, 581. [Google Scholar] [CrossRef]
- Fishburn, P.C. Utility theory. Manag. Sci. 1968, 14, 335–378. [Google Scholar] [CrossRef]
- Saaty, T.L. The Analytic Hierarchy Process; McGraw-Hill: New York, NY, USA, 1980. [Google Scholar]
- Roy, B. The outranking approach and the foundations of ELECTRE methods. Theory Decis. 1991, 31, 49–73. [Google Scholar] [CrossRef]
- Yoon, K.P.; Hwang, C.L. Multiple Attribute Decision Making; Sage Publication: Thousand Oaks, CA, USA, 1995. [Google Scholar]
- Loukas, A.; Mylopoulos, N.; Vasiliades, L. A modeling system for the evaluation of water resources management strategies in Thessaly, Greece. Water Resour. Manag. 2007, 21, 1673–1702. [Google Scholar] [CrossRef]
- Sidiropoulos, P. Groundwater Resources Management under Uncertainty: The Value of Information on Environmentally Degraded Aquifers. PhD Thesis, University of Thessaly, Department of Civil Engineering, Volos, Greece, 2014. [Google Scholar]
- Alamanos, A.; Xenarios, S.; Mylopoulos, N.; Stalnacke, P. Hydroeconomic modeling and management with limited data: The case of Lake Karla Basin, Greece. Eur. Water J. 2016, 54, 3–18. [Google Scholar]
- Alamanos, A.; Xenarios, S.; Mylopoulos, N.; Stalnacke, P. Integrated Water Resources Management in agro-economy using linear programming: The case of Lake Karla Basin, Greece. Eur. Water J. 2017, 60, 41–47. [Google Scholar]
- Alamanos, A.; Fafoutis, C.; Papaioannou, G.; Mylopoulos, N. Extension of an integrated hydroeconomic model of Lake Karla basin, under management, climate and pricing scenario analysis. In Proceedings of the Sixth International Conference on Environmental Management, Engineering, Planning and Economics (CEMEPE), Thessaloniki, Greece, 25–30 June 2017. [Google Scholar]
- Greek Ministry of Environment, Energy and Climate Change, Special Water Secretariat. Water Resources Management Plans for the Water Districts of Thessaly, Epirus and Central Greece, according to the Requirements of the Water Framework Directive 2000/60/EC, the Law 3199/2003 and the Presidential Decree 51/2007; Special Water Secretariat-YPEKA: Athens, Greek, 2012. [Google Scholar]
- FAO. Cropwat. 2015. Available online: http://www.fao.org/nr/water/infores_databases_cropwat.html (accessed on 21 August 2017).
- Common Implementation Strategy Working Group 2 (WATECO). EU Guidance Document: Economics and the Environment. The Implementation Challenge of the Water Framework Directive. August 2002. Available online: http://forum.europa.eu.int/Public/irc/env/wfd/library (accessed on 30 April 2015).
- Tietenberg, T.; Lewis, L. Environmental & Natural Resource Economics, 9th ed.; Pearson: Boston, MA, USA, 2011; ISBN 978-0131392571. [Google Scholar]
- Neumann, J.V.; Morgenstern, O. Theory of Games and Economic Behavior; Princeton University Press: Princeton, NJ, USA, 1953; ISBN 9780691130613. [Google Scholar]
- Churchman, C.W.; Ackoff, R.L.; Arnoff, E.L. Introduction to Operations Research; Wiley: New York, NY, USA, 1957. [Google Scholar]
- Keeney, R.L.; Raiffa, H. Decisions with Multiple Objectives; Wiley: New York, NY, USA, 1976; 569p, ISBN 0-521-44185-4. [Google Scholar]
- Fishburn, P.C. A Survey of Multiattribute/11multiple Criteria Evaluation Theories; Multiple Criteria Problem, Solving, Zionts, S., Eds.; Springer: Berlin, Germany, 1978; pp. 181–224. [Google Scholar]
- Fishburn, P.C. Utility Theory for Decision Making; John Wiley and Sons: New York, NY, USA, 1970; Volume 6. [Google Scholar]
- Sintonen, H. An approach to measuring and valuing health states. Soc. Sci. Med. 1981, 15, 55–65. [Google Scholar] [CrossRef]
- Rehman, T.; Romero, C. The application of the MCDM paradigm to the management of agricultural systems: Some basic considerations. Agric. Syst. 1993, 41, 239–255. [Google Scholar] [CrossRef]
- Beinat, E. Value Functions for Environmental Management; Kluwer Academic Publisher: Dordrecht, The Netherlands, 1997. [Google Scholar]
- Climaco, J. Multicriteria Analysis. In Proceedings of the XIth International Conference on MCDM, Coimbra, Portugal, 1–6 August 1997; Springer: Berlin, Germany, 1997. [Google Scholar]
- De Montis, A.; De Toro, P.; Droste-Franke, B.; Omann, I.; Stagl, S. Criteria for quality assessment of MCDA methods. In Proceedings of the 3rd Biennial Conference of the European Society for Ecological Economics, Vienna, Austria, 3–6 May 2000. [Google Scholar]
- Hayashi, K. Multicriteria analysis for agricultural resource management: A critical survey and future perspectives. Eur. J. Oper. Res. 2000, 122, 486–500. [Google Scholar] [CrossRef]
- Munier, N. A Strategy for Using Multicriteria Analysis in Decision-Making. A Guide for Simple and Complex Environmental Projects; Springer: Dordrecht, The Netherlands; Heidelberg, Germany; London, UK; New York, NY, USA, 2011; ISBN 978-94-007-1511-0. e-ISBN 978-94-007-1512-7. [Google Scholar] [CrossRef]
- Spanos, S. Analytical Study of Multicriteria Decision Making Methods. Diploma (BSc.) Thesis, School of Electrical and Computer Engineering, National Technical University of Athens, Athina, Greece, 2004. [Google Scholar]
- Galliou, F. Managing a Framework for the Assessment of Small-Scale Sewage Treatment Systems with Multi-Criteria Decision Analysis. Postgraduate Thesis, Agricultural School, Aristotle University of Thessaloniki, Thessaloniki, Greece, 2009. [Google Scholar]
- Roy, B. Classement et choix en présence de points de vue multiples (la méthode ELECTRE). La Revue d’Informatique et de Recherche Opérationelle (RIRO) 1968, 8, 57–75. (In French) [Google Scholar]
- Roy, B. Multicriteria Methodology for Decision Aiding; Kluwer Academic Publishers: Dordrecht, The Netherlands, 1996. [Google Scholar]
- Hwang, C.L.; Lai, Y.J.; Liu, T.Y. A new approach for multiple objective decision making. Comput. Oper. Res. 1993, 20, 889–899. [Google Scholar] [CrossRef]
- Luce, R.D. Semiorders and a theory of utility discrimination. Econometrica 1956, 24, 178–191. [Google Scholar] [CrossRef]
- Hwang, C.L.; Yoon, K. Multiple Attribute Decision Making: Methods and Applications; Springer: New York, NY, USA, 1981; ISBN 978-3-642-48318-9. [Google Scholar]
- Triantaphyllou, E.; Lin, C. Development and Evaluation of Five Fuzzy Multiattribute Decision-Making Methods. Int. J. Approx. Reason. 1996, 14, 281–310. [Google Scholar] [CrossRef]
- Yoon, K. A reconciliation among discrete compromise situations. J. Oper. Res. Soc. 1987, 38, 277–286. [Google Scholar] [CrossRef]
- Cheng, S.; Chan, C.W.; Huang, G.H. Using multiple criteria decision analysis for supporting decision of solid waste management. J. Environ. Sci. Health 2002, 6 Pt A37, 975–990. [Google Scholar] [CrossRef]
- Kim, G.; Park, C.S.; Yoon, K.P. Identifying investment opportunities for advanced manufacturing systems with comparative-integrated performance measurement. Int. J. Prod. Econ. 1997, 50, 23–33. [Google Scholar] [CrossRef]
- Shih, H.S.; Shyur, H.J.; Lee, E.S. An extension of TOPSIS for group decision making. Math. Comput. Model. 2007, 45, 801–813. [Google Scholar] [CrossRef]
- Wittrup-Jensen, K.U.; Pedersen, K.M. Modelling Danish Weights for the 15D Quality of Life Questionnaire by Applying Multi-Attribute Utility Theory (MAUT); Health Economics Papers; University of Southern Denmark: Odense, Denmark, 2008; Volume 7. [Google Scholar]
- Guarini, M.R.; Battisti, F.; Chiovitti, A. A Methodology for the Selection of Multi-Criteria Decision Analysis Methods in Real Estate and Land Management Processes. Sustainability 2018, 10, 507. [Google Scholar] [CrossRef]
- Guarini, M.R.; Battisti, F.; Chiovitti, A. Public Initiatives of Settlement Transformation: A Theoretical-Methodological Approach to Selecting Tools of Multi-Criteria Decision Analysis. Buildings 2018, 8, 1. [Google Scholar] [CrossRef]
- Alamanos, A.; Mylopoulos, N.; Vasiliades, L.; Loukas, A. Climate change effects on the availability of water resources of Lake Karla watershed for irrigation and Volos city urban water use. In Proceedings of the 14th Protection and Restoration of the Environment (PRE) Conference, Thessaloniki, Greece, 3–6 July 2018. [Google Scholar]
Figure 1.
The study area and its management authorities [40].
Figure 1.
The study area and its management authorities [40].

Figure 2.
The integrated MCA model.

Figure 3.
The ranges of the utility values of each alternative, according to (a) the group of experts and (b) the group of DMs.
Figure 3.
The ranges of the utility values of each alternative, according to (a) the group of experts and (b) the group of DMs.

Figure 4.
Overall results of MAUT method.

Figure 5.
The range of importance scores assigned to each sub-criterion (a) from the group of experts, and (b) from the group of DMs.
Figure 5.
The range of importance scores assigned to each sub-criterion (a) from the group of experts, and (b) from the group of DMs.

Figure 6.
The ranges of the priority values of each alternative, according to (a) the group of experts and (b) the group of DMs.
Figure 6.
The ranges of the priority values of each alternative, according to (a) the group of experts and (b) the group of DMs.

Figure 7.
Overall results of AHP method.

Figure 8.
The ranges of criteria weightings given for ELECTRE and TOPSIS methods (a) by the group of experts and (b) by the group of DMs.
Figure 8.
The ranges of criteria weightings given for ELECTRE and TOPSIS methods (a) by the group of experts and (b) by the group of DMs.


Table 1.
The water balance of the watershed, the net profits from the agricultural activity, and the full cost of water, for each management scenario.
Table 1.
The water balance of the watershed, the net profits from the agricultural activity, and the full cost of water, for each management scenario.
| Alternatives | Criterion 1—Water Balance (hm3) | Criterion 2—Net Profit (mil. €) | Criterion 3—Full Cost of Water (mil. €) |
|---|---|---|---|
| 1A | −71.26 | 47.31 | 27.83 |
| 1B | −142.49 | 47.31 | 34.39 |
| 2 | −99.55 | 49.40 | 25.92 |
| 2A | −78.17 | 47.33 | 23.59 |
| 2B | −90.26 | 48.67 | 24.90 |
| 2C | −10.52 | 49.40 | 22.67 |
| 2D | −81.67 | 49.40 | 26.47 |
Table 2.
The performances of the alternatives under the sub-criteria.
| Sub-Criteria/Alternatives | C1.1 (hm3) | C1.2 (hm3) | C1.3 (hm3) | C2.1 (mil. €) | C2.2 (mil. €) | C3.1 (mil. €) | C3.2 (mil. €) | C3.3 (mil. €) |
|---|---|---|---|---|---|---|---|---|
| 1A | 50.2 | −121.46 | 0 | 73.96 | 57.84 | 2.6 | 18.87 | 6.36 |
| 1B | −4.96 | −137.53 | 0 | 73.96 | 57.84 | 7.18 | 21.05 | 6.16 |
| 2 | −10.8 | −102.69 | 13.95 | 108.43 | 59.03 | 4.01 | 15.22 | 6.68 |
| 2A | −1.4 | −92.73 | 15.97 | 101.65 | 54.32 | 4.01 | 13.83 | 5.75 |
| 2B | −6.72 | −98.37 | 13.95 | 104.9 | 56.22 | 4.01 | 13.67 | 7.22 |
| 2C | 50.2 | −79.79 | 19.06 | 108.43 | 59.03 | 2.84 | 11.68 | 8.16 |
| 2D | −4.96 | −92.87 | 16.15 | 108.43 | 59.03 | 6.43 | 13.87 | 6.17 |
Table 3.
The characteristics and the description of each method.
| MCA Method | Theory | Weightings | Description |
|---|---|---|---|
| MAUT | Utility Theory | The alternatives are evaluated under each sub-criterion. | The alternatives are ranked according to the sum product of the performances of the alternatives to the respective weights |
| AHP | Hierarchical Theory | Comparing every pair of criteria, and then every pair of alternatives, under each criterion. | Linear algebra is used to extract the overall score for each alternative. The alternatives are ranked in descending order of the resulting priority values, i.e., in order of suitability. |
| ELECTRE I | Outranking Theory | Scores of importance for each criterion | Outranking relations are formed to represent the preferences of the respondents, through pairwise comparisons of the alternatives. |
| TOPSIS | Classification Theory | Scores of importance for each criterion | The alternatives are ordered between the best and the worst solution, based on the distances of their respective performances. A closeness index expresses each alternative’s similarity to the optimal solution. |
Table 4.
The results of TOPSIS method. The numbers express the average similarity of each alternative to the ideal solution of the problem.
Table 4.
The results of TOPSIS method. The numbers express the average similarity of each alternative to the ideal solution of the problem.
| Alternatives | Group of Experts | Group of DMs | Total |
|---|---|---|---|
| 1A | 54.055 | 54.087 | 54.072 |
| 1B | 0.000 | 0.000 | 0.000 |
| 2 | 35.128 | 36.499 | 35.837 |
| 2A | 50.926 | 52.083 | 51.524 |
| 2B | 41.999 | 43.286 | 42.665 |
| 2C | 100.000 | 100.000 | 100.000 |
| 2D | 47.247 | 47.896 | 47.583 |
Table 5.
The results of every technique used, for the whole sample.
| Alternatives | MAUT | AHP | ELECTRE I | TOPSIS | Overall |
|---|---|---|---|---|---|
| 1A | 0 | 2 | 0 | 0 | 2 |
| 1B | 0 | 1 | 0 | 0 | 1 |
| 2 | 1 | 4 | 0 | 0 | 5 |
| 2A | 0 | 3 | 0 | 0 | 3 |
| 2B | 3 | 3 | 0 | 0 | 6 |
| 2C | 45 | 39 | 60 | 60 | 174 |
| 2D | 11 | 8 | 0 | 0 | 19 |
| Total runs | 60 | 60 | 60 | 60 | 240 |
© 2018 by the authors. Licensee MDPI, Basel, Switzerland. This article is an open access article distributed under the terms and conditions of the Creative Commons Attribution (CC BY) license (http://creativecommons.org/licenses/by/4.0/).
Share and Cite
MDPI and ACS Style
Alamanos, A.; Mylopoulos, N.; Loukas, A.; Gaitanaros, D. An Integrated Multicriteria Analysis Tool for Evaluating Water Resource Management Strategies. Water 2018, 10, 1795. https://doi.org/10.3390/w10121795
AMA Style
Alamanos A, Mylopoulos N, Loukas A, Gaitanaros D. An Integrated Multicriteria Analysis Tool for Evaluating Water Resource Management Strategies. Water. 2018; 10(12):1795. https://doi.org/10.3390/w10121795
Chicago/Turabian StyleAlamanos, Angelos, Nikitas Mylopoulos, Athanasios Loukas, and Dimitrios Gaitanaros. 2018. "An Integrated Multicriteria Analysis Tool for Evaluating Water Resource Management Strategies" Water 10, no. 12: 1795. https://doi.org/10.3390/w10121795
Note that from the first issue of 2016, this journal uses article numbers instead of page numbers. See further details here.