Barriers and Drivers of Household Water-Conservation Behavior: A Profiling Approach


Riverine Landscapes Research Laboratory, University of New England, Armidale, NSW 2351, Australia
*
Author to whom correspondence should be addressed.
Water 2018, 10(12), 1794; https://doi.org/10.3390/w10121794
Submission received: 28 August 2018
/
Revised: 29 November 2018
/
Accepted: 3 December 2018
/
Published: 6 December 2018
(This article belongs to the Section Water Use and Scarcity)
Abstract
:Factors that influence behavioral response (barriers and drivers) are important for household water-conservation practices. These factors either support or inhibit sustainable behavior. In this research, a latent profile analysis (LPA) was used within the capability-, opportunity-, and motivation-behavior (COM-B) framework to identify key barriers and drivers of household water-conservation behaviors. Participants (N = 510, mean age = 56.08 years, SD = 14.71) completed measures of psycho-social constructs related to barriers and drivers of water-conservation behavior. An LPA yielded a 3-profile statistical solution: capability (35.8%), opportunity (23.2%), and motivation (41.0%) conceptualizing levels of barriers and drivers of water-conservation behavior. Major identified barriers and drivers associated with these profile groupings were time constraints, acuity of water-efficient devices, lack of skills to adopt conservation practices, and availability of incentives/disincentives for water-saving devices. Validation analyses showed that the three COM-B groups diverged considerably based on socio-demographic status and actual water-conservation behavior. Results are pertinent to water authorities in identifying interventions to reduce barriers and promote drivers of positive household water-conservation behaviors by altering and directing appropriate COM-B dimensions to individual water consumers.
1. Introduction
Behaviors that may influence water conservation can be constrained by barriers or facilitated by drivers [1,2,3]. Barriers to water-conservation behavior prevent people from acting pro-environmentally regardless of their attitudes or intentions [4,5]. Constraints undermine the enthusiasm or readiness of people to engage in pro-environmental behaviors and these include distrust, time constraints, poverty, and scarcity of suitable information [6]. In contrast, drivers are factors that promote a desired activity such as reduced water use or use of recycled water [7,8]. Factors that facilitate pro-environmental behaviors include awareness of climate/seasonal variability, incentives, regulations and ordinances, environmental values and socio-economic factors [9,10,11]. Water-conservation activities are more likely to occur when individuals believe that water is scarce and when they perceive that other consumers are likewise conserving water (cf. [12]). Barriers and drivers of water-conservation behavior are influenced by many factors, including psychological factors such as values, beliefs, trust, affective (emotional) reactions and attitudes [12,13], socio-economic factors such as income, water pricing and policies, environmental factors such as seasonal variation and demographic factors such as age and household size [9]. Moreover, water conservation is influenced by the management of local water resources and household attitudes to behavior-change challenges [14]. Water-price mechanisms (e.g., estimated underpricing of water), ageing infrastructure, and poor institutional and financial capacity also influence water-conservation behavior. Concerns about the installation and functionality of water-efficient devices and the inconvenience resulting from practicing water-saving behavior are major problems for everyday water-conservation behavior [15]. Lack of free water-audits and personalized advice, rebates, and help in purchasing and retrofitting existing appliances have prevented many people conserving diminishing water resources [14]. Water-conservation behavior can be improved if behavior conditions are profiled to identify barriers and drivers of water-conservation activities.
Profiling in behavioral studies attempts to understand a person or group based on personal characteristics or behavior [16]. Profiling comprises transforming data into knowledge [17]. Profiles are useful for many corporations in customizing their services to suit their customers and to increase revenues. Customizing results from profiling can help users acquire information relevant to their interest [18]. The obvious intent of behavioral profiling is to track users over time and build knowledge of their interests, characteristics, behaviors and activities. Although behavioral studies (e.g., [19,20]) have considered the relationship between psycho-social factors (barriers and drivers) and household water-use behavior, none of these have used a profiling approach to understand the barriers and drivers of household water conservation in relation to behavior-change theory.
The Behavior-Change Wheel (BCW) framework [21] is based on behavior-change theory and involves three interactive but distinct domains of behavioral conditions: capability, opportunity and motivation-behavior (COM-B dimensions). Capability is defined as acquiring psychological and physical ability/self-efficacy to work out specific behaviors or actions, including having suitable insight, knowledge and skills [21]. Opportunity explains factors external to the individual that permit or prohibit a behavior, such as a social surrounding or physical environment. Motivation describes the cognitive processes that vitalize and guide behavior, such as habitual responses, emotional responses, and rational decision-making. These cognitive processes involve reflective motivation, such as making-good intentions or doing appraisals, and automatic motivation, involving emotional and impulse responses. Pro-environmental behavior such as water conservation can be sustained when intervention activity targets one or more conditions within this behavior system [21].
Applying the COM-B framework within a profiling and water-conservation behavior context can highlight specific intervention strategies. Profiling groups and classifies several barriers and drivers of water-conservation behaviors into specific behavior conditions (COM-B dimensions). This relates behavior conditions to the relevant intervention strategies of interest to target more effective measures and solutions that promote sustainable water-conservation behavior. The COM-B provides distinct behavioral conditions with relevant intervention strategies and may show how a group of people respond to their environment within a specific domain of water-conservation behavior. The matter and focus of that intervention helps with the individual’s behavioral change, choice of conservation measures and best fit within the environment. Providing a profile acts as a compass to determine how best to understand water-conservation behaviors (environmental conditions) that constrain a particular behavior of interest [22]. The benefits ensuing from this approach may include raising the interest of an individual’s sustainability initiatives, providing solutions to sustainability problems, building trust among household water users and providing meaningful opportunities for water-conservation actions. Although these psycho-social benefits influence the way people act environmentally, there are barriers and drivers to pro-environmental behaviors.
This study seeks to adopt a profiling approach to understand barriers and drivers influencing sustainable household water-conservation behavior based on the COM-B framework. Individual behavioral conditions—COM-B dimensions—have been found to influence sustainable behavior [23]. The aim of this study is to classify barriers to, and drivers of, household water conservation using a profiling approach, and link these barriers and drivers to appropriate behavior conditions for effective water-conservation intervention strategies based on the COM-B dimensions.
2. Materials and Methods
2.1. Recruitment Processes
Study participants were recruited through a social research panel (QualtricsTM) in March and April 2017 and asked to undertake an online survey. Participants received a reward commensurate with the time commitment involved in completing the survey. Participants had to be at least 18 years of age, have responsibility for paying utility bills (including bills for their household’s water use), have access to a garden as part of their property, and reside in New South Wales (NSW), Australia. The research was approved by the University of New England Human Research Ethics Committee.
2.2. Study Participants and Characteristics
The sample comprised 510 NSW residents. Participants were aged from 18 to 84 years (mean age = 56.08, SD = 14.71), with equal numbers of males and females. Most participants (35%) had completed technical/vocational/TAFE education, 28% had completed high school, 19% had achieved a bachelor’s degree and 18% completed a higher degree. Sixty-eight percent described their residential situations as either solely or jointly owned property, 28% reported residence in a rented property, and 4% indicated that they resided in a property owned or rented by family or friends. In terms of access to a garden as part of their property, 91% declared access to a garden. Regarding responsibility for paying utility bills, 60% of the sample was solely responsible, and 40% shared the responsibility with other household members.
2.3. Measures of Water-Conservation Behavior
Two questionnaires were administered to participants (Figure 1). The first measured attitudes, barriers and drivers of water conservation, and the second measured actual water-conservation behavior. For the first survey, participants indicated agreement with five items about physical capability (skill, strength, stamina) for conserving water (Appendix A). The physical capability scale had good internal consistency (Cronbach’s alpha = 0.75). Ten items (Appendix A) assessed psychological capability to engage in water-conservation activities (Cronbach’s alpha = 0.89). Physical opportunity to influence water conservation was shown by levels of agreement with 12 items (Appendix A). The scale exhibited good internal consistency (Cronbach’s alpha = 0.73). Six items assessed respondents’ social opportunity afforded by inter-personal influences, social cues, and cultural norms that influence water conservation (Appendix A). The social opportunity scale had adequate internal consistency (Cronbach’s alpha = 0.65). Six items assessed respondents’ reflective motivation which involves intentions and evaluations (beliefs about what is good or bad) (Appendix A). The scale displayed good internal consistency (Cronbach’s alpha = 0.86). The automatic motivation items assessed respondents’ emotional reactions toward water conservation. Respondents showed their emotional reactions, desires (wants/needs), inhibitions, and reflex responses to 12 water-conservation measures. Automatic motivation toward water conservation had good internal consistency (Cronbach’s alpha = 0.72). All responses were answered using a five-point Likert scale ranging from 1 (strongly disagree) to 5 (strongly agree).
2.4. Analysis
A latent profile analysis [24] was conducted in the MPlus software package [25] to extract profile groups based on households’ attitudes, barriers and drivers of water conservation (Figure 1). Three goodness-of-fit indices were used to determine the optimal statistical solution for the profiles: Bayesian information criterion (BIC) [26,27]; the Akaike information criterion (AIC) [28]; and, the Lo-Mendel-Rubin likelihood ratio test (LMRT) [29]. The best-fitting model is when a dataset shows the smallest BIC and AIC values generated between competing models. Optimal statistical solutions were determined as those profile solutions with a significant LMRT and a high entropy value. Having established a latent profile solution, we assigned subjects to profile groups based on the probability of profile membership shown by the model. Validation of the profile solution was done using Multivariate Analysis of Variance (MANOVA) to test differences in profile group membership based on household attitudes, barriers and drivers of water conservation. A significant p-value for the LMRT measures the fit of a target model to a comparison model and the p-value shows whether the solution with more groups or fewer groups fits better. To buttress model assessment, entropy was also used as an index of model performance, with acceptable values close to one deemed perfect [30].
2.5. Evaluating Actual Water-Conservation Behavior
The second questionnaire assessed actual water-conservation behavior (Appendix B). Respondents indicated whether they were presently taking action to reduce their water consumption in 15 ways (e.g., using front-loading washing machine, using dual-flush toilet). A score of 1 indicated installation of water-efficient appliances and a score of 0 indicated no water-efficient appliances. The reliability estimates for water-efficient devices had good internal consistency (Cronbach’s alpha = 0.85). Seven items assessed respondents’ perceptions about water-efficient appliances (Appendix B) in conserving water (e.g., “Water-efficient appliances are a promising idea”, “I would consider purchasing a water-efficient appliance.”). All responses were answered using a five-point Likert scale ranging from 1 (strongly disagree) to 5 (strongly agree). The scale displayed adequate internal consistency for this measure (Cronbach’s alpha = 0.96). Nineteen items assessed respondents’ indoor behaviors aimed at reducing water consumption. Respondents indicated how often they engaged in a range of indoor behaviors associated with reduced water consumption (e.g., “I connect a rain tank to bathroom”, “I make sure that taps do not drip”, and “I fix leaks when they occur”). The scale showed good internal consistency (Cronbach’s alpha = 0.76). Twenty items were used to assess outdoor water-conservation practices. Respondents showed whether they engaged in a range of outdoor behaviors associated with water conservation (e.g., “I allow my lawn to go brown if there is insufficient rain”, “I strictly adhere to water restrictions”, and “I connect a rain tank to the garden”). All responses were answered using a five-point Likert scale ranging from 1 (never) to 5 (always). The internal reliability was good (Cronbach’s alpha = 0.85). A single item assessed how respondents compared the rate of current water shortages with the situation in the next five years in their locality. All responses were answered using a four-point Likert scale ranging from 1 (less severe) to 4 (more severe). Thus, higher scores indicated higher expectancy of future water shortages.
To validate the significant differences in actual water conservation among profile groups we examined access to a garden, indoor and outdoor water behaviors, ownership of water-efficient devices and perceptions and future expectancy of water crises between the profile groups. MANOVA in the statistical package SPSS version 24 was used to test the differences in dependent variables (demographic, actual behavior scores) among the profile groups.
3. Results
3.1. Derivation of Profile Groups
The 1- and 3-profile statistical solutions produced the least BIC and AIC values, a significant LMRT value (p < 0.001), and acceptable entropy values demonstrating that a 3-profile solution provided a better fit for the data than a one-profile solution (Table 1). The LMRT showed that the 1-profile solution offered a significant improvement in fit over the 2-profile solution. The 1- and 3-profile solutions both produced similar BIC and AIC values, significant LMRT values, and acceptable entropy values. Coupled with a significant LMRT and greater weight on the entropy value, the 3-profile solution presented better profile uniformity and the best-fitting model for the data. The 3-profile solution was therefore the most interpretable profile solution. The profiles show unique characteristics which each indicate distinct attitudes, barriers and drivers of behavior conditions for household water-conservation behavior (Figure 2).
3.2. Profile Groups and Their Characteristics
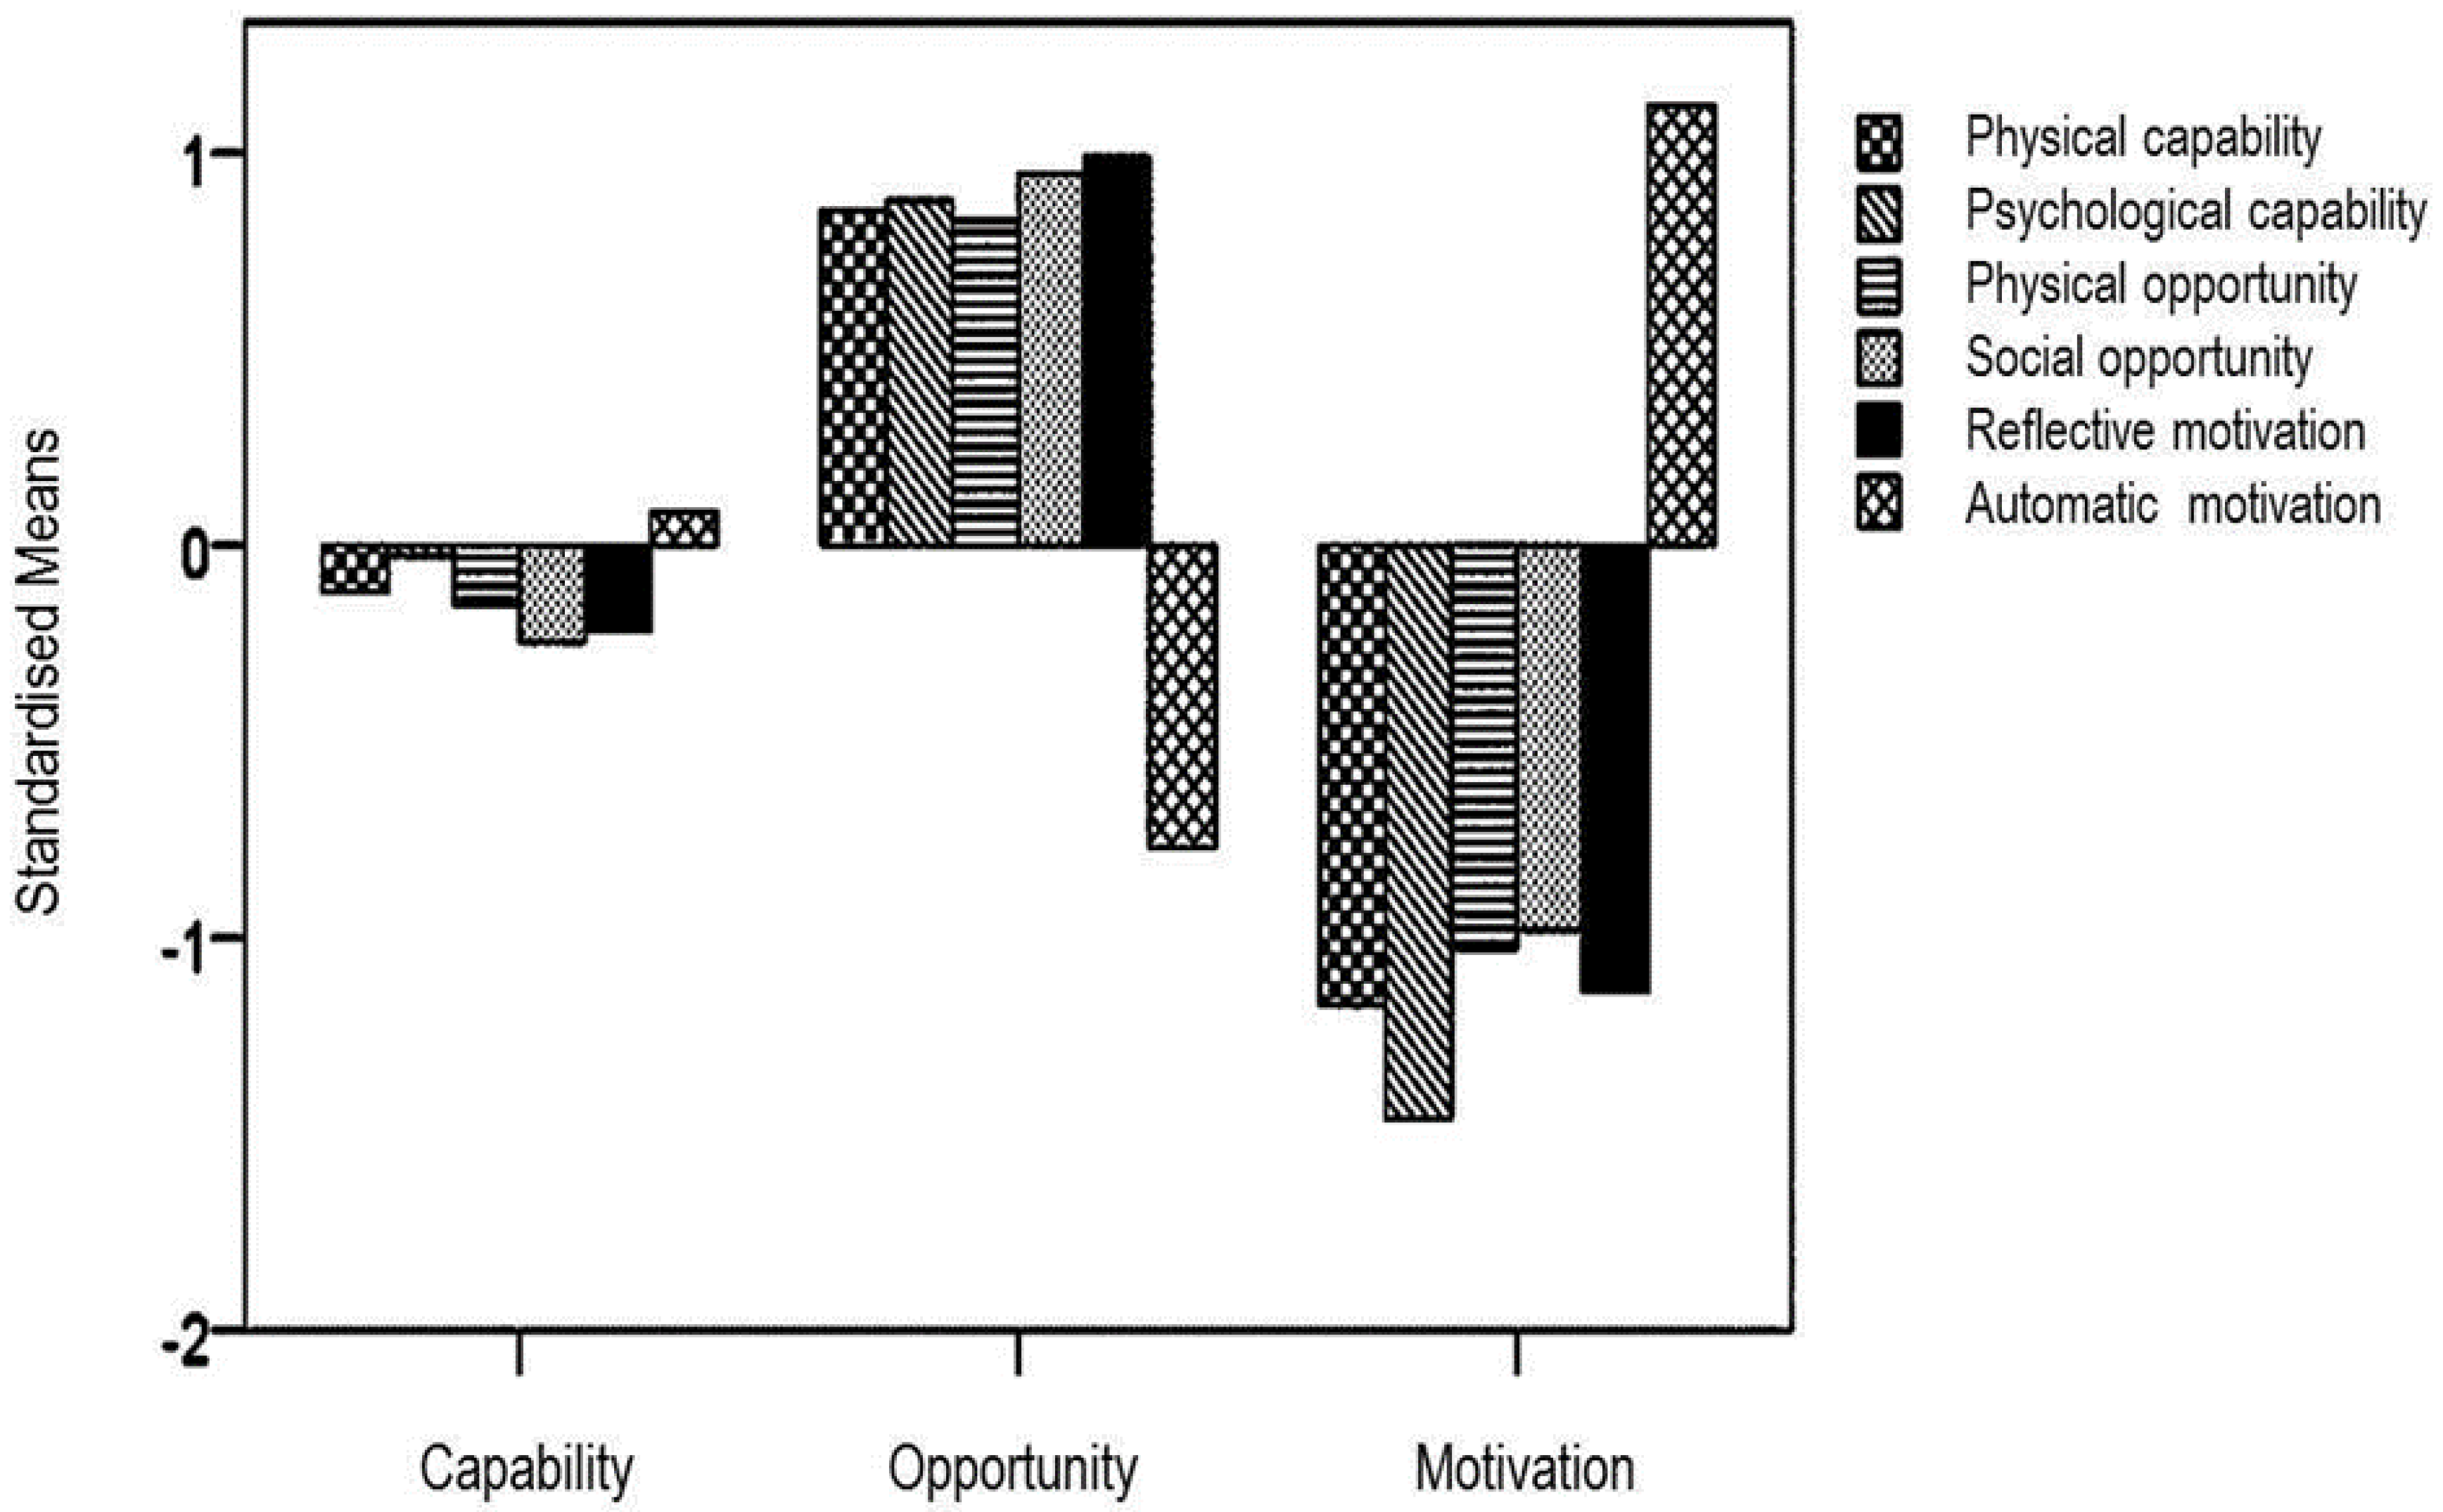
The 1- through 3-profile solutions that emerged corresponded with the COM-B dimensions (Figure 2). The profiles showed a unique behavior condition for household water-conservation behavior. Profile 1 comprised 35.8% of respondents (n = 189) who were labelled as being capable (capability) about water-conservation behavior (Figure 2). On average, the capability group reported moderate social opportunity barriers to water-conservation behavior, very low levels of physical and psychological capabilities, and low levels of reflective motivation regarding water conservation and considered its impacts to be significant. Except for automatic motivation toward water-conservation behavior (which was the most positive across the profiles), mean scores on all psycho-social mechanisms were below the sample average.
Profile 2 comprised 23.2% of the total sample (n = 119) and was labelled opportunity. This profile was characterized by mean scores on all psycho-social mechanisms that were above the sample average (Figure 2). Opportunity respondents tended to report high reflective motivation barriers to water-conservation behavior and the social and psychological effects, and strong physical capability regarding water conservation. They exhibited moderately high levels of physical opportunity toward water conservation. Their mean scores were much higher than the average sample mean; however, automatic motivation toward water conservation was moderately lower in this profile group.
The third profile comprised 41.0% of the sample (n = 202) and was labelled as the motivation group. This group was similar in many respects to the capability group. Mean scores on most of the profiling variables were below the sample average. The capability group was characterized by positive moderate automatic motivation to water conservation, whereas motivation respondents tended to report high levels of automatic motivation that were just above the sample mean (Figure 2). This suggests a possible high lack of commitment, disincentives and negative water-conservation attitudes toward water-conservation practices. This profile also reported the lowest levels of psychological capability and reflective motivation to water-conservation behavior (Figure 2).
3.3. Profile Differences in Actual Water-Conservation Behavior among the COM Dimensions
Each of the profile groups differed in their socio-demographic variables and actual water-conservation behaviors (Table 2). The effect for profile differences accounted for 32% of the profile differences and their related error variance. On average, members of the capability group were significantly older and more educated than those in the opportunity and motivation groups; however, all the groups showed greater desire and interest in water conservation when they have access to a relevant conservation information. Additionally, capability group members reported less residential status than opportunity and motivation group members. The MANOVA revealed that the overall respondents in the capability group showed more actual water-conservation behavior (Table 2). The capability group reported installing and having ownership of water-efficient devices, and stronger tendency to reduce water consumption and support water-conservation policies than respondents from the other two profiles. Additionally, opportunity and motivation respondents had positive perceptions about water-efficient devices and reported greater concern for future expectancy of water crises. They were of the view that supporting water-conservation actions is their priority if they were given the necessary opportunities and motivated to act. Although the outcome variables were significantly different across the three different profiles (Table 2), each outcome variable accounted for less than 5% of the profile differences and their associated variance.
4. Discussion
Three behavioral conditions influencing water-conservation behavior were identified in this study. Those with the motivation profile had several sets of barriers involved in water-conservation behavior. These were physical and psychological capabilities, reflective motivation, social and physical opportunities. Expressions such as indifference/laissez-faire attitudes toward water conservation, disincentives, lack of environmental values, discomfort in using water-efficient devices, and absent-mindedness emerged as perceived barriers to water-conservation behavior from the viewpoint of participants in the motivation group. For example, most members from this group showed low intentions (i.e., motivation/plan) to engage in conservation behavior and articulated that social support (rebates, incentives) was difficult to get from bodies such as government water agencies. As a result, this affected their intention to undertake conservation actions because most water-efficient devices are costly and those in the motivation group lacked the money (i.e., physical opportunity barrier) to buy these appliances. This result is similar to the study of Stokes and others [6] who established that attitudinal barriers inhibit behavioral changes. Moreover, intrinsic or extrinsic motivational factors such as incentives and rebate programs influence behavior [31]. Motivated households may promote water-conservation actions and decrease water consumption despite environmental stressors such as climate change and population growth. These households report being more receptive to water-conservation behavior change. The study of Herzberg and others [31] suggested that basic needs, such as emotional needs and fringe benefits motivate individuals to change behavior (e.g., output of work). A household with the motivation profile may be ready to conserve more water if they believe they will receive a desired reward for reaching an achievable target of water conservation.
The capability group had barriers associated with understanding conservation behaviors and actual water-conservation actions. Most barriers identified in this group related to personal capabilities such as lack of knowledge and education about the need for water conservation, inadequate conservation information, paucity of theory-based research-driven programs and evaluation, and poor feedback on water consumption (i.e., psychological capability barriers). It also included perceived lack of skills to participate in conservation activities (i.e., physical capability barriers). Moderate levels of barriers were displayed for social opportunity (socio-demographic variables, obsolete values, beliefs and customs) in the capability group. Participants reported that insufficient information and a shortage of theory-based research-driven programs and evaluation, and inoperative campaigns, weakened their knowledge of water conservation resulting in an elusive behavioral change. Poor feedback and lack of clarity regarding conservation programs inhibit conservation actions. Personal inclinations such as discomfort in using water-efficient devices (reflective motivation barriers) negate attitudes toward water-conservation practices.
A considerable number of households showed they would take part in water-conservation actions if they had relevant information about water-conservation strategies and the environmental and socio-economic effects of their actions. Household members who attain a higher education level and income may have stronger appreciation of the call for water conservation and higher readiness to install water-efficient devices that can cut household water consumption [32]. In addition, the capability group faced inflexibility of water infrastructure and lack of resources for initiatives (i.e., physical opportunity barriers) as perceived impediments to water-conservation behavior. Households with a capability profile agreed that lack of community support, scarcity of funds, and paucity of resources or time to start conservation activities influenced their conservation capabilities. The study of Jackson [33] claimed community-based initiatives appear to have a significant role in influencing sustainable behavioral change. Thus, it is plausible that the perceived lack of support, trust, funds, and resources (physical and social opportunity barriers) from government water agencies to start conservation activities can negate the likelihood of individuals with this profile in taking part in water-conservation actions.
Members of the opportunity group were identified to have barriers in relation to demand-side strategies for water conservation. This group were agitated about water policies such as pricing schemes, excessive cost of water-efficient devices, and housing status. The opportunity group reported a high mean score on psycho-social barriers such as time constraints, prohibitive cost of water-efficient devices, and lack of funds for monetary support and rebates. Household members showed high discomfort with paucity of rebates and monetary support for water users. They revealed that failure to offer rebates and monetary support discourage the act of replacing outmoded fixtures which then slow retrofitting programs and repel sustainable water-conservation behavior. On the contrary, the opportunity group showed lower levels of automatic motivation (e.g., sense of personal obligations/voluntary action), in conserving water because group members reported being influenced by demand-side strategies which restrict their behavioral change tendencies. Prohibitive costs of water-efficient devices (i.e., physical opportunity barriers) restrict low-income household members from purchasing and installing water-efficient appliances. Thus, the use of water-efficient devices among this group may not be possible. However, combinations of increased rebate programs and public education in the performance of water-efficient devices could increase the effectiveness of conservation intentions (reflective motivation). Subsidy programs for household water-saving devices could encourage the installation of these devices in the household to reduce water consumption [2,34]. This will encourage households to build physical infrastructure and mechanical facilities needed in the household to reduce water consumption and invest in quality water-efficient products.
Other prevalent and predictive barriers for the opportunity group included psychological capability barriers. This includes little to no knowledge of water-conservation techniques, lack of environmental concern and inadequate conservation information. This is consistent with the study of [35], where information about water shortages and behavior actions was shown to be a significant intervening variable between households’ attitudes toward conservation and behavioral intentions. Individuals receptive to information are knowledgeable, and knowledge about drought conditions and water scarcity has a significant effect on intentions to conserve water [36]. For example, people who understand the environmental and socio-economic benefits of water conservation are more likely to practice water-conservation behavior [37,38,39]. Households with relevant conservation information are likely to exhibit higher conservation intentions [40]. In contrast, information deficiency makes interventions rarely evaluated or findings disseminated [41,42]. Resistance to implementation may be linked to a lack of information and skills or an indifference toward water-conservation activities [43]. To overcome the barriers described above, intervention activities need to persuade households to become involved in conservation activities by receiving adequate information. One example of such an intervention is awareness creation through an effective community-based conservation campaign that sets out practical ways to conserve water that eliminate or work around the barriers to conserving water resources.
Barriers in the opportunity group are also related to social opportunity. This includes distrust (inter-personal and institutional distrusts) and demographics. Household water-conservation activities incorporate the influence of distrust, peer influences, and utilitarian water beliefs on conservation behavior. In this study, households in the opportunity profile believed water as a natural resource is infinite, should not be restricted and that they should be allowed to use water as much as they want. People who considered water as a renewable or unlimited resource exhibited less water-conservation behavior and had lower intentions to install water-efficient appliances [19,44]. Thus, households should be encouraged to believe in their vulnerability to drought and in the benefits of water conservation for the environment. Furthermore, it was reported that personal and institutional distrust obstructs conservation behavior. Households perceived that management and social networks responsible for water services were reluctant to support conservation initiatives. Individuals are more likely to endorse an intervention if key personalities and individuals in their social networks will support the actions [45]. Intervention activities involving committed staff members, individuals who serve as role models or guides for testing, encouraging, carrying out, and promoting conservation activities must be the champions for conservation programs.
Effects of Socio-Demographic Variables Associated with Profile Solutions
The highest mean age of participants was associated with the capability group. In the capability group age was a barrier to water-conservation behavior (i.e., physical capability barriers) and these respondents were also less likely to undertake water-conservation activities. Socio-demographic characteristics such as age and gender influence conservation intentions and water consumption styles. For example, older household members (retirees) are high water consumers because they stay at home more regularly than when they were working full time, teenagers in a household increase water consumption, and full-time working adults reduce water usage [46,47,48,49,50]. Although older household occupants are expected to be water conservers [51], there is no significant relationship between age and water-conservation intentions [46]. Age underscores intricacies in the relation between age and water-conservation behavior as a function of the demands related with specific life stages [32].
5. Conclusions
Identifying barriers and drivers of water-conservation activities remain one of the most important aspects of safeguarding the sustainable use of water resources. Profiling the barriers and drivers of water-conservation behavior can make an important contribution to understanding and constructing successful water-conservation strategies. The profiling approach, as used in this study, expressed different barriers and drivers of water conservation into relevant behavior conditions. The profiling approach advances the understanding of these barriers and drivers of water-conservation behavior in relation to the COM behavior conditions. The findings suggest that these barriers and drivers can be linked to the relevant intervention activities based on the COM-B framework. Government water agencies and stakeholders could use profiling to uncover possible implementation strategies that will abate and break down local conservation barriers and intensify drivers of water- conservation behavior to inform policy-making decisions.
Latent profile analysis is an empirical approach to identifying the barriers and drivers of household water-conservation behavior. Thus, our study has a quantitative focus-based strongly on various statistical analyses. Human behavior is highly personal and context specific, aspects of which are understood through qualitative studies. The addition of qualitative data, on human behavior, could enrich the outcomes and findings of our study. Limited resources prevented the addition of qualitative data to our study. Future investigations could favor a mixed methods approach for a study of this nature. Furthermore, the data used in this study focused on household water use as opposed to other water uses, such as in the agricultural and industrial sectors. Inclusion of these sectors could provide more extensive data on water use and conservation behavior. While the data used in our study is nationally representative, it is limited in scope, as it does not include situational variables, which are vital to elucidate relationships between water-conservation behavior and the COM-B dimensions among many different water-user groups. Future investigations will require studies in multiple settings to determine the extent to which COM-B dimensions could be applied by researchers to understand well-defined pro-environmental behaviors in other sectors.
Regardless of these study limitations, understanding the profile of individuals may be used to better influence water-conservation behavior. The implications of this study on the identified barriers and drivers to water conservation suggest water conservation strategies must consider the heterogeneity of water-conservation behaviors that occur among individuals. A one size fits all approach is unlikely to be effective. Coordinating barriers and drivers of water conservation with associated behavior condition(s) may guide intervention strategies to strengthen drivers of effective water conservation and policy decisions. These profiling groups, link interventions to reduce barriers such as time constraints and promote drivers such as social support of positive household water-conservation behaviors by altering and directing appropriate behavior conditions to individual water consumers. Profiling may also assist in better modelling of decisions associated with the adoption of water-aware technologies in urban areas [52]. Conserving water is a significant human concern [53]. Understanding the behavioral profile of households will contribute to addressing water-conservation issues at a time when society is facing increasing pressures on water resources.
Author Contributions
Conceptualization, I.B.A.; methodology, I.B.A.; formal analysis, I.B.A.; investigation, I.B.A., M.C.T., M.P.; data curation, I.B.A.; writing—original draft preparation, I.B.A., M.C.T., M.P.; writing—review and editing, I.B.A., M.C.T., M.P.; visualization, I.B.A.
Funding
This research received no external funding.
Acknowledgments
A scholarship from the University of New England for IA is acknowledged. Conversations with Navjot Bhullar and Don Hine improved the study.
Conflicts of Interest
The authors declare no conflict of interest.
Appendix A

Table A1.
Items used in Survey 1 assessing household water-conservation behavior attitudes, barriers and drivers.
Table A1.
Items used in Survey 1 assessing household water-conservation behavior attitudes, barriers and drivers.
| Dimensions | Sub-Dimension | Items |
|---|---|---|
| Capability | Physical capability | It is important to check and repair minor water leakages |
| I consider collecting rainwater for watering my garden | ||
| It is important to collect water from shower/sink/bath for use elsewhere | ||
| Water-efficient devices too costly | ||
| Lack of skills to participate in conservation activities | ||
| Psychological capability | It is important to understand the impacts of water shortages on the environment | |
| It is good to have a knowledge about water crisis; it increases your conservation awareness | ||
| Lack of knowledge about the importance of water conservation | ||
| Little to no knowledge of water-conservation techniques | ||
| Inadequate conservation information | ||
| Paucity of theory-based research-driven programs and evaluation | ||
| Acuity of water-efficient devices | ||
| Lack of information on water-efficient devices | ||
| Poor feedback on water consumption | ||
| Lack of environmental concern | ||
| Opportunity | Physical opportunity | I think financial incentives or rebates are likely to promote water-conservation measures |
| Some people use communal appliances; they do not buy their own appliances | ||
| It is worthy to take an extra time to save water | ||
| Time constraints and availability; time-consuming | ||
| Lack of clarity regarding conservation programs | ||
| Lack of incentives and rebates | ||
| Inflexibility of water infrastructure | ||
| Lack of resources for initiatives | ||
| Prohibitive cost of water-efficient devices | ||
| Climate change/seasonal variability | ||
| Landscapes choices | ||
| Lack of funds for monetary support; disincentives or no rebates | ||
| Social opportunity | Socio-economic factors (e.g., age, gender) | |
| Inter-personal and institutional distrust | ||
| People conserve water because of their cultural beliefs | ||
| Social pressure is a key influential to water conservation | ||
| Obsolete values, beliefs and customs (social and cultural cues) | ||
| Housing status influence water-conservation behavior (e.g., unit, detached, storey, age) | ||
| Motivation | Reflective motivation | It is everyone’s responsibility to conserve water for the future |
| It pays to save water around the house and garden | ||
| It is good to be conscious of the amount of water use in each day | ||
| It is an offense for not installing water-efficient appliances in the house and garden | ||
| It is advisable to use quality water-efficient appliances | ||
| Discomfort in using water-efficient devices | ||
| Automatic motivation | I always forget to turn off the tap when washing face or brushing teeth | |
| It is inconvenient for me to use water-efficient devices | ||
| Lack of motivation affects my water-conservation behavior | ||
| I am not concerned at all with water conservation | ||
| I am not committed to water-conservation actions | ||
| Water conservation is not my sole responsibility | ||
| I conserve water whenever and wherever I can | ||
| Disincentives on water-efficient devices reduce water conservation | ||
| Lack of environmental values and conservation attitudes | ||
| Laziness/lackadaisical attitudes toward water conservation | ||
| It is impractical for me to conserve water | ||
| It is inconvenient for me to conserve water |
Appendix B
Table A2.
Items used in Survey 2 assessing households’ actual water-conservation behavior.
| Scale | Items |
|---|---|
| Actual ownership of water-efficient devices | Front-loading washing machine |
| Water-efficient dishwashers | |
| Water-efficient taps | |
| Tap aerators | |
| Dual-flush toilet | |
| Low-volume showerheads | |
| Baths and indoor spa | |
| Automatic electronic reticulation systems | |
| Sprinklers (drippers/pop-ups) | |
| Hand held hose for garden | |
| Watering can for garden | |
| Low-volume tap | |
| Hot water insulation | |
| Water collection system for sink/washing machine/shower | |
| Manual automated reticulation system | |
| Perceptions about water-efficient devices | Water-efficient appliances are a promising idea |
| Water-efficient appliances do not save enough water to be worth the cost | |
| Water-efficient appliances are costly | |
| I look for a good water usage rating when buying appliances | |
| I think water-efficient appliances are good if they are cost effective | |
| Water-efficient appliances can be a hassle to use | |
| Water-efficient appliances should be mandatory | |
| Indoor water-conservation practices | I connect a rain tank to bathroom |
| I make sure that taps do not drip | |
| I use minimal water for cleaning | |
| I take shorter showers | |
| I flush the toilet less often | |
| I only use the washing machine when it is full | |
| I do not hose my driveway | |
| I use a broom, not a hose for cleaning | |
| I only use the dishwasher when it is full | |
| I fix leaks when they occur | |
| I do not use an in-sink disposal unit | |
| I use water-efficient taps | |
| I have a dual-flush toilet | |
| I do not use running water for rinsing | |
| I turn off taps when brushing my teeth | |
| I use water-efficient showerheads | |
| I use a water-efficient/front-loading washing machine | |
| I hand wash clothes | |
| I do not conserve water | |
| Outdoor water-conservation practices | I allow my lawn to go brown if there is insufficient rain |
| I strictly adhere to water restrictions | |
| I rarely water my garden | |
| I reduce lawn area | |
| I do not wash my car with water | |
| I use drought-resistant grass | |
| I connect a rain tank to the garden | |
| I use a watering can, not a hose | |
| I install and use efficient irrigation | |
| I wash the car less often | |
| I collect water from shower/sink/bath for use elsewhere | |
| I recycle grey water from the washing machine for garden | |
| I recycle grey water from the shower for garden | |
| I have a drought-tolerant plants/low-water consumption garden | |
| I mulch the garden regularly | |
| I group plants with similar needs | |
| I collect water when it rains (not in a rainwater tank) | |
| I water the garden according to conditions | |
| I irrigate in the morning or evening | |
| I have a rain water tank |
References
- McKenzie-Mohr, D. Fostering Sustainable Behavior: An Introduction to Community Based Social Marketing; New Society: Gabriola Island, BC, Canada, 2011. [Google Scholar]
- Steg, L.; Vlek, C. Encouraging pro-environmental behaviour: An integrative review and research agenda. J. Environ. Psychol. 2009, 29, 309–317. [Google Scholar] [CrossRef]
- Stern, P.C. New environmental theories: Toward a coherent theory of environmentally significant behaviour. J. Soc. Issues 2000, 56, 407–424. [Google Scholar] [CrossRef]
- Kollmuss, A.; Agyeman, J. Mind the gap: Why do people act environmentally and what are the barriers to pro-environmental behavior? Environ. Educ. Res. 2002, 8, 239–260. [Google Scholar] [CrossRef]
- Lane, H.; Krogh, C.; O’Farrell, L. Identifying social attitudes and barriers to water conservation: A community water survey. Rainwater Urban Des. 2007, 20, 583–594. [Google Scholar]
- Stokes, L.C.; Mildenberger, M.; Savan, B.; Kolenda, B. Analysing barriers to energy conservation in residences and offices: The Rewire program at the University of Toronto. Appl. Environ. Educ. Commun. 2012, 11, 88–98. [Google Scholar] [CrossRef]
- Graymore, M.; Wallis, A.; O’Toole, K. Understanding drivers and barriers: The key to water use behaviour change. Water Sci. Technol. Water Supply 2010, 10, 679–688. [Google Scholar] [CrossRef]
- Corral-Verdugo, V.; Frías-Armenta, M. Personal normative beliefs, antisocial behaviour, and residential water conservation. Environ. Behav. 2006, 38, 406–421. [Google Scholar] [CrossRef]
- Berk, R.A.; Cooley, T.F.; LaCivita, C.J.; Parker, S.; Sredl, K.; Brewer, M. Reducing consumption in periods of acute scarcity: The case of water. Soc. Sci. Res. 1980, 9, 99–120. [Google Scholar] [CrossRef]
- Fernandino, G.; Elliff, C.I.; Silva, I.R. Ecosystem-based management of coastal zones in face of climate change impacts: Challenges and inequalities. J. Environ. Manag. 2018, 215, 32–39. [Google Scholar] [CrossRef] [Green Version]
- Loh, M.; Coghlan, P. Domestic Water Use Study in Perth, Western Australia, 1998–2001; Water Corporation: Perth, Australia, 2003. [Google Scholar]
- Corral-Verdugo, V.; Frias-Armenta, M.; Pérez-Urias, F.; Orduña-Cabrera, V.; Espinoza Gallego, N. Residential water consumption, motivation for conserving water and the continuing tragedy of the commons. J. Environ. Manag. 2002, 30, 527–535. [Google Scholar] [CrossRef]
- Smith, H.M.; Brouwer, S.; Jeffrey, P.; Frijns, J. Public responses to water reuse–Understanding the evidence. J. Environ. Manag. 2018, 207, 43–50. [Google Scholar] [CrossRef]
- Hoque, S.F. Water Conservation in Urban. Households: Role of Prices, Practices and Technologies; IWA Publishing: London, UK, 2014. [Google Scholar]
- Fielding, K.; Russell, S.; Spinks, A.; Mankad, A. Determinants of household water conservation: The role of demographic, infrastructure, behavior, and psychosocial variables. Water Resour. Res. 2012, 48, 1–12. [Google Scholar] [CrossRef]
- Dwyer, C. Behavioral targeting: A case study of consumer tracking on levis.com. In Proceedings of the Fifteen Americas Conference on Information Systems, San Francisco, CA, USA, 6–9 August 2009. [Google Scholar]
- Hildebrandt, M. Profiling: From data to knowledge. DuD: Datenschutz und Datensicherheit 2006, 30, 548–552. [Google Scholar] [CrossRef]
- Castelluccia, C. Behavioural tracking on the internet: A technical perspective. In European Data Protection: Good Health? Serge, G., Leenes, R., De Hert, P., Poullet, Y., Eds.; Springer: Dordrecht, The Netherlands, 2012. [Google Scholar]
- Corral-Verdugo, V.; Bechtel, R.B.; Fraijo-Sing, B. Environmental beliefs and water conservation: An empirical study. J. Environ. Psychol. 2003, 23, 247–257. [Google Scholar] [CrossRef]
- Syme, G.J.; Shao, Q.; Po, M.; Campbell, E. Predicting and understanding home garden water use. Landsc. Urban Plan. 2004, 68, 121–128. [Google Scholar] [CrossRef]
- Michie, S.; van Stralen, M.M.; West, R. The behaviour change wheel: A new method for characterising and designing behaviour change interventions. Implement. Sci. 2011, 6, 1–12. [Google Scholar] [CrossRef]
- Bartholomew, L.K.; Parcel, G.S.; Kok, G.; Gottlieb, N.H.; Fernández, M.E. Planning Health Promotion Programs: An Intervention Mapping Approach, 3rd ed.; Jossey-Bass: San Francisco, CA, USA, 2011. [Google Scholar]
- Moore, J.E.; Mascarenhas, A.; Marquez, C.; Almaawiy, U.; Chan, W.-H.; D’Souza, J.; Straus, S.E. Mapping barriers and intervention activities to behaviour change theory for Mobilization of Vulnerable Elders in Ontario (MOVE ON), a multi-site implementation intervention in acute care hospitals. Implement. Sci. 2014, 9, 160. [Google Scholar] [CrossRef]
- Lanza, S.T.; Flaherty, B.P.; Collins, L.M. Latent class and latent transition models. In Handbook of Psychology: Vol. 2. Research Methods in Psychology; Schinka, J.A., Velicer, W.F., Eds.; Wiley: Hoboken, NJ, USA, 2003; pp. 663–685. [Google Scholar]
- Muthén, L.K.; Muthén, B.O. Mplus: Statistical Analysis with Latent Variables (Version 3.0); Muthén & Muthén: Los Angeles, CA, USA, 2004. [Google Scholar]
- Schwarz, G. Estimating the dimension of a model. Ann. Stat. 1978, 6, 461–464. [Google Scholar] [CrossRef]
- Sclove, S.L. Application of model-selection criteria to some problems in multivariate analysis. Psychometrika 1987, 52, 333–343. [Google Scholar] [CrossRef]
- Akaike, H. Factor analysis and AIC. Psychometrika 1987, 52, 317–332. [Google Scholar] [CrossRef]
- Lo, Y.; Mendell, N.R.; Rubin, D.B. Testing the number of components in a normal mixture. Biometrika 2001, 88, 767–778. [Google Scholar] [CrossRef]
- Ostrander, R.; Herman, K.; Sikorski, J.; Mascendaro, P.; Lambert, S. Patterns of psychopathology in children with ADHD: A latent profile analysis. J. Clin. Child. Adolesc. Psychol. 2008, 37, 833–847. [Google Scholar] [CrossRef] [PubMed]
- Herzberg, F.; Mausner, B.; Snyderman, B. The Motivation to Work; John Wiley: New York, NY, USA, 2011; Volume 1. [Google Scholar]
- Russell, S.; Fielding, K. Water demand management research: A psychological perspective. Water Resour. Res. 2010, 46, W05302. [Google Scholar] [CrossRef]
- Jackson, T. Motivating Sustainable Consumption: A Review of Evidence on Consumer Behaviour and Behavioural Change; Sustainable Development Research Network, Centre for Environmental Strategy, University of Surrey: Guildford, UK, 2005; pp. 445–459. [Google Scholar]
- Nauges, C. Greening Household Behaviour and Water; OECD Environment Working Papers, No. 73; OECD Publishing: Paris, France, 2014. [Google Scholar] [CrossRef]
- Trumbo, C.W.; O’Keefe, G.J. Intention to conserve water: Environmental values, reasoned action, and information effects across time. Soc. Nat. Resour. 2005, 18, 573–585. [Google Scholar] [CrossRef]
- Dziegielewski, B. The Drought is Real: Designing a Successful Water Conservation Campaign, UNESCO/ORCAYT. Presented at Inaugural Ceremony International Seminar on Efficient Water Use, Montevideo, Uruguay, 21–25 October 1991. [Google Scholar]
- Cameron, T.A.; Wright, M.B. Determinants of household water conservation retrofit activity: A discrete choice model using survey data. Water Resour. Res. 1990, 26, 179–188. [Google Scholar]
- Middlestadt, S.; Grieser, M.; Hernandez, O.; Tubaishat, K.; Sanchack, J.; Southwell, B.; Schwartz, R. Turning minds on and faucets off: Water conservation education in Jordanian schools. J. Environ. Educ. 2001, 32, 37–45. [Google Scholar] [CrossRef]
- Dolnicar, S.; Hurlimann, A.; Grün, B. Water conservation behaviour in Australia. J. Environ. Manag. 2012, 105, 44–52. [Google Scholar] [CrossRef]
- Gilg, A.; Barr, S. Behavioural attitudes towards water saving? Evidence from a study of environmental actions. Ecol. Econ. 2006, 57, 400–414. [Google Scholar] [CrossRef]
- Lehmann, P.K.; Geller, E.S. Behaviour analysis and environmental protection: Accomplishments and potential for more. Behav. Soc. Issues 2004, 13, 13–32. [Google Scholar] [CrossRef]
- Revell, K. The role of local authorities in stimulating pro-environmental behaviour change in the Borough population. Presented at International Sustainable Conference 2012, Basel, Switzerland, 29–31 August 2012. [Google Scholar]
- Grol, R.; Grimshaw, J. Evidence-based implementation of evidence-based medicine. The Joint Commission. J. Qual. Improv. 1999, 25, 503–513. [Google Scholar] [CrossRef]
- Lam, S.P. Predicting intentions to conserve water from the theory of planned behavior, perceived moral obligation, and perceived water right. J. Appl. Soc. Psychol. 1999, 29, 1058–1071. [Google Scholar] [CrossRef]
- Greenhalgh, T.; Robert, G.; Macfarlane, F.; Bate, P.; Kyriakidou, O. Diffusion of innovations in service organizations: Systematic review and recommendations. Milbank Q. 2004, 82, 581–629. [Google Scholar] [CrossRef] [PubMed]
- Lam, S.P. Predicting intention to save water: Theory of planned behavior, response efficacy, vulnerability, and perceived efficiency of alternative solutions. J. Appl. Soc. Psychol. 2006, 36, 2803–2824. [Google Scholar] [CrossRef]
- Kantola, S.J.; Syme, G.J.; Campbell, N.A. The role of individual differences and external variables in a test of the sufficiency of Fishbein’s model to explain behavioural intentions to conserve water. J. Appl. Soc. Psychol. 1982, 12, 70–83. [Google Scholar] [CrossRef]
- Lyman, R.A. Peak and off-peak residential water demand. Water Resour. Res. 1992, 28, 2159–2167. [Google Scholar] [CrossRef]
- Mayer, A.; Czerwinski, J.; Pétermann, J.L.; Wyser, M.; Legerer, F. Reliability of DPF-Systems: Experience with 6000 Applications of the Swiss Retrofit Fleet (No. 2004-01-0076); SAE Technical Paper; SAE International: Warrendale, PA, USA, 1999. [Google Scholar] [CrossRef]
- Makki, A.A.; Stewart, R.A.; Panuwatwanich, K.; Beal, C. Revealing the determinants of shower water end use consumption: Enabling better targeted urban water conservation strategies. J. Clean. Prod. 2013, 60, 129–146. [Google Scholar] [CrossRef]
- Clark, W.A.; Finley, J.C. Household water conservation challenges in Blagoevgrad, Bulgaria: A descriptive study. Water Int. 2007, 33, 175–188. [Google Scholar] [CrossRef]
- Rozos, E.; Butler, D.; Makropoulos, C. An integrated system dynamic–cellular automata model for distributed water-infrastructure planning. Water Sci. Technol. Water Supply 2016, 16, 1519–1527. [Google Scholar] [CrossRef]
- Vörösmarty, C.J.; McIntyre, P.B.; Gessner, M.O.; Dudgeon, D.; Prusevich, A.; Green, P.; Glidden, S.; Bunn, S.E.; Sullivan, C.A.; Reidy Liermann, C.; et al. Global threats to human water security and river biodiversity. Nature 2010, 467, 555–561. [Google Scholar] [CrossRef] [Green Version]
Figure 1.
Flow diagram of data collection and processes.

Figure 2.
Profile characteristics explaining the 3 profile groups by their attitudes, barriers and drivers of water-conservation behavior (N = 510). Sample average = 0.
Figure 2.
Profile characteristics explaining the 3 profile groups by their attitudes, barriers and drivers of water-conservation behavior (N = 510). Sample average = 0.

Table 1.
Model fit indices for the 1, 2 and 3-profile solutions. The best-fitting statistical solution indicates lower BIC and AIC values and a significant LMRT value. All entropy values showed an ideal fit. *** p < 0.001.
Table 1.
Model fit indices for the 1, 2 and 3-profile solutions. The best-fitting statistical solution indicates lower BIC and AIC values and a significant LMRT value. All entropy values showed an ideal fit. *** p < 0.001.
| Profile Solutions | BIC | AIC | LMRT | Entropy |
|---|---|---|---|---|
| 1 | 2768 | 2528 | −1228.34 *** | 0.79 |
| 2 | 3692 | 5469 | −1243.17 | 0.77 |
| 3 | 2350 | 2050 | −1130.98 *** | 0.81 |
Table 2.
Key demographic and outcome variables: mean (M), standard deviation (SD), and group differences.
Table 2.
Key demographic and outcome variables: mean (M), standard deviation (SD), and group differences.
| Outcome Variables | Profile 1: Capability (n = 189) M SD | Profile 2: Opportunity (n = 119) M SD | Profile 3: Motivation (n = 202) M SD | Group Differences F Partial η2 |
|---|---|---|---|---|
| Mean age (years) | 57.08 a 1.97 | 54.22 a 1.89 | 53.87 a 1.68 | 31.43 ** 0.04 |
| Education level | 3.48 a 0.17 | 3.79 b 0.18 | 3.45 b 0.16 | 8.69 *** 0.01 |
| Residential status | 1.29 a 0.06 | 1.43 b 0.08 | 1.41 b 0.07 | 5.78 ** 0.02 |
| Access to a garden | 1.13 a 0.03 | 1.16 a 0.04 | 1.14 a 0.03 | 7.43 *** 0.01 |
| Indoor behavior | 4.46a 0.14 | 4.21 a 0.16 | 4.29 a 0.15 | 6.89 * 0.01 |
| Outdoor behavior | 4.39 a 0.09 | 4.16 a 0.10 | 4.25 c 0.09 | 4.56 *** 0.03 |
| Ownership of water-efficient devices | 1.83 a 0.06 | 1.76 b 0.04 | 1.85 a 0.05 | 3.21 * 0.02 |
| Perceptions of water-efficient devices | 3.58 a 0.07 | 3.60 b 0.09 | 3.89 a 0.10 | 2.34 ** 0.01 |
| Future expectancy of water crises | 2.28 a 0.09 | 2.32 a 0.11 | 2.39 c 0.12 | 4.22 *** 0.01 |
Notes: N = 510. Wilks’ lambda (Λ) = 0.06, F (13, 507) = 10.98, p < 0.001, η2 = 0.32. Means with different superscripts (in rows) vary significantly at p < 0.05. Possible score ranges: education level, residential status, indoor behavior, outdoor behavior, ownership, perceptions, future expectancy variables from 1 to 5; access to a garden from 1 to 2. * p < 0.05, ** p < 0.01, *** p < 0.001. η2 = Partial Eta squared.
© 2018 by the authors. Licensee MDPI, Basel, Switzerland. This article is an open access article distributed under the terms and conditions of the Creative Commons Attribution (CC BY) license (http://creativecommons.org/licenses/by/4.0/).
Share and Cite
MDPI and ACS Style
Addo, I.B.; Thoms, M.C.; Parsons, M. Barriers and Drivers of Household Water-Conservation Behavior: A Profiling Approach. Water 2018, 10, 1794. https://doi.org/10.3390/w10121794
AMA Style
Addo IB, Thoms MC, Parsons M. Barriers and Drivers of Household Water-Conservation Behavior: A Profiling Approach. Water. 2018; 10(12):1794. https://doi.org/10.3390/w10121794
Chicago/Turabian StyleAddo, Isaac B., Martin C. Thoms, and Melissa Parsons. 2018. "Barriers and Drivers of Household Water-Conservation Behavior: A Profiling Approach" Water 10, no. 12: 1794. https://doi.org/10.3390/w10121794
Note that from the first issue of 2016, this journal uses article numbers instead of page numbers. See further details here.