Article

Treatment of Eutrophic Water and Wastewater from Valsequillo Reservoir, Puebla, Mexico by Means of Ozonation: A Multiparameter Approach

by
J. Tabla-Hernández
1,
P. F. Rodríguez-Espinosa
1,*,
A. G. Hernandez-Ramirez
1,
Jorge A. Mendoza-Pérez
2,
E. R. Cano-Aznar
1 and
E. Martínez-Tavera
3
1
Centro Interdisciplinario de Investigaciones y Estudios sobre Medio Ambiente y Desarrollo (CIIEMAD), Instituto Politécnico Nacional (IPN), Calle 30 de junio de 1520, Barrio de la Laguna Ticomán, Del. Gustavo A Madero C.P. 07340, Mexico
2
Escuela Nacional de Ciencias Biológicas (ENCB) del Instituto Politécnico Nacional (IPN), Av. Wilfrido Massieu SN, San Bartolo Atepehuacan, U.P. Adolfo López Mateos, Gustavo A. Madero C.P. 07738, Mexico
3
Faculty of Bioenvironmental Sciences, Universidad Popular Autónoma del Estado de Puebla (UPAEP), 17 Sur No. 901 Barrio de Santiago, Puebla, Puebla, México C.P. 72410, Mexico
*
Author to whom correspondence should be addressed.
Water 2018, 10(12), 1790; https://doi.org/10.3390/w10121790
Submission received: 15 November 2018 / Revised: 3 December 2018 / Accepted: 3 December 2018 / Published: 6 December 2018
(This article belongs to the Special Issue Advanced Oxidation Technologies in Industrial Wastewater Treatment)

Abstract

:
The present work aims to elucidate the possibility of injecting ozone into surface waters combined with urban wastewaters in order to improve the water quality of the High Atoyac Sub-basin (HAS) in Central Mexico. For this purpose, twenty physicochemical parameters, eight heavy metals, seven organic compounds, and one biological indicator were assessed in water from different sites of the studied area (the Alseseca River, the Atoyac River and the Valsequillo Reservoir). Results demonstrated that O3 injection led to the decrease of the aromatic fraction of organic molecules since the Spectral Absorption Coefficient at 254 nanometers (SAC254) reduction was found to be 31.7% in the Valsequillo Reservoir water samples. Maximum Chemical Oxygen Demand (COD) removal was observed to be 60.2% from the Alseseca River with a 0.26 mg O3/mg initial COD dose. Among all the phthalates studied in the present work, Di(2-ethylhexyl) phthalate (DEHP) exhibited the highest concentration (5.8 μg/L in the Atoyac River). Treatment with O3 was not effective in eliminating fecal coliforms (FC) in waters that host high organic matter (OM) loads as opposed to waters with low OM. After the injection of 4.7 mg O3/mg COD in the VO3-AT water sample, a 90% removal of Iron (Fe) and Aluminum (Al) was registered; while Manganese (Mn), Nickel (Ni), Zinc (Zn), and Cooper (Cu) showed a 73%, 67%, 81%, and 80% removal, respectively; Chromium (Cr) registered the highest removal (~100%). The present work demonstrated that while finding a suitable O3 dose to improve the quality of water in the HAS, the 5-days Biochemical Oxygen Demand (BOD5)/COD ratio (i.e., biodegradability) is more important than the overall OM removal percentage proving that O3 injection is a feasible process for the treatment of eutrophic waters from HAS.

Graphical Abstract

1. Introduction

In recent years, the treatment of both natural and wastewaters with ozone has gained increasing attention because of its vital role in the removal of OM (especially the recalcitrant organic matter) and disinfection. When treating wastewater with O3, contaminants can be degraded following two paths separately or simultaneously: (1) direct reaction with ozone (O3); preferably under acidic conditions or (2) indirect reaction with the hydroxyl radicals (OH•) formed at neutral or alkaline conditions and driven by a complex chain mechanism [1,2]. O3 is a selective oxidant that preferably attacks the fraction of the OM rich in electrons (aromatic compounds, double bond compounds, etc.), but unlike ozone, OH• is an oxidizer species much more powerful than O3 than can react faster and less selectively [3,4].
Ozone has been used to treat a wide variety of pollutants such as natural organic matter, heavy metals, pathogens, and emerging organic compounds [2,5,6,7]. Ozone has shown to be efficient in improving the organoleptic properties of water by eliminating chemical compounds that color water by oxidizing fats and oils (FaO) and by reducing turbidity through colloid destabilization [8,9,10]. When treating wastewater that hosts high OM load, the main goal of ozonation is to produce biodegradable OM from not-biodegradable OM [11,12,13]. Gilbert [14] registered a biodegradability increase as the BOD5/COD ratio varied from 0–0.4 with 4 mg O3/mg of DOC in the treatment of humic acids with O3. Yavich et al. [15] found that the treatment of OM in Lake Lasing, MI, USA, by means of ozonation was suitable in transforming 32% of recalcitrant OM into biodegradable OM with a 3.0 mg O3/mg C dose.
Ozone has also been widely used in disinfecting municipal wastewater as it is an excellent disinfectant which inactivates a wide range of microorganisms [16,17]. Monitoring every pathogen, however, is not feasible; hence, fecal coliforms (FC) have been extensively used as global bioindicators [18] since the FC inactivation is usually less efficient than the inactivation of other undesired pathogens, thus ensuring disinfection of various microorganisms. Martínez et al. [19] in their studies of the sewage in the city of Almería, Spain, showed an FC removal efficiency of up to 88.8% with a 13 mg O3/L dose. If the goal of ozonation is disinfection, the ozone dose applied must be controlled aiming to avoid the undesired formation of disinfection by-products, for instance, bromates and carbonyl compounds (e.g., Formaldehyde and acetaldehyde which are classified as carcinogenic and as a potentially carcinogenic, respectively) [20,21].
To determine the suitable reaction time to reach a certain level of treatment and subsequently establish the appropriate O3 dose (i.e., the moment in which the pollutant’s concentration will not decrease substantially), either for the cracking of aromatic compounds or for disinfection purposes, kinetics is normally assessed. In this regard, kinetic removal of Spectral Absorption Coefficient (SAC254) is frequently used along with Chemical Oxygen Demand (COD) and 5-days Biochemical Oxygen Demand (BOD5) [14,22,23]. Some authors have reported different OM removal kinetics during the ozonation process [11,15,24,25]. With respect to urban wastewater both Crousier et al. [26] in Toulouse, France and Marce et al. [27] in Tarragona, Spain, determined a pseudo-first order kinetics for the removal of dissolved OM (DOM) and of chemical oxygen demand (COD). Meanwhile Beltrin et al. [28] in Badajoz, Spain and Shin et al. [29] in Gwangju, Korea, registered second order kinetics for the COD removal in domestic wastewater.
Ozone has also been employed in the elimination of emerging organic compounds such as phthalates. These are synthetic compounds used as additives in plastics to improve their mechanical properties [2,30]. Despite being classified by the EPA as endocrine disrupting compounds [31], the global phthalate production has reached up to 3.5 million tons per year [32] with the Di(2-ethylhexyl) phthalate (DEHP) being the most commonly used phthalate plasticizer in the production of polyvinyl chloride (PVC) [33,34]. The aromatic ring of the phthalates is destroyed by direct and indirect reaction with the ozone molecules, which can result in efficiently removing up to 90% of the contaminant with a 1700 mg of ozone [2].
The Valsequillo Reservoir located in the state of Puebla, Central Mexico has received significant volumes of industrial and municipal wastewater from the Atoyac River (Northwest) and from the Alseseca River (North) in the past few decades [35], lethally affecting the water quality [36]. Consequently, uncontrolled growth of aquatic weeds is observed, especially the presence of the Water hyacinth (Eichhronia crassipes), which in turn has also contributed to the enrichment of OM in the Valsequillo Reservoir. Thus, there is a real need to propose a strategy to minimize pollution levels in the area and the treatment with ozone seems to be a feasible alternative due to its ability to function in the multiple stages of the water treatments (i.e., primary, secondary and tertiary treatment). Even though some studies with respect to ozonation of wastewater have been conducted, the ozonation process is different for each type of water due to the different paths that ozonation can take as well as the diversity of pollutants contained in the wastewaters. Therefore, the present work deals with the evaluation of different organic and inorganic contaminants (commonly found in urban wastewaters), during ozonation of wastewater from five different point in the HAS, Central Mexico (Atoyac River, Alseseca River and Valsequillo Reservoir).

2. Materials and Methods
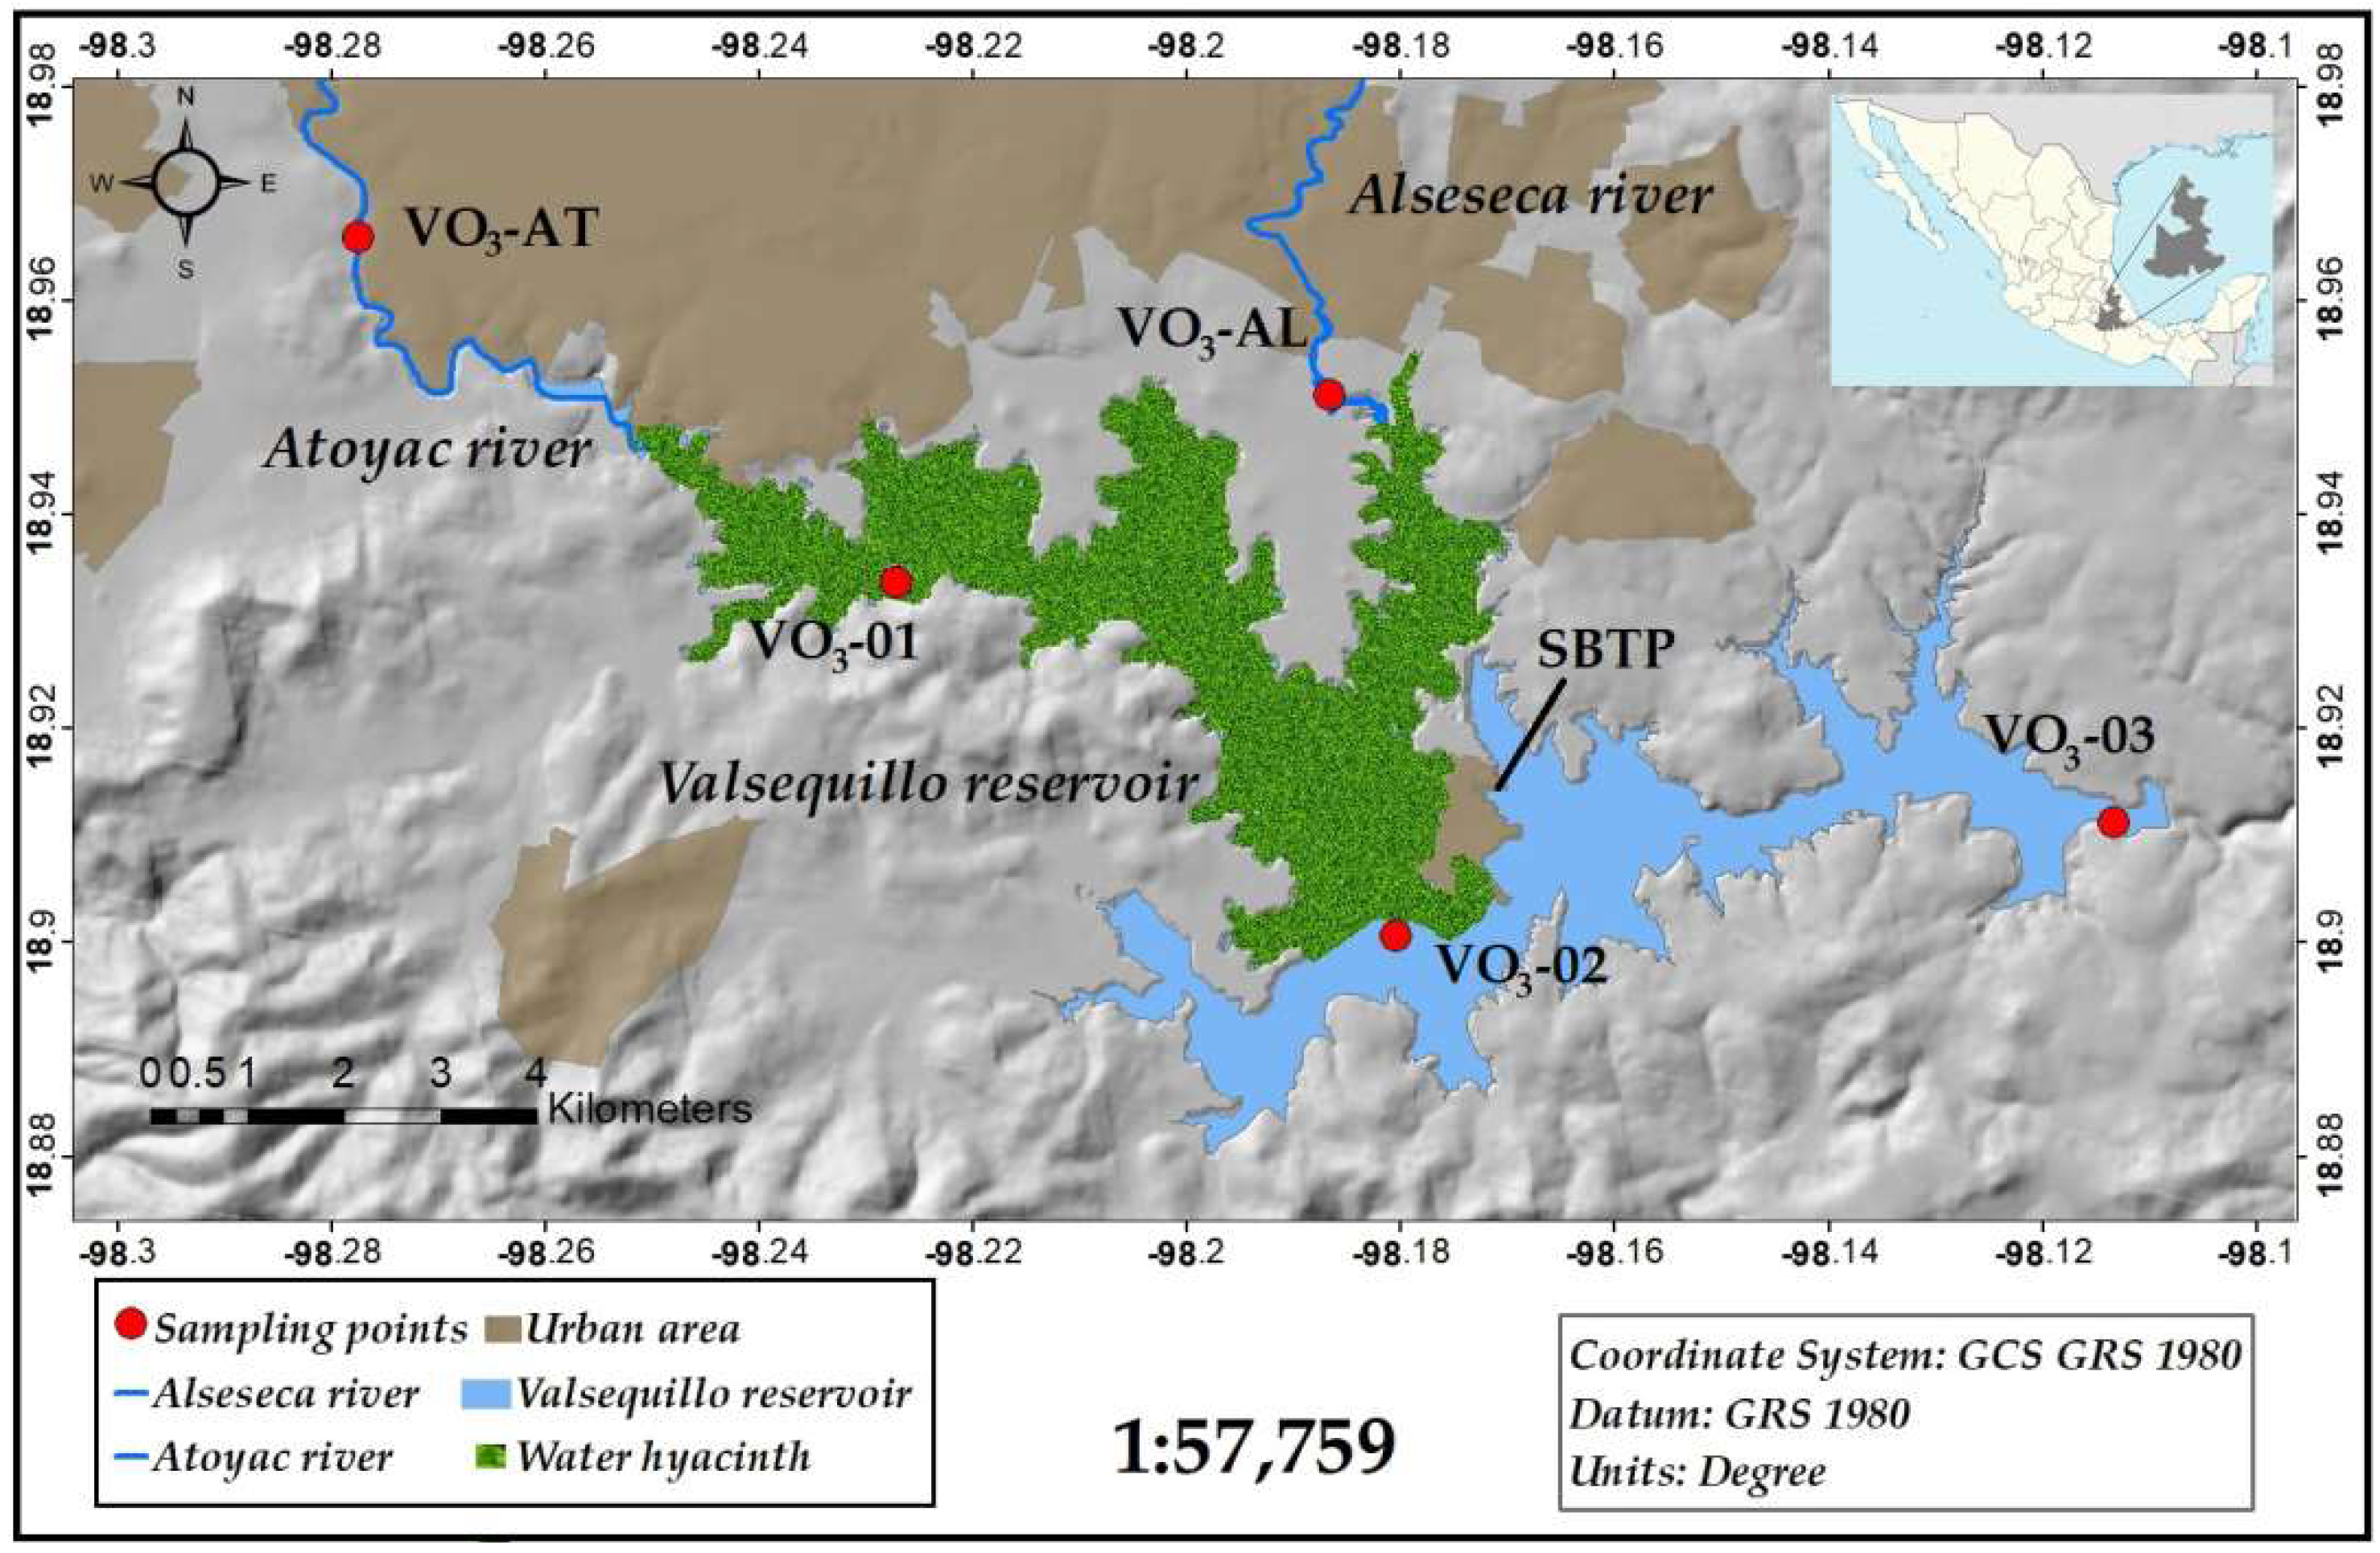
2.1. Study Area

Valsequillo (Manuel Ávila Camacho) Reservoir located (18°55′12″ N; 98°11′24″ W) in the state of Puebla, México was built in 1946 with a wideness ranging from 2 to 7 km and a depth ranging from 2 to 40 m [37,38] (Figure 1).
Based on the preliminary values reported by the NATIONAL BANK OF SURFACE WATERS OF CONAGUA, the average flow entering the Valsequillo Reservoir during rainy season (June, July, August, and September) was calculated and it was found to be 22 m3/s ± 2.6 (n = 38 years) and 1.1 ± 0.11 m3/s (n = 8 years) in the Atoyac River and in the Alseseca River, respectively. The Alseseca’s flow is mainly composed of municipal and industrial discharges (approx. 88%), while the Atoyac River’s flow is composed of only 26% of wastewater [39].
Five water samples were procured from three different zones of the HAS: The first water sample was taken at the river mouth of the Atoyac River into the Valsequillo Reservoir (VO3-AT), the second was taken at the river mouth of the Alseseca River into the Valsequillo Reservoir (VO3-AL). Even though the sites for these two water samples located outside the Reservoir; they were selected due to their proximity to it. Three water samples were collected from inside the Reservoir: the first one was taken within the coverage of the Water hyacinth (VO3-01); the second one was taken after the coverage of Water hyacinth (VO3-02) and the third one was taken near the Reservoir’s curtain (VO3-03) (i.e., East of the Valsequillo Reservoir). When selecting sampling points, previous works were taken into consideration [35,38,40] on which it was established that the Valsequillo Reservoir is hydrogeochemically divided into two sections by the San Baltazar Tetela Peninsula (SBTP) (i.e., Norwest and Southeast) (Figure 1). Therefore, the sampling points selected are presumed to be representative of the general conditions of all areas of the Valsequillo Reservoir. All water samples were preserved at 4 °C and transported to Environmental Analysis and Monitoring Laboratory of “Centro Interdisciplinario de Investigaciones y Estudios sobre Medio Ambiente y Desarrollo (CIIEMAD-IPN)”in Mexico City.

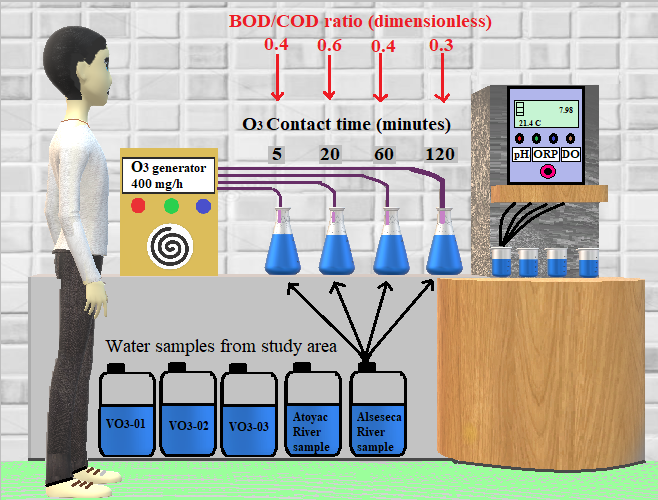
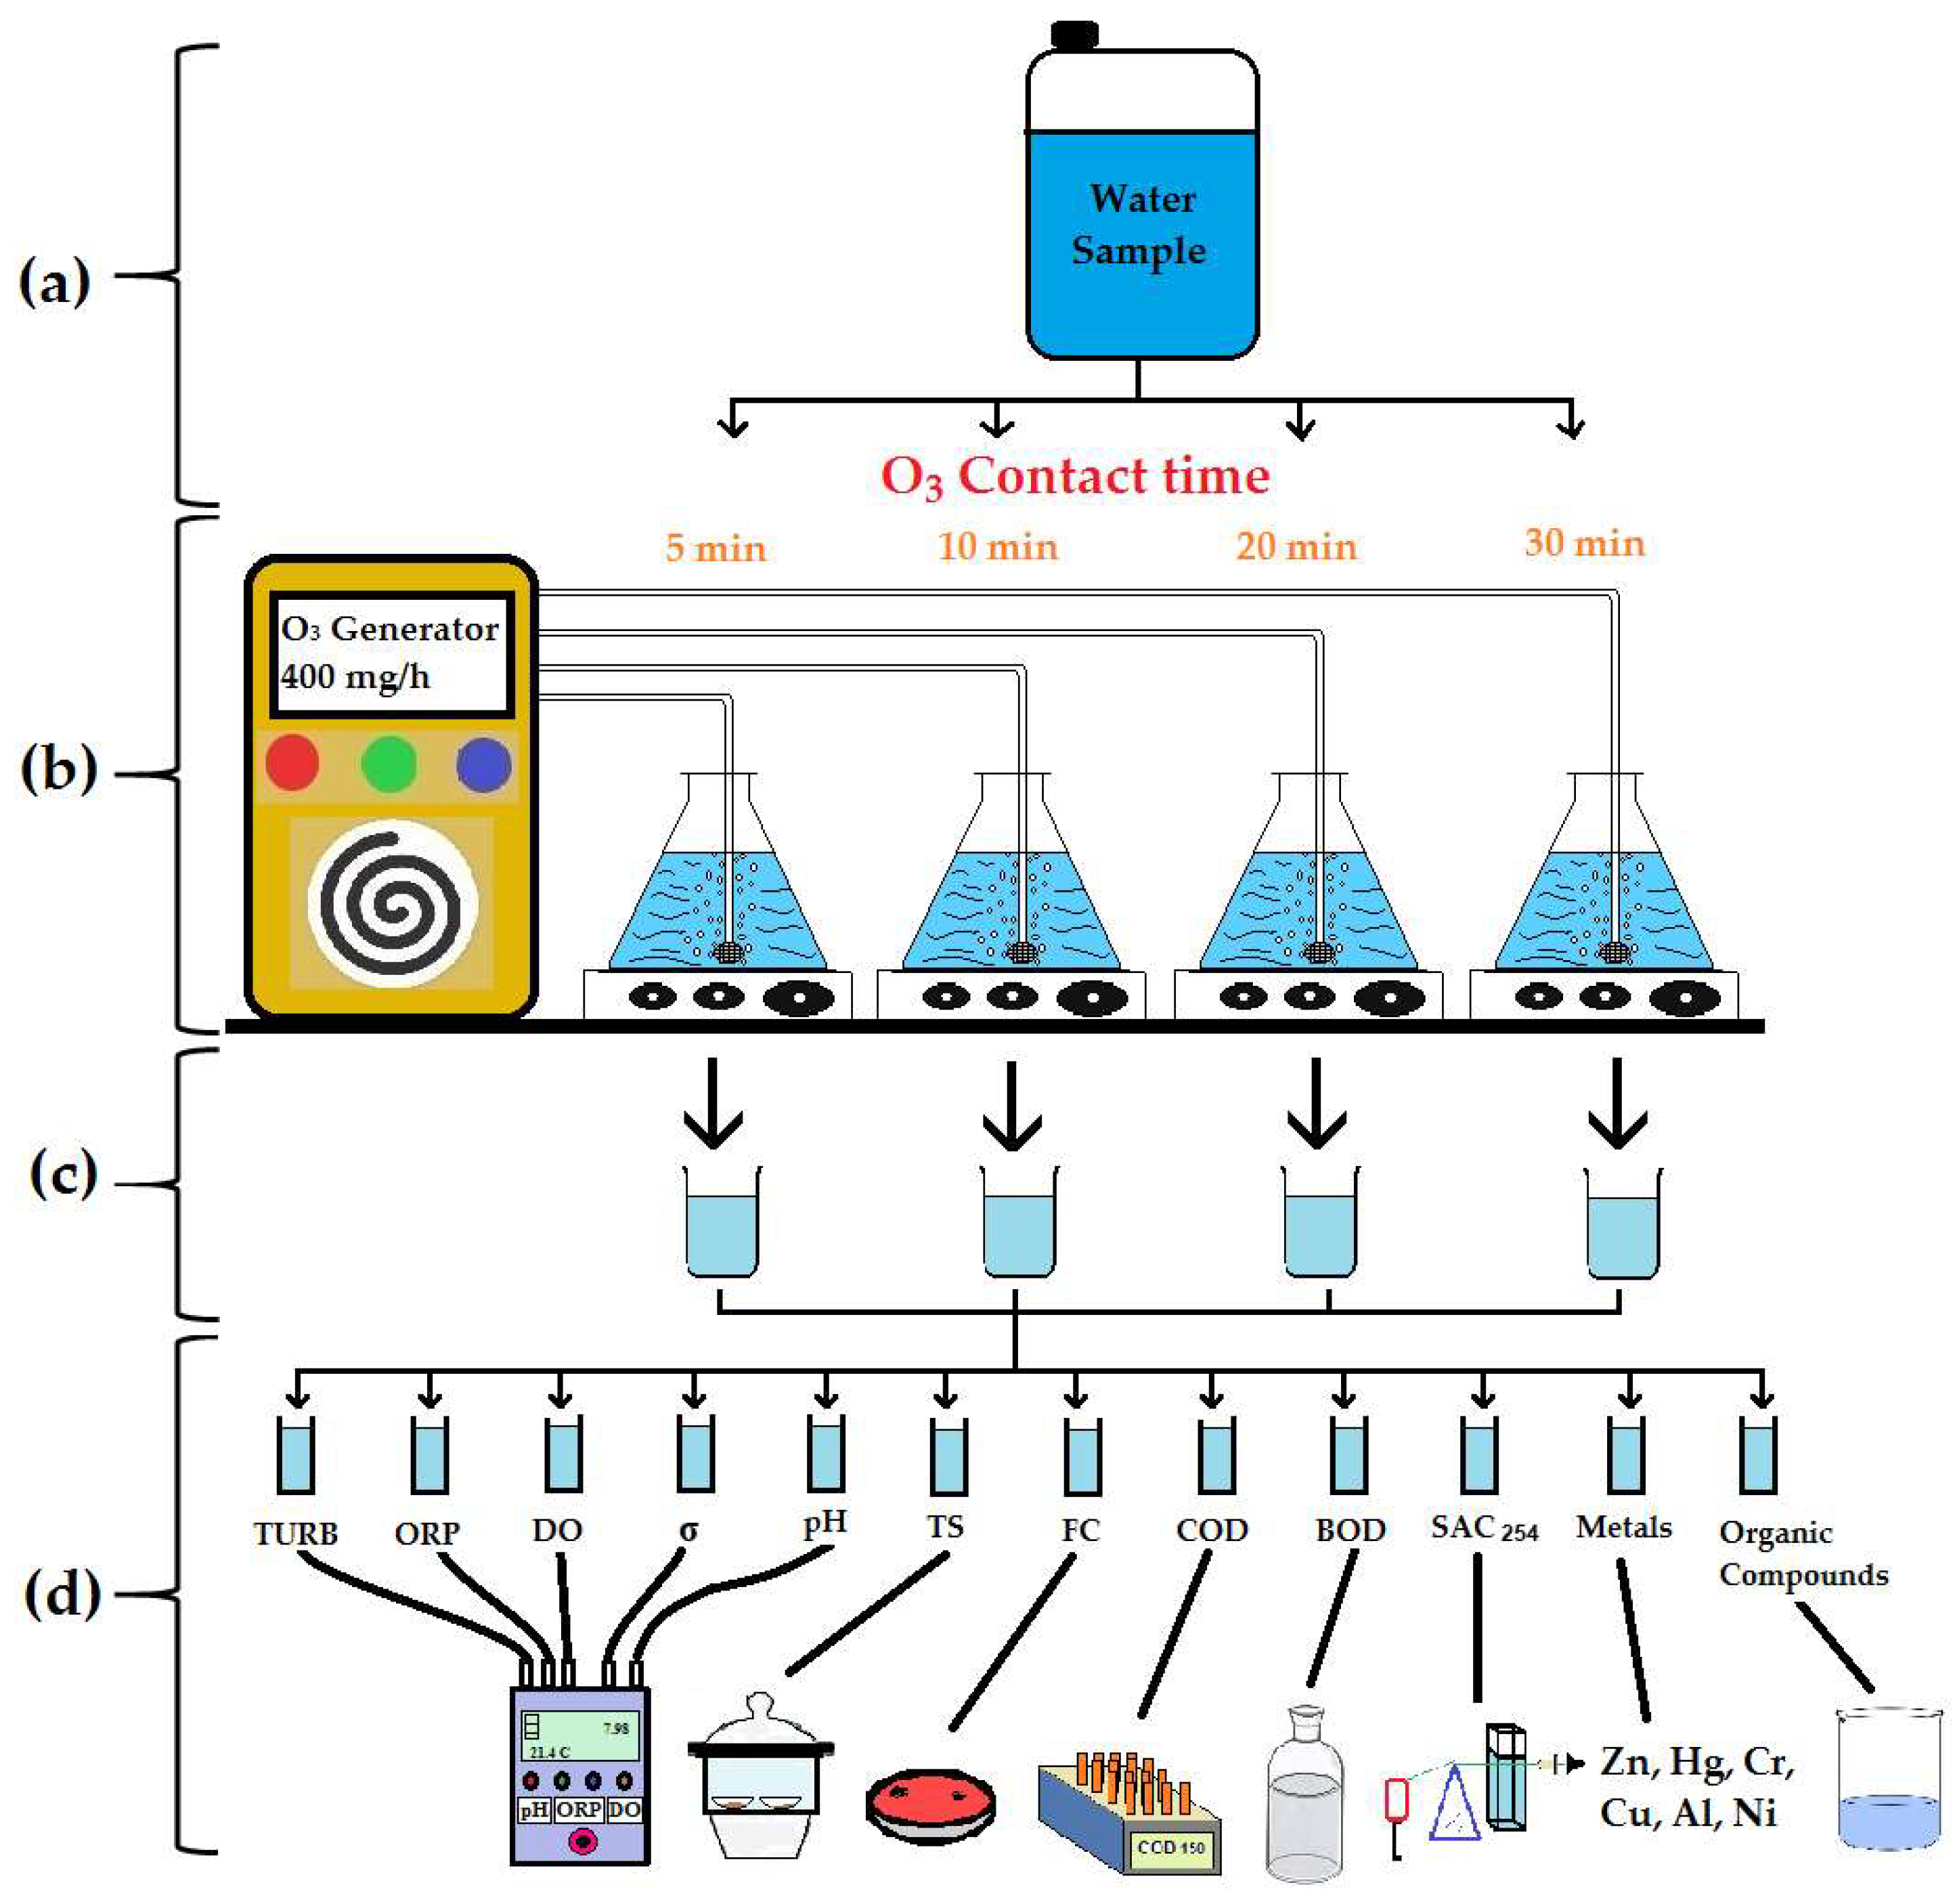
2.2. Experimental Design

Five 1 L glass batch reactors (aliquots) from each water sample were used for the ozone experiments. An ozone generator (OZONI model MF-00001) was used to produce a constant mass flow rate of 400 mg O3/h (i.e., constant volumetric flow rate ~0.21 L ± 0.05 O3/s). Subsequently, the flow was measured by a water displacement system; the test was carried out in triplicate. This device produces ozone by employing the corona discharge method with dehumidified atmospheric air (through the drying filter comprised within the equipment) as the feed gas to generate ozone. One liter of water was subjected to ozone treatment by injecting the gas at the bottom of each bottle and diffusing it with a porous stone aerator (25–30 µm pore diameter). Constant stirring was applied in order to ensure mixing between the liquid and gas phases. During the process, five or four water samples were extracted from the aliquots in different intervals within 120 min in order to measure all physicochemical parameters. Experiments were performed without pH control at around 20 °C. Likewise, all the water samples were treated under the same operating conditions (Figure 2).

2.3. Measurement of Physicochemical Parameters

Turbidity, Alkalinity (Alky), pH, Conductivity (σ), Dissolved Oxygen (DO), Redox-potential (ORP), Chemical Oxygen Demand (COD), Biochemical Oxygen Demand (BOD5) and Spectral Absorption Coefficient at 254 nanometers (SAC254) were measured in CIIEMAD-IPN, CDMX, Mexico. Total Solids (TS), Total Suspended Solids (TSS) and Total Dissolved Solids (TDS) were sent to Centro Mexicano para la Producción más Limpia del Instituto Politecnico Nacional [Mexican Center for Cleaner Production of the National Polytechnic Institute (CMPL-IPN)]. On the other hand, Real color (RC), Fats and Oils (FaO), Total phosphorous (TP), Ammonia nitrogen (NH3-N), Nitrates (NO3), Sulfates (SO42−), Chloride (Cl) Total cyanides (CN), Organic compounds and heavy metals were sent to Intertek + ABC—Analytic Laboratories)]. All parameters were measured by following local standardized methodologies which are in concordance with international methods (Table 1).

2.4. Calculation of Kinetics

For the kinetic calculation, some organic parameters such as COD, BOD5 and SAC254 were measured before and after the ozonation process and at different time intervals (all values in minutes) (5, 10, 15, 20, 30, 40, 60 and 120). For the selection of these time intervals, previous works were taken into consideration [19,41] on which it was established that during ozonation of wastewater the COD concentration presents an increase within the first minutes of operation and subsequently a decrease. In this work, however, only the latter behavior is of interest, so the first measurements were consistently taken after the first 5 min of ozonation. Rate for the different orders of reaction (zeroth, first and second order) were calculated by using Equations (1)–(3), for the zeroth, first and second order reactions, respectively.
[ C ] = [ C 0 ] k t
L n [ C ] = L n [ C 0 ] k t
1 [ C ] = 1 [ C 0 ] + k t
where: C = Concentration of OM [SAC254, COD, BOD5 (mg/L)] at time t, C0 = Initial concentration of OM [SAC254, COD, BOD5 (mg/L)], k = kinetic constant [(L·mol/days) for zeroth order, (1/days) for first order, (L /days mol) for second order], t = time [days], k value was determined as follows, for zeroth order, a plot of [C] vs. t, for first order, a plot of ln[C] vs. t, and finally for second order, a plot of 1/[C] vs. t. For all orders, the plots are linear and the slope is equal to k

3. Results and Discussion

3.1. Raw Water Characteristics of the Different Studied Sites

Raw water characteristics of the Atoyac River, the Alseseca River and the Valsequillo Reservoir are presented in Table 2 and Table 3 (with no ozone injection; t = 0). All water samples were considered slightly alkaline since the initial pH (t = 0) was above seven. In addition, all water samples showed high content of alkalinity (Alky). Water samples VO3-AL and VO3-AT showed the highest values of alkalinity, due to the high calcium carbonate content derived from the groundwater of the HAS whose bedrock is composed of limestone [42].
The redox-potential (ORP) values obtained in the samples were above 100 mV, which in turn indicate that the oxidizing conditions match the normally recorded high Dissolved Oxygen (DO) values. This shows that the ORP and DO values were in accordance to each another [43,44]. The highest COD values recorded in both rivers, were namely at 505 and 172 mg/L for VO3-AL and VO3-AT, respectively, while the lowest COD content (10 mg/L) was observed in VO3-02 and VO3-03. The BOD5/COD ratio of the VO3-AT, VO3-AL, VO3-01, VO3-02 and VO3-03 water samples were 0.33, 0.36, 0.35, 0.96 and 1.0, respectively.
The highest turbidity values were registered in the VO3-AT and VO3-AL water samples (182 NTU), while the lowest value corresponds to VO3-03 (12.2 NTU). The brown coloration observed in the VO3-AT, VO3-AL and VO3-01 water samples might indicate the presence of clay-rich sediments and OM. On the other hand, the green coloration in the VO3-03 water sample may show the presence of clay-rich sediments and plankton [45]. SAC254, Turbidity and Conductivity values of VO3-AL and VO3-AT at the initial stage of the experiment, were found to be similar to those values reported by Marce et al. [27], revealing that water from these sampling points has features of raw urban wastewater. Meanwhile, the water of VO3-02 and VO3-03 stations is similar in quality to the one obtained from a secondary wastewater treatment [46]. Finally, VO3-01 presented features of a secondary effluent [19], which is attributed to Water hyacinths in the Valsequillo Reservoir since they might have performed a natural attenuation process resulting in variations of the pollutant’s concentration throughout the Reservoir [36]. These assumptions are supported by turbidity and conductivity values since the concentration levels in the rivers are higher than in Reservoir. SAC254 levels are greater in the rivers (Atoyac and Alseseca) than in the Valsequillo reservoir. The above mentioned could indicate the natural attenuation driven mainly by the aquatic plants in the Valsequillo Reservoir, which in turn helps in the sedimentation process by modifying the flow velocity. Since the highest SAC254 removal was registered in the sampling point VO3-02, it can be alleged that in this sampling point the fraction of aromatic OM and unsaturated molecules is higher than in the rest of the sampling points. This fact may be due to the release of these components (for example, lignocellulose, humic and fulvic acids, phenolic acids and phenylpropanoids) [47,48]; mainly through the decomposition of the high quantity of aquatic plants. From these results, it can be established that sites VO3-AL and VO3-AT possess certain characteristics featured in raw urban wastewater. On the other hand, VO3-02 and VO3-03 display characteristics of secondary effluents while VO3-01 shows features of both raw and treated wastewaters.

3.2. Ozone Effect over Organic Matter (SAC254, COD and BOD5)

In all water samples, the physicochemical parameters displayed significant changes throughout the entire experimental time. SAC254 values (Table 3) were found to be decreasing as shown: VO3-AL (11.1%), VO3-AT (16.7%), VO3-01 (13.4%), VO3-02 (31.7%) and VO3-03 (19.4%). This tendency makes evident the presence of aromatic organic components since it has been reported that O3 reacts directly with them [49,50,51]. Besides manifesting the reduction of the aromatic fraction of OM, SAC254 reduction also revealed the decrease of the unsaturated molecules. This can be corroborated by the observed reduction in the cyanide’s (CN) concentration in the VO3-AT and VO3-01 water samples, as ozone breaks the triple covalent bonds in the molecule [19,52].
Maximum COD removal during the treatment of O3 was observed to be of 48.7% and 60.2% for VO3-AT and VO3-AL, respectively. These removal percentages were achieved after the injection of 800 mg O3 for VO3-AT and 133.3 mg O3 for VO3-AL (Table 3a,b). With respect to VO3-01, however, a removal of 50% of COD was reached after 60 min of contact with the O3 probably because the water sample presented the lowest initial COD concentration and hence the treatment was more efficient (Table 3c). Due to the low COD initial values (10 mg/L) in the VO3-02 and VO3-03 samples, the effect of the treatment with O3 was unsusceptible (Table 3d,e). Despite the relatively low COD removal in these samples, the results are still promising since the wastewater treatment with O3 is not reported to be entirely suitable for COD removal as it is with SAC254 [10,53]. This is due to the fact that the direct reaction between O3 and organic compounds does not usually change the amount of OM present in the water but only modifies its composition (e.g., the cracking of aromatic compounds produces simple organic compounds). Moreover, Martínez et al. [19] have reported that during the O3 treatment, the COD might increase in the first few minutes of operation with a subsequent reduction. In the present work, however, an increase of the COD was not observed, due to the experimental configuration where the physicochemical parameters were measured 5 min after the operation had begun. In VO3-AL and VO3-AT water samples, a BOD5 removal of 49.5% and 55%, respectively, was achieved after the injection of 800 mg of O3 after 120 min of operation (Table 3a,b). Since these efficiency values were slightly greater than those of COD, it can be assumed that in addition to removing recalcitrant organic compounds, O3 treatment proved efficient in the removal of simple organic compounds (biodegradable compounds). Although O3 is a selective oxidant that reacts mainly with electron donating compounds, its by-products (OH•) do not, which conveys them the ability to oxidize all types of compounds, hence, the reduction of both COD and BOD5 was observed. As to VO3-02 and VO3-03 water samples, the BOD5 initial values were not high enough to observe a significant decrease during the treatment (Table 3d,e).

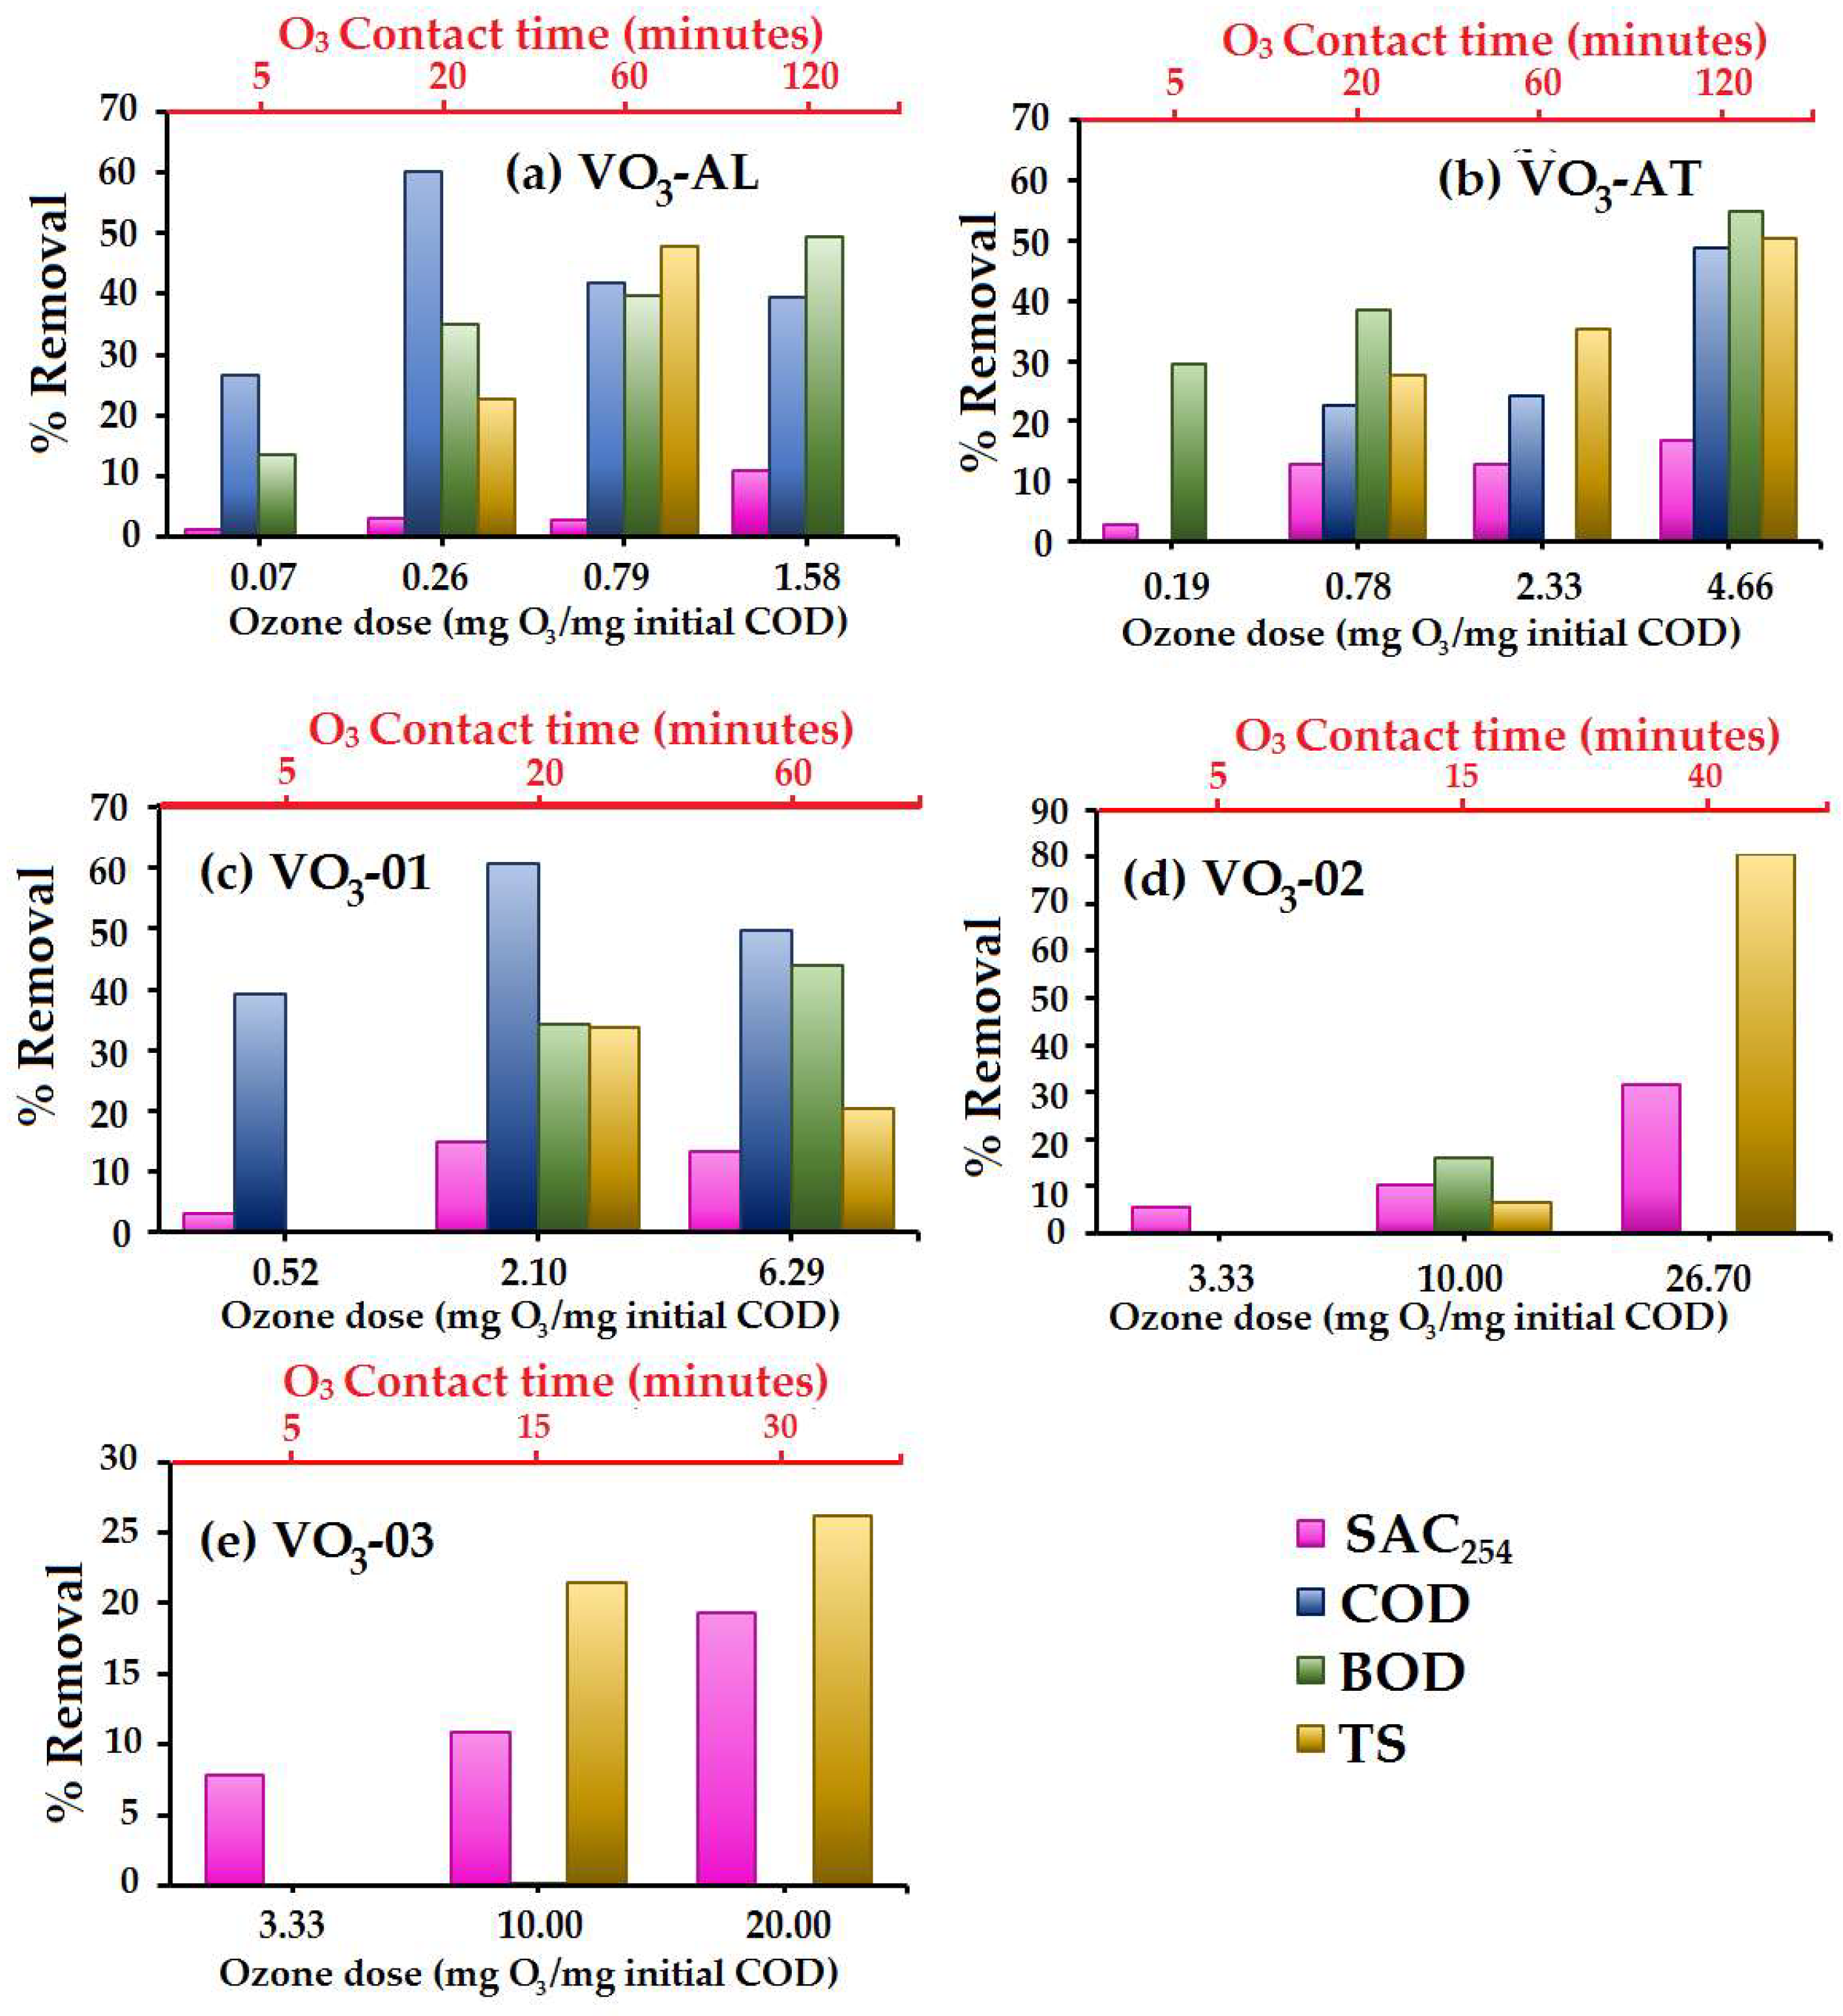
3.2.1. Organic Matter Removal (%) as Function of Different O3 Doses

Typically, the ozone dose applied in wastewater or drinking water is measured in terms of mg of O3 per the amount of dissolved organic carbon (i.e., mg O3/DOC) [10]. On the other hand, Wert et al. [54] measured the O3 dose in terms of mg O3 per the amount of total organic carbon (i.e., mg O3/TOC). In the present work, the O3 dose required to oxidize the OM was measured in terms of the initial COD (i.e., mg O3/COD), since COD encompasses more oxygen-depleting substances than DOC and TOC. In the VO3-AL water sample, the maximum removal of SAC254, COD, BOD5 and total solids (TS) was reached with the injection of 1.58, 0.26, 1.58 and 0.79 mg O3/COD, respectively (Figure 3a).
These results indicate that the O3 dose required for removing pollutants depends on the removal target since COD, BOD5 and SAC254 are the measurements of different kinds of OM. The maximum COD removal of VO3-AL was reached after 20 min of contact with O3 coinciding with the time at which its organic composition reaches its maximum biodegradable character with a BOD5/COD ratio of 0.60 (Figure 4a). Similar results to those registered for VO3-AL were also obtained for the water sample VO3-01 as its maximum COD removal was observed to be of 60.7% (Figure 3c) and its maximum biodegradability was 0.6 after 20 min of contact with O3 (Figure 4c). These results are in accordance with those obtained by Yavich et al. [15], who reported that the maximum biodegradability reached by means of ozonation of water from the Huron River in the United States of America (U.S.A), was obtained with a 0.5 mg O3/mg of carbon dose, within 15 min of ozone contact.
For VO3-AT water sample, the pattern was different as the maximum COD, BOD5 and SAC254 removal levels were reached until after 120 min of contact with O3 (i.e., 4.66 mg O3/COD) (Figure 3b). As shown in Figure 4b, however, it should be emphasized that the ozone treatment increased its biodegradability after 60 min of operation. The fact that this water sample reached its maximum biodegradability even before it reached the maximum OM removal, indicates that during ozonation process, the composition of OM, either recalcitrant or biodegradable, passes through many oxidative changes modifying its soluble character and hence its bioavailability.
Regarding VO3-02 and VO3-03 water samples, the initial concentration values of COD and BOD5 were less than the other samples and hence the removal percentage was not significant (Figure 3d,e). These results highlight the need to focus more on the BOD5/COD ratio than on the removal percentage if the main goal is to find the adequate O3 dose that enhances the biodegradability in order to improve the water quality in the HAS.
The results regarding the SAC254 removal are different to those of COD and BOD5 for all the water samples, as a constant increase of the SAC254 removal percentage was registered during ozonation. This indicates that unsaturated and aromatic compounds were still present even after the first minutes of contact with O3. The same pattern was also observed with respect to TS (with the exception of VO3-01), since its highest removal was registered up until the final stage of the treatment with O3.

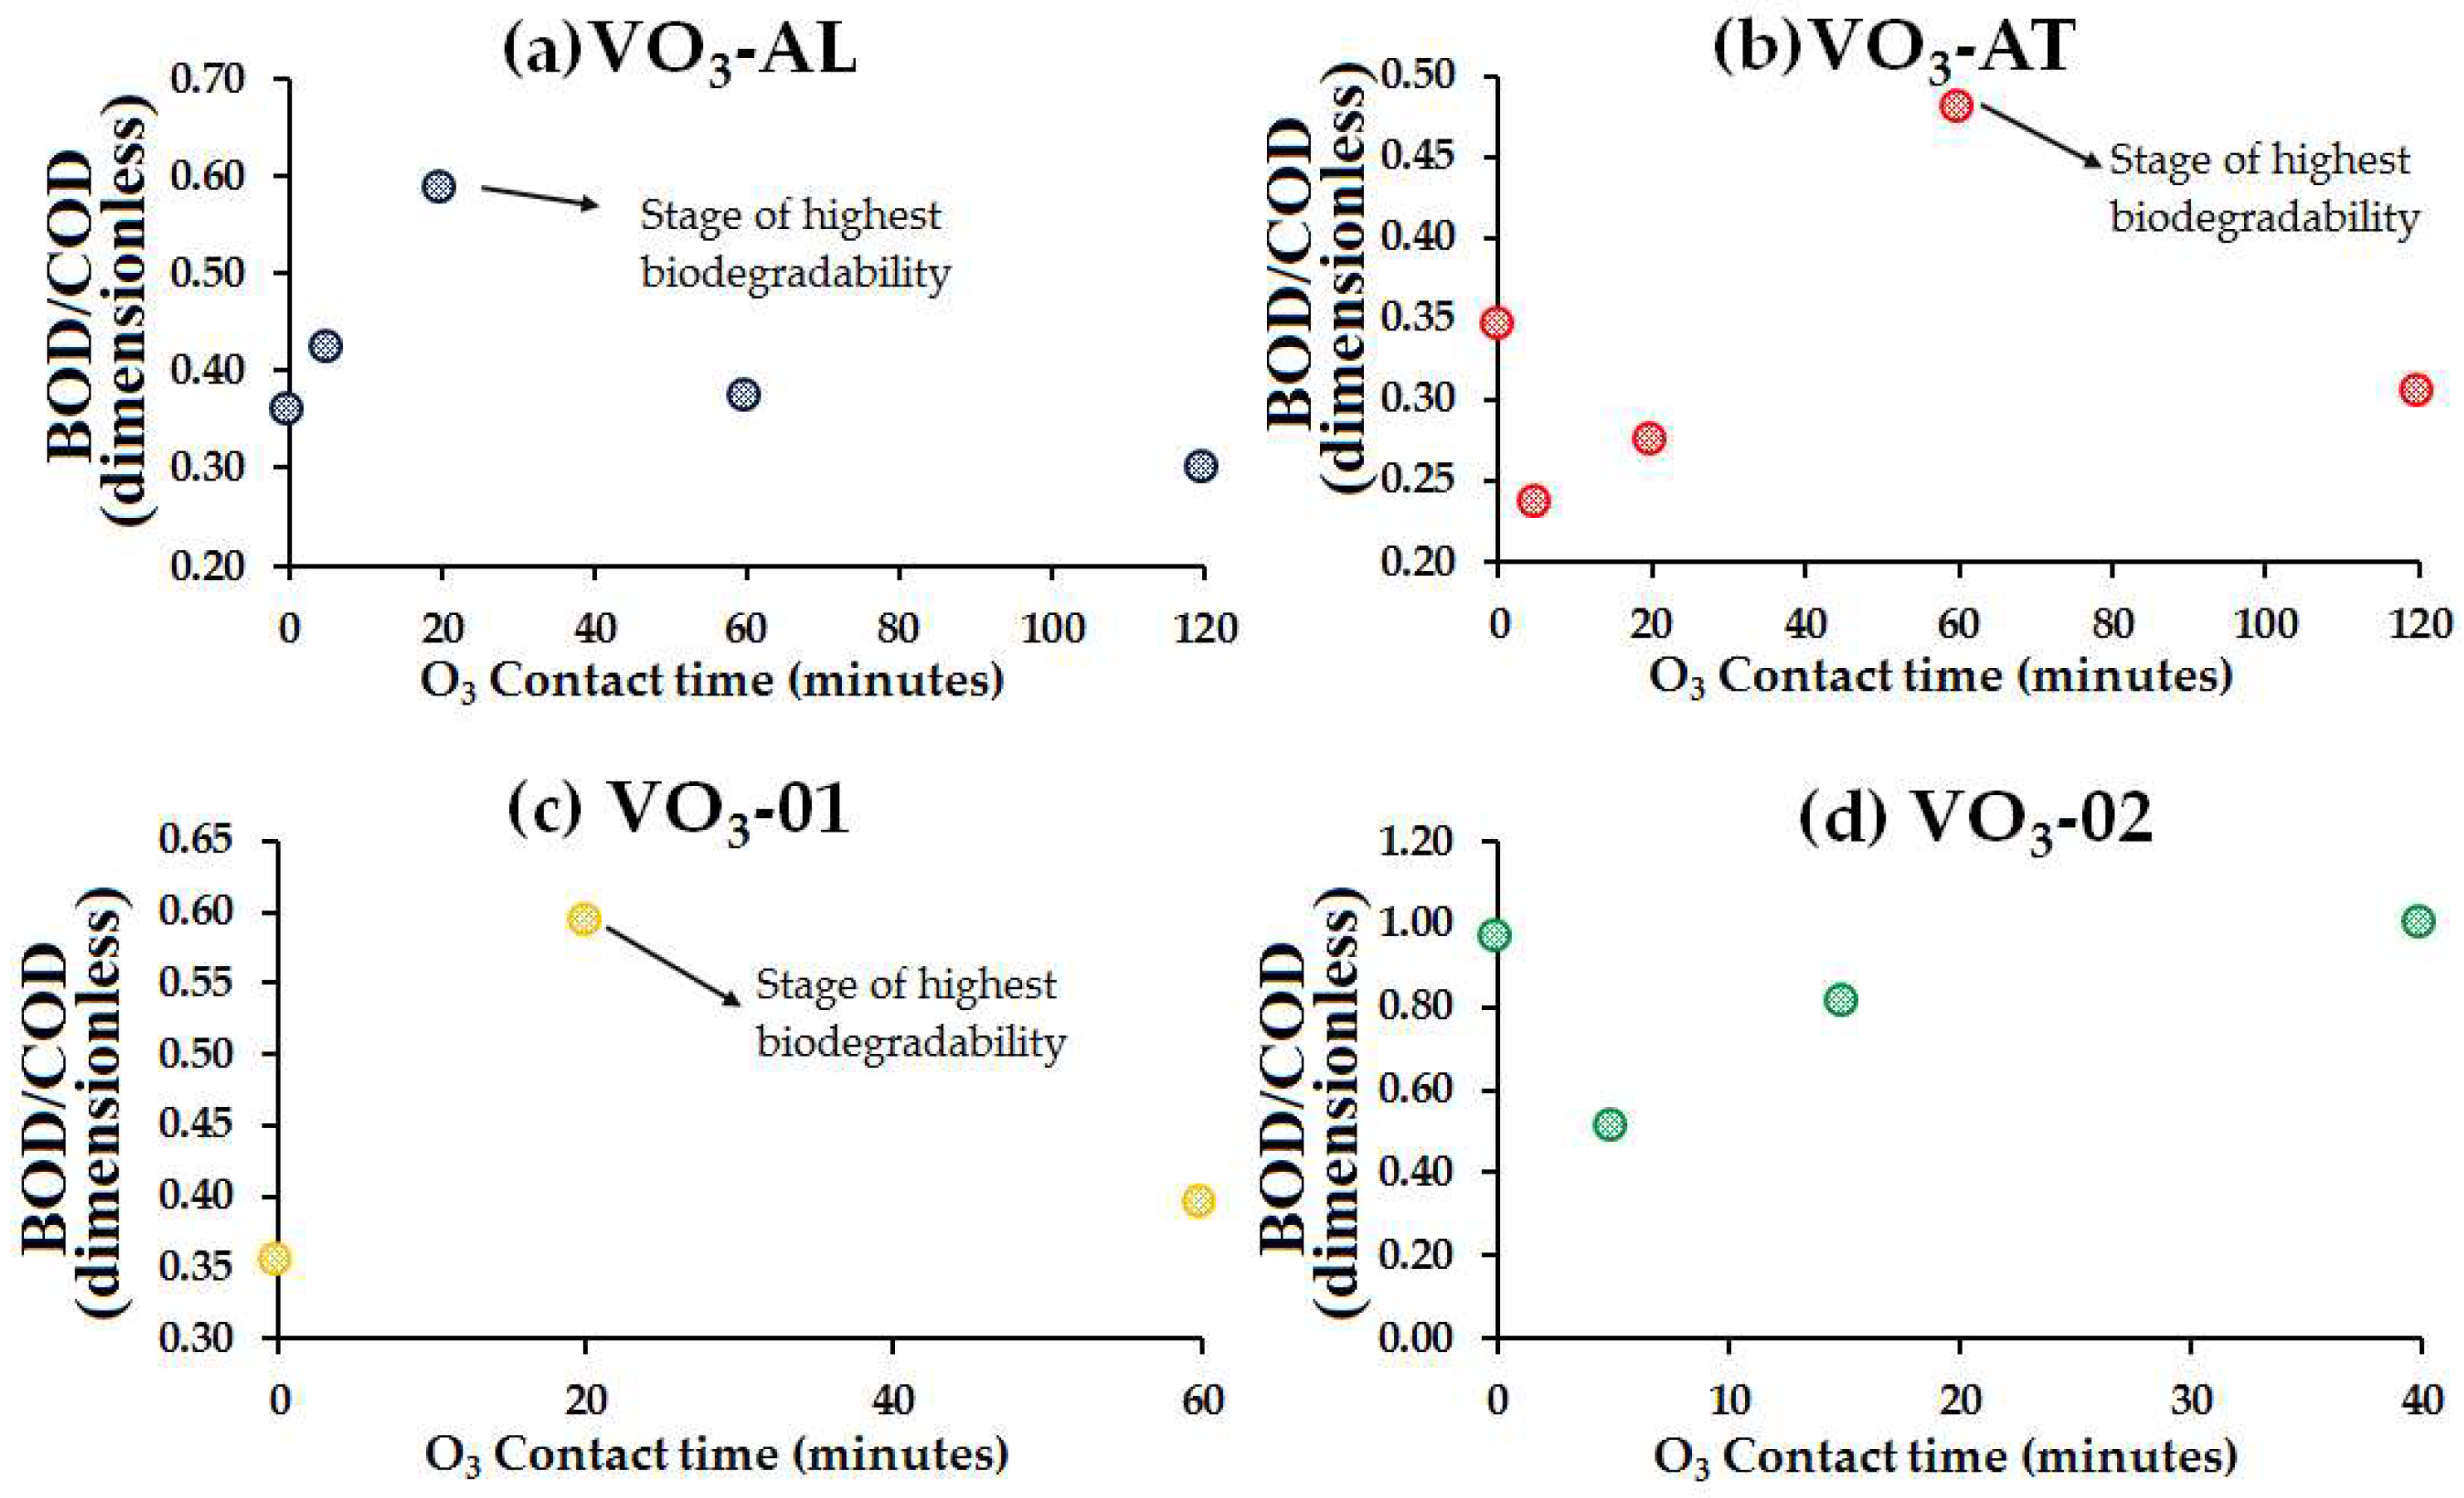
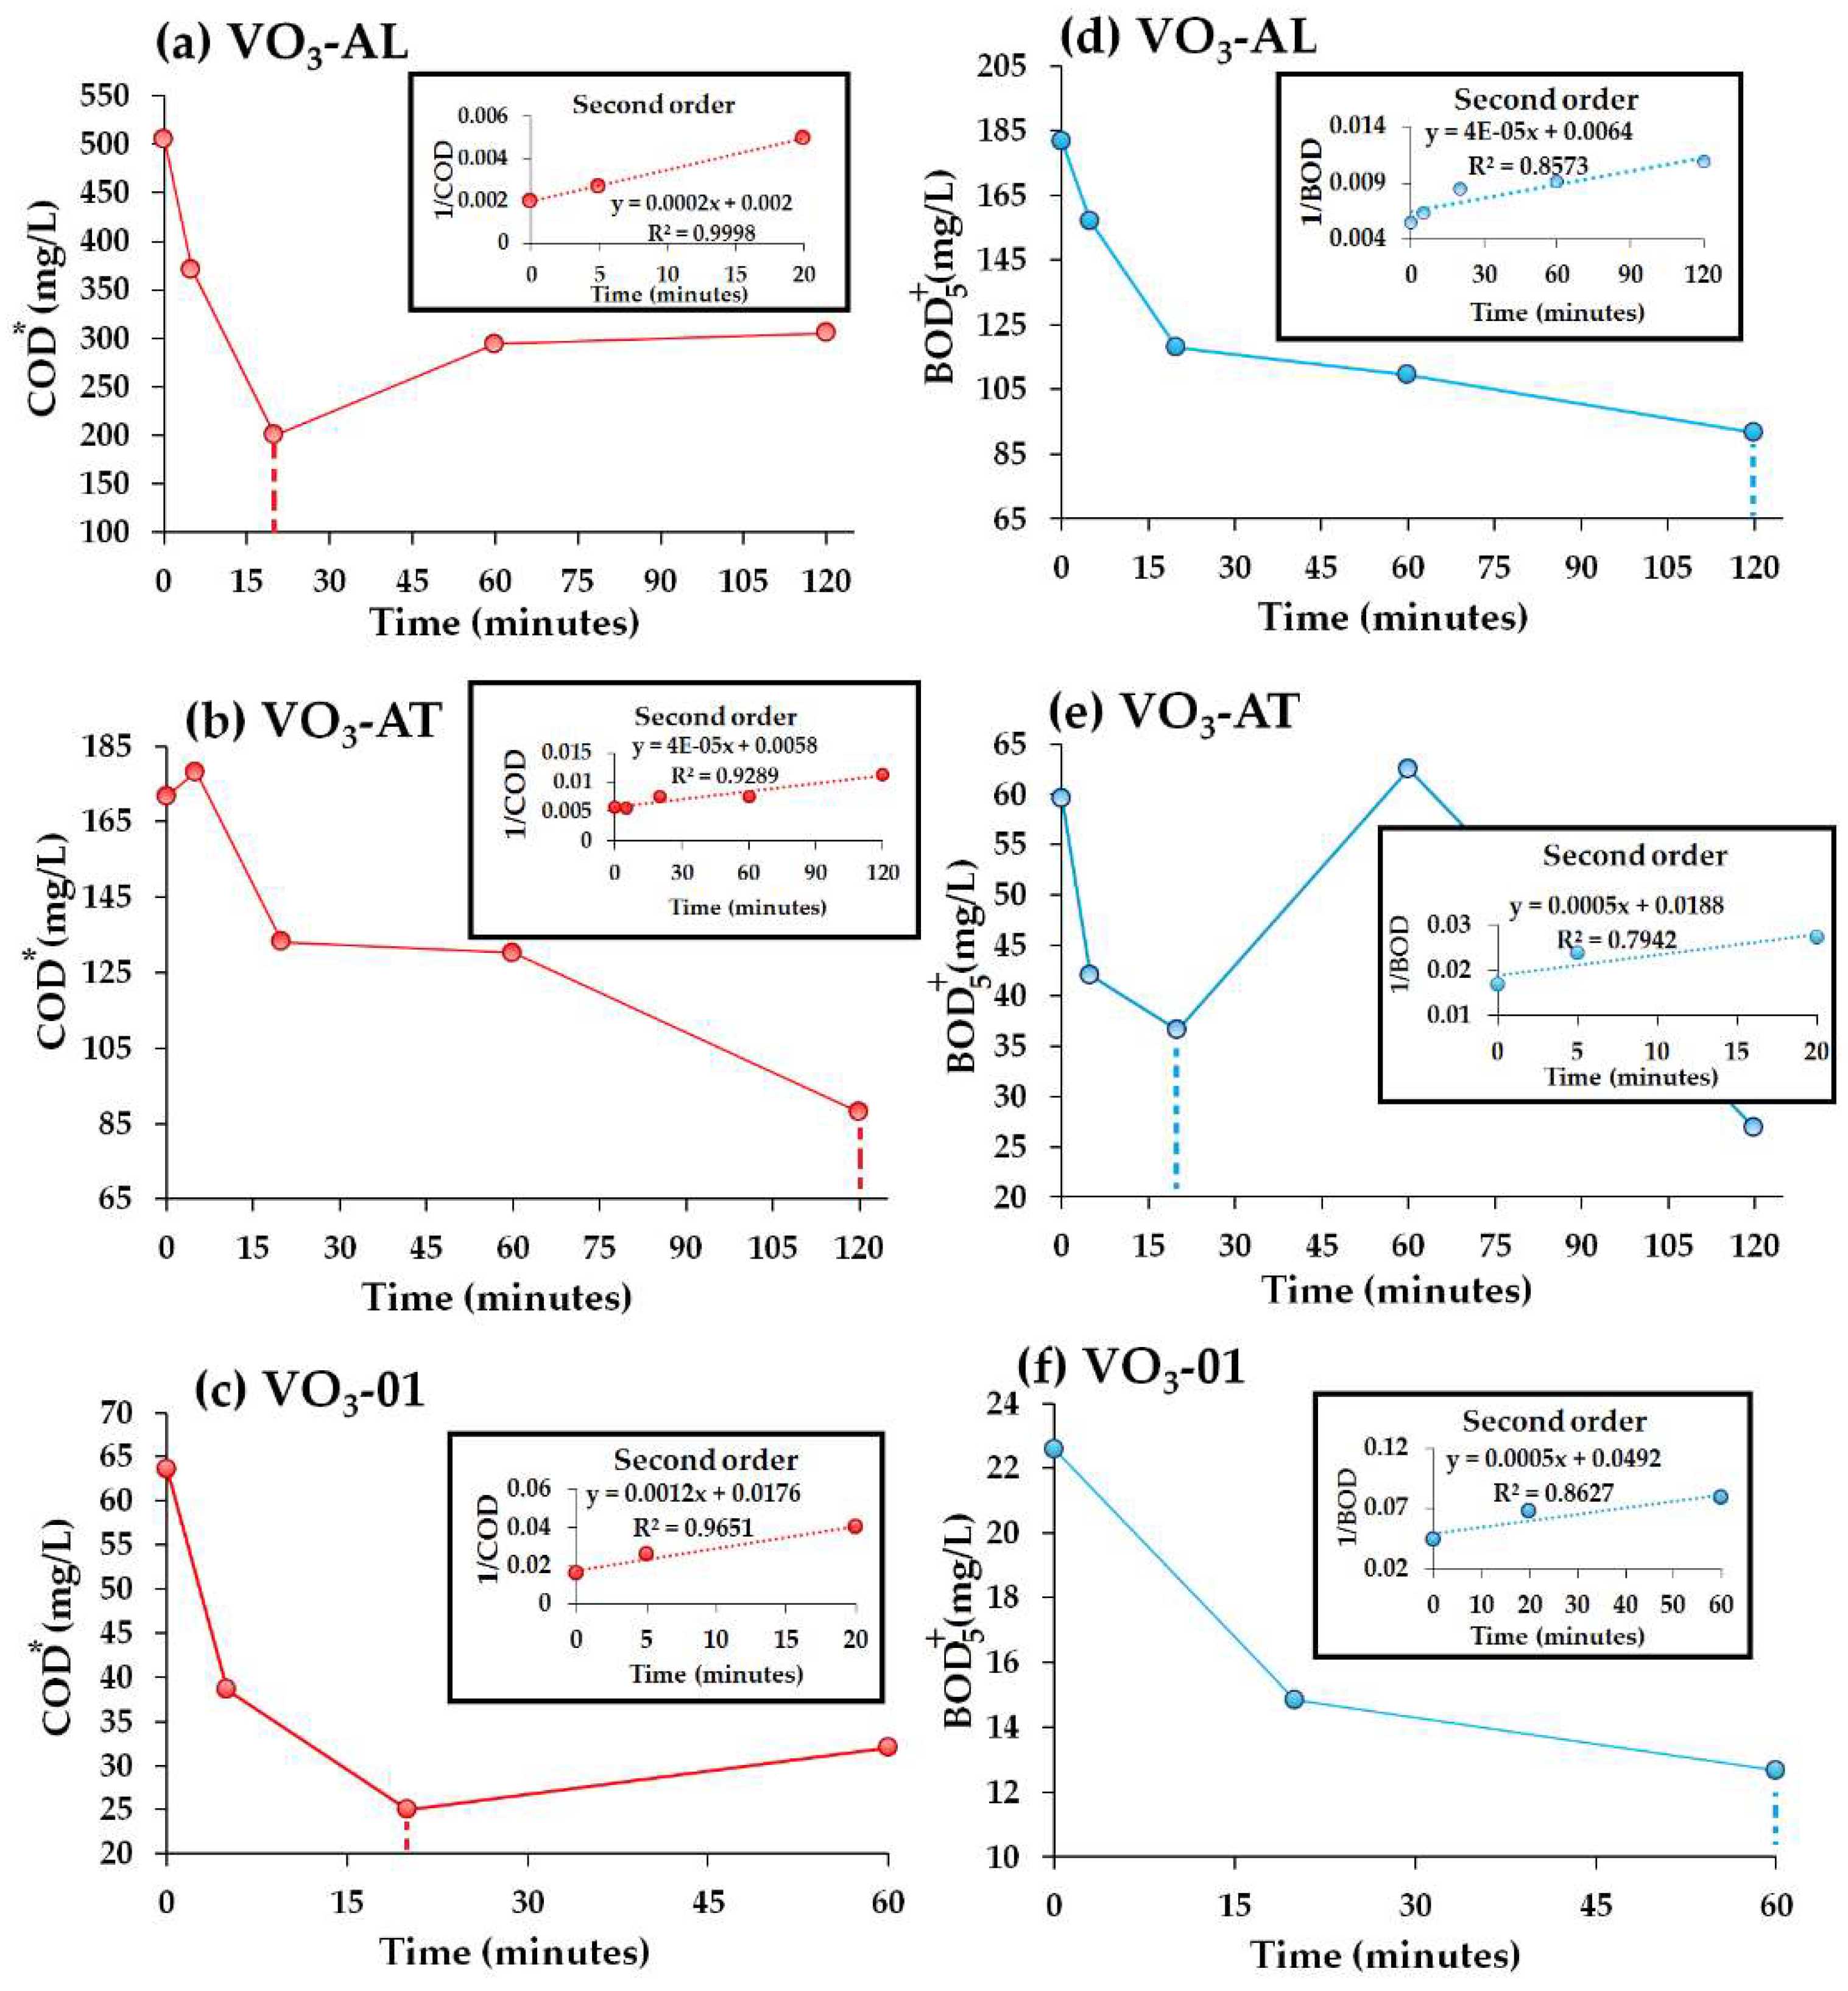
3.2.2. Degradation Kinetics of COD, BOD5 and SAC254

In order to obtain the degradation kinetics of COD, BOD5 and SAC254 upon the treatment with O3, the OM degradation tendency was limited to the time interval on which the maximum decrease in concentration was observed. This interval represents the highest OM decomposition and thus, it was used to calculate the kinetic constant for the rate of the OM removal. In Figure 5, the dotted lines represent the above-mentioned delimitation.
The determination coefficient of the experimental data and the kinetic constant was calculated. Regarding COD and BOD5, the reaction rate was adjusted to a second order kinetics in the VO3-AL, VO3-AT and VO3-01 water samples (Table 4a,b). Although OM degradation due to the O3 treatment is best described by first-order kinetics [5], the most appropriate order of reaction is that which fits best with the experimental results. Moreover, Crousier et al. [26] demonstrated that the removal of dissolved organic carbon by the catalytic ozonation follows a second order reaction rate. In the present work, the two reactants O3 and OM (i.e., COD, BOD5 or SAC254) resulted in the formation of biodegradable products (Equation (4)).
OM + O 3 Biodegradable   products
This type of reaction is a theoretical second order reaction; however, as described in the methodology section, the injection of O3 was constant during the operation time. Therefore, it can be assumed that the O3 concentration did not appreciably change over time; and scientific research has revealed that there is no reaction rate dependence with respect to the substance that is in excess (constant). As a result, instead of being a second order reaction, it should be called a pseudo-first order reaction [26,30,55]; this type of kinetics can be described as a logarithmic OM decrease.
Regarding SAC254, the VO3-02 water sample was adjusted to a zero-order reaction. This implies that for this water sample, degradation of aromatic and unsaturated compounds is proportional with respect to time and, in other words, the reaction is relatively slow. For VO3-AT and VO3-03 water samples, the reaction rate was adjusted to a pseudo-first order kinetic. Finally, the VO3-AL and VO3-01 water samples adjust better to a first order reaction since this type of kinetics describes a pronounced logarithmic degradation. For the previously mentioned samples, the rapid decrease of SAC254 showed that the oxidation of aromatic and unsaturated compounds by OH• was presented in both the first and the subsequent stages of the process, leading to the formation of simple organic compounds. These results indicate that water from the Northwest of the Valsequillo Reservoir requires a higher ozone dose than water from the Southeast if the aim is to improve the water’s quality. Moreover, when applying ozone to water from the Valsequillo Reservoir, the targeted pollutant, as well as the content of OM, should be considered in order to avoid an excessive ozone injection.

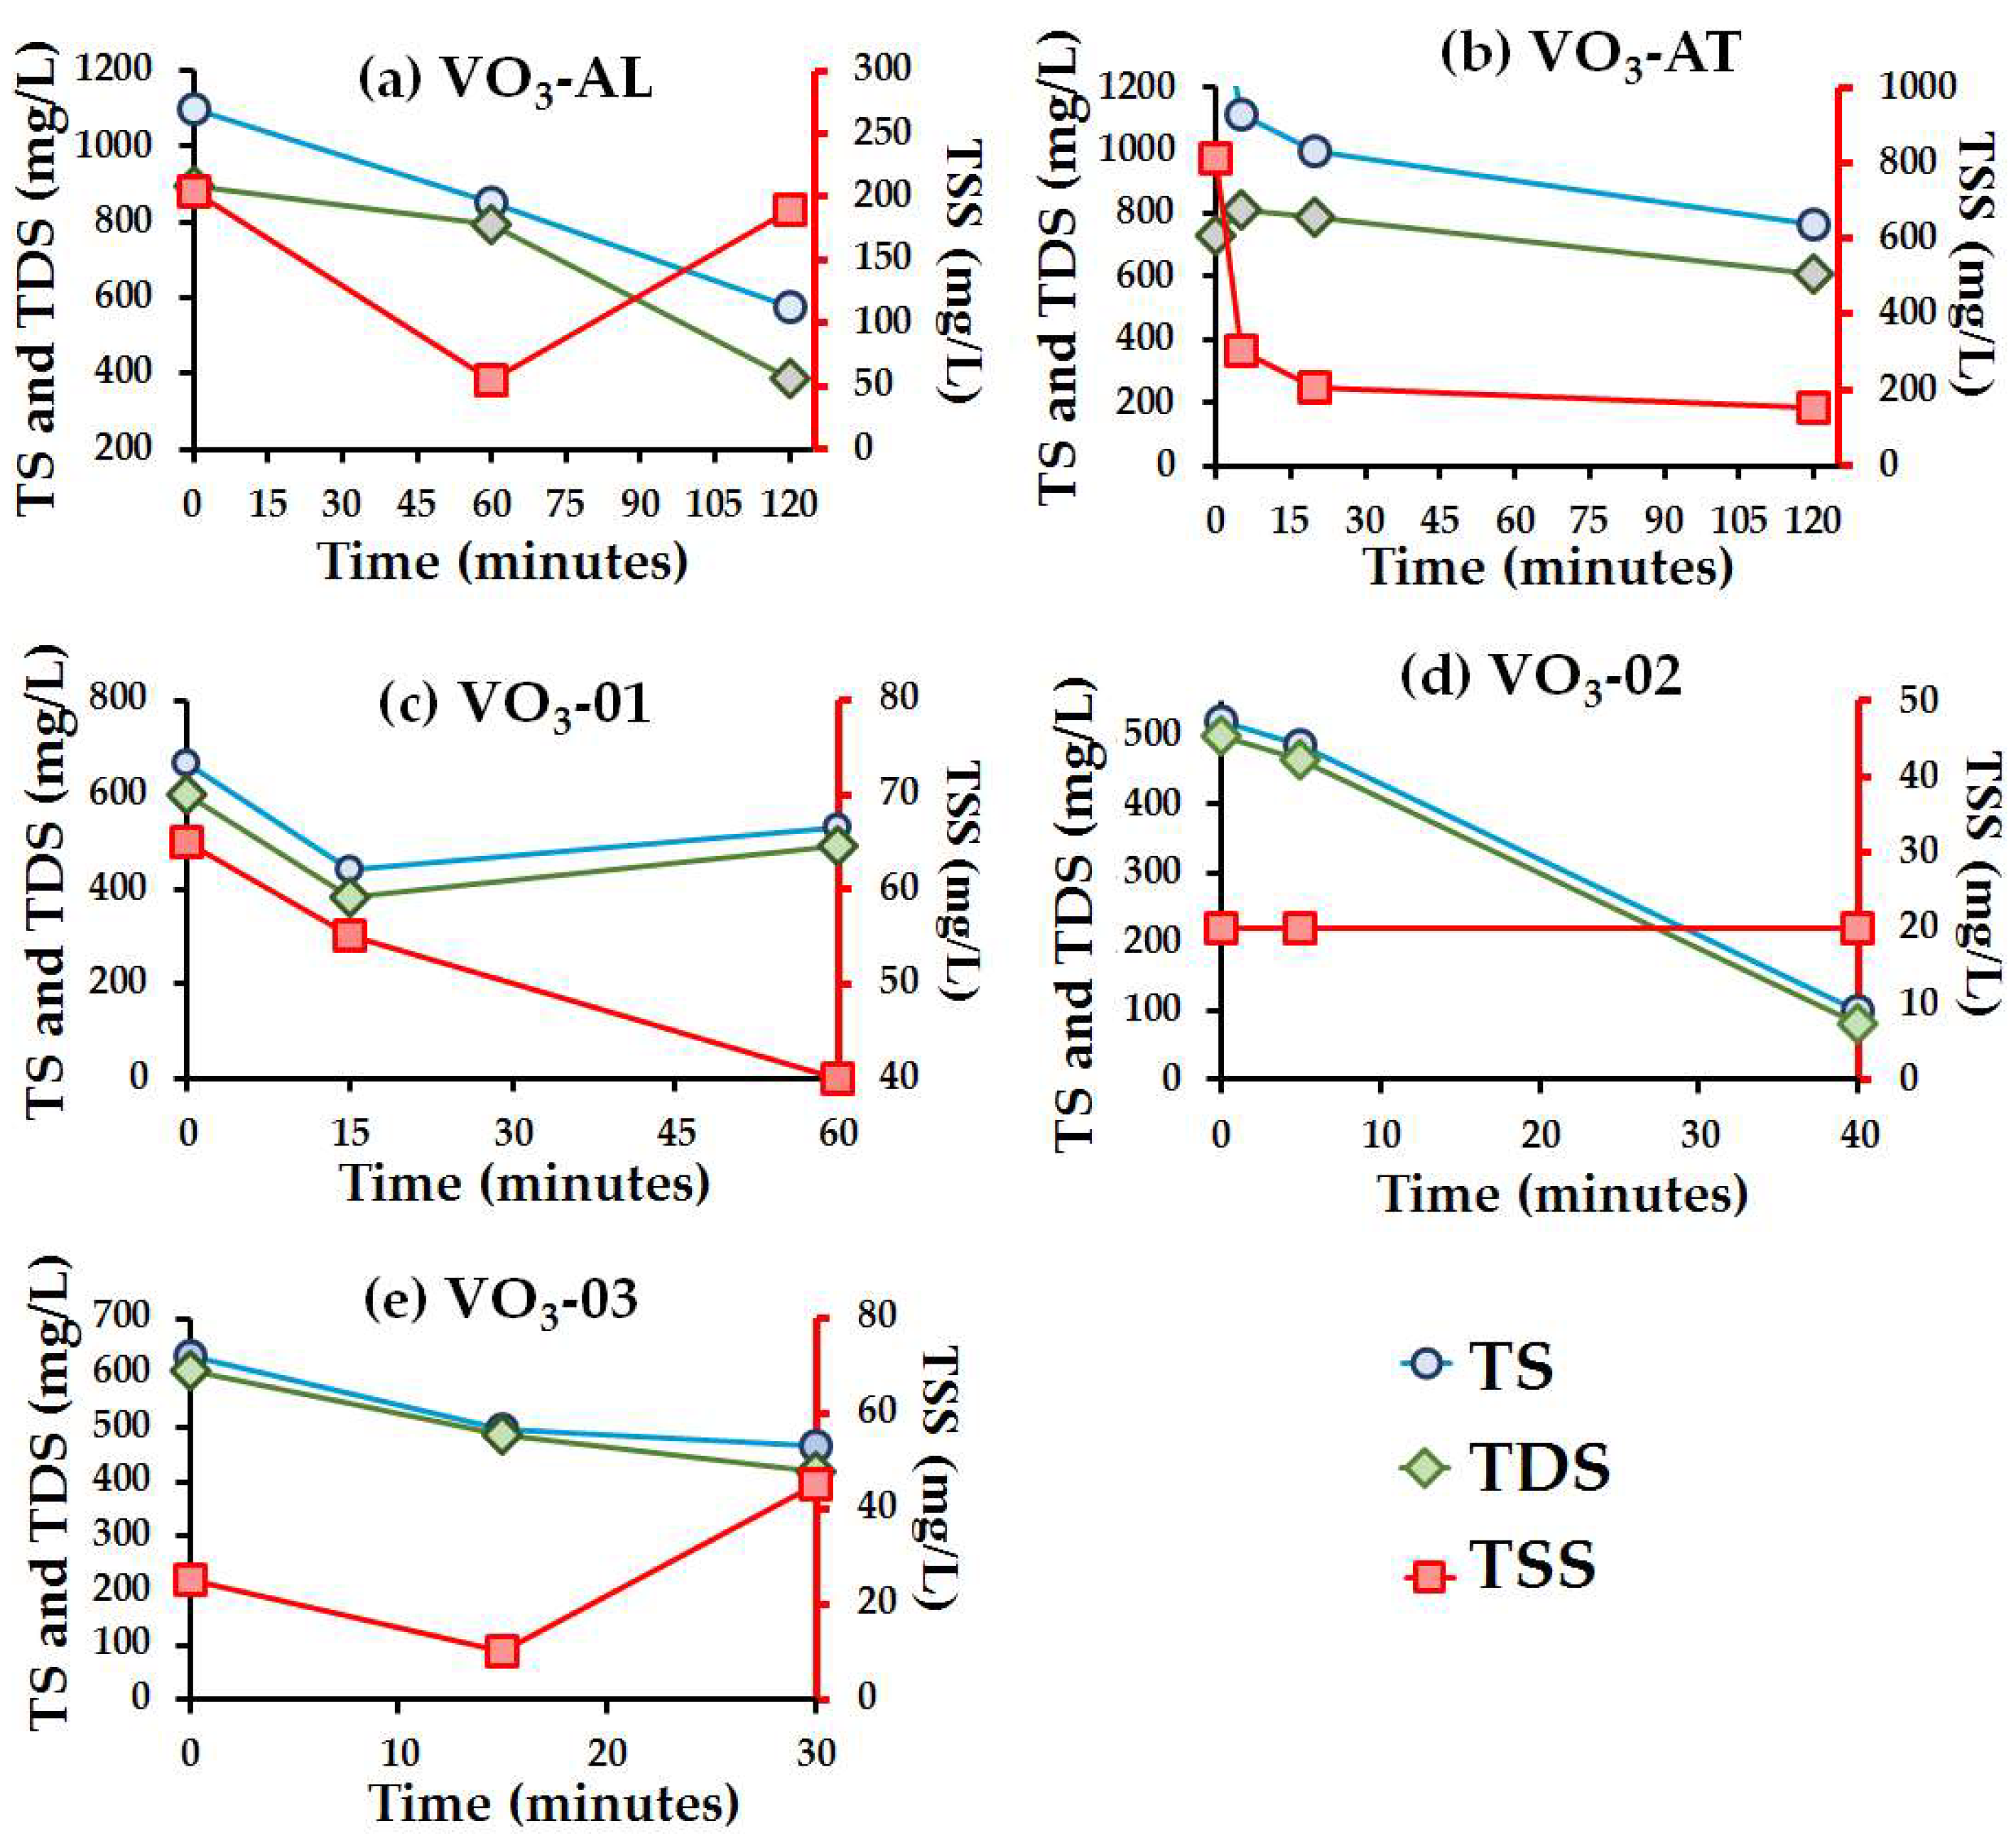
3.3. Ozone Effect over Physicochemical Parameters

3.3.1. Organoleptic Properties

After 120 min of O3 treatment, turbidity in VO3-AL and VO3-AT water samples ranged from 182–93 NTU and 182–114 NTU, respectively (Table 2a,b). The decrease in the turbidity values can be associated to ozone’s reactivity towards unsaturated and aromatic compounds which are in turn related to hydrophobic substances (particulate matter typically found in this type of surface water), mostly found in total suspended solids (TSS) [27]. The reaction between O3 and the hydrophobic substances present in wastewater results in the formation of hydrophilic substances and biodegradable by-products [6,56].
The decrease in turbidity can also be described by the “Ozone-induced particle destabilization” proposed by Grasso and Weber [8]. The ozone assists in the destabilization and aggregation of particles by several mechanisms that in turn depend on the characteristics of each type of water. Particularly, the VO3-AT and VO3-AL water samples showed high alkalinity values (Table 2a,b), probably due to the high content of calcium coming from the groundwater of the HAS whose bedrock is composed of limestone (rich in carbonates) [42]. Calcium is defined as a key factor in ozone-induced particle destabilization because ozone enhances spontaneous coagulation only when calcium hardness concentrations surpass 100 mg CaCO3/L in the wastewaters [10]. During ozonation, carboxylic acid content increases, which leads to better complexation of calcium with natural organic matter which in turn prompts the precipitation of these complexes [8,9,57].
The VO3-01 and VO3-03 water samples did not show significant changes in terms of turbidity (Table 2c–e). Furthermore, VO3-02 presented a slight increase in turbidity. As stated by Gutierrez-Lopez [58], the water at this point of the Valsequillo Reservoir is eutrophic and hosts high content of algae. Ozone may lyse algae and liberate biopolymers, which could then act as coagulating polymers [8]. In order to observe a change in turbidity, however, this process must be followed by flocculation (e.g., agitation or smooth mixing) otherwise, the algae cell becomes floatable leading to a brief turbidity increase. In addition, the slight turbidity increase at this point could be due to the formations of colloidal or suspended particles as a result of ozonation of dissolved material [57]. It has been reported that more than 3 mg O3/L results in a deterioration of water quality; beyond this value, particulate suspension could be restabilized [59].
Results regarding TS and TSS (Figure 6) were consistent with the turbidity results, as a decrease of TSS was observed, especially for VO3-AT and VO3-AL water samples. Therefore, the results showed that this type of process is more suitable in removing non-dissociated substances rather than dissociated, since TSS decreased over time due to the O3 treatment in a more evident way than total dissolved solids (TDS) did. These results are in accordance with Can and Gurol [60] who reported a poor dissolved OM oxidation during ozonation treatment of surface water in Southern California, U.S.A. Likewise, in the present study, VO3-AT and VO3-01 water samples presented a TDS removal efficiency of 16.4% and 18.3%, respectively (Figure 6b,c). The highest removal efficiency (80%) for TDS was observed in the VO3-02 sampling point (Figure 6d) probably because the TS is composed of 96.16% TDS and only 3.84% TSS. Therefore, it can be assumed that the treatment with O3, in the absence of TSS, produces oxidized substances that later precipitate resulting in the decrease of TDS.
Results concerning fats and oils were contrary to what was expected, as they showed a slight increase in VO3-AT and VO3-01 water samples with a 4.7 and 6.3 mg O3/mg COD dose, respectively. Although ozone has a great effect over unsaturated fatty acids (presented mainly as solid fats), it has poor or null effect over saturated fatty acids (presented mainly as oils). Therefore, the assumption that oils are in greater proportion than fats in VO3-AT and VO3-01 water samples is reasonable [61,62]. On the other hand, the ozonation of aromatic compounds leads to the occurrence of carboxylic acids which in presence of simple organic matter may form organic acids such as fatty acids [(particularly volatile fatty acids (VFA)], thus leading to an increase of this parameter [60,63].
With respect to the change in color levels, a 50% removal was registered in both VO3-AT and VO3-01 water samples (Table 2). The color of the Atoyac River is mainly due to the discharged dyes from textile industries (widely settled along the HAS) [38]. Ozone specifically attacks the conjugated chains that are made up from unsaturated molecules and aromatic ring structures (chromophores) that impart color to the dye molecules [64]. On the other hand, VO3-02 merely showed a 20% removal, because the nature of the color in the VO3-02 water sample is different to that of VO3-AT and VO3-01 due to the presence of the chlorophyll released by the algae in that zone of the Reservoir [58]. The ozone is also able to reduce the green coloration of eutrophic waters by simultaneously removing algae cell and enhancing chlorophyll’s degradation [65].

3.3.2. Total Phosphorous (TP)

In VO3-AT and VO3-01 water samples a removal of 55% and 35% of phosphorus, respectively, was registered (Table 2a,c). As indicated previously by Zhang et al. [66], the organic phosphorus present in water with high organic matter content is susceptible to be oxidized by ozone, which leads to the rupture of covalent bonds and, therefore, to the appearance of phosphate ions (PO43−)). These ions can precipitate by combining with calcium which is found in large proportions in the water from the HAS. This reaction gives place to the possible formation of apatite inorganic phosphorus such as hydroxylapatite (Ca10(PO4)6(OH)2 or fluoroapatite (Ca10(PO4)6(F)2. Nevertheless, due to the high content of chloride (Cl) in these water samples, the apatite formed could be chloroapatite (Ca10(PO4)6(Cl)2, frequently found is this type of waters [67]. On the other hand, in VO3-02 water sample a slight increase of TP was registered probably because this type of water (Eutrophic) contains a large quantity of algae whose cell walls and cell membranes are destroyed in presence of ozone contributing to the release of organic phosphorus [66].

3.3.3. Potential of Hydrogen (pH)

pH is a parameter that normally varies along the ozonation process; depending on the chemical composition of the water and the ozonation practice, ozonation can either increase or decrease pH [9,68]. More often, however, a pH decrease has been observed when ozone is injected to wastewater, due to the formation of organic acids as a result of oxidation of organic matter. In the present work, the treatment with ozone did not significantly modify the pH of the water samples, probably due to the buffer effect related to the high alkalinity of the water studied (Table 2). The slight increase in pH could have also been due to off-gasing of CO2 in the water at the moment of ozone injection (aeration) followed by supersaturation and precipitation of calcium carbonate which in turn induces particle aggregation [9]. This path could also explain the turbidity decrease in VO3-AT and VO3-AL water samples, previously discussed. These results are in agreement with the ones formerly reported by Kishimoto et al. [41] who observed that during the O3 treatment of municipal wastewater from Shiga, Japan, pH remained almost constant. Moreover, Martínez et al. [19] registered a slight pH increase in municipal wastewater during the O3 treatment, similar to the results obtained in this study. Edwards and Benjamin [9] also observed a slight pH increase (8.13–8.65) during ozonation of a solution containing bicarbonate and no-natural organic matter. According to this author, carbon dioxide (CO2) was stripped from the water by the oxygen carrier gas.
pH results also help to elucidate the type of mechanisms involving ozone and wastewater. Under acidic conditions, the oxidation mechanism moves toward direct oxidation between O3 and chemical compounds, whereas indirect oxidation involves the formation of hydroxyl radicals OH•, under neutral or alkaline condition [69]. In spite of the slight pH increase registered in all processes, in the present work, neutral conditions were predominant. Therefore, the presence of both reaction mechanisms (direct and indirect) can be reasonably assumed.

3.3.4. Conductivity

Conductivity was found to be almost constant along the entire treatment with O3 in all the water samples (Table 2). Degradation of recalcitrant organic compounds gives rise to the formation of less complex compounds since ozonation might induce substrate mineralization by breaking covalent bonds and leading to the formation of heterogeneous oxidized forms [26]. Notwithstanding the foregoing, the complete mineralization of organic matter strongly depends on the production of hydroxyl (OH•) during ozonation. At a higher pH, however, carbonate concentration increases and can act as an OH• scavenger, resulting in a reduced availability of hydroxyl radicals for reaction with organic matter [6]. Since the conductivity (σ) increase was barely perceptible, it can be assumed that the mineralization process was not completely achieved. Thus, direct ozonation is not the proper process to treat water from the HAS if the main goal is to mineralize chemical compounds [70]. Regardless of the aforementioned fact, the O3 treatment aids a latter mineralization through biological processes, as the decomposition of unsaturated and/or aromatic organic compounds contributes to the formation of biodegradable compounds [6,71].

3.3.5. Ammonia Nitrogen (NH3-N) and Nitrates (NO3)

A slight increase in NO3 content was registered in VO3-AT, VO3-01 and VO3-02 water samples (Table 2). In spite of the fact that the oxidation of ammonia with ozone is a slow process [72] it is known that ozone induces the process of nitrification in wastewaters [41,73,74]. In the present work, although the NO3 concentrations slightly increased during ozonation, the nitrification process was not completely achieved since the ammonia nitrogen did not considerably decrease. According to Yuan et al. [75], air-based ozone generators generally produce NOx from gaseous nitrogen (N2), especially nitrogen monoxide (NO) which in the presence of more ozone can be converted into NO3. In addition, in the Valsequillo Reservoir—notably in the Southeast area—the presence of algae is constant [58]. Furthermore, ozone promotes the destruction of algae cells and nitrogen-containing organic matter, leading to the production of NH3-N [65], which in turn results in an apparent poor reduction of this compound’s concentration throughout the whole process.

3.3.6. Dissolved Oxygen (DO) and Redox-Potential (ORP)

DO showed a similar pattern in all water samples during the O3 treatment. Within the first 5 min of operation, the highest value of DO was observed. This is probably driven by the rapid reaction between O3 and OH (Equation (5)). The rise in concentration of DO is said to be an indicator of the occurrence of indirect oxidation mechanisms on which oxygen is generated [1,51,69]. In addition, the increase of DO may be related to the injection of oxygen-laden gas during ozonation, since, when ozone is generated from dry air, almost 20% of the total gas corresponds to oxygen [75].
3 O 3 + OH + H + 2 OH +   4 O 2
After the rapid increase, DO remains constant at an average value of (all values in mg/L) 7.0 ± 0.38, 6.85 ± 0.32, 7.32 ± 0.16, 7.14 ± 0.52 and 6.87 ± 0.04 for VO3-AT, VO3-AL, VO3-01, VO3-02 and VO3-03, respectively. The fact that the oxygen concentrations did not increase above 8.0 mg/L is due to two factors: (1) the saturation percentage that corresponds to the barometric pressure in Mexico and (2) the stable solubility owing to a constant temperature. Although a slight pH increase was registered in all samples during the treatment, this was not enough to affect Henry’s law solubility constant (H), which is why the DO concentration was nearly constant after five minutes of operation, notwithstanding the continuous ozonation.
ORP is one of the main control parameters of wastewater treatment processes [76]. Henceforth, by using ORP measurements, it is possible to identify the variations in the reductant or oxidant conditions during application of ozone or any other type of advanced oxidation process [77]. In the present work, all water samples, except VO3-01, registered an increase of ORP during the first 5 min, after this time, it remained nearly constant (Table 2). This pattern is similar to that of DO; the coincidence between these two parameters indicates that the presence of oxygen regulates the behavior of ORP. In addition, water samples presented oxidative characteristics since all ORP values were above 100 mV [78], even before the O3 treatment. The fact that the ORP did not increase abruptly, could also be due to the slight increase in pH, since the ORP tends to decrease at alkaline conditions [79].

3.4. Ozone Effect over Major and Trace Metals

After injecting 4.7 mg O3/mg COD in VO3-AT water sample, a 90% removal of Iron (Fe) and Aluminum (Al) was registered; while Manganese (Mn), Nickel (Ni), Zinc (Zn) and Cooper (Cu) showed a 73%, 67%, 81% and 80% removal, respectively; Among all metals measured, chromium (Cr) registered the highest removal [from 13.4 µg/L to non-detectable (ND)]. The same tendency was observed for VO3-01 water sample where an 80%, near 100%, 70% and 37% removal was registered for Al, Cr, Fe and Mn, respectively (Table 5). The mechanism involved in the removal of these metals is the precipitation of oxides and/or hydroxides (e.g., MnO2, ferric hydroxy complexes, Al(OH)3) [56,80,81].
Concerning VO3-02 water sample, an increase in concentration was observed for Al, Fe, Mn and Ni. The same pattern was observed for Zn in VO3-01 water sample where a 120% increase was registered with the injection of 6.3 mg O3/mg COD. The most striking result, however, was the one corresponding to Ni in VO3-01 water sample, as total content changed from 11.3 to 181 µg/L. According to Edwards and Benjamin [82], the ozonation of natural organic matter (NOM) produces organic acids (OA) such as oxalic acid, acetic acid, citric acid, etc., which, in presence of metal salts, may lead to the occurrence of mechanisms that produce the solubilization of metals. For example, OA form soluble complexes with the metal ions as the hydrogen acid is exchanged with a cation making the new coordination complex more soluble. This mechanism could have occurred in both water samples during ozonation resulting in a slight increase in the concentration of the dissolved metals.
On the other hand, water from HAS hosts a high sulfur content [83] which, in presence of chalcophile metals (e.g., Cu, Zn and Cd), can form sulfide metals that predominate as particulate material [84]. Ozone reacts with metal (II) sulfides by oxidizing the sulfide (-II) to sulfate (SO42−, +VI). So, for each sulfate produced, one metal cation is released due to the higher solubility of the metal sulfates [7], resulting in an increase of the metal content as well as sulfate content in the VO3-01 water sample (Table 2). As to mercury (Hg), most of the values were found to be below the detection limit. A slight increase in the VO3-02 water sample, however, was registered (i.e., from non-detectable to 0.1 µ/L), presumably because Hg is a chalcophile metal (affinity to sulfur) that becomes an ion when oxidized by ozonation.
Another mechanism involved in the increase of dissolved metals could take place when metals form complexes with organic matter like humic substances, phenolic and carboxyl groups since they act as natural chelating ligands [85]. As demonstrated by Thalmann et al. [7], up to 40% of substances such as metal-ethylenediaminetetraacetate (EDTA) or nitriloriacetic acid (NTA) are oxidized with a dose ranging from 0.5–0.7 mg O3/mg DOC, releasing free metal ions into the aqueous phase. The slight conductivity increase reported in all water samples during ozonation could be an indicator of these type of reactions, since, when the number of ions increases, so does the conductivity (Table 2).

3.5. Ozone Effect over Organic Compounds

Ozone impacted the organic compounds in different ways depending on the type of water that was studied. In the VO3-AT water sample, a 19%, 17% and 20% decrease was observed for DEHP, total phenols (TPh) and isophorone, respectively (Table 5). Among all the phthalates studied in the present work, DEHP showed the highest concentration (5.8 μg/L in the VO3-AT water sample). This result is reasonable since DEHP is one of the most used in the industrial production of plastics [33]. These results are in agreement with other studies that have established that the total content of phthalates in surface water is generally less than 10 μg/L [33,86]. Given that ozone reacts directly with aromatic compounds, a decrease in DEHP and TPh was expected. With respect to isophorone, its unsaturated nature (α,β-unsaturated cyclic ketone) also makes it susceptible to be degradated by direct reaction with ozone. The degradation of phthalates has been studied by Jabesa and Ghosh [2], who found that both direct oxidation (i.e., electrophilic attack of O3) and indirect oxidation (i.e., the attack of OH•) were simultaneously observed in the degradation of DMP by means of ozonation; preferentially under neutral or alkaline conditions. A fall in the pH values was expected based on the fact that organic acids are likely to be formed during ozonation of the phthalates. As indicated above, however, the high alkalinity of HAS’s water—as a result of the presence of carbonates—acts as a buffer solution that prevents the pH from lowering.
Interestingly, not all phthalates showed a decreasing tendency during ozonation, since both DBP and Di(n-octyl) phthalate (DINP) were not present in the raw water (prior to ozonation) and, after the injection of 800 mg O3/L, the production of 2.9 µg/L of DBP and 0.9 µg/L of DINP was observed. The oxidation of complex aromatic compounds leads to the appearance of several carboxylic groups in the same oxidized molecule. These groups can appear at terminal carbons or at a one-bond distance from each other and subsequently go through an esterification reaction [70]. Another explanation for the appearance of phthalates, could be, that ozone reacted with humic and fulvic acids that were presumably contained in this type of water. According to Lawrence et al. [87], phthalates could either be trapped compounds that are released by the oxidation of the fulvic acid matrix or be oxidized products of fulvic acids.
In VO3-01 and VO3-02 water samples showed the same tendency, although much more pronounced, since the appearance of phthalates was observed to be 5.6, 6.9, 0.4 and 0.6 µg/L for DEHP, DBP, DEP and DME, respectively, with a 400 mg O3 dose. These water samples have the particularity of being influenced by the presence of large amounts of Water hyacinths. The chemical analysis of this plant has shown that it is made up of cellulose (20%), hemicellulose (48%) and lignin (3.5%) [88]. Delignification of cell walls via the ozonation is possible; ozone has been shown to attack and degrade the aromatic ring structure of lignin which in turn release the plant’s polysaccharides such as cellulose (efficiently degraded by ozone) and hemicellulose (poorly degraded by ozone) [89,90,91]. When lignin is degraded by the ozone, aromatic compounds containing carboxyl, such as phthalates, are formed. In addition, Water hyacinths also have an important content of humic acids (especially in the leaves) mainly made up of galactouronic acid, which is a major component of plant’s pectins. These humic acids can also be subjected to ozone action leading to the formation of phthalates as described above. However, as with the VO3-AT water sample, phthalate concentration levels are expected to decrease as a consequence of subsequent ozonation.

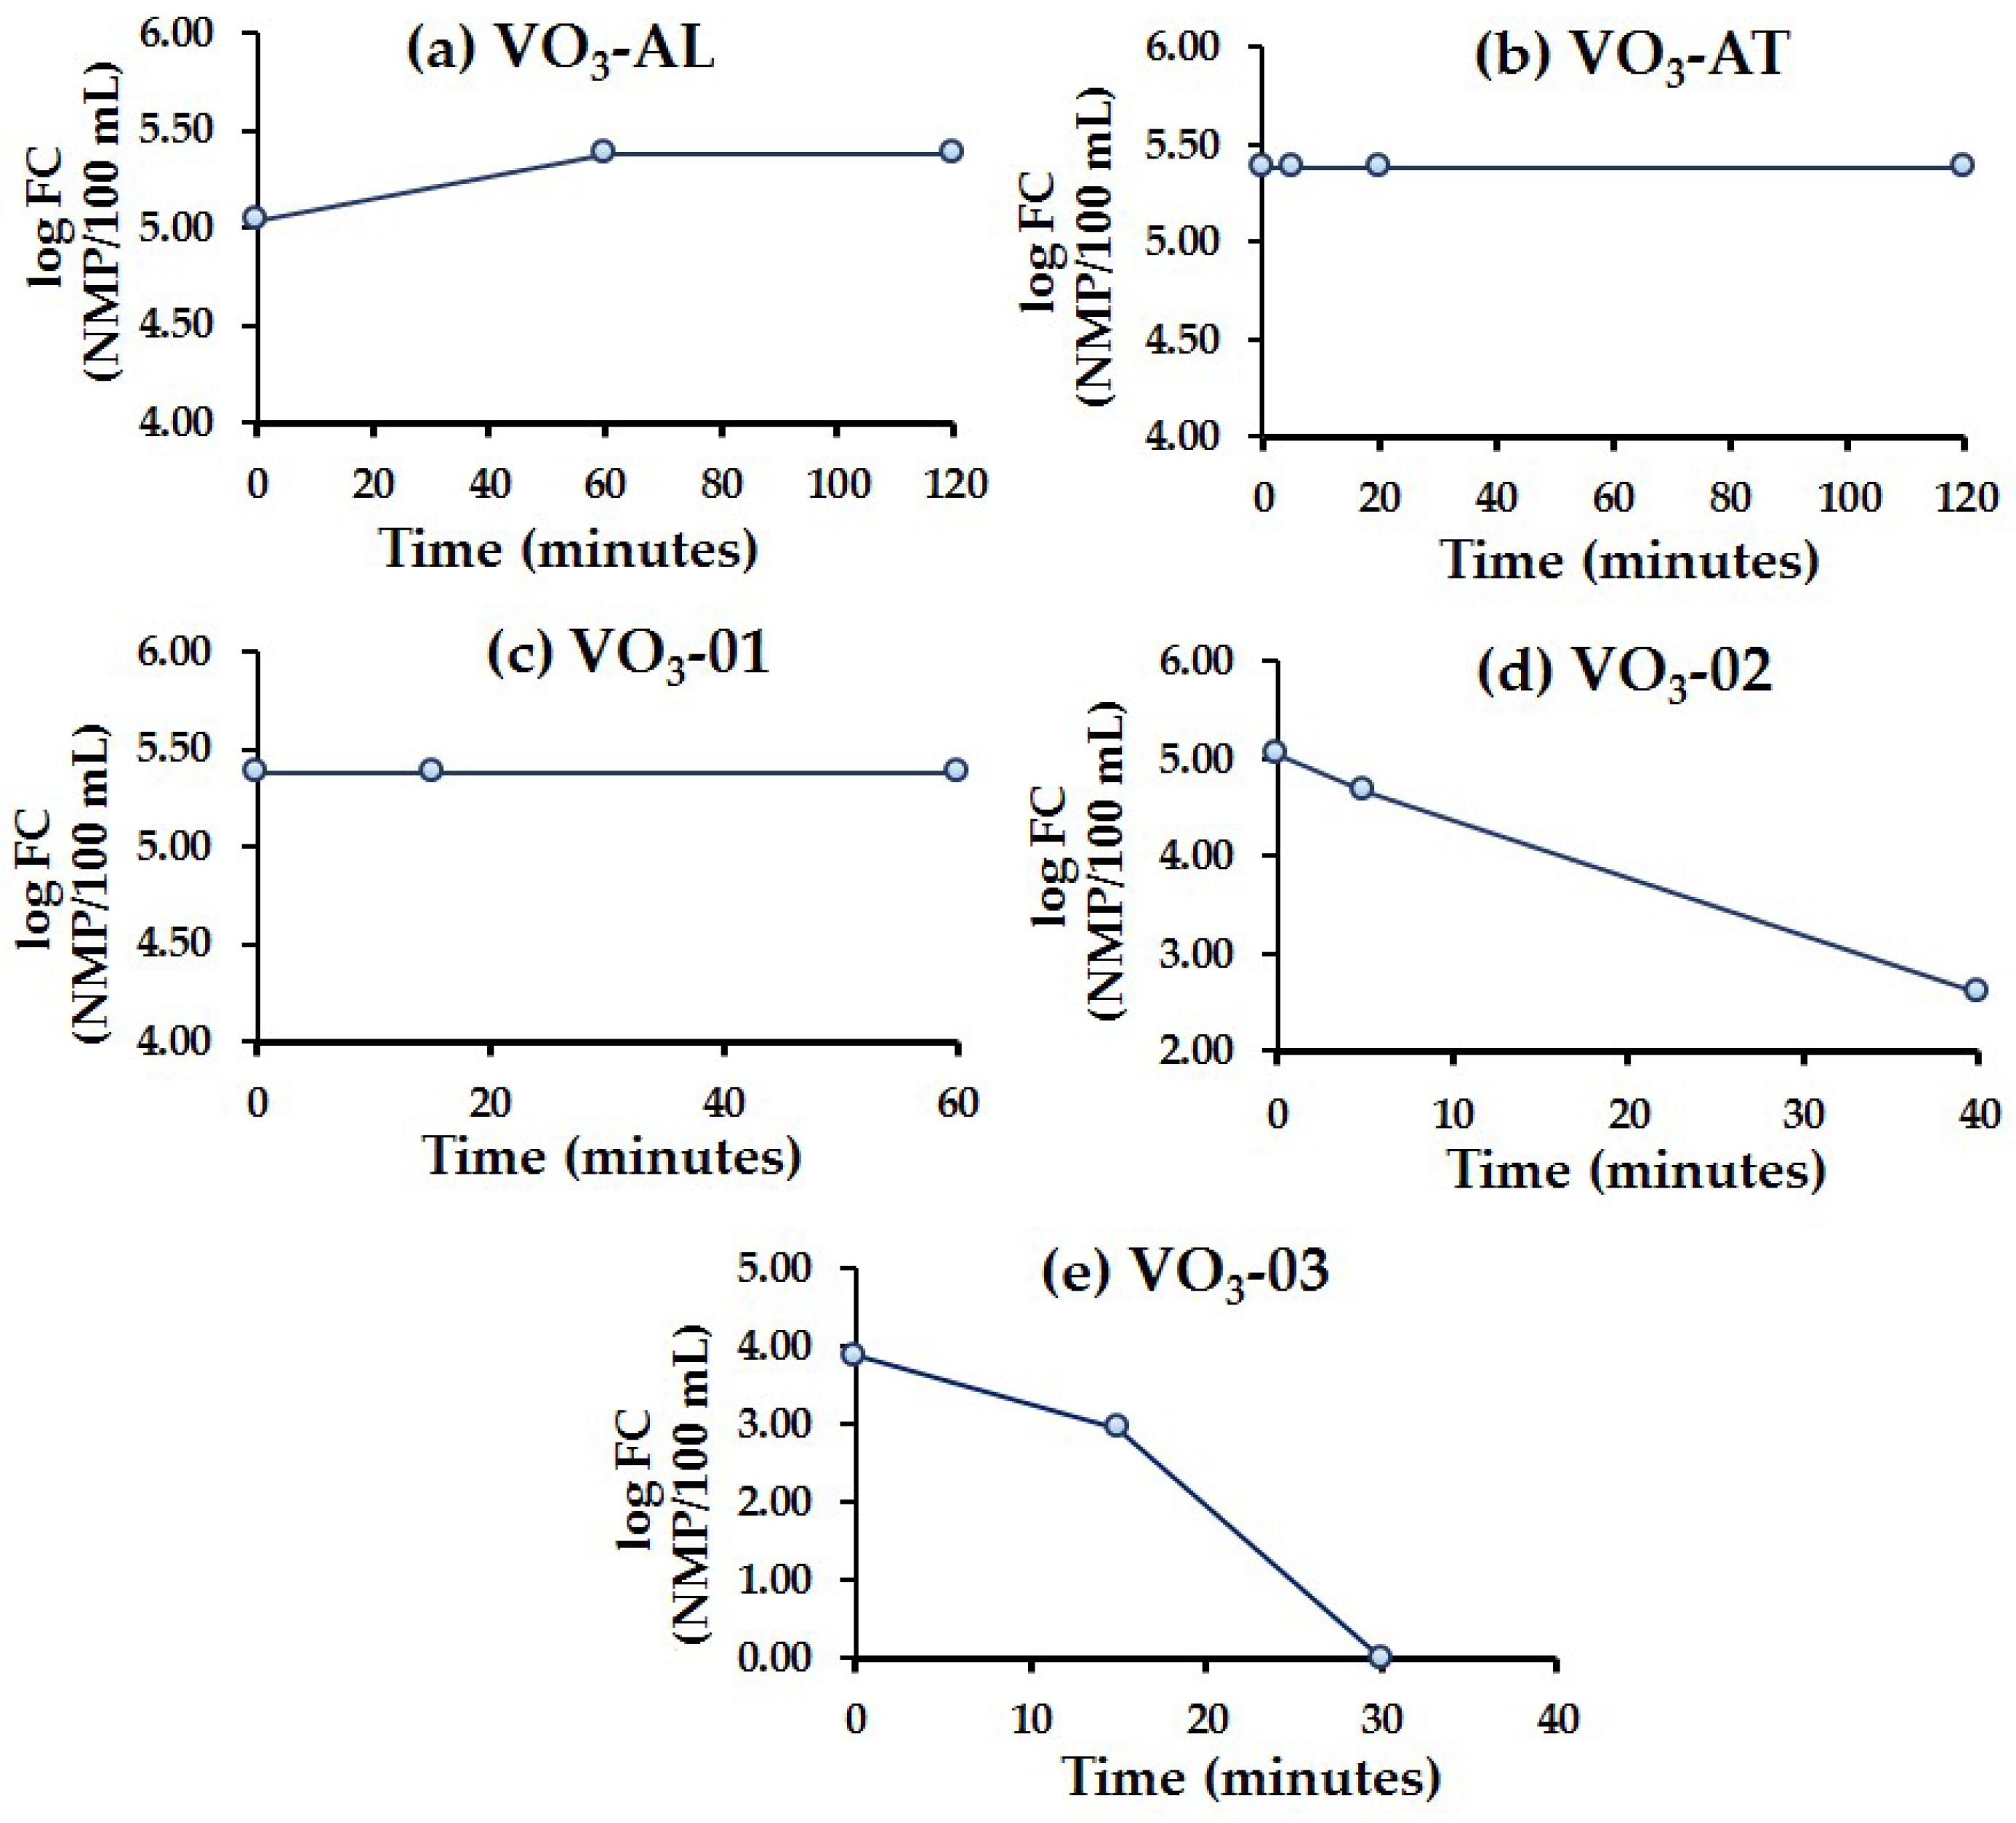
3.6. Ozone Effect over Disinfection (Fecal Coliforms Removal)

During the ozonation process of the waters of HAS, VO3-AL, VO3-AT and VO3-01 water samples, did not present any change in terms of FC removal (Figure 7a,b,e). According to Rodríguez et al. [92] the indirect ozone reaction via hydroxyl radicals (OH•) is not as efficient for disinfection as the direct reaction is. Therefore, it can be reasonably assumed that during ozonation of these particular water samples (VO3-AL, VO3-AT and VO3-01), the major oxidation mechanism was the production of OH•. This assumption can be validated by the poor SAC254 removal during ozonation. As stated before, however, OH• could be the main oxidation mechanism. Nevertheless, the high carbonate content can act as OH• scavenger, producing little effect on the aromatic compounds [6]. Another important aspect to consider is that the disinfection effectiveness largely depends on the reactions between ozone and dissolved organic matter, since the latter acts as an ozone scavenger, which leads to a lack of ozone to inactivate microorganisms. With reference to VO3-02 and VO3-03 water samples, an important FC decrease was registered, since, during ozonation, the local established limit (NOM-001-SEMARNAT-1996, Log FC = 3 NMP/100 mL) [93] was achieved after 40 and 15 min of ozonation, respectively (Figure 7d,e).
These results show that if the goal of ozonation is to disinfect water from the HAS, the effectiveness of the treatment depends on the site on which the water is collected from. In other words, water with high organic load (VO3-AL, VO3-AT and VO3-01) is not as eligible for ozone disinfection as water with low OM load (VO3-02 and VO3-03) is. The null FC removal from VO3-AL, VO3-AT and VO3-01 water samples could be associated with two processes: (1) OM acts as an ozone scavenger preventing contact between ozone and FC or (2) some inorganic matter species (such as carbonates) are chemically reduced in the presence of ozone, which in turn also contribute to the ozone scavenging. Finally, the suitable dose to achieve the local regulation limit in the VO3-02 and VO3-03 sampling points was 266 mg O3/L (40 min of contact time) and 100 mg O3 (15 min of contact time), respectively.

4. Conclusions

The present study provides information regarding the effect of treating wastewater with direct ozonation by measuring 36 physicochemical water quality parameters in water samples from different sites of the HAS.
  • Water from the Alseseca River and the Atoyac River present characteristics of raw urban wastewaters, while VO3-02 and VO3-03 water samples display characteristics of secondary effluents. On the other hand, VO3-01 showed features of both raw and secondary effluents.
  • Concerning the SAC254 levels, the results showed a decrease of the aromatic fraction in the organic molecules or unsaturated molecules through direct ozonation, as the SAC254 removal was found to be 31.7% in VO3-02 water sample. The maximum COD removal was 60.2% for VO3-AL water sample with a 0.26 mg O3/mg initial COD dose. Meanwhile, for BOD5, the maximum removal was observed to be 55% in VO3-AT water sample with a 4.6 mg O3/mg initial COD dose.
  • A higher content of organic compounds (particularly recalcitrant compounds) was detected in the area of the Valsequillo Reservoir that is covered with Water hyacinths. This is presumably due to aquatic plant’s decomposition process when they are in their senescence stage.
  • Results regarding the BOD5/COD ratio showed that the O3 treatment increased the biodegradability in the OM of all the water samples, improving the water quality and hence setting the conditions for the optimization of the natural attenuation process currently carried out in the Reservoir.
  • Ozonation of heavy metals revealed that the process highly depends on the water’s alkalinity, since the presence of calcium determines whether the metals precipitate or remain in their dissolved form
  • Among all the phthalates studied, DEHP showed the highest concentration levels (5.8 μg/L in the water sample VO3-AT). During ozonation of the VO3-01 water sample, an increase in the DEHP, DBP, DEP and DMP content was registered owing to the ozone reaction with recalcitrant organic compounds.
  • Results concerning FC showed that the O3 treatment is only suitable for water with low OM concentrations, since OM acts as an O3 scavenger leading to a scarce contact between FC and ozone.
The improvement of the water quality of the HAS is possible through the injection of ozone. The O3 dose, however, must be carefully regulated to avoid the solubilization of heavy metals from particulate material as well as the formation of new organic and potentially toxic compounds. Further investigation must focus on the applied and consumed ozone dose.

Supplementary Materials

Supplementary Materials are available online at https://www.mdpi.com/2073-4441/10/12/1790/s1.

Author Contributions

P.F.R.-E. conceived and directed the project; J.T.-H., A.G.H.-R. and E.R.C.-A. performed the experiments; J.T.-H. wrote the paper; J.A.M.-P. and E.M.-T. further improved the concept, structure, contents and writing of the manuscript and also contributed to the discussion.

Funding

This research received no external funding.

Acknowledgments

Authors acknowledge the support to “Grupo de Estudios GeoAmbientales y Calidad del Agua (GEAyCA)” [Group of Geoenvironmental Studies and Water Quality] of Departamento de Biociencias e Ingeniería (Biosciences and Enginnering Department)] del CIIEMAD-IPN, México. P.F. Rodriguez-Espinosa and E. Martinez-Tavera wish to express his thank to Sistema Nacional de Investigadores (SNI), CONACyT (Consejo Nacional de Ciencia y Tecnologia), EDI, COFAA (IPN). J. Tabla-Hernandez and A.G. Hernandez-Ramirez would like to thank CONACyT for providing a scholarship to conduct this study.

Conflicts of Interest

The authors declare no conflict of interest. The founding sponsors had no role in the design of the study; in the collection, analyses, or interpretation of data; in the writing of the manuscript, and in the decision to publish the results.

References

  1. Rice, R.G.; Netzer, A. Handbook of Ozone Technology and Applications; Ann Arbor Science: Ann Arbor, MI, USA, 1982. [Google Scholar]
  2. Jabesa, A.; Ghosh, P. Removal of dimethyl phthalate from water by ozone microbubbles. Environ. Technol. 2017, 38, 2093–2103. [Google Scholar] [CrossRef] [PubMed]
  3. Hoigne, J.; Bader, H. Ozonation of Water: Role of Hydroxyl Radicals as Oxidizing Intermediates. Science 1975, 190, 782–784. [Google Scholar] [CrossRef]
  4. Ribeiro, A.R.; Nunes, O.C.; Pereira, M.F.R.; Silva, A.M.T. An overview on the advanced oxidation processes applied for the treatment of water pollutants defined in the recently launched Directive 2013/39/EU. Environ. Int. 2015, 75, 33–51. [Google Scholar] [CrossRef] [PubMed] [Green Version]
  5. Marc-olivier, B.; Schumacher, J.; Sébastien, M.; Jekel, M.; Urs von, G. Ozonation and Advanced Oxidation of Wastewater: Effect of O3 Dose, pH, DOM and HO•-Scavengers on Ozone Decomposition and HO• Generation. Ozone Sci. Eng. 2006, 28, 247–259. [Google Scholar]
  6. Ratpukdi, T.; Siripattanakul, S.; Khan, E. Mineralization and biodegradability enhancement of natural organic matter by ozone-VUV in comparison with ozone, VUV, ozone-UV, and UV: Effects of pH and ozone dose. Water Res. 2010, 44, 3531–3543. [Google Scholar] [CrossRef] [PubMed]
  7. Thalmann, B.; von Gunten, U.; Kaegi, R. Ozonation of municipal wastewater effluent containing metal sulfides and metal complexes: Kinetics and mechanisms. Water Res. 2018, 134, 170–180. [Google Scholar] [CrossRef] [PubMed]
  8. Grasso, D.; Weber, W.J. Ozone-Induced Particle Destabilization. J. Am. Water Works Assoc. 1988, 80, 73–81. [Google Scholar] [CrossRef]
  9. Edwards, M.; Benjamin, M.M. A Mechanistic Study of Ozone-Induced Particle Destabilization. J. Am. Water Works Assoc. 1991, 83, 96–105. [Google Scholar] [CrossRef]
  10. Sadrnourmohamadi, M.; Gorczyca, B. Effects of ozone as a stand-alone and coagulation-aid treatment on the reduction of trihalomethanes precursors from high DOC and hardness water. Water Res. 2015, 73, 171–180. [Google Scholar] [CrossRef]
  11. Hoigné, J.; Bader, H. Rate constants of reactions of ozone with organic and inorganic compounds in water-I: non-dissociating organic compounds. Water Res. 1983, 17, 173–183. [Google Scholar] [CrossRef]
  12. Medeiros, D.R.; Pires, E.C.; Mohseni, M. Ozone oxidation of pulp and paper wastewater and its impact on molecular weight distribution of organic matter. Ozone Sci. Eng. 2008, 30, 105–110. [Google Scholar] [CrossRef]
  13. Ulucan-altuntas, K.; Ilhan, F. Enhancing biodegradability of textile wastewater by ozonation processes: Optimization with response surface methodology. Ozone Sci. Eng. 2018. [Google Scholar] [CrossRef]
  14. Gilbert, E. Biodegradability of ozonation products as a function of COD and DOC elimination by the example of humic acids. Water Res. 1988, 22, 123–126. [Google Scholar] [CrossRef]
  15. Yavich, A.A.; Lee, K.; Chen, K.; Pape, L.; Masten, S.J. Evaluation of biodegradability of NOM after ozonation. Water Res. 2004, 38, 2839–2846. [Google Scholar] [CrossRef] [PubMed]
  16. Von Gunten, U. Ozonation of drinking water: Part, I.I. Disinfection and by-product formation in presence of bromide, iodide or chlorine. Water Res. 2003, 37, 1469–1487. [Google Scholar] [CrossRef]
  17. Fang, J.; Liu, H.; Shang, C.; Zeng, M.; Ni, M.; Liu, W. E. coli and bacteriophage MS2 disinfection by UV; ozone and the combined UV and ozone processes. Front. Environ. Sci. Eng. 2014, 8, 547–552. [Google Scholar] [CrossRef]
  18. World Health Organization. Health Guidelines for the Use of Wastewater in Agriculture and Aquaculture; Technical Report Series No. 778; World Health Organization: Geneva, Switzerland, 1989. [Google Scholar]
  19. Martínez, S.B.; Pérez-parra, J.; Suay, R. Use of Ozone in Wastewater Treatment to Produce Water Suitable for Irrigation. Water Resour. Manag. 2011, 25, 2109–2124. [Google Scholar] [CrossRef]
  20. Elovitz, M.S.; Von, G.U. Hydroxyl Radical/Ozone Ratios During Ozonation Processes. I. The Rct Concept. Ozone Sci. Eng. 1999, 21, 239–260. [Google Scholar] [CrossRef]
  21. Papageorgiou, A.; Voutsa, D.; Papadakis, N. Occurrance and fate of ozonation by-products at a full-scale drinking water treatment plant. Sci. Total Environ. 2014, 481, 392–400. [Google Scholar] [CrossRef]
  22. Chon, K.; Salhi, E.; Von, G.U. Combination of UV absorbance and electron donating capacity to assess degradation of micropollutants and formation of bromate during ozonation of wastewater effluents. Water Res. 2015, 81, 388–397. [Google Scholar] [CrossRef]
  23. Klauson, D.; Klein, K.; Kivi, A.; Kattel, E.; Viisimaa, M.; Dulova, N.; Velling, S.; Trapido, M.; Tenno, T. Combined methods for the treatment of a typical hardwood soaking basin wastewater from plywood industry. Int. J. Environ. Sci. Technol. 2015, 12, 3575–3586. [Google Scholar] [CrossRef] [Green Version]
  24. Roth, J.A.; Sullivan, D.E. Kinetics of Ozone Decomposition in Water. Ozone Sci. Eng. 1983, 5, 37–49. [Google Scholar] [CrossRef]
  25. Hu, R.; Zhang, L.; Hu, J. Investigation of ozonation kinetics and transformation products of sucralose. Sci. Total Environ. 2017, 603–604, 8–17. [Google Scholar] [CrossRef] [PubMed]
  26. Crousier, C.; Jean-stéphane, P.; Albet, J.; Baig, S.; Roustan, M. Urban Wastewater Treatment by Catalytic Ozonation. Ozone Sci. Eng. 2015, 38, 3–13. [Google Scholar] [CrossRef]
  27. Marce, M.; Domenjoud, B.; Esplugas, S.; Baig, S. Ozonation treatment of urban primary and biotreated wastewaters: Impacts and modeling. Chem. Eng. J. 2016, 283, 768–777. [Google Scholar] [CrossRef]
  28. Beltrin, F.J.; Garcia-araya, J.F.; Álvarez, P.M. Domestic wastewater ozonation. Ozone Sci. Eng. 2007, 23, 219–228. [Google Scholar] [CrossRef]
  29. Shin, J.; Hidayat, Z.R.; Lee, Y.; Shin, J.; Hidayat, Z.R.; Lee, Y. Influence of Seasonal Variation of Water Temperature and Dissolved Organic Matter on Ozone and OH Radical Reaction Kinetics During Ozonation of a Lake Water. Ozone Sci. Eng. 2016, 38, 100–114. [Google Scholar] [CrossRef]
  30. Wen, G.; Ma, J.; Liu, Z.Q.; Zhao, L. Ozonation kinetics for the degradation of phthalate esters in water and the reduction of toxicity in the process of O3/H2O2. J. Hazard. Mater. 2011, 195, 371–377. [Google Scholar] [CrossRef]
  31. Environmental Protection Agency. Priority pollutants. United States Environ. Prot. Agency. 2014. Available online: https://www.epa.gov/eg/toxic-and-priority-pollutants-under-clean-water-act (accessed on 9 February 2018).
  32. Sundell, J.; Bornehag, C.G. Presences of phthalate esters in homes. Epidemiology 2006, 17, S86. [Google Scholar] [CrossRef]
  33. Vitali, M.; Guidotti, M.; Macilenti, G.; Cremisini, C. Phthalate esters in freshwaters as markers of contamination sources—A site study in Italy. Environ. Int. 1997, 23, 337–347. [Google Scholar] [CrossRef]
  34. Mu, X.; Huang, Y.; Li, J.; Yang, K.; Yang, W.; Shen, G.; Li, X.; Lei, Y.; Pang, S.; Wang, C.; et al. New insights into the mechanism of phthalate-induced developmental effects. Environ. Pollut. 2018, 241, 674–683. [Google Scholar] [CrossRef]
  35. Morales-Garcia, S.S.; Rodriguez-Espinosa, P.F.; Shruti, V.C.; Jonathan, M.P.; Martinez-Tavera, E. Metal concentrations in aquatic environments of Puebla River basin, Mexico: Natural and industrial influences. Environ. Sci. Pollut. Res. 2016, 24, 2589–2604. [Google Scholar] [CrossRef] [PubMed]
  36. Rodríguez-Espinosa, P.F.; Mendoza-Pérez, J.A.; Tabla-Hernandez, J.; Martínez-Tavera, E.; Monroy-Mendieta, M.M. Biodegradation and kinetics of organic compounds and heavy metals in an artificial wetland system (AWS) by using water hyacinths as a biological filter. Int J. Phytoremediation 2018, 20, 35–43. [Google Scholar] [CrossRef] [PubMed]
  37. Shruti, V.C.; Jonathan, M.P.; Rodríguez-Espinosa, P.F.; Nagarajan, R.; Escobedo-Urías, D.C.; Morales-García, S.S.; et al. Geochemical characteristics of stream sediments from an urban-volcanic zone, Central Mexico: Natural and man-made inputs. Chemie der Erde-Geochemistry 2017, 77, 303–321. [Google Scholar] [CrossRef]
  38. Martinez-Tavera, E.; Rodriguez-Espinosa, P.F.; Shruti, V.C.; Sujitha, S.B.; Morales-Garcia, S.S.; Muñoz-Sevilla, N.P. Monitoring the seasonal dynamics of physicochemical parameters from Atoyac River basin (Puebla), Central Mexico: Multivariate approach. Environ. Earth Sci. 2017, 76, 95. [Google Scholar] [CrossRef]
  39. Rodriguez-Espinosa, P.F.; Morales-García, S.S.; Jonathan, M.P.; Navarrete-Lopez, M.; Bernal-Campos, A.A.; Gonzales-Cesar, A.; Muñoz-Sevilla, N.P. Servicio Ambiental de la Presa Valsequillo para las Cuencas de los Ríos del Atoyac-Zahuapan y Alseseca, Puebla, Tlaxcala, México. Inst Nac Ecol y Cambio Clim (INECC) Secr Medio Ambient y Recur Na. 2011, pp. 1–10. Available online: http://viveatoyac.org.mx/images/Biblioteca temática/Biblioteca sobre el agua/3g010 Servicio ambiental de la presa Valsequillo para las cuencas del Atoyac y Alseseca.pdf (accessed on 11 October 2018).
  40. Morales-García, S.S.; Rodriguez-Espinoza, P.F.; Jonathan, M.P. Environmental Assessment and Sustainable Development of Valsequillo in Puebla, Mexico. In Proceedings of the 2012 International Conference on Environmental Science and Technology, Houston, TX, USA, 25–29 June 2012; pp. 113–117. [Google Scholar]
  41. Kishimoto, N.; Morita, Y.; Tsuno, H.; Yasuda, Y. Characteristics of electrolysis, ozonation and their combination process on treatment of municipal wastewater. Water Environ. Fed. 2007, 79, 1033–1042. [Google Scholar] [CrossRef]
  42. Gárfias, J.; Arroyo, N.; Aravena, R. Hydrochemistry and origins of mineralized waters in the Puebla aquifer system, Mexico. Environ. Earth Sci. 2009, 59, 1789–1805. [Google Scholar] [CrossRef]
  43. Aldstadt, J.H., III; Bootsma, H.A.; Ammerman, J.L. Chemical Properies of Water. In Earth Systems and Environmental Sciences; Likens, G.E., Ed.; Springer: Basel, Switzerland, 2009. [Google Scholar]
  44. Tebbut, T.H.Y. Fundamentos de Control de la Calidad del agua; Editores ELSA de CVGN, Ed.; Editorial Limusa S.A. de C.V. Grupo Noriega Editors: Ciudad de México, Mexico, 1998. [Google Scholar]
  45. Boyd, C.E. Water Quality: An Introduction, 2nd ed.; Springer: Basel, Switzerland, 2008. [Google Scholar]
  46. Wert, E.C.; Rosario-ortiz, F.L.; Drury, D.D.; Snyder, S.A. Formation of oxidation byproducts from ozonation of wastewater. Water Res. 2007, 41, 1481–1490. [Google Scholar] [CrossRef]
  47. Martín-Loaiza, C.; Céspedes, C.L. Compuestos volátiles de plantas, origen, emisión, efectos, análisis y aplicaciones al agro. Rev. Fitotec. Mex. 2007, 30, 327–351. [Google Scholar]
  48. Mandal, S.M.; Chakraborty, D.; Dey, S. Phenolic acids act as signaling molecules in plant-microbe symbioses. Plant Signal. Behav. 2010, 5, 359–368. [Google Scholar] [CrossRef] [Green Version]
  49. Van Dijk, J. The velocity of ozonation of benzene and its homologues. Recueil des Travaux Chimiques des Pays-Bas 1948, 67, 945–1019. [Google Scholar] [CrossRef]
  50. Hoigné, J.; Bader, H. Ozonation of water: “Oxidation-competition values” of different types of waters used in Switzerland. Ozone Sci. Eng. 1979, 1, 357–372. [Google Scholar] [CrossRef]
  51. Kwon, M.; Kye, H.; Jung, Y.; Yoon, Y.; Joon-wun, K. Performance characterization and kinetic modeling of ozonation using a new method: ROH,O3 concept. Water Res. 2017, 122, 172–182. [Google Scholar] [CrossRef] [PubMed]
  52. Beltrin, F.J.; Garcia-Araya, J.F.; Álvarez, P.M. Domestic Wastewater Ozonation: A Kinetic Model Approach. Ozone Sci. Eng. 2001, 23, 219–228. [Google Scholar] [CrossRef]
  53. Papageorgiou, A.; Stylianou, S.K.; Kaffes, P.; Zouboulis, A.I.; Voutsa, D. Effects of ozonation pretreatment on natural organic matter and wastewater derived organic matter—Possible implications on the formation of ozonation by-products. Chemosphere 2017, 170, 33–40. [Google Scholar] [CrossRef] [PubMed]
  54. Wert, E.C.; Rosario-ortiz, F.L.; Snyder, S.A. Effect of ozone exposure on the oxidation of trace organic contaminants in wastewater. Water Res. 2009, 43, 1005–1014. [Google Scholar] [CrossRef] [PubMed]
  55. Ho, Y.S.; Mckay, G. Pseudo-second order model for sorption processes. Process. Biochem. 1999, 34, 451–465. [Google Scholar] [CrossRef]
  56. Hoigné, J. The Chemistry of Ozone in Water. In Process Technologies for Water Treatment, 1st ed.; Stucki, S., Ed.; Plenum Press: New York, NY, USA, 1988. [Google Scholar]
  57. Jekel, M.R. Flocculation Effects of Ozone. Ozone Sci. Eng. 1994, 16, 55–66. [Google Scholar] [CrossRef]
  58. Gutierrez-Lopez. Determinación de la Capacidad de Asimilación de Contaminantes en la presa Manuel Ávila Camacho, Puebla. Ph.D. Thesis, Instituto Mexicano de Tecnologia del Agua (IMTA), Jiutepec, Mexico, 2014. [Google Scholar]
  59. Reckhow, D.A.; Legube, B.; Singer, P.C. The ozonation of organic halide precursors: Effect of bicarbonate. Water Res. 1986, 20, 987–998. [Google Scholar] [CrossRef]
  60. Can, Z.S.; Gurol, M. Formaldehyde formation during ozonation of drinking water. Ozone Sci. Eng. 2003, 25, 41–51. [Google Scholar] [CrossRef]
  61. Reynolds, G.; Corless, C.; Graham, N.; Perry, R.; Gibson, T.M.; Haley, J. Aqueous Ozonation of Fatty Acids. Ozone Sci. Eng. 1989, 11, 143–154. [Google Scholar] [CrossRef]
  62. Kırış, S.; Velioglu, Y.S.; Tekin, A. Effect of Ozonated Water Treatment on Fatty Acid Composition and Some Quality Parameters of Olive Oil. Ozone Sci Eng. 2017, 39, 91–96. [Google Scholar] [CrossRef]
  63. Kianmehr, P.; Kfoury, F. Prediction of Methane Generation of Ozone-Treated Sludge from a Wastewater Treatment Plant. Ozone Sci. Eng. 2016, 38, 465–471. [Google Scholar] [CrossRef]
  64. Sevimli, M.F.; Sarikaya, H.Z.; Yazgan, M.S. A new approach to determine the practical ozone dose for color removal from textile wastewater. Ozone Sci. Eng. 2003, 25, 137–143. [Google Scholar] [CrossRef]
  65. Li, W.-X.; Tang, C.-D.; Wu, Z.-L.; Wang, W.-M.; Zhang, Y.-F.; Zhao, Y.; Cravotto, G. Eutrophic water purification efficiency using a combination of hydrodynamic cavitation and ozonation on a pilot scale. Environ. Sci. Pollut. Res. 2015, 22, 6298–6307. [Google Scholar] [CrossRef] [PubMed]
  66. Zhang, J.; Tian, Y.; Zhang, J. Release of phosphorus from sewage sludge during ozonation and removal by magnesium ammonium phosphate. Environ. Sci. Pollut. Res. 2017, 24, 23794–23802. [Google Scholar] [CrossRef] [PubMed]
  67. Guya, F.J. Bioavailability of particle-associated nutrients as affected by internal regeneration processes in the Nyanza Gulf region of Lake Victoria. Lakes Reserv. Res. Manag. 2013, 18, 129–143. [Google Scholar] [CrossRef]
  68. Giri, R.R.; Ozaki, H.; Ota, S.; Takanami, R.; Taniguchi, S. Degradation of common pharmaceuticals and personal care products in mixed solutions by advanced oxidation techniques. Int. J. Environ. Sci. Technol. 2010, 7, 251–260. [Google Scholar] [CrossRef] [Green Version]
  69. Deng, Y.; Zhao, R. Advanced Oxidation Processes (AOPs) in Wastewater Treatment. Curr. Pollut. Rep. 2015, 1, 167–176. [Google Scholar] [CrossRef] [Green Version]
  70. Khamparia, S.; Jaspal, D.K. Adsorption in combination with ozonation for the treatment of textile waste water: A critical review. Front. Environ. Sci. Eng. 2017, 11, 1–18. [Google Scholar] [CrossRef]
  71. Fahmi, N.W.; Okada, M. Improvement of DOC removal by multi-stage AOP-biological treatment. Chemosphere 2003, 50, 1043–1048. [Google Scholar] [CrossRef]
  72. Von Gunten, U. Ozonation of drinking water: Part, I. Oxidation kinetics and product formation. Water Res. 2003, 37, 1443–1467. [Google Scholar] [CrossRef]
  73. El-taliawy, H.; Ekblad, M.; Nilsson, F.; Hagman, M.; Paxeus, N.; Jönsson, K.; Cimbritz, M.; Jansen, J.C.; Bester, K. Ozonation efficiency in removing organic micro pollutants from wastewater with respect to hydraulic loading rates and different wastewaters. Chem. Eng. J. 2017, 325, 310–321. [Google Scholar] [CrossRef]
  74. Song, Y.; Breider, F.; Ma, J.; von Gunten, U. Nitrate formation during ozonation as a surrogate parameter for abatement of micropollutants and the N-nitrosodimethylamine (NDMA) formation potential. Water Res. 2017, 122, 246–257. [Google Scholar] [CrossRef] [PubMed]
  75. Yuan, D.; Xie, S.; Ding, C.; Lin, F.; He, Y.; Wang, Z.; Cen, K. The Benefits of Small Quantities of Nitrogen in the Oxygen Feed to Ozone Generators. Ozone Sci. Eng. 2018, 40, 313–320. [Google Scholar] [CrossRef]
  76. Ruano, M.V.; Ribes, J.; Seco, A.; Ferrer, J. An advanced control strategy for biological nutrient removal in continuous systems based on pH and ORP sensors. Chem. Eng. J. 2012, 183, 212–221. [Google Scholar] [CrossRef]
  77. Yu, R.; Lin, C.; Chen, H.; Cheng, W.; Kao, M. Possible control approaches of the Electro-Fenton process for textile wastewater treatment using on-line monitoring of DO and ORP. Chem. Eng. J. 2013, 218, 341–349. [Google Scholar] [CrossRef]
  78. Goncharuk, V.V.; Bagrii, V.A.; Mel, L.A.; Chebotareva, R.D.; Bashtan, S.Y. The Use of Redox Potential in Water Treatment Processes. Phys. Chem. Water Treat. Process. 2010, 32, 1–9. [Google Scholar] [CrossRef]
  79. James, C.N.; Copeland, R.C.; Lytle, D.A. Relationships between oxidation-reduction potential, oxidant, and pH in drinking water. In Proceedings of the AWWA Water Quality Technology Conference, San Antonio, TX, USA, 14–18 November 2004. [Google Scholar]
  80. Klein, H.P. Ozone in Water Treatment Processes. In Process Technology Water Treatment, 1st ed.; Stucki, S., Ed.; Springer: Boston, MA, USA, 1988. [Google Scholar]
  81. Toui, S. The Oxidation of Manganese and Disinfection by Ozonation in Water Purification Processing. Ozone Sci. Eng. 1991, 13, 623–637. [Google Scholar] [CrossRef]
  82. Edwards, M.; Benjamin, M.M. Transformation of NOM by Ozone and its Effect on Iron and Aluminum Solunility. Res. Technol. 1992, 84, 56–66. [Google Scholar]
  83. Flores-Márquez, E.L.; Jiménez-Suárez, G.; Martínez-Serrano, R.G.; Chávez, R.E.; Pérez, D.S. Study of geothermal water intrusion due to groundwater exploitation in the Puebla Valley aquifer system, Mexico. Hydrogeol. J. 2006, 14, 1216–1230. [Google Scholar] [CrossRef]
  84. Rozan, T.F.; Benoit, G.; Luther, G.W. Measuring metal sulfide complexes in oxic river waters with square wave voltammetry. Environ. Sci. Technol. 1999, 33, 3021–3026. [Google Scholar] [CrossRef]
  85. Buffle, J. Natural Organic Matter and Metal-Organic interaction in Aquatic Systems. In Metal Ions in Biological Systems; Sigel, H., Ed.; University of Basel: Basel, Switzerland, 1984; p. 399. [Google Scholar]
  86. Zeng, F.; Cui, K.; Xie, Z.; Liu, M.; Li, Y.; Lin, Y.; Zeng, Z.; Li, F. Occurrence of phthalate esters in water and sediment of urban lakes in a subtropical city, Guangzhou, South China. Environ. Int. 2008, 34, 372–380. [Google Scholar] [CrossRef] [PubMed]
  87. Lawrence, J.; Tosine, H.; Onuska, F.I.; Comba, M.E. The ozonation of natural waters: Product identification. Ozone Sci. Eng. 1980, 2, 55–64. [Google Scholar] [CrossRef]
  88. Sindhu, R.; Binod, P.; Pandey, A.; Madhavan, A.; Alphonsa, J.A.; Vivek, N.; Gnansounou, E.; Castro, E.; Faraco, V. Water hyacinth a potential source for value addition: An overview. Bioresour. Technol. 2017, 230, 152–162. [Google Scholar] [CrossRef] [PubMed]
  89. Puri, V.P. Ozone pretreatment to increase digestibility of lignocellulose. Biotechnol. Lett. Vol. 1983, 5, 773–776. [Google Scholar] [CrossRef]
  90. Binder, A.; Pelloni, L.; Fiechter, A. Delignification of Straw with Ozone to Enhance Biodegradability. Appl. Microbiol. Biotechnol. 1980, 11, 1–5. [Google Scholar] [CrossRef]
  91. Zappi, M.E.; Hernandez, R.; Gang, D.; Bajpai, R.; Kuo, C.H.; Hill, D.O. Treatment of groundwater contaminated with high levels of explosives using advanced oxidation processes. Int. J. Environ. Sci. Technol. 2016, 13, 2767–2778. [Google Scholar] [CrossRef]
  92. Rodríguez, A.; Rosal, R.; Perdigón-Melón, J.A.; Mezcua, M.; Agüera, A.; Hernando, M.D.; Letón, P.; Fernández-Alba, A.R.; García-Calvo, E. Ozone-Based Technologies in Water and Wastewater Treatment. Handb. Environ. Chem. 2008, 5, 127–175. [Google Scholar]
  93. NOM-001-SEMARNAT-1996. Límites Máximos Permisibles De Contaminantes En Las Descargas De Aguas Residuales En Aguas Y Bienes Nacionales. Secr. medio Ambient. y Recur. Nat. D. Of. la Fed. 1996. Available online: http://www.gob.mx/cms/uploads/attachment/file/105139/Normas_Oficiales_Mexicanas.pdf (accessed on 21 November 2018).
Figure 1. Sampling points in Atoyac River, Alseseca River and Valsequillo Reservoir in Puebla State, Mexico. SBTP = San Baltazar Tetela Peninsula.
Water 10 01790 g001
Figure 2. Scheme of the experimental process. (a) Water sampling from the study area, (b) Ozonation of aliquots at different times, (c) Sampling of aliquots and (d) Measurement of physicochemical parameters.
Water 10 01790 g002
Figure 3. Removal (%) of COD, BOD5, Spectral Absorption Coefficient at 254 nanometers (SAC254) and total solids (TS) upon ozonation of water at different ozone doses and O3 contact time.
Water 10 01790 g003
Figure 4. BOD5 and COD ratio along the ozone contact time. (a) Sampling point from Alseseca River, (b) Sampling point from Atoyac River, (c) Sampling from Valsequillo reservoir (inside the water hyacinth coverage), (d) Sampling from Valsequillo reservoir (after the water hyacinth coverage).
Water 10 01790 g004
Figure 5. Removal of COD and BOD5 as function of reaction time. * Chemical Oxygen demand, + 5-day biological oxygen demand. The dotted lines represent the required time to obtain kinetics. Inset: Second order kinetic plot for the removal of COD and BOD5.
Water 10 01790 g005
Figure 6. Total, dissolved and suspended solids of collected water at different times of ozone application. (a) Sampling point from Alseseca River, (b) Sampling point from Atoyac River, (c) Sampling from Valsequillo reservoir (inside the water hyacinth coverage), (d) Sampling from Valsequillo reservoir (after the water hyacinth coverage), (e) Sampling from Valsequillo reservoir (east zone).
Water 10 01790 g006
Figure 7. Fecal coliforms (FC) concentration during O3 treatment for all water samples. (a) Sampling point from Alseseca River, (b) Sampling point from Atoyac River, (c) Sampling from Valsequillo reservoir (inside the water hyacinth coverage), (d) Sampling from Valsequillo reservoir (after the water hyacinth coverage), (e) Sampling from Valsequillo reservoir (east zone).
Water 10 01790 g007
Table 1. Methods employed to measure physicochemical parameters and their International concordance.
(a) Parameters Measured in CIIEMAD-IPN
ParameterUnitsEquipment EmployedLocal MethodInternational Concordance
Chemical oxygen demand (COD)mg/LSpectrophotometry UV/Vis (PerkinElmerLambda 20)NMX-AA-030/1-SCFI-2012(APHA et al., 2005)/5220D
Biochemical oxygen demand (BOD)mg/LOximeter (YSI/51B)NMX-AA-028-SCFI-2001(APHA et al., 2005)/5210B
Spectral absorption coefficient at 254 nanometers (SAC254)Abs/mSpectrophotometry UV/Vis (PerkinElmerLambda 20) with 1 cm cell (q)--
TurbidityNTUTurbidimeter (model 2100Q)NOM-AA-38-SCFI-1981(APHA et al., 2005)/2130B
Hydrogen potential (pH)-Multip. HACH (Model 2100Q & HQ40D)NMX-AA-008-SCFI-2011(APHA et al., 2005)/4500B
ConductivityµS/cmMultip. HACH (Model 2100Q & HQ40D)NMX-AA-093-SCFI-2000(APHA et al., 2005)/2510B
Dissolved oxygen (DO)mg/LMultip. HACH (Model 2100Q & HQ40D)NMX-AA-012-SCFI-2001(APHA et al., 2005)/2810
Oxidation-Reduction potentialmVMultip. HACH (Model 2100Q & HQ40D)-(APHA et al., 2005)/2580
Fecal coliforms (FC)NMP/100 mL-NMX-AA-042-SCFI-2015(APHA et al., 2005)/9221
Alkalinity (Alky)mg CaCO3/L-NMX-AA-036-SCFI-2001(APHA, 2012)/2320B
(b) Parameters Measured in CMPL-IPN
ParameterUnitsEquipment EmployedLocal MethodInternational Concordance
Total solidsmg/LStove (Model Riossa Series E-33)NMX-AA-034-SCFI-2001(APHA et al., 2005)/2540B
Total dissolved solidsmg/LStove (Model Riossa Series E-33)NMX-AA-034-SCFI-2001(APHA et al., 2005)/2540C
Total suspended solidsmg/LStove (Model Riossa Series E-33)NMX-AA-034-SCFI-2001(APHA et al., 2005)/2540D
(c) Parameters Measured in Intertek + ABC—Analytic Laboratories
ParameterUnitsEquipment EmployedLocal MethodInternational Concordance
Real color (RC)Pt-CoAqua tester, Orbeco/Hellige (Model C611A)NMX-AA-045-SCFI-2001-
Fats and Oils (FaO)mg/LExtraction by using hexane as solventNMX-AA-005-SCFI- 2013-
Total phosphorous (TP)(mg/L)FA′S OI Analytical—Flow Solution IVNMX-AA-029-SCFI-2001-
Ammonia nitrogen (NH3-N)mg/LFA′S OI Analytical—Flow Solution IVNMX-AA-026-SCFI-2010US EPA 350.1-1993 (I)
Nitrates NO3mg/LFA′S OI Analytical—Flow Solution IVNMX-AA-079-SCFI-2001US EPA 353.2-1993 (I)
Sulfates (SO42−)mg/LFA′S OI Analytical—Flow Solution IV-US EPA 9036-1986
Chloride (Cl)mg/LFA′S OI Analytical—Flow Solution IVNMX-AA-073-SCFI-2001-
Total Cyanides (CN)mg/LFA′S OI Analytical—Flow Solution IVNMX-AA-058-SCFI-2001US EPA 335.3-1978 (I)
Al, Cr, Cu, Fe, Zn, Mn and Niµg/LICP-OES CID Thermo Scienctific-6500NMX-AA-051-SCFI-2001US EPA 6010C 2007 (I)
Hgµg/LMercury analyzer Hydra IIAANMX-AA-051-SCFI-2001US EPA 7470A 1994 (I)
Dimethyl phthalate (DMP), Diethyl phthalate (DEP), Dibutyl phthalate (DBP), Di(2-ethylhexyl) phthalate (DEHP) and Di(n-octil)ftalato (DINP)µg/LGas chromatography (GC/MSD) Agilent technologies 7890B-5977 A MSD-US EPA 8270D 2007
Isophorone (IP)µg/LGas chromatography (GC/MSD) Agilent technologies 7894 B/5977 A MSD-US EPA 8270D 2007
Total Phenols (TPh)µg/LFA′S OI Analytical—Flow Solution IV-US EPA 8270D 2007
Table 2. Physicochemical characteristics of different water samples from the study area treated with different ozone (O3) doses.
Water SampleTime (m)Ozone Dose *Turbidity (NTU)Alky aFaO b (mg/L)TP c (mg/L)pHσ (µS/cm)NH3-N (mg/L)NO3 (mg/L)DO e (mg/L)ORP f (mV)RC g (Pt-Co)SO42− (mg/L)Cl (mg/L)CN (mg/L)
(a) VO3-AT00.01822776.03.67.4115313.90.044.21103085.756.04.2
50.2182---7.91137--7.4119----
200.8169---8.01148--7.0119----
602.3145---8.41177--6.5115----
1204.793-6.71.68.5117013.40.356.81131578.457.01.7
(b) VO3-AL00.0182383--7.6827--5.3123----
50.7164---8.1841--7.0126----
200.3140---8.4846--7.0126----
600.8132---8.5854--6.7129----
1201.6114---8.6848--6.5120----
(c) VO3-0100.0582357.22.07.364310.10.013.61373066.445.03.3
50.550---7.9646--7.3132----
202.152---8.2648--7.4131----
606.345-9.61.38.465010.00.257.11251569.848.01.8
(d) VO3-0200.08263ND1.97.56819.80.027.21275062.960.0-
53.37---7.6734--6.9134----
1510.09---8.3723--7.7130----
4026.79-ND2.08.474510.30.126.71154058.959.0-
(e) VO3-0300.012267--7.2714--6.2134----
53.311---7.3738--6.8150----
1510.011---8.0746--6.9145----
3020.011---8.4756--6.8135----
* Ozone dose in mg O3/mg COD. a Alkalinity in mg CaCO3, b FaO, c Total phosphorous, d Conductivity, e Dissolved oxygen, f Redox potential, g Real color.
Table 3. Chemical Oxygen Demand (COD) and Biochemical Oxygen Demand (BOD5) concentration values during treatment with O3.
Time (m)O3 (mg)(a) VO3-AL(b) VO3-AT(c) VO3-01(d) VO3-02(e) VO3-03
COD aBOD5 bSAC254 cCOD aBOD5 bSAC254 cCOD aBOD5 bSAC254 cCOD aBOD5 bSAC254 cCOD aBOD5 bSAC254 c
00.0505.0181.564172.059.511364.022.54310.09.63010.010.030
533.3371.0156.963178.042.011239.0-4219.79.82810.010.027
15100.0-- -- ---10.08.12710.010.026
20133.3201.0117.856133.036.611025.014.836------
30200.0-- -- ------10.010.024
40267.0-- -- ---10.010.020---
60400.0294.0109.656130.062.511032.012.636------
120800.0305.091.65488.026.8101---------
a Chemical oxygen demand (mg/L), b Biological oxygen demand (mg/L), c Spectral coefficient at 254 nanometers (Abs/m).
Table 4. Kinetic constants and their respective coefficients of determination for different reaction orders.
Water SampleZero OrderFirst Order Second Order a
K b(R2) cK b(R2) cKb(R2) c
(a) COD d
VO3-AL14.32900.95560.04500.99100.00020.9998
VO3-AT0.68070.87510.00540.91390.00040.9289
VO3-011.69210.81120.04260.90000.00120.9651
VO3-02------
VO3-03------
(b) BOD5 e
VO3-AL0.62290.72000.00490.79130.00040.8573
VO3-AT0.96580.70180.02080.74720.00050.7942
VO3-010.14920.76750.00880.81470.00050.8627
VO3-02------
VO3-03------
(c) SAC f
VO3-AL0.09310.89040.00900.89248 × 10−60.8899
VO3-AT0.07740.68500.00130.69982 × 10−50.7147
VO3-010.32740.99790.00820.99650.00020.9948
VO3-020.23570.99160.00930.98750.00040.9803
VO3-030.17640.93750.00660.94940.00020.9586
a Pseudo-first order reaction. Bold numbers represent the highest determination coefficient, b Kinetic constant, c Determination coefficient, d Chemical Oxygen Demand, e Biochemical Oxygen Demand, f Spectral Absorption Coefficient at 254 nanometers.
Table 5. Heavy metals and organic compounds in water samples before and after being treated with ozone.
Total Metals (µg/L)Organic Compounds (µg/L)
Water SampleOzone Dose *AlCrCuFeZnMnNiHgDEHP aDBP bDEP cDMP dDINP eIP fTPh g
VO3-ATBefore (0)6790.013.429.17008.5110.3576.024.10.25.8NDNDNDND0.553.0
After (4.7)660.0ND5.8684.020.5154.07.90.04.72.9NDND0.90.443.7
VO3-01Before (0)2250.05.48.82275.640.4365.011.30.0NDNDNDNDNDND47.9
After (6.3)450.0ND51.8697.548.2230.0181.20.05.66.90.40.6ND0.148.3
VO3-02Before (0)60.0NDND138.715.6293.06.2NDNDNDNDNDNDND54.8
After (26.7)70.0NDND197.112.4318.07.50.11.6NDNDNDNDND57.0
* Ozone dose in mg O3/mg COD. a Di(2-ethylhexyl)phthalate, b Dibutyl phthalate, c Diethyl phthalate, d Dimethyl phthalate, e Di(n-octil)ftalato, f Isophorone, g Total Phenols. ND = Not-determined.

