Evaluation and Hydrological Validation of GPM Precipitation Products over the Nanliu River Basin, Beibu Gulf


1
Key Laboratory of Environment Change and Resources Use in Beibu Gulf, Ministry of Education, Guangxi Teachers Education University, Nanning 530001, China
2
Guangxi Key Laboratory of Earth Surface Processes and Intelligent Simulation, Guangxi Teachers Education University, Nanning 530001, China
3
School of Geography and Planning, Guangxi Teachers Education University, Nanning 530001, China
4
School of Earth and Environmental Sciences, The University of Queensland, Brisbane 4067, Australia
*
Authors to whom correspondence should be addressed.
Water 2018, 10(12), 1777; https://doi.org/10.3390/w10121777
Submission received: 17 November 2018
/
Revised: 30 November 2018
/
Accepted: 30 November 2018
/
Published: 3 December 2018
(This article belongs to the Special Issue Applications of Remote Sensing and GIS in Hydrology)
Abstract
:Adequate and high-quality precipitation estimates, from spaceborne precipitation radars, are necessary for a variety of applications in hydrology. In this study, we investigated the performance of two Integrated Multi-satellitE Retrievals for the Global Precipitation Measurement (GPM) mission (IMERG) products, against gauge observations over a small river basin, the Beibu Gulf—the Nanliu River basin, and evaluated their capability of streamflow simulation, based on a conceptual watershed model from April 2014 to December 2016. The results showed that both IMERG_Cal and IMERG_Uncal could roughly capture the spatial patterns of precipitation with slight over/underestimation (Relative Bias (RB) values of 6.5% and −5.5%, respectively) at a basin scale. At grid-cell scales, two IMERG products got an RB of −23.3% to 18.9%, Correlation Coefficient (CC) of 0.521 to 0.744, and Root Mean Square Error (RMSE) of 11.3 to 17.5 mm. There were some considerable errors in heavy precipitation events, and the IMERG significantly overestimated the amounts of these extreme events. The two IMERG products showed a higher accuracy and lower error rate, when detecting the light precipitation. IMERG-driven simulation had a better quality when the model was calibrated with satellite data rather than with rain gauge data. This analysis implied that IMERG products have potential in hydrological applications, in this region, and need further improvement in algorithms.
1. Introduction
Precipitation is an important climate variable that provides critical information on global and regional water cycles [1,2]. The conventional approach to obtain precipitation information is by gauge observation networks, and it provides direct and reliable measurements of precipitation. Precipitation exhibits significant spatiotemporal variability that requires high-density observation networks for adequate data representation [3,4,5,6]. However, gauge networks are often unevenly distributed or sparse in the remote or developing regions of the world [7,8,9,10]. So, the availability of accurate and reliable precipitation data, with different spatial and temporal scales, remains a challenge.
Satellite-based estimates can provide continuous spatiotemporal precipitation information from space, and the precipitation products derived from satellites with different spatial and temporal resolutions, have been available in recent decades [11,12,13,14,15]. The Tropical Rainfall Measuring Mission (TRMM) is a joint-mission between the National Aeronautics and Space Administration (NASA) of the United States and the National Space Development Agency (NASDA) of Japan, and the TRMM satellite was launched in 1997 [16,17,18]. The objectives of TRMM were to measure rainfall and energy (i.e., latent heat of condensation) exchange, in tropical and subtropical regions of the world [17]. TRMM data are a valuable source of rainfall data, and scientists have used TRMM data to provide high-quality climatology of rainfall and other applications [19].
The TRMM satellite exhausted its fuel in July 2014, after orbiting the Earth for 17 years. On 28 February 2014, NASA and the Japan Aerospace Exploration Agency (JAXA) jointly launched the core satellite of the Global Precipitation Measurement (GPM) [2]. As the successor of TRMM, GPM has been designed to provide a new generation of precipitation products from space, with an improved accuracy and coverage at higher space–time resolutions [2]. The GPM mission consists of nine constellation satellites and one Core Observatory satellite. Compared to the TRMM coverage (37° N/S), the GPM Core Observatory has a greater global coverage (68° N/S), and this will allow better characterization of precipitation and development of more accurate precipitation products for the middle and high latitudes, with different climate regimes [2]. The spaceborne dual-frequency phased array precipitation radar (DPR), operating at the Ku (13 GHz) and the Ka (35 GHz) bands, was first carried on the Core Observatory satellite. In addition to the DPR, a multichannel (10–183 GHz) GPM Microwave Imager (GMI) was also carried on. The GPM sensors will extend the measurement range attained by the TRMM to include light-intensity precipitation (<0.5 mm/h), and can detect snowfall and light precipitation, more accurately, than TRMM sensors [2]. The newly-released Integrated Multi-satellitE Retrievals for GPM (IMERG) [20] products provide quasi-global coverage (60° N/S) and finer spatial and temporal resolution (0.1° × 0.1°, 30 min) than the TRMM products.
There have been some initial comparative evaluations of GPM products against precipitation gauges, under different climatic and topographic conditions [21,22,23,24,25,26,27,28], and also some hydrological validations, at basin scales [29,30,31,32]. These evaluation works of the GPM mentioned above, were conducted at large scales, including global, continental, and large-medium basins, but few have been conducted for the small basin areas. The study conducted by Yilmaz et al. [33] indicated that the overall performance of the model simulations, using satellite-based precipitation estimates depends on the size of the basins, as well as the bias in the precipitation estimates, with poorer performance in smaller basins and better performance in larger basins. Tan et al. [34] also found that both IMERG and TRMM Multi-satellite Precipitation Analysis (TMPA) products improved, when scaled up to larger areas and longer time periods, with better identification of rain occurrences and consistent improvements in systematic and random errors of rain rates. However, more reliable and precise rainfall data, at a small river-basin-scale, are critically important for water resources management, which very often operates locally.
In this study, we aimed to evaluate the performance of GPM precipitation products—the successor of TRMM—in a small basin and examine their utility in hydrological modeling. Specifically, we will compare two GPM products, with gauge observations at both grid and basin scales, for a thirty-three,-month period (from April 2014 to December 2016), over the Nanliu River basin, and use these two products to drive a model for hydrological simulation.
2. Study Region
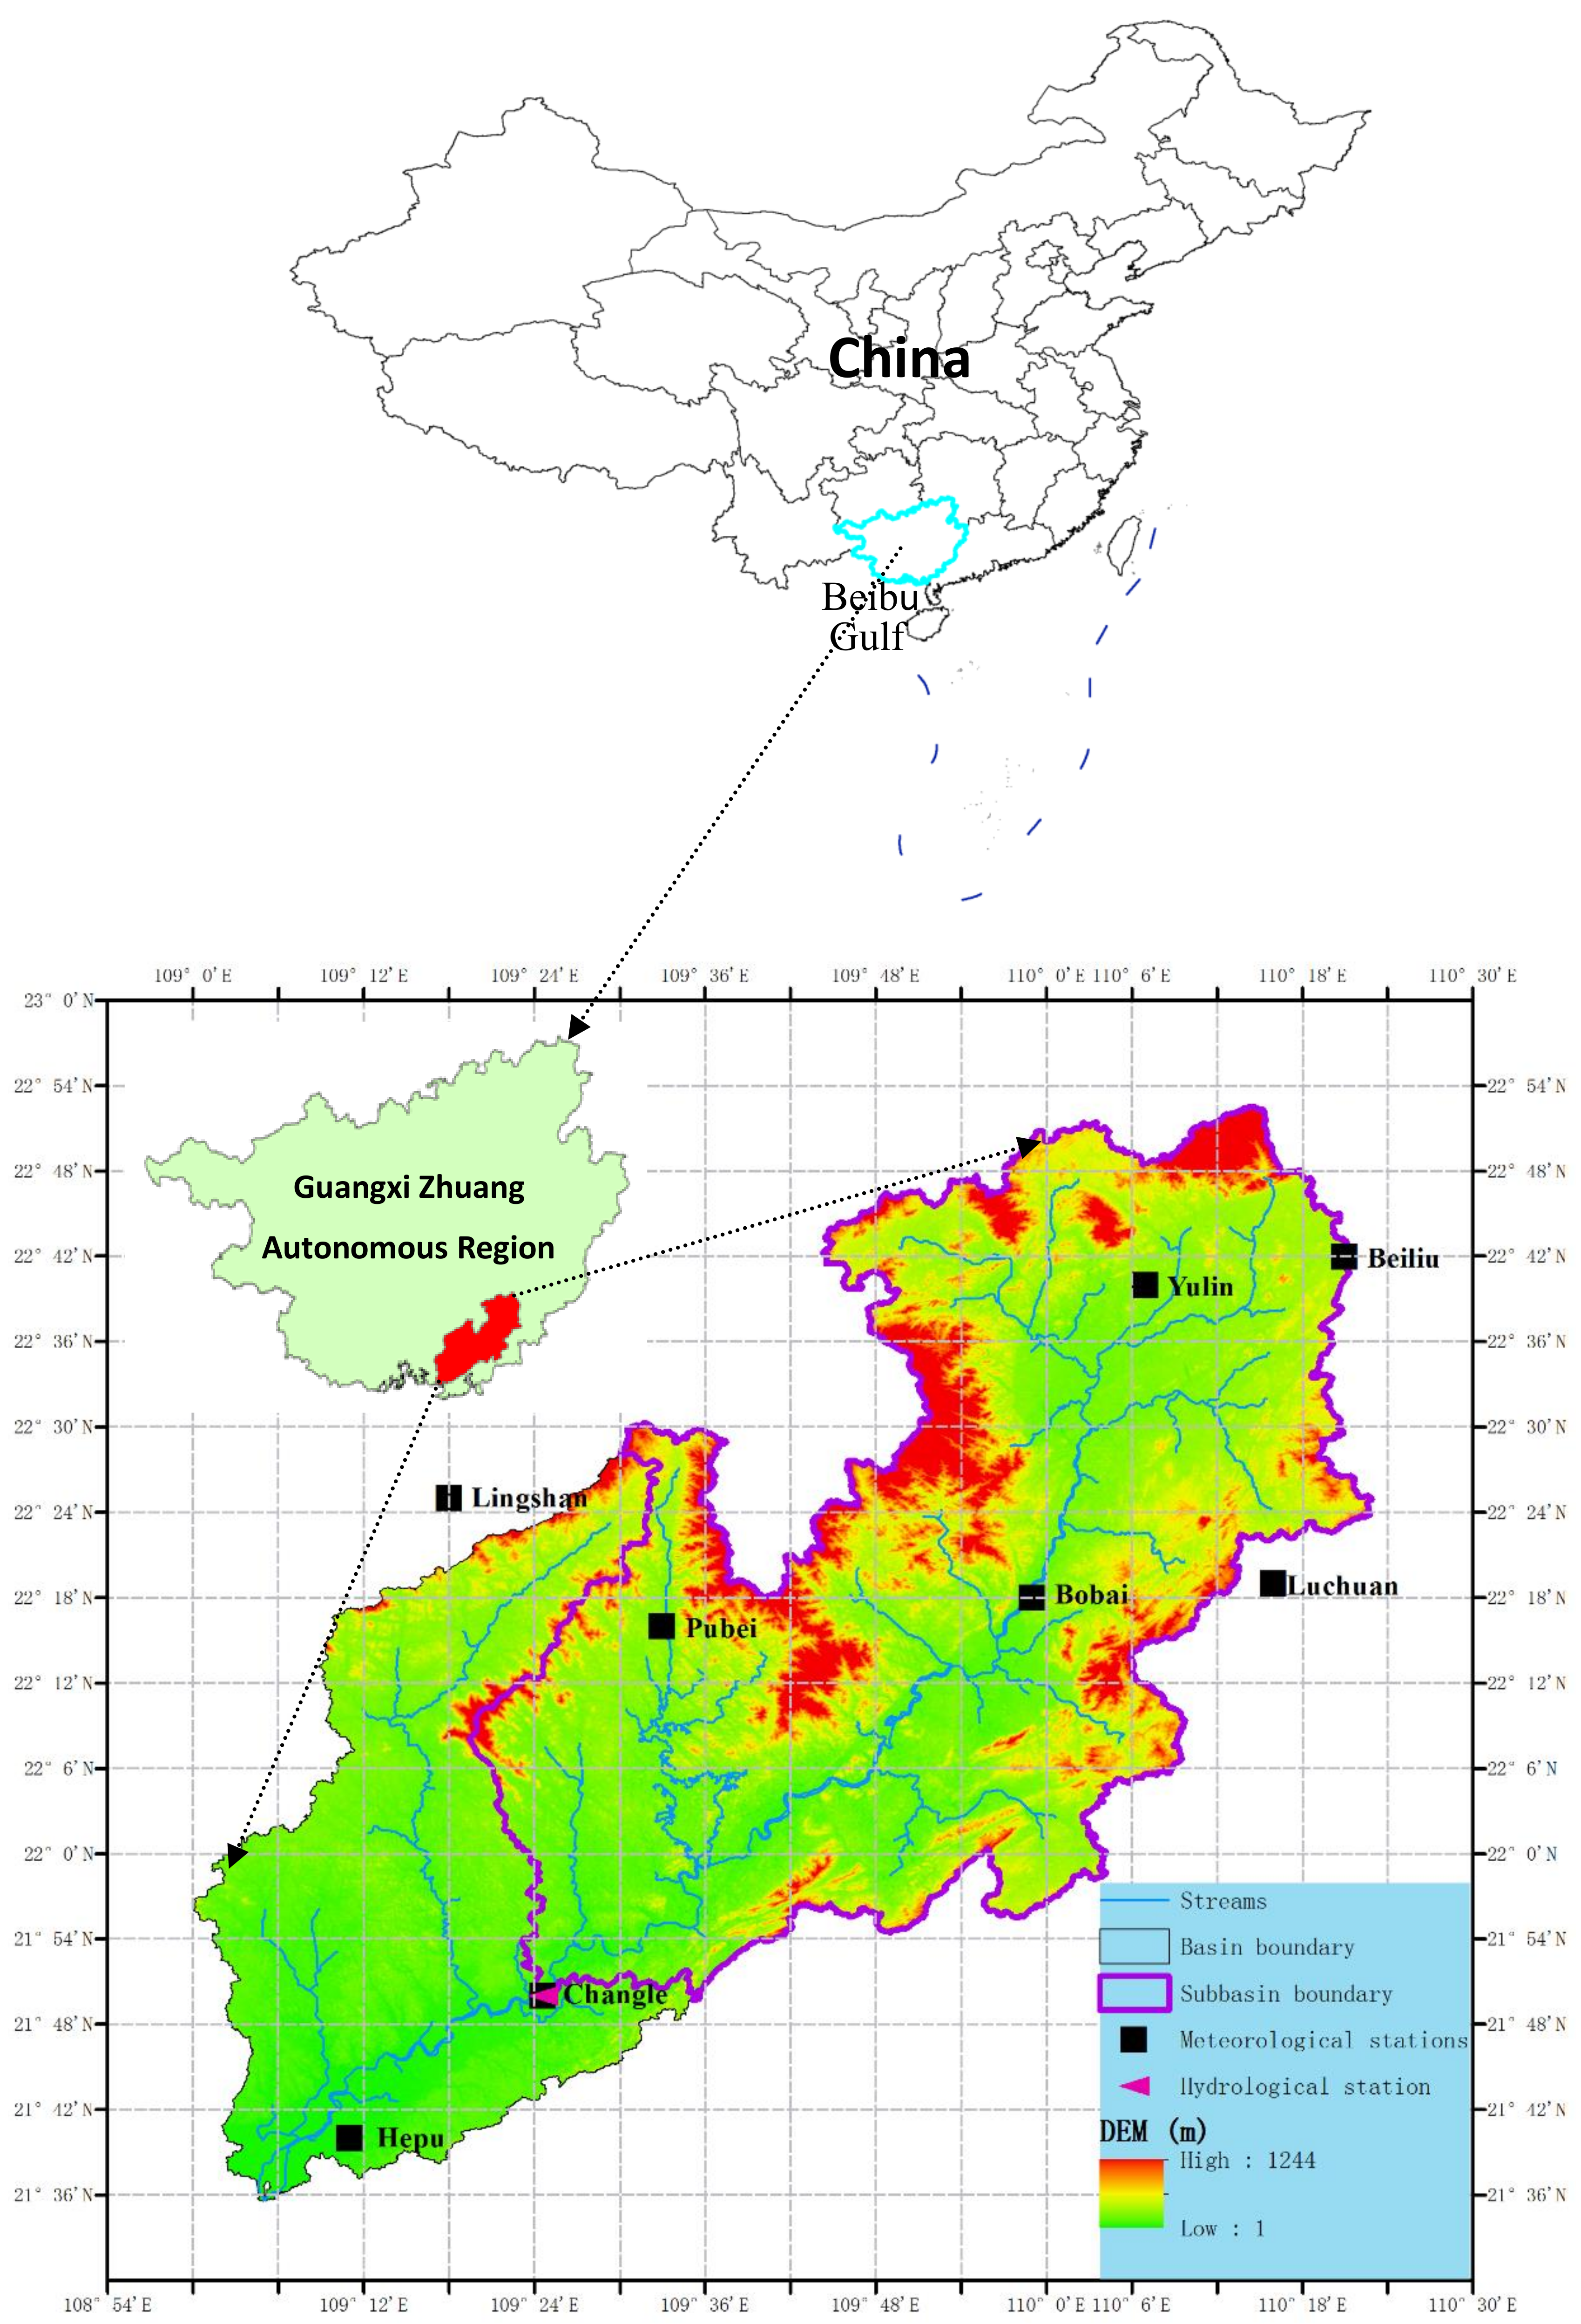
The Nanliu River originates from the Darong mountains, and flows into the Beibu Gulf (Figure 1). The river basin (between latitudes 20°38′–23°07′ north and longitudes 109°30′–110°53′ east) is located in the Guangxi Zhuang Autonomous Region, the northern coast of the Beibu Gulf, with a total drainage area of about 9700 km2, and a river length of 287 km. The drainage area, up the Changle hydrological station, is 6592 km2, with an annual discharge of 5.61 × 10⁹ m3. The basin elevation ranges from sea level to 1244 m, with an average of 620 m, and tends to decrease from the northeast towards the southwest. The Karst lithologic strata only account for 13.0% of the total drainage area, and the Karst landform is not obvious [35]. Soil types in this basin are silt loam and loam [36]. According to the Global Land Cover Classification Database [37], land cover is mainly composed of cropland, wooded grassland, and grassland covering 48.2%, 24.3%, and 22.6% of the basin area, respectively. The Nanliu River basin is influenced by a subtropical monsoon climate, with a rainy reason from May to October, and a dry season from the previous November to April. The mean annual rainfall in the Nanliu River catchment is between 1400 and 1760 mm, with average temperatures ranging from 21.5 °C to 22.4 °C [38].
3. Data and Method
3.1. Data
The GPM mission is specifically designed to unify and advance precipitation measurements from a constellation of research and operational microwave sensors [2]. Based on various algorithms, GPM provides three levels of products. The IMERG algorithm is designed to intercalibrate, merge, and interpolate precipitation estimates from microwave, microwave-calibrated infrared (IR), gauge analyses, and other precipitation estimators, at a fine time and space scale [39]. Since March 2014, the IMERG products have been released in two versions—real-time version (IMERG_Uncal) and post real-time research version (IMERG_Cal). In contrast with the IMERG_Uncal, IMERG_Cal is calibrated by Global Precipitation Climatology Centre (GPCC) monthly precipitation-gauge analyses [39]. In this study, we used the ‘Final’ run version 4 of both the IMERG_Cal and the IMERG_Uncal, with a spatial and temporal resolution of 0.1° × 0.1° and 30 min (https://pmm.nasa.gov/data-access/downloads/gpm). The 30 min satellite-based data were transformed from Universal Time Coordinated (UTC) to Local Standard Time (Beijing Time) and accumulated, on a daily scale.
Daily observational precipitation data were collected from Guangxi Meteorological Bureau, and there were six meteorological stations located in the basin and two in peripheral areas (Figure 1 and Table 1). The precipitation data from all eight stations have undergone quality control procedures to eliminate erroneous and homogenous assessment by the Guangxi Meteorological Bureau. Additional routines to identify potential outliers (e.g., daily precipitation values more than 999 mm or less than 0 mm) were manually checked. Daily streamflow data at the Changle hydrological station for 2014–2016 were collected and then used to calibrate the hydrological model.
3.2. Hydrological Model
The Xinanjiang model was used to evaluate the streamflow simulation capability of the satellite-based precipitation in the case basin. The Xinanjiang model is a conceptual watershed model and has been widely used in China since 1980 [40,41]. This model was developed on the basis of the concept that runoff is not generated until the soil moisture content of the aeration zone reaches the field capacity, and thereafter, runoff equals the rainfall excess without further loss [41]. Daily basin-average-precipitation and the measured pan evaporation were the model inputs, and streamflow at the basin outlet was the model output. There were fifteen model parameters, in all, and optimization of the parameters was achieved with different objective functions, according to the nature of each parameter [40,41]. Observed streamflow at the Changle hydrological station was used for model calibration.
3.3. Performance Indicators
Three statistical indices were used to assess the comparison between the precipitation from the satellite and the gauged precipitation data. They were Relative Bias (RB), Correlation Coefficient (CC), and the Root Mean Square Error (RMSE). In order to check the appearance possibility of rainfall events from satellite products, Probability of Detection (POD) and False Alarm Ratio (FAR) were calculated. POD gives the fraction of rain occurrences that were correctly detected, while FAR measures the fraction of false rain events. Nash–Sutcliffe efficiency (NSE) [42] was used to describe the consistency between the simulated streamflow from the hydrological model and the observed streamflow. The definitions of the indicators were as follows:
where n is the samples number, and denote the individual gauge and satellite-based precipitation, respectively; and denote the mean gauge and satellite-based precipitation, respectively; and denote the individually observed and simulated streamflow, respectively; and denotes the mean observed streamflow. H represents the observed gauge rain correctly detected by the satellite, M means not detected, and F means falsely detected.
4. Results
Figure 2 shows the spatial precipitation over the Nanliu River basin from the gauge and IMERG, from April 2014 to December 2016. The gauged precipitation data, collected from eight stations, exhibit a northeast to southwest gradient, and range from 4.8 to 6.2 mm/day (Figure 2a). IMERG_Cal showed similar spatial variations with the gauge data (Figure 2b), but it slightly overestimated gauge precipitation for the entire basin. For example, precipitation reached 7 mm/day from the IMERG_Cal, in the southwest (Figure 2b). IMERG_Uncal could roughly capture the spatial patterns of precipitation, with slight underestimation (Figure 2c).
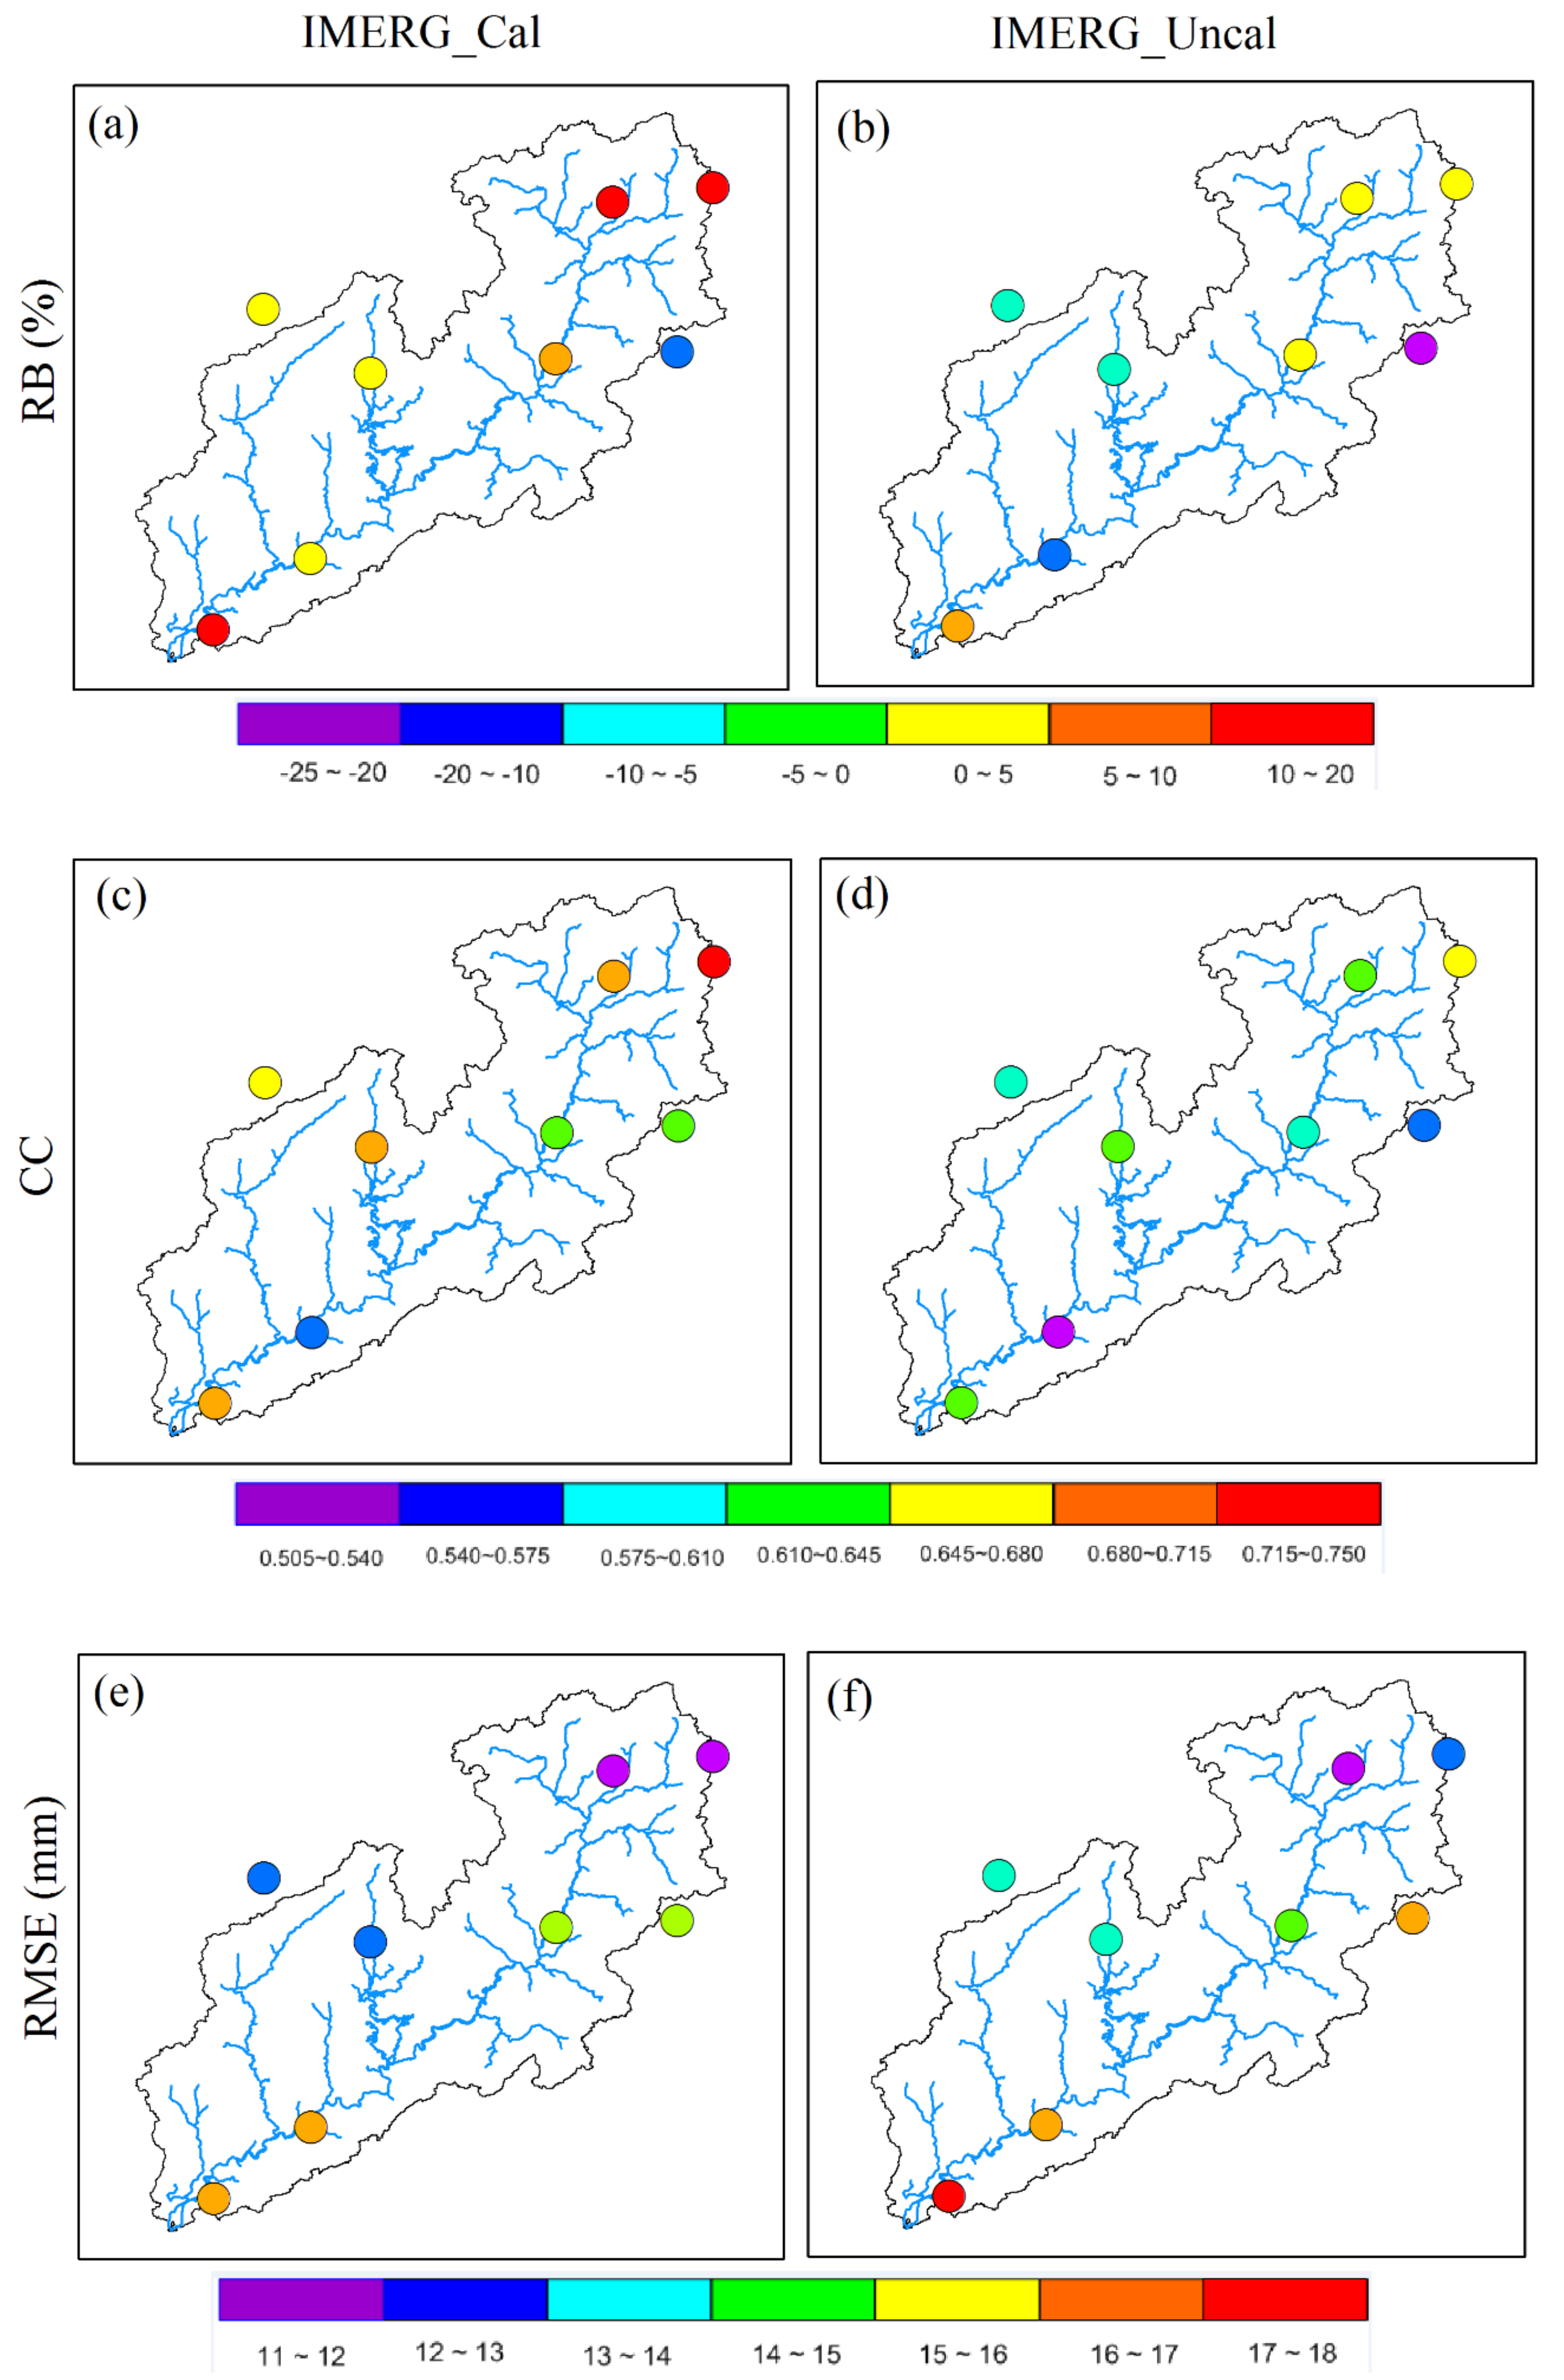
We also checked the specific location for each rain gauge station and corresponding satellite pixel, to ensure proper analysis at grid-cell scales. Figure 3 and Table 2 summarize the RB, CC, and the RMSE from the IMERG, against the gauge precipitation, during the study period, at pixel scales. The IMERG_Cal overestimated for the seven gauges out of the eight gauges; positive RB values prevailed in the entire basin, ranging from 1.1% to 18.9%, except for the Luchuan station located near the east boundary of the basin, with a negative RB of −11.4% (Figure 3a and Table 2). Overestimation and underestimation for the IMERG_Uncal were equal in the number of gauges, whereas, the amplitude of the negative RB (−23.3% to −7.3%) was much larger than that of the positive RB (0.8% to 5.9%) (Figure 3b). In general, negative RBs were detected midstream, whereas, the positive RBs were detected upstream. The CC values between the IMERG_Cal and the gauges, ranged between 0.557 and 0.744, on the daily scale. The agreement between the IMERG_Uncal and the gauge was slightly worse with CC values of 0.521 to 0.662. The IMERG_Cal and the IMERG_Uncal showed similar RMSE patterns in space, across the basin, with values ranging from 11.3 to 17.5 mm, at the grid-cell scales (Figure 3e,f and Table 2).
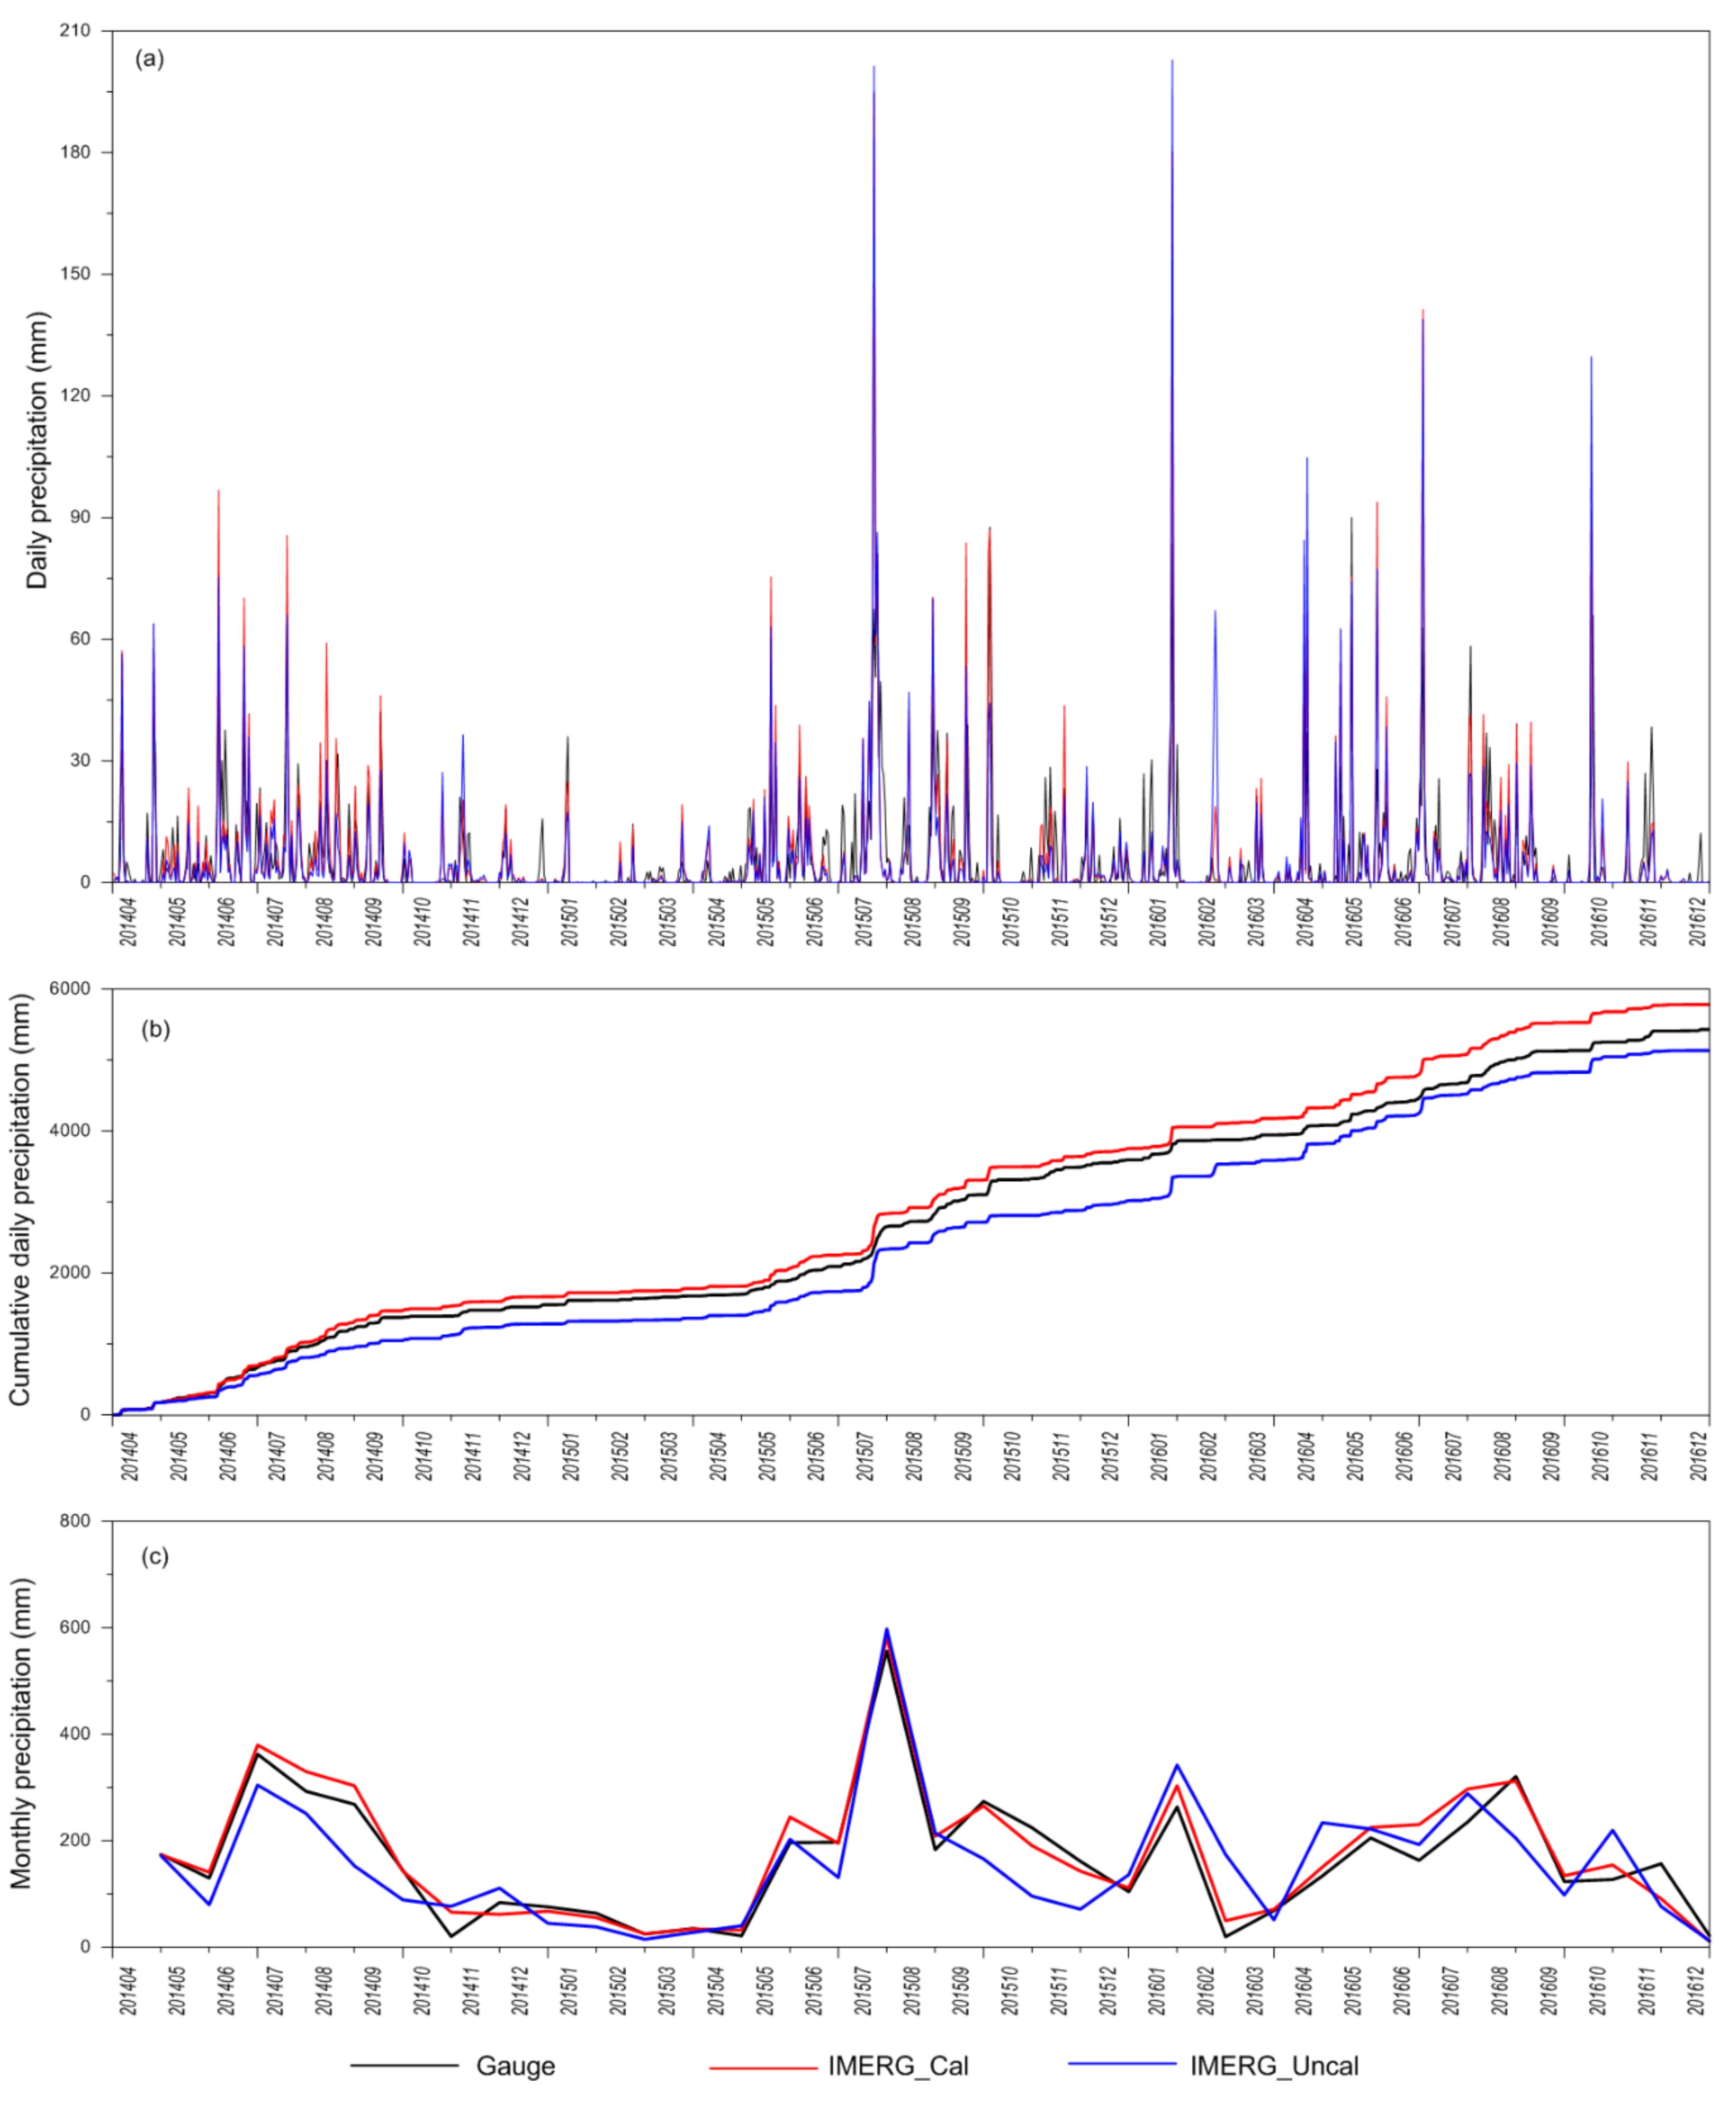
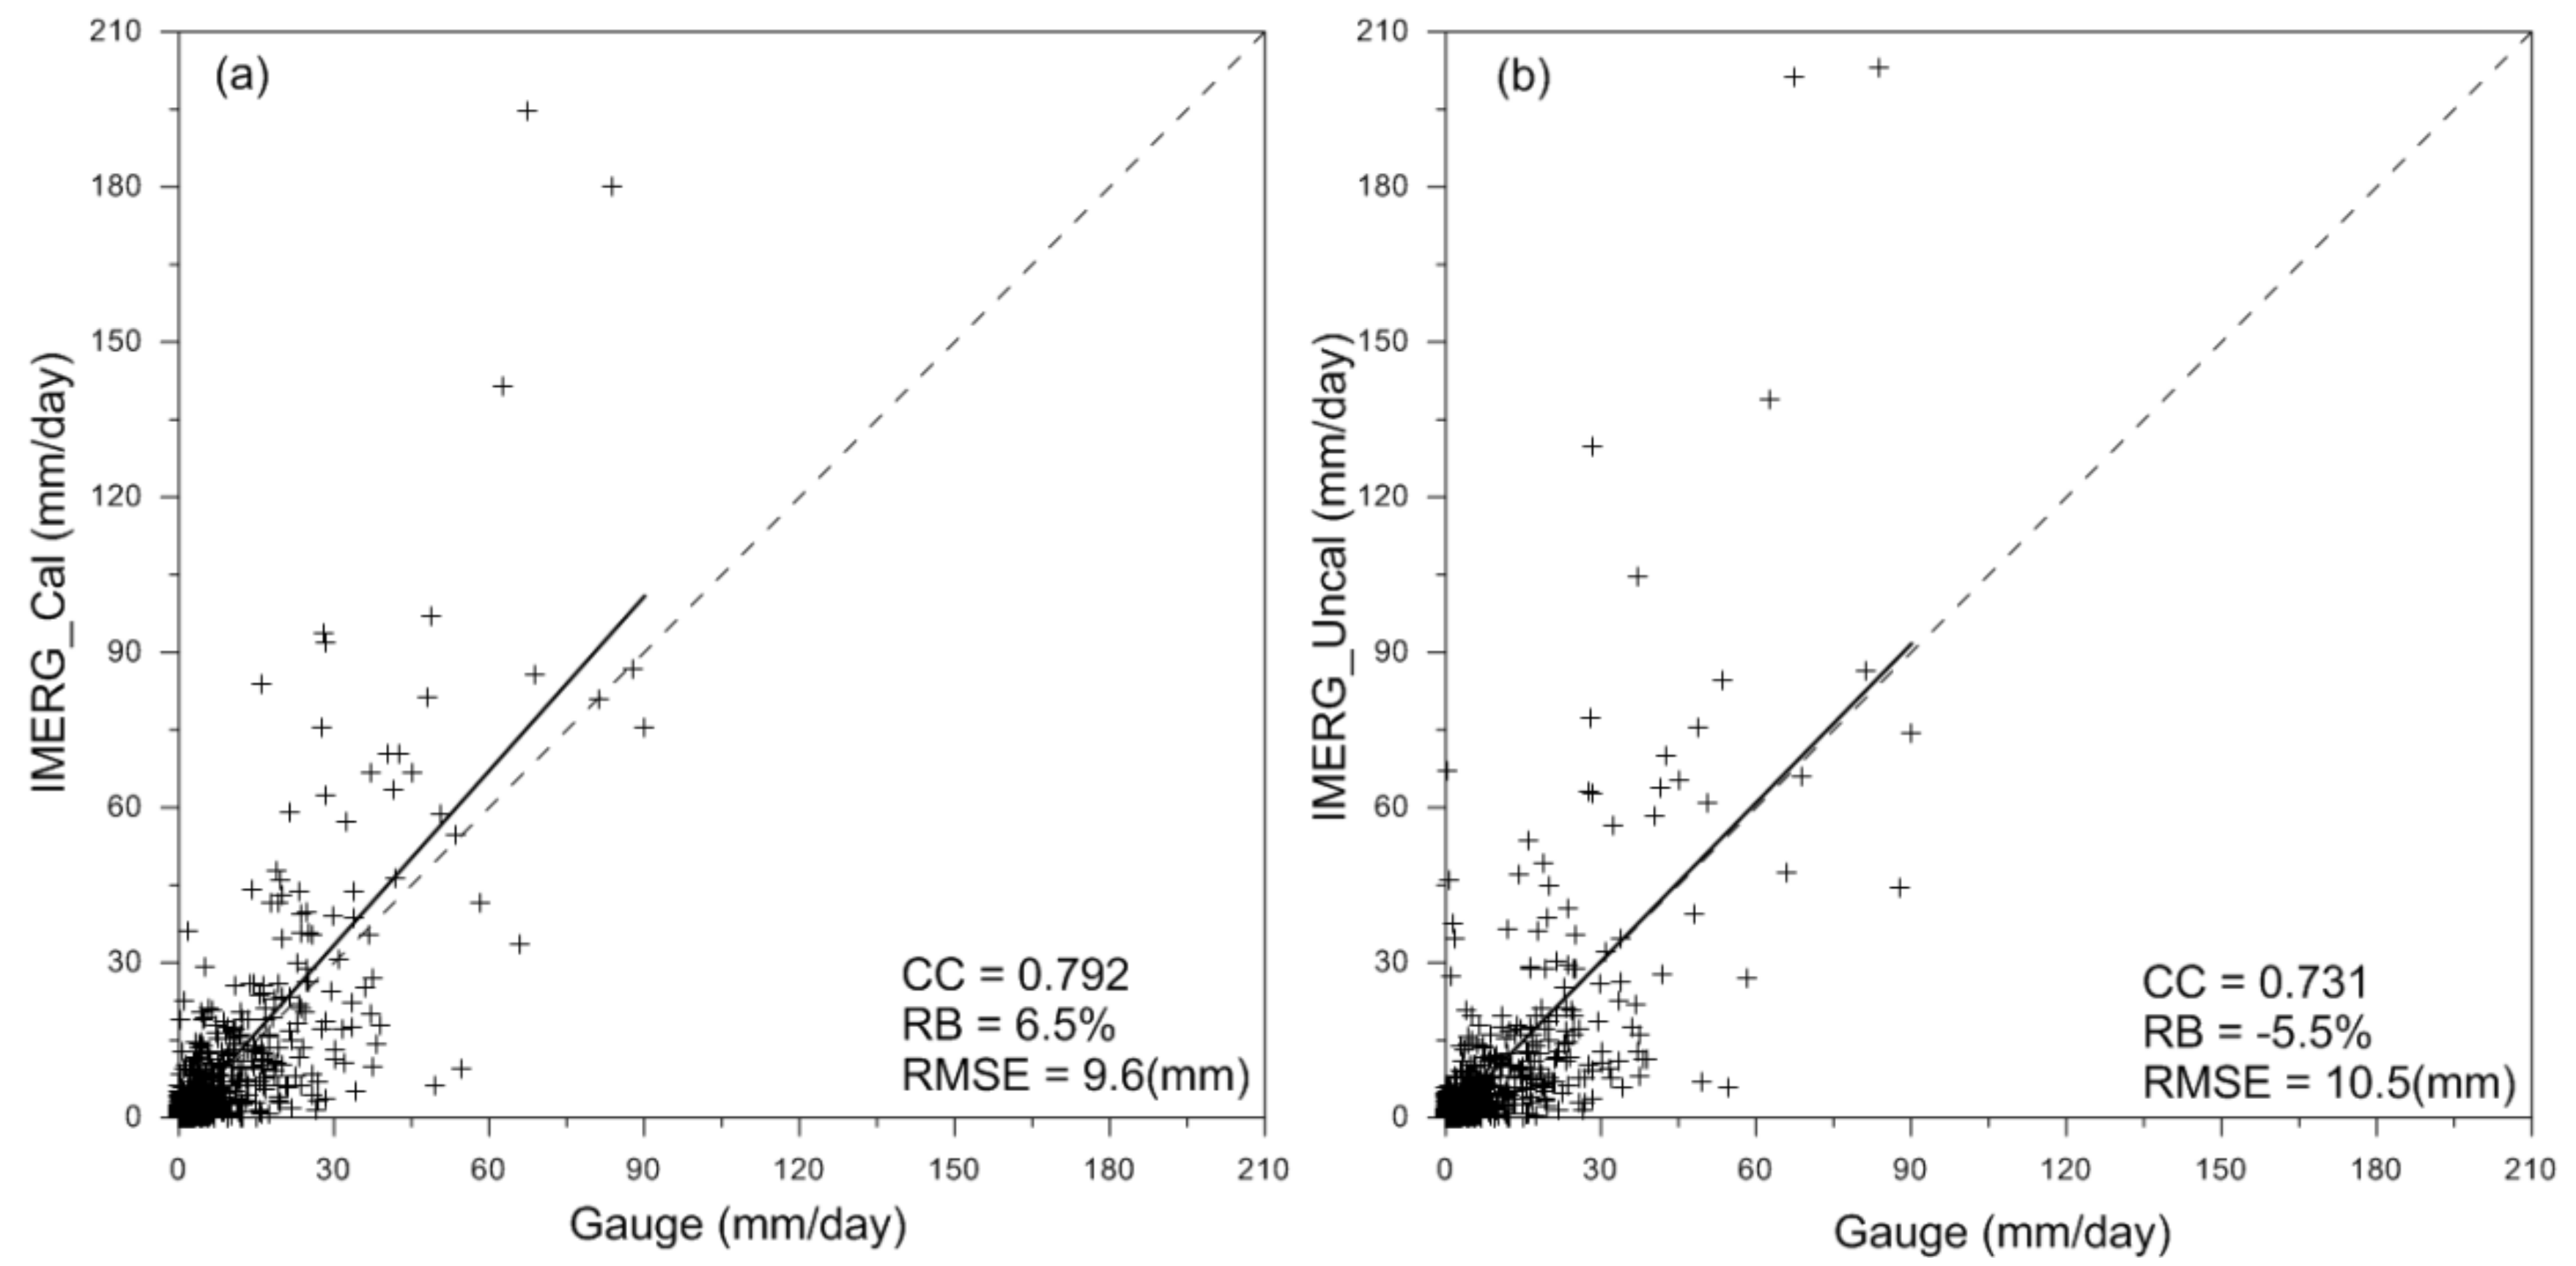
We obtained the basin precipitation time series from eight stations by the Thiessen polygon method [43]. The Thiessen polygon method has been commonly applied in hydrology to estimate areal averages of precipitation [44]. Figure 4 shows basin-average precipitation time series, at the daily and monthly scales, from the gauge and satellite estimates, from April 2014 to December 2016, over the Nanliu River basin. Both IMERG_Cal and IMERG_Uncal could follow the temporal variation patterns of the daily precipitation, during the study period (Figure 4a). In the scatter plots, both IMERG_Cal and IMERG_Uncal exhibited good correspondence with the gauge data, with CCs above 0.7 and RBs less than 10%, whereas, some dots lay on top of the 1:1 line (Figure 5). There were some considerable errors in heavy precipitation events, and the IMERG significantly overestimated the amounts of these extreme events. For example, it could be clearly seen in the figure, for the high-intensity rainfall events, like those on 24 July 2015 and 28 January 2016, with basin-average precipitation depths of 67.4 and 83.6 mm, respectively, while the IMERG_Cal and IMERG_Uncal estimates were 194.7/201.3 and 180.1/202.9 mm, respectively. A study conducted by He et al. [30] over the upper Mekong River basin also found that IMERG product significantly overestimated the amounts, in extreme events.
Figure 4b presents the cumulative gauge and satellite precipitation depths from April 2014 to December 2016. The total precipitation from the gauge was 5431.3 mm, for the study period. The variations of cumulative precipitation from the IMERG_Cal and the IMERG_Uncal were fairly close to that of the gauge, with totals of 5782.2 mm and 5133.5 mm (Figure 4b), and RBs of 6.5% and −5.5%, compared with the gauge, respectively (Figure 5a,b). The daily precipitation was accumulated to a monthly scale, and showed at the bottom panel of Figure 4 (Figure 4c). Overall, the IMERG_Cal followed the seasonal cycle of gauge precipitation very well. However, there were some differences between the two datasets in winter, e.g., in December 2014 and November 2015. Chen et al. [6] and Guo et al. [21] obtained a similar result, in that the IMERG product performed slightly poor in winter than at other seasons over China. The IMERG_Uncal showed a slightly worse performance than the IMERG_Cal, but still generally followed the variation patterns of gauge (Figure 4c).
Figure 6 shows the POD and FAR values of the IMERG_Cal and the IMERG_Uncal for daily precipitation thresholds, from April 2014 to December 2016, over the Nanliu River basin. Precipitation occurrences were best detected by the IMERG_Cal for thresholds of 0.1 mm (with POD scores of 0.851), while, with increasing precipitation thresholds, the skill dropped rapidly to as low as 0.600 at thresholds of 25 mm/day, and there was an inverse at the thresholds of 50 mm/day. There were very few precipitation events at the thresholds of 50 mm/day. For the IMERG_Cal, the observed gauge rain correctly detected by the satellite was nine times, and three times were not detected. The IMERG_Uncal, correctly detected eight times, and four times were not detected. And the POD values at the thresholds of 50 mm/day had randomness. The IMERG_Uncal showed lower POD scores than the IMERG_Cal, over all thresholds, with the highest POD scores of 0.848, at thresholds of 0.1 mm and the lowest of 0.527, at thresholds of 25 mm/day. IMERG_Cal and IMERG_Uncal had similar FAR performance at different thresholds. In contrast to the POD, the FAR raised rapidly, with increasing precipitation thresholds and reached the largest values of 0.606/0.619 for the two IMERG products, at thresholds of 50 mm/day, respectively. Generally, the two IMERG products showed a higher accuracy and lower error rate when detecting the light precipitation.
We further evaluated the utility of the IMERG products in streamflow simulation, over the Nanliu River basin (upstream of the Changle station, Figure 1), by driving the Xinanjiang hydrological model. The Xinanjiang model was first calibrated by comparing the observed and simulated streamflow, forced by gauge precipitation data, for the period of April 2014 to December 2015. Figure 7a shows observed and simulated streamflow, on the daily scale, for the calibration period, and the NSE and RB are also indicated in figure. When forced with gauge precipitation, the model output was able to follow the observed streamflow, well, in both magnitude and timing (NSE of 0.831 and RB of 1.7%, Figure 7a). The calibrated parameters are listed in Table 3.
Figure 7b shows the simulated streamflow from the calibrated Xinanjiang model, forced by gauge precipitation and satellite-based precipitation, for the period of January 2016–December 2016. The gauge-driven simulations for the validation period performed as well as that of the calibration period, with an NSE of 0.828 and an RB of −2.3%. The IMERG_Cal and the IMERG_Uncal performed worse than gauge precipitation in simulations. The model simulations forced by the IMERG tended to overestimate the peak flows, especially during January–February and early July, resulting in overall RBs of 15.2%/19.9% and negative NSEs of −0.782/−2.283, respectively. The errors in the IMERG-driven streamflow simulations could be mostly explained by the bias in the precipitation input. Due to the nonlinearities in the hydrological process, any positive/negative precipitation input bias could be transformed into a larger positive/negative bias in the simulated streamflow [45,46].
Studies conducted by Yilmaz et al. [33], Artan et al. [47], and Bitew et al. [48] showed that performance of the hydrological model could be considerably improved if the model was calibrated by a satellite-based precipitation. Therefore, we used the IMERG precipitation to calibrate the hydrological model, for the period of April 2014 to December 2015, by changing the model parameters. Figure 8a shows the observed and simulated streamflow driven by the IMERG_Cal, for the calibration period. Moderate simulation results were obtained (NSE of 0.648 and RB of −4.8%). Then, we used this new set of parameters (not shown) to simulate streamflow driven by the IMERG_Cal and the IMERG_Uncal precipitation, for the period of January 2016–December 2016 (Figure 8b). The IMERG_Cal got a moderate performance for the period of January 2016–December 2016, with an NSE of 0.529 and an RB of 9.0%. The IMERG_Uncal performed slightly worse, with an NSE of 0.280 and RB of 8.6%. The IMERG products exhibited an encouraging potential in the hydrological applications in these regions. Although, there were still some considerable differences between the observed and the simulated streamflow driven by the IMERG products, e.g., in the middle of January, the IMERG-driven simulation performed much better after the model was calibrated with satellite-based precipitation estimates.
5. Discussions
Adequate and high-quality precipitation estimates from spaceborne precipitation radars are necessary for a variety of applications in hydrology [49]. The GPM mission, as the upgraded successor of the TRMM, deployed the first spaceborne DPR. Zhao et al. [50] investigated the TRMM data over the Nanliu River basin, through statistical and hydrological validations, and the TRMM estimates performed well in terms of statistical precision and in streamflow simulation. This work is an extension of that of Zhao et al. [50] and focus on the GPM data—the successor of TRMM. The GPM Core Observatory sensors and new calibration algorithms were developed to improve the performance of GPM against the TRMM. Some studies have proven that GPM IMERG products are generally superior to TRMM, in different regions [6,29,34,51,52,53]. The results of this study showed that the IMERG_Cal and the IMERG_Uncal can roughly capture the spatial patterns of precipitation, with slight over/underestimations of RB of 6.5% and −5.5%, at the basin scale. At grid-cell scales, two IMERG products got an RB of −23.3% to 18.9%, CC of 0.521 to 0.744, and RMSE of 11.3 to 17.5 mm. Furthermore, there were some considerable errors in heavy precipitation events, and the IMERG significantly overestimated the amounts of these extreme events (Figure 4a and Figure 5). Compared with the performance of the TRMM, in this small basin conducted by Zhao et al. [50], the IMERG had no significant improvements, and this was different from the finding of previous studies that GPM IMERG products are generally superior to TRMM. Study in the Chindwin River basin in Myanmar found that the 3B42V7 dataset outperformed the IMERG, at both daily and monthly scales, and in heavy rain event detections, and this finding strengthened to further improve the GPM algorithms [54].
The Precipitation Radar (PR) carried on the TRMM satellite focused primarily on heavy to moderate rain [17]. The GPM sensors extend the measurement range attained by the TRMM to include light-intensity precipitation, and can detect snowfall and light precipitation more accurately than the TRMM sensors [2]. Gao et al. [49] investigated the similarities and improvements of the GPM DPR, upon the TRMM PR. Results showed that the DPR improved the detectability of the precipitation events, significantly, particularly for light precipitation, and the occurrences of light precipitation (rates < 1 mm/h), detected by GPM DPR was ~2.53 times more than that of the TRMM PR [49]. Hamada et al. [55] demonstrated the impact of the enhancement in detectability by the DPR on board the GPM, and the GPM DPR was found to be able to detect light precipitation. In this study, precipitation occurrences were best detected by the IMERG_Cal and the IMERG_Uncal, for thresholds of 0.1 mm (with POD scores of 0.851 and 0.848, respectively), and the skill dropped, rapidly, with increasing precipitation thresholds, to as low as 0.600 and 0.527, at thresholds of 25 mm, respectively (Figure 6). The FAR raised rapidly, with increasing precipitation thresholds, and reached the largest values of 0.606 and 0.619, for the two IMERG products at thresholds of 50 mm, respectively (Figure 6). Generally, the two IMERG products showed a higher accuracy and lower error rate, when detecting the light precipitation, and this might have been due to the DPR carried on the GPM satellite.
There were some limitations and uncertainties on the data in this study. We used gauge observations from eight meteorological stations (Figure 1) to evaluate the performance of both real-time version (IMERG_Uncal) and post real-time research version (IMERG_Cal) products, in the Nanliu River basin. In contrast to the IMERG_Uncal, the IMERG_Cal did not show obvious improvements, after being calibrated by the GPCC monthly precipitation-gauge analyses. GPCC collected data from nearly two hundred stations in China, and only eight in the Guangxi Zhuang Autonomous Region. However, all eight stations collected by the GPCC, in Guangxi, are located outside the Nanliu River basin. Limitations and uncertainties in the reference data might have arose from inadequate spatial representation and the low-density of the gauge observations. In addition, the results showed that streamflow simulations by the IMERG products could roughly capture the observed hydrograph when the model was calibrated with satellite data (Figure 8b), however, extension work should perform evaluations at a sub-daily scale; the use of sub-daily rainfall data can be potentially useful for hydrological simulation in this region, where short-duration convective rainfall episodes are more relevant for hydrological variability.
6. Conclusions
In this study, we investigated the performance of two GPM precipitation products against gauge observations, over the Nanliu River basin from April 2014 to December 2016, and evaluated their capability for streamflow simulation, based on the Xinanjiang model. The main findings are summarized as follows.
The IMERG_Cal and the IMERG_Uncal could roughly capture the spatial patterns of precipitation with slight over/underestimation with an RB of 6.5% and −5.5%, at a basin scale. Compared with gauge precipitation in the grid cell scales, the two IMERG products got an RB of −23.3% to 18.9%, CC of 0.521 to 0.744, and an RMSE of 11.3 to 17.5 mm. There were some considerable errors in the heavy precipitation events, and the IMERG significantly overestimated the amounts of these extreme events.
Precipitation occurrences were best detected by the IMERG_Cal and the IMERG_Uncal for thresholds of 0.1 mm, and the skill dropped rapidly with increasing precipitation thresholds. The FAR raised rapidly with increasing precipitation thresholds. The two IMERG products showed a higher accuracy and a lower error rate, when detecting light precipitation.
The IMERG-driven simulation had a better quality when the model was calibrated with satellite data, rather than rain gauge data. This analysis implied that the IMERG products have a potential for hydrological applications, in this region.
Author Contributions
All authors contributed significantly to this work. K.T. and Y.Z. designed the framework of this study. K.T. analyzed the data and prepared the draft of the manuscript. Y.W. revised the paper. B.H. and Y.L. conceived of this study and gave comments.
Funding
This work was supported by the project “Specially Employed Expert” of the Guangxi Zhuang Autonomous Region (2017B17), the Guangxi Special Fund for Innovation Team Construction (2016JJF15001), the Opening fund of Key Laboratory of Environment Change and Resources Use in the Beibu Gulf Ministry of Education (Guangxi Teachers Education University), the Guangxi Key Laboratory of Earth Surface Processes and Intelligent Simulation (Guangxi Teachers Education University) (NO. GTEU-KLOP-X1703), and the National Natural Science Foundation of China (41701075, 41461021).
Acknowledgments
The authors would like to thank the Guangxi Meteorological Bureau for providing the observed precipitation data and the Guangxi Hydrological Bureau for providing the observed streamflow data and evaporation data.
Conflicts of Interest
The authors declare no conflict of interest.
References
- Kidd, C.; Huffman, G. Global precipitation measurement. Meteorol. Appl. 2011, 18, 334–353. [Google Scholar] [CrossRef] [Green Version]
- Hou, A.; Kakar, R.; Neeck, S.; Azarbarzin, A.; Kummerow, C.; Kojima, M.; Oki, R.; Nakamura, K.; Iguchi, T. The Global Precipitation Measurement Mission. Bull. Am. Meteorol. Soc. 2014, 95, 701–722. [Google Scholar] [CrossRef] [Green Version]
- Rodríguez-Iturbe, I.; Mejía, J.M. The design of rainfall networks in time and space. Water Resour. Res. 1974, 10, 713–728. [Google Scholar] [CrossRef]
- Krajewski, W.F.; Ciach, G.J.; Habib, E. An analysis of small-scale rainfall variability in different climatic regimes. Hydrol. Sci. J. 2003, 48, 151–162. [Google Scholar] [CrossRef] [Green Version]
- Gebremichael, M.; Krajewski, W.F. Assessment of the Statistical Characterization of Small-Scale Rainfall Variability from Radar: Analysis of TRMM Ground Validation Datasets. J. Appl. Meteorol. 2004, 43, 1180–1199. [Google Scholar] [CrossRef]
- Chen, F.; Li, X. Evaluation of IMERG and TRMM 3B43 Monthly Precipitation Products over Mainland China. Remote Sens. 2016, 8, 472. [Google Scholar] [CrossRef]
- Dinku, T.; Ceccato, P.; Cressman, K.; Connor, S.J. Evaluating Detection Skills of Satellite Rainfall Estimates over Desert Locust Recession Regions. J. Appl. Meteorol. Climatol. 2010, 49, 1322–1332. [Google Scholar] [CrossRef]
- Zulkafli, Z.; Buytaert, W.; Onof, C.; Manz, B.; Tarnavsky, E.; Lavado, W.; Guyot, J. A Comparative Performance Analysis of TRMM 3B42 (TMPA) Versions 6 and 7 for Hydrological Applications over Andean–Amazon River Basins. J. Hydrometeorol. 2014, 15, 581–592. [Google Scholar] [CrossRef]
- Tong, K.; Su, F.; Yang, D.; Hao, Z. Evaluation of satellite precipitation retrievals and their potential utilities in hydrologic modeling over the Tibetan Plateau. J. Hydrol. 2014, 519, 423–437. [Google Scholar] [CrossRef]
- Mishra, V. Climatic uncertainty in Himalayan water towers. J. Geophys. Res. Atmos. 2015, 120, 2689–2705. [Google Scholar] [CrossRef] [Green Version]
- Sorooshian, S.; Hsu, K.-L.; Gao, X.; Gupta, H.V.; Imam, B.; Braithwaite, D. Evaluation of PERSIANN system satellite-based estimates of tropical rainfall. Bull. Am. Meteorol. Soc. 2000, 81, 2035–2046. [Google Scholar] [CrossRef]
- Adler, R.F.; Huffman, G.J.; Chang, A.; Ferraro, R.; Xie, P.; Janowiak, J.; Rudolf, B.; Schneider, U.; Curtis, S.; Bolvin, D.; et al. The version-2 global precipitation climatology project (GPCP) monthly precipitation analysis (1979-present). J. Hydrometeorol. 2003, 4, 1147–1167. [Google Scholar] [CrossRef]
- Joyce, R.J.; Janowiak, J.E.; Arkin, P.A.; Xie, P. CMORPH: A method that produces global precipitation estimates from passive microwave and infrared data at high spatial and temporal resolution. J. Hydrometeorol. 2004, 5, 487–503. [Google Scholar] [CrossRef]
- Huffman, G.J.; Adler, R.F.; Morrissey, M.M.; Bolvin, D.T.; Curtis, S.; Joyce, R.; Mcgavock, B.; Susskind, J. Global precipitation at one-degree daily resolution from multisatellite observations. J. Hydrometeorol. 2001, 2, 36–50. [Google Scholar] [CrossRef]
- Huffman, G.J.; Adler, R.F.; Bolvin, D.T.; Gu, G.; Nelkin, E.G.; Bowman, K.P.; Hong, Y.; Stocker, E.F.; Wolff, D.B. The TRMM multisatellite precipitation analysis (TMPA): Quasi-global, multiyear, combined-sensor precipitation estimates at fine scales. J. Hydrometeorol. 2007, 8, 38–55. [Google Scholar] [CrossRef]
- Simpson, J.; Kummerow, C.; Tao, W.-K.; Adler, R.F. On the Tropical Rainfall Measuring Mission (TRMM). Meteorol. Atmos. Phys. 1996, 60, 19–36. [Google Scholar] [CrossRef] [Green Version]
- Kummerow, C.; Barnes, W.; Kozu, T.; Shiue, J.; Simpson, J. The Tropical Rainfall Measuring Mission (TRMM) sensor package. J. Atmos. Ocean. Technol. 1998, 15, 809–817. [Google Scholar] [CrossRef]
- Kummerow, C.; Simpson, J.; Thiele, O.; Barnes, W.; Chang, A.T.C.; Stocker, E.; Adler, R.F.; Hou, A.; Kakar, R.; Wentz, F.; et al. The status of the Tropical Rainfall Measuring Mission (TRMM) after two years in orbit. J. Appl. Meteorol. 2000, 39, 1965–1982. [Google Scholar] [CrossRef]
- NASA Rainfall Satellite Out of Fuel, but Continues to Provide Data. Available online: https://pmm.nasa.gov/articles/trmm-out-fuel-continues-provide-data (accessed on 3 December 2018).
- Huffman, G.J.; Bolvin, D.T.; Nelkin, E.J. Integrated Multi-satellitE Retrievals for GPM (IMERG) Technical Documentation; NASA/GSFC: Greenbelt, MD, USA, 2014. [Google Scholar]
- Guo, H.; Chen, S.; Bao, A.; Behrangi, A.; Hong, Y.; Ndayisaba, F.; Hu, J.; Stepanian, P.M. Early assessment of Integrated Multi-satellite Retrievals for Global Precipitation Measurement over China. Atmos. Res. 2016, 121–133. [Google Scholar] [CrossRef]
- Liu, Z. Comparison of Integrated Multisatellite Retrievals for GPM (IMERG) and TRMM Multisatellite Precipitation Analysis (TMPA) Monthly Precipitation Products: Initial Results. J. Hydrometeorol. 2016, 17, 777–790. [Google Scholar] [CrossRef]
- Ma, Y.; Tang, G.; Long, D.; Yong, B.; Zhong, L.; Wan, W.; Hong, Y. Similarity and Error Intercomparison of the GPM and Its Predecessor-TRMM Multisatellite Precipitation Analysis Using the Best Available Hourly Gauge Network over the Tibetan Plateau. Remote Sens. 2016, 8, 569. [Google Scholar] [CrossRef]
- Sahlu, D.; Nikolopoulos, E.; Moges, S.A.; Anagnostou, E.N.; Hailu, D. First Evaluation of the Day-1 IMERG over the Upper Blue Nile Basin. J. Hydrometeorol. 2016, 17, 2875–2882. [Google Scholar] [CrossRef]
- Tang, G.; Ma, Y.; Long, D.; Zhang, L.; Hong, Y. Evaluation of GPM Day-1 IMERG and TMPA Version-7 legacy products over Mainland China at multiple spatiotemporal scales. J. Hydrol. 2016, 533, 152–167. [Google Scholar] [CrossRef]
- Asong, Z.E.; Razavi, S.; Wheater, H.S.; Wong, J.S. Evaluation of Integrated Multisatellite Retrievals for GPM (IMERG) over Southern Canada against Ground Precipitation Observations: A Preliminary Assessment. J. Hydrometeorol. 2017, 18, 1033–1050. [Google Scholar] [CrossRef]
- Sungmin, O.; Foelsche, U.; Kirchengast, G.; Fuchsberger, J.; Tan, J.; Petersen, W.A. Evaluation of GPM IMERG Early, Late, and Final rainfall estimates using WegenerNet gauge data in southeastern Austria. Hydrol. Earth Syst. Sci. 2017, 21, 6559–6572. [Google Scholar] [CrossRef] [Green Version]
- Wang, Z.; Zhong, R.; Lai, C.; Chen, J. Evaluation of the GPM IMERG satellite-based precipitation products and the hydrological utility. Atmos. Res. 2017, 196, 151–163. [Google Scholar] [CrossRef]
- Tang, G.; Zeng, Z.; Long, D.; Guo, X.; Yong, B.; Zhang, W.; Hong, Y. Statistical and Hydrological Comparisons between TRMM and GPM Level-3 Products over a Midlatitude Basin: Is Day-1 IMERG a Good Successor for TMPA 3B42V7? J. Hydrometeorol. 2016, 17, 121–137. [Google Scholar] [CrossRef]
- He, Z.; Yang, L.; Tian, F.; Ni, G.; Hou, A.; Lu, H. Intercomparisons of Rainfall Estimates from TRMM and GPM Multisatellite Products over the Upper Mekong River Basin. J. Hydrometeorol. 2017, 413–430. [Google Scholar] [CrossRef]
- Sharif, H.O.; Al-Zahrani, M.; El Hassan, A. Physically, Fully-Distributed Hydrologic Simulations Driven by GPM Satellite Rainfall over an Urbanizing Arid Catchment in Saudi Arabia. Water 2017, 9, 163. [Google Scholar] [CrossRef]
- Zubieta, R.; Getirana, A.; Espinoza, J.C.; Lavado-Casimiro, W.; Aragon, L. Hydrological modeling of the Peruvian–Ecuadorian Amazon Basin using GPM-IMERG satellite-based precipitation dataset. Hydrol. Earth Syst. Sci. 2017, 21, 3543–3555. [Google Scholar] [CrossRef] [Green Version]
- Yilmaz, K.K.; Hogue, T.S.; Hsu, K.-L.; Sorooshian, S. Intercomparison of rain gauge, radar, and satellite-based precipitation estimates with emphasis on hydrologic forecasting. J. Hydrometeorol. 2005, 6, 497–517. [Google Scholar] [CrossRef]
- Tan, J.; Petersen, W.A.; Kirstetter, P.E.; Tian, Y. Performance of IMERG as a Function of Spatiotemporal Scale. J. Hydrometeorol. 2017, 18, 307–319. [Google Scholar] [CrossRef] [PubMed]
- Che, L.; Hu, B.; Li, Y. Spatial and Temporal Variations of Vegetation Cover Degrees in the Nanliujiang River Watershed from 1991 to 2009. J. Guangxi Teach. Educ. Univ. 2012, 29, 52–59. (In Chinese) [Google Scholar]
- Nachtergaele, F.; Velthuizen, H.V.; Verelst, L. Harmonized World Soil Database; Food and Agriculture Organization of the United Nations: Rome, Italy, 2008. [Google Scholar]
- Hansen, M.C.; Defries, R.S.; Townshend, J.R.G.; Sohlberg, R. Global land cover classification at 1 km spatial resolution using a classification tree approach. Int. J. Remote Sens. 2000, 21, 1331–1364. [Google Scholar] [CrossRef] [Green Version]
- Li, S.; Dai, Z.; Mei, X.; Huang, H.; Wei, W.; Gao, J. Dramatic variations in water discharge and sediment load from Nanliu River (China) to the Beibu Gulf during 1960–2013. Quat. Int. 2017, 440, 12–23. [Google Scholar] [CrossRef]
- Huffman, G.; Bolvin, D.; Braithwaite, D.; Hsu, K.; Joyce, R.; Kidd, C.; Nelkin, J.; Xie, P. NASA Global Precipitation Measurement (GPM) Integrated Multi-SatelliE Retrievals for GPM (IMERG); Algorithm Theoretical Basis Document, Version 4.5; NASA: Greenbelt, MD, USA, 2015. [Google Scholar]
- Zhao, R.; Wang, P. Parameter analysis for Xinanjiang model. J. China Hydrol. 1988, 6, 2–9. (In Chinese) [Google Scholar]
- Zhao, R. The Xinanjiang model applied in China. J. Hydrol. 1992, 135, 371–381. [Google Scholar] [CrossRef]
- Nash, J.; Sutcliffe, J. River flow forecasting through conceptual models part I: A discussion of principles. J. Hydrol. 1970, 10, 282–290. [Google Scholar] [CrossRef]
- Thiessen, A.H. Precipitation Averages for Large Areas. Mon. Weather Rev. 1911, 39, 1082–1084. [Google Scholar] [CrossRef]
- Tabios, G.Q.; Salas, J.D. A comparative analysis of techniques for spatial interpolation of precipitation. J. Am. Water Resour. Assoc. 1985, 21, 365–380. [Google Scholar] [CrossRef]
- Nijssen, B.; Lettenmaier, D.P. Effect of precipitation sampling error on simulated hydrological fluxes and states: Anticipating the Global Precipitation Measurement satellites. J. Geophys. Res. 2004, 109, D02103. [Google Scholar] [CrossRef]
- Su, F.; Hong, Y.; Lettenmaier, D.P. Evaluation of TRMM Multisatellite Precipitation Analysis (TMPA) and its utility in hydrologic prediction in the La Plata Basin. J. Hydrometeorol. 2008, 9, 622–640. [Google Scholar] [CrossRef]
- Artan, G.; Gadain, H.; Smith, J.L.; Bandaragoda, C.J.; Verdin, J.P. Adequacy of satellite derived rainfall data for stream flow modeling. Nat. Hazards 2007, 43, 167–185. [Google Scholar] [CrossRef]
- Bitew, M.M.; Gebremichael, M.; Ghebremichael, L.T.; Bayissa, Y.A. Evaluation of high-resolution satellite rainfall products through streamflow simulation in a hydrological modeling of a small mountainous watershed in Ethiopia. J. Hydrometeorol. 2012, 13, 338–350. [Google Scholar] [CrossRef]
- Gao, J.; Tang, G.; Hong, Y. Dual-Frequency Precipitation Radar (DPR) upon TRMM Precipitation Radar (PR) in global precipitation rate estimation, type classification and vertical profiling. Remote Sens. 2017, 9, 1142. [Google Scholar] [CrossRef]
- Zhao, Y.; Xie, Q.; Lu, Y.; Hu, B. Hydrologic Evaluation of TRMM Multisatellite Precipitation Analysis for Nanliu River Basin in Humid Southwestern China. Sci. Rep. 2017, 7, 2470. [Google Scholar] [CrossRef]
- Jin, X.; Shao, H.; Zhang, C.; Yan, Y. The Applicability Evaluation of Three Satellite Products in Tianshan Mountains. J. Nat. Resour. 2016, 31, 2074–2085, (In Chinese with English Abstract). [Google Scholar]
- Kim, K.; Park, J.; Baik, J.; Choi, M. Evaluation of topographical and seasonal feature using GPM IMERG and TRMM 3B42 over Far-East Asia. Atmos. Res. 2007, 187, 95–105. [Google Scholar] [CrossRef]
- Manz, B.; Páez-Bimos, S.; Horna, N.; Buytaert, W.; Ochoa-Tocachi, B.; Lavado-Casimiro, W.; Willems, B. Comparative Ground Validation of IMERG and TMPA at Variable Spatiotemporal Scales in the Tropical Andes. J. Hydrometeorol. 2017, 18, 2469–2489. [Google Scholar] [CrossRef] [Green Version]
- Yuan, F.; Zhang, L.; Win, K.W.W.; Ren, L.; Zhao, C.; Zhu, Y.; Jiang, S.; Liu, Y. Assessment of GPM and TRMM Multi-Satellite Precipitation Products in Streamflow Simulations in a Data-Sparse Mountainous Watershed in Myanmar. Remote Sens. 2017, 9, 302. [Google Scholar] [CrossRef]
- Hamada, A.; Takayabu, Y. Improvements in Detection of Light Precipitation with the Global Precipitation Measurement Dual-Frequency Precipitation Radar (GPM DPR). J. Atmos. Ocean. Technol. 2016, 33, 653–667. [Google Scholar] [CrossRef]
Figure 1.
Location and topography of the Nanliu River basin.

Figure 2.
Spatial precipitation over the Nanliu River basin from the gauges and the IMERG, from April 2014 to December 2016 (mm/day).
Figure 2.
Spatial precipitation over the Nanliu River basin from the gauges and the IMERG, from April 2014 to December 2016 (mm/day).

Figure 3.
RB (a,b), CC (c,d), and RMSE (e,f) from IMERG, against gauge precipitation, from April 2014 to December 2016.
Figure 3.
RB (a,b), CC (c,d), and RMSE (e,f) from IMERG, against gauge precipitation, from April 2014 to December 2016.

Figure 4.
Time series of the basin-average daily precipitation (a), cumulative precipitation depths (b), and monthly precipitation (c), over the Nanliu River basin from gauges and the IMERG, from April 2014 to December 2016.
Figure 4.
Time series of the basin-average daily precipitation (a), cumulative precipitation depths (b), and monthly precipitation (c), over the Nanliu River basin from gauges and the IMERG, from April 2014 to December 2016.

Figure 5.
Scatter plots of daily basin-average precipitation between gauges and the IMERG (IMERG_Cal (a) and IMERG_Uncal (b)) over the Nanliu River basin, from April 2014 to December 2016.
Figure 5.
Scatter plots of daily basin-average precipitation between gauges and the IMERG (IMERG_Cal (a) and IMERG_Uncal (b)) over the Nanliu River basin, from April 2014 to December 2016.

Figure 6.
POD (a) and FAR (b) of the IMERG_Cal and the IMERG_Uncal for daily precipitation thresholds, from April 2014 to December 2016 over the Nanliu River basin.
Figure 6.
POD (a) and FAR (b) of the IMERG_Cal and the IMERG_Uncal for daily precipitation thresholds, from April 2014 to December 2016 over the Nanliu River basin.

Figure 7.
Daily streamflow simulation of the Nanliu River basin (upstream of the Changle station), for calibration and validation.
Figure 7.
Daily streamflow simulation of the Nanliu River basin (upstream of the Changle station), for calibration and validation.

Figure 8.
Same as Figure 7 but the model was calibrated by the IMERG precipitation.
Figure 8.
Same as Figure 7 but the model was calibrated by the IMERG precipitation.


Table 1.
List of the eight stations over the Nanliu River basin, including the station number, station name, latitude, longitude, and elevation (a.s.l.). * Changle is a hydrological station with precipitation measurement.
Table 1.
List of the eight stations over the Nanliu River basin, including the station number, station name, latitude, longitude, and elevation (a.s.l.). * Changle is a hydrological station with precipitation measurement.
| Station Number | Station Name | Latitude (N) | Longitude (E) | Elevation (m) |
|---|---|---|---|---|
| 59,446 | Lingshan | 22°25′ | 109°18′ | 67 |
| 59,448 | Pubei | 22°16′ | 109°33′ | 69 |
| 59,449 | Bobai | 22°18′ | 109°59′ | 56 |
| 59,451 | Beiliu | 22°42′ | 110°21′ | 105 |
| 59,453 | Yulin | 22°39′ | 110°10′ | 82 |
| 59,457 | Luchuan | 22°19′ | 110°16′ | 113 |
| 59,640 | Hepu | 21°40′ | 109°11′ | 12 |
| Changle * | 21°50′ | 109°25′ | 32 |
Table 2.
Mean values of Relative Bias (RB) (%), Correlation Coefficients (CC), and Root Mean Square Error (RMSE) (mm), for the Integrated Multi-satellitE Retrievals for the Global Precipitation Measurement (GPM) mission (IMERG) and gauge precipitation, at the grid scale from April 2014 to December 2016.
| Stations | RB (%) | CC | RMSE (mm) | |||
|---|---|---|---|---|---|---|
| IMERG_Cal | IMERG _Uncal | IMERG_Cal | IMERG _Uncal | IMERG_Cal | IMERG _Uncal | |
| Beiliu | 16.1 | 4.5 | 0.744 | 0.662 | 11.3 | 12.6 |
| Bobai | 9.3 | 1.2 | 0.624 | 0.590 | 14.1 | 14.3 |
| Changle | 1.2 | −12.6 | 0.557 | 0.521 | 16.7 | 16.9 |
| Hepu | 18.9 | 5.9 | 0.686 | 0.636 | 16.4 | 17.5 |
| Lingshan | 4.0 | −7.3 | 0.679 | 0.599 | 12.2 | 13.5 |
| Luchuan | −11.4 | −23.3 | 0.637 | 0.550 | 14.7 | 16.2 |
| Pubei | 1.1 | −9.0 | 0.696 | 0.643 | 12.9 | 13.8 |
| Yulin | 14.0 | 0.8 | 0.691 | 0.625 | 11.5 | 11.9 |
Table 3.
Calibrated parameters used in the Xinanjiang model for the Nanliu River basin.
| No. | Parameters/Units | Definition | Value |
|---|---|---|---|
| 1 | K | Pan evaporation coefficient | 1.27 |
| 2 | WUM (mm) | Tension water capacity from upper layer | 20 |
| 3 | WLM (mm) | Tension water capacity from lower layer | 80 |
| 4 | WDM (mm) | Tension water capacity from deep layer | 20 |
| 5 | C (dimensionless quantity) | Evapotranspiration coefficient from deep layer | 0.15 |
| 6 | B (dimensionless quantity) | Exponential number of storage capacity distribution curve | 0.4 |
| 7 | SM (mm) | Areal mean free water storage capacity | 100 |
| 8 | EX | Parameter in the distribution of free water storage capacity | 1.0 |
| 9 | KG | Outflow coefficient of the ground water from free water | 0.3 |
| 10 | KSS | Outflow coefficient of the interflow from free water | 0.4 |
| 11 | KKG | Groundwater recession coefficient | 0.9972 |
| 12 | KKSS | Interflow recession coefficient | 0.8 |
© 2018 by the authors. Licensee MDPI, Basel, Switzerland. This article is an open access article distributed under the terms and conditions of the Creative Commons Attribution (CC BY) license (http://creativecommons.org/licenses/by/4.0/).
Share and Cite
MDPI and ACS Style
Tong, K.; Zhao, Y.; Wei, Y.; Hu, B.; Lu, Y. Evaluation and Hydrological Validation of GPM Precipitation Products over the Nanliu River Basin, Beibu Gulf. Water 2018, 10, 1777. https://doi.org/10.3390/w10121777
AMA Style
Tong K, Zhao Y, Wei Y, Hu B, Lu Y. Evaluation and Hydrological Validation of GPM Precipitation Products over the Nanliu River Basin, Beibu Gulf. Water. 2018; 10(12):1777. https://doi.org/10.3390/w10121777
Chicago/Turabian StyleTong, Kai, Yinjun Zhao, Yongping Wei, Baoqing Hu, and Yuan Lu. 2018. "Evaluation and Hydrological Validation of GPM Precipitation Products over the Nanliu River Basin, Beibu Gulf" Water 10, no. 12: 1777. https://doi.org/10.3390/w10121777
Note that from the first issue of 2016, this journal uses article numbers instead of page numbers. See further details here.