Attribution of Runoff Reduction in the Juma River Basin to Climate Variation, Direct Human Intervention, and Land Use Change


1
Key Laboratory of Water Cycle and Related Land Surface Processes, Institute of Geographical Sciences and Natural Resources Research, Chinese Academy of Sciences, Beijing 100101, China
2
College of Resources and Environment, University of the Chinese Academy of Sciences, Beijing 100049, China
3
Key Laboratory for Resources Use & Environmental Remediation, Institute of Geographical Sciences and Natural Resources Research, Chinese Academy of Sciences, Beijing 100101, China
4
Center for Agricultural Water Research in China, China Agricultural University, Beijing 100083, China
*
Authors to whom correspondence should be addressed.
Water 2018, 10(12), 1775; https://doi.org/10.3390/w10121775
Submission received: 24 October 2018
/
Revised: 30 November 2018
/
Accepted: 30 November 2018
/
Published: 3 December 2018
(This article belongs to the Section Hydrology)
Abstract
:Juma River, located in the Midwest of the Haihe River basin, is an important source of water supply to Beijing and Hebei. Over the past decades, the region has been seriously threatened by water shortages owing to complex climate conditions and intensive human activities. This study investigated the runoff characteristics of the Juma River by employing the Soil and Water Assessment Tool (SWAT) and stochastic methods for the period of 1961–2013. Accordingly, the runoff changes attributed to the climate variation and different types of anthropogenic activities (land use change and direct human intervention) were estimated, respectively, in conjunction with the improved quantitative response analysis. The results indicated that the annual runoff of both Zijingguan station and Zhangfang station has decreased significantly at the 0.001 significance level, and reduction rates were −0.054 billion m3 and −0.10 billion m3, respectively. Moreover, the persistency of this trend has been shown for decades (Hurst coefficient > 0.50). The SWAT model was calibrated and validated during the baseline period of 1961–1978. Significant rising temperatures and declining precipitation were the main reasons for runoff reduction, especially during the two periods of 1998–2002 and 2003–2008. Additionally, water withdrawal of Wuyi canal aggravated the runoff reduction and water scarcity conditions in the region. After 2009, the effects of direct human intervention exceeded those of climate change. However, the impact of land use change can be seen as negligible during the study period. Climate change had a greater effect on runoff reduction in winter, while the impact of human activities was more dramatic in summer.
1. Introduction
Runoff, as a major component of the water cycle, is the product of a complex system, with multiple factors involved. It is widely acknowledged that runoff variation is vulnerable to the impacts of climate change and human activities in the watershed [1,2]. Generally, among climatic factors which influence the runoff process, both precipitation and temperature seem to matter most [3,4]. The amount and intensity of regional precipitation can dominate the runoff volume, while temperature change has direct impacts on evapotranspiration and the timing of runoff [5,6,7]. Human activities that affect the hydrological process can basically be distinguished into two types: land use change and direct human intervention (i.e., water transfer projects, irrigation, and reservoir storage) [8,9,10]. The land use/land cover (LULC) decides the characteristics of the underlying surface in the basin, which is closely linked to soil hydraulic properties and streamflow generation [11,12,13]. With the acceleration of industrialization and urbanization, an increasing number of irrigation schemes and hydraulic structures have been built, and these water projects result in spatial and temporal changes of the quantity and quality of water in rivers, especially in some overpopulated areas [14].
The direct or indirect influences of climate change and human activities on the hydrological regime can lead to severe water problems, such as a water shortage, flooding, and water pollution at different times [15]. It is valuable to investigate the characteristics of runoff variation in a specific watershed and quantify the contribution of climate or human activities impacts to hydrological processes. There are three common approaches to this kind of study, including a statistical technique [16,17], elasticity-based methods [18,19,20], and hydrologic simulation [21,22,23], and they have their own advantages and limitations. The statistical technique, by establishing linear regression between meteorological variables and runoff, is simple and convenient to use. However, this method may not describe the exact non-linear relationship and uncertainty characters of hydrological variables [24,25]. Compared to the statistical technique, elasticity-based methods are based on physical processes, but it is challenging to select the appropriate governing equation in different catchments [24,25]. Though input data preparation is complicated, the hydrological model is by far the most extensive tool in impact assessment studies for its flexibility and feasibility [26]. Hydrologic simulation can not only distinguish the effects of climate variation and anthropogenic activity on runoff change at different time scales (long-term, inter-annual, or intra-annual), but also take the impact of different human activities (land use change or direct intervention) into consideration [9,27]. In the above three approaches, the study period is normally divided into the baseline period and the altered period, separated by an abrupt change in hydrological series, and the assumption is made that there is no human disturbance in the baseline period. The detection of abrupt change usually relies on mathematical statistics methods, which does not, however, mean that human activities can be negligible before a year of abrupt change, because such a point may also be the consequence of sudden changes in climate [28,29].
The Haihe River basin, located in Northern China, plays a key role in regional social-economic development [30]. With the rapid economy and population growth that has occurred in the basin, the water demand has risen accordingly in this region. The Haihe River basin is responsible for 15 percent of China’s industrial output and 10 percent of the total agricultural production [31], but the amount of water per capita is about 305 m3 in 2000, which is far below the national and world’s average level [32]. Under the situation of increasing water demand, large parts of the Haihe River basin are suffering continuing water resource shortages, particularly in Beijing, Tianjin, and Hebei [32,33]. During the past few decades, the annual runoff of most subcatchments in the Haihe River basin exhibited a significant decreasing trend [8,34,35,36], and abrupt changes almost occurred in 1978–1985 [37,38]. Much research has explored the main reasons that result in runoff reduction and isolated the possible impacts of climate change and human activities. Bao et al. [8] investigated the impact of climate variability and human activities on runoff reduction of the Taolinkou, Zhangjiafen, and Guantai catchment and found that the effect of human activities has increased from northeast of the Haihe River basin to the southwest. Xu et al. [34] selected 33 mountainous catchments as study areas, and the results of the elasticity method indicated that a decrease of runoff between the two sub-periods could be attributed, on average, to 26.9% (73.1%) from climate variation (land use/cover change). Research conducted by Lu et al. [39] showed that human activities were the major driving factors, with the average contribution of 96.1% and 76.6% for the upstream and downstream area in the last 50 years, respectively. Lei et al. [40] pointed out that a decrease in the annual runoff of the mountainous region in the northwest Haihe River basin since 1960 mainly resulted from the declining precipitation.
The Juma River is a major tributary of Daqing River of the Haihe River basin, and it is the main source of water supply for local and downstream communities in Beijing and Hebei. The Juma River used to have plentiful water, but it dried up after 2000. It is a controversial topic whether the climate variation or human activities led to the water reduction of Juma River. Therefore, the objectives of this study were to: (1) identify the change characteristics of annual runoff series at Zijingguan Station and Zhangfang Station during 1961–2013 using statistical methods; (2) quantify the relative contribution rate of climate change, the land use change, and direct human intervention for annual and monthly runoff variations of the Juma River basin with the SWAT model; (3) evaluate the results of attribution analysis according to the features of climate change and human activities in our study region. This paper provided an insight into the causation and mechanism of runoff reduction in the Juma River basin. Additionally, the method of analysis used is applicable to detecting changes in the hydrological process regarding the effects of climate variation and anthropogenic activities.
2. Materials and Methods
2.1. Study Area
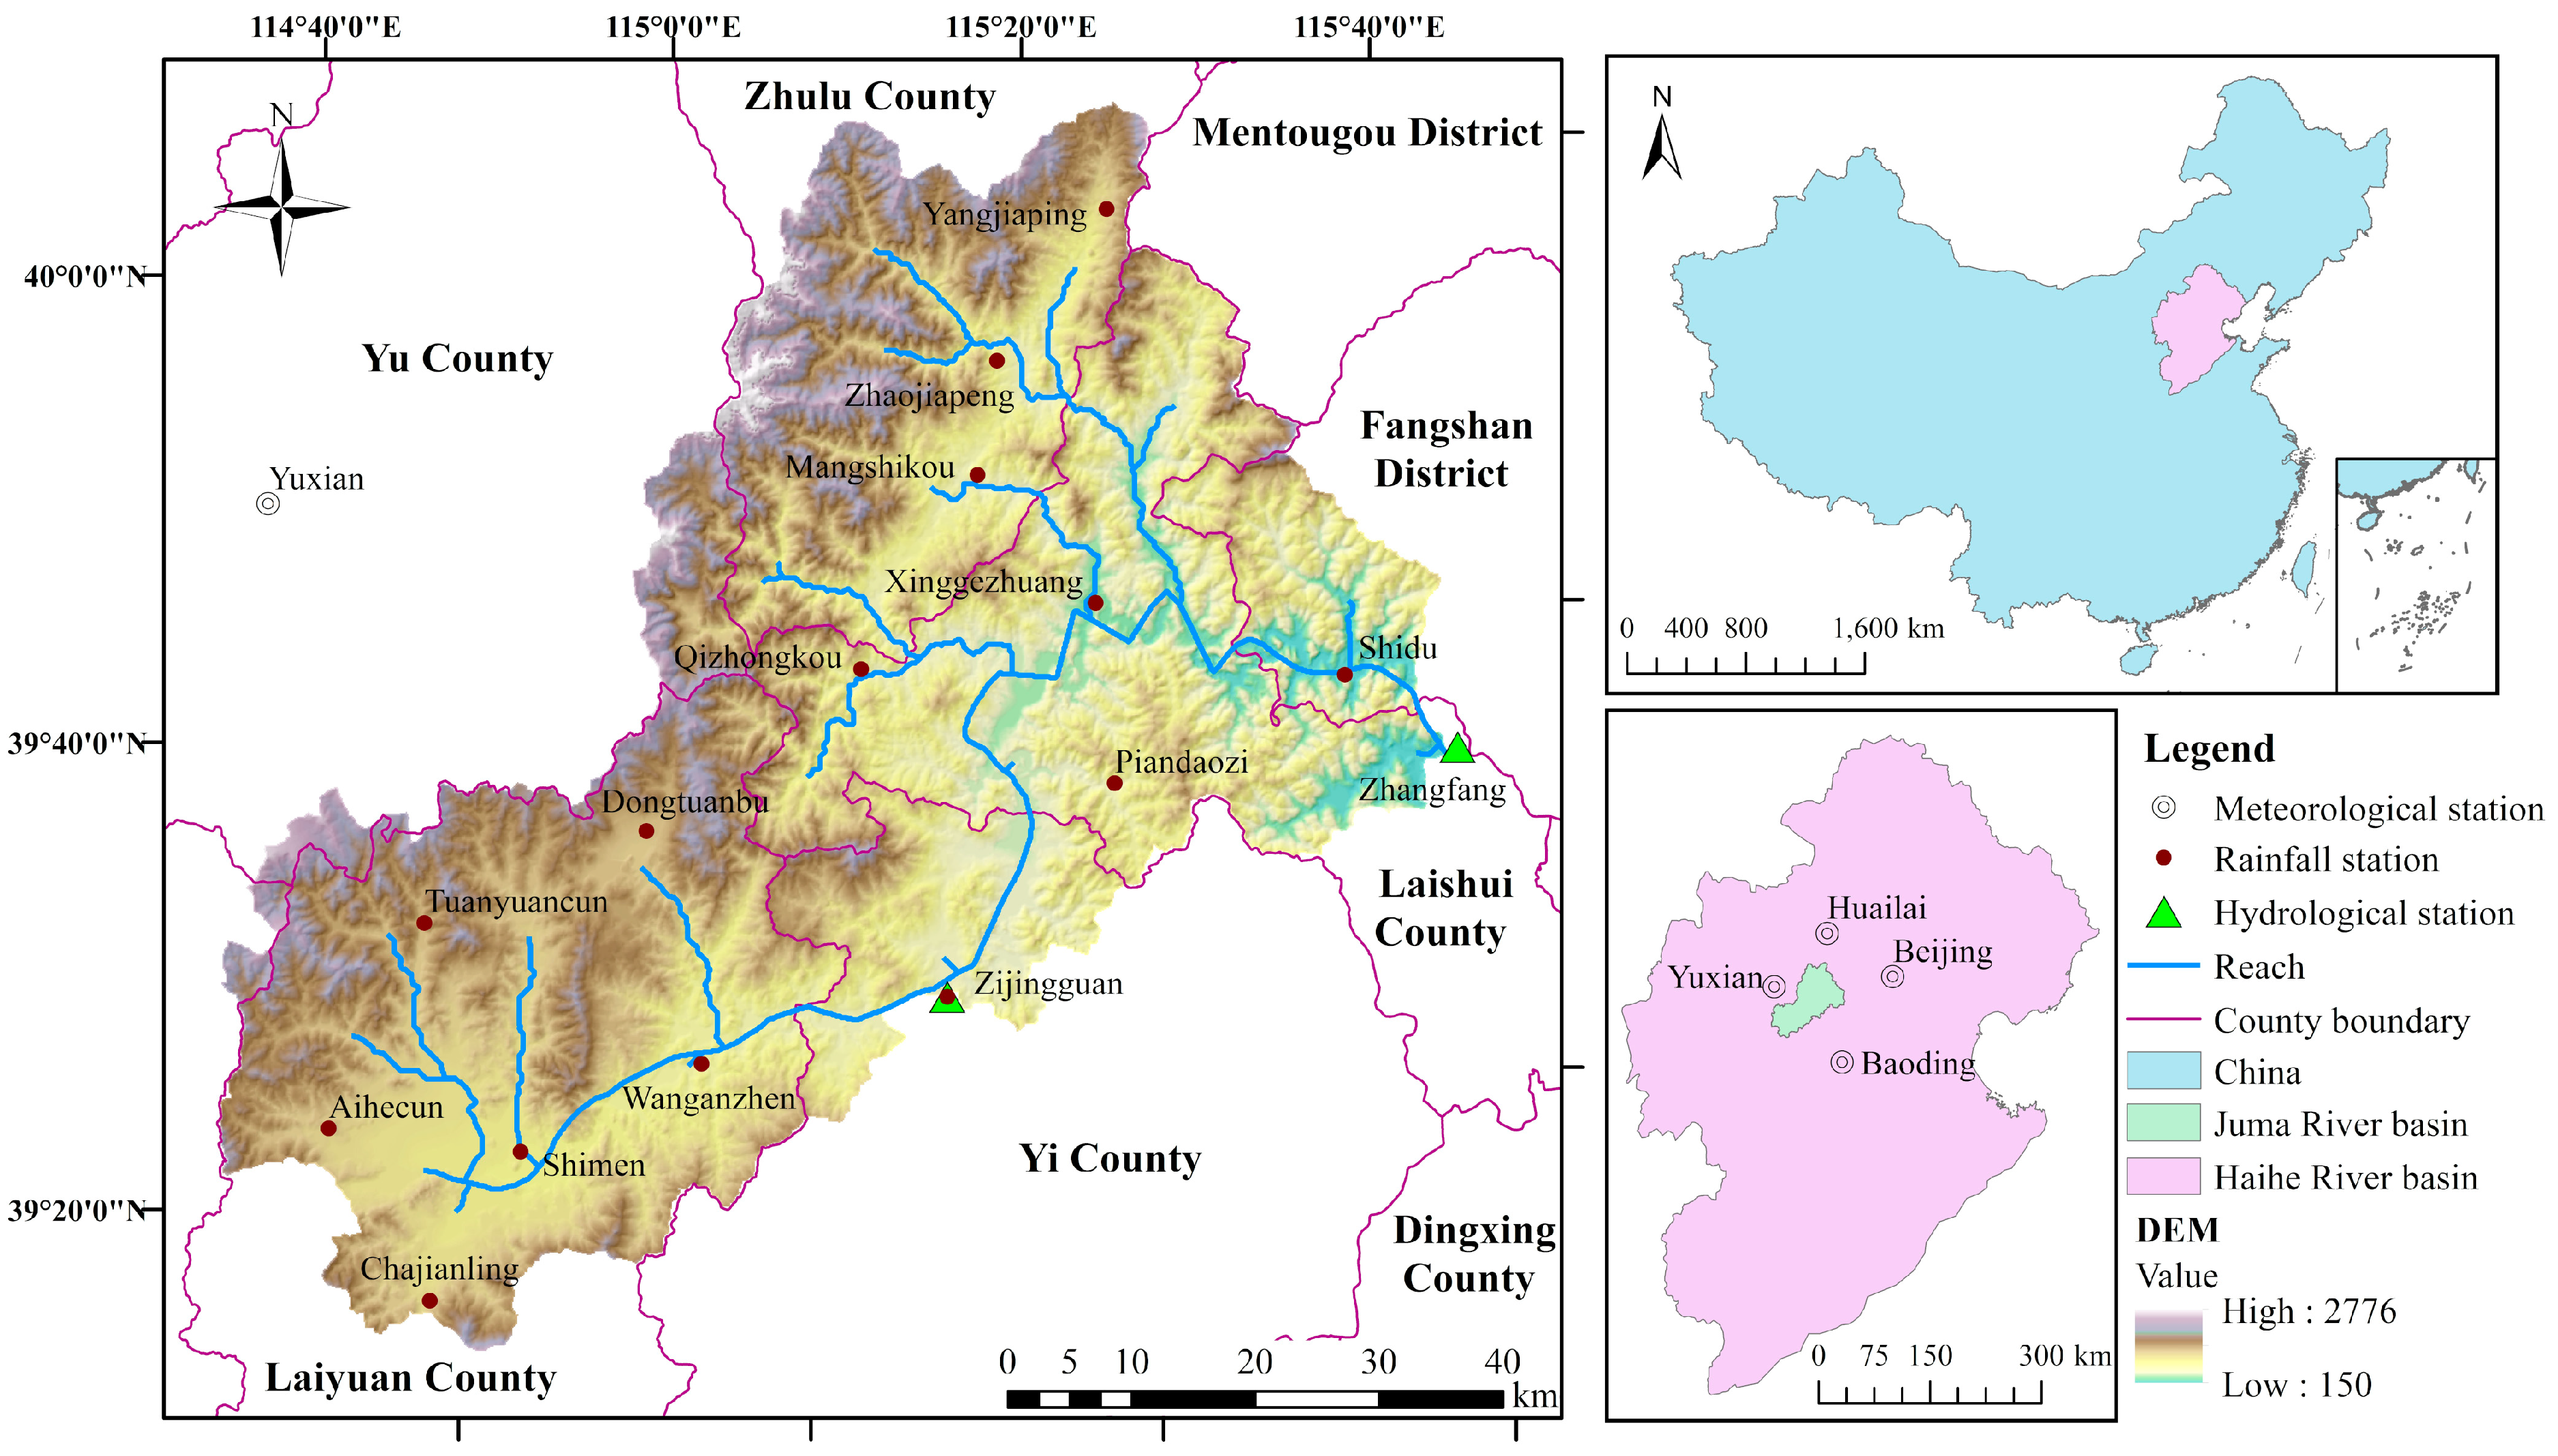
Located in the Midwest of the Haihe River basin, Juma River originates in the north of Taihang Mountains and flows to the east. It is divided into south and north branches in Zhangfang Town, and then converges in Baigou Town before emptying into Daqing River. The upper reaches of Zhangfang hydrological station, with a drainage area of 4741 km2, were selected to perform the study (Figure 1). The Juma River Basin is characterized by a continental monsoon climate. It is cold and dry in winter, and warm and rainy in summer. Average annual precipitation of this catchment is 650mm, and about 80% of the precipitation occurs from June to September.
There was no large reservoir in the upper reaches of Zhangfang Station. Some water diversion projects have been continuously constructed in the Juma River basin, since the 1950s. Wuyi diversion canal, about one kilometer upstream of Zijingguan hydrological station, is the oldest one. Its construction started in 1958 and was completed in 1962. The Guandaoling diversion canal is about 10 km downstream of the site of Zijingguan hydrological station and was built from 1977 to 1985. Wuyi and Guandaoling canals are components of interbasin water diversion. A part of runoff removed through the canal to other watershed is considered to be lost from the system and without the return water. The Shengtian diversion canal is located in the lower Juma River, about 17 km upstream of Zhangfang hydrological station. Its construction began in 1974 and went on for several years, until the 1980s. In addition, some small hydropower projects built in Fangshan County during the 1970s and 1980s, and tourist numbers along the Juma River have grown rapidly in recent years.
2.2. Data Collection
The dataset used in our study includes hydrological, meteorological, Digital Elevation Model (DEM), soil, and land use (LU) data, which were obtained from various sources. Monthly runoff records and daily precipitation data from 1961–2013 in the catchment were provided by Hydrological Yearbooks of China. Monthly runoff records consist of the observed runoff of two hydrological stations (i.e., Zhangfang and Zijingguan stations) and water withdrawals at Wuyi diversion canal, the latter of which were useful in the construction of natural runoff and determination of a baseline period. Monthly runoff records are missing in some years (1967–1968 and 2002–2005). Daily precipitation data is from 14 rainfall stations distributed in Juma River basin. The meteorological data at four meteorological stations (Yuxian, Huailai, Beijing, Baoding) near the catchment for the period from 1956 to 2013 was downloaded from the China Meteorological Data Service Center (http://data.cma.cn/). It covers daily precipitation, air temperature (minimum, maximum and average), wind speed, relative humidity, and sunshine duration.
DEM and LU data for the late 1970s, late 1980s, 1995, 2000, 2005, and 2010 of the study area were extracted from the Resource and Environment Data Cloud Platform (http://www.resdc.cn/), and their spatial resolution is 100 m. According to the data description [41], the LU datasets were retrieved from Landsat TM/ETM/MSS images by visual interpretation and divided into eight types in this study: Agriculture, Dense Forest, Shurbwood, Open Forest, Grass, Water Bodies, Urban, and Unused Land. The soil data (1000 m × 1000 m) was obtained from the Harmonized World Soil Database version 1.1 (HWSD), provided by the Cold and Arid Regions Science Data Center at Lanzhou (http://westdc.westgis.ac.cn). There were five main soil types in the catchment, consisting of Cambisols, Luvisols, Leptosols, Regosols, and Fluvisols. Hydrological properties of the different soil classes are listed in Table 1.
2.3. Hydro-Climatic Trend Analysis
In this study, mathematical statistics were applied to analyze change trends in runoff (observed runoff series and restoring runoff series of both Zijingguan station and Zhangfang station), precipitation (annual and monthly precipitation data series at 14 rainfall stations), and temperature (annual mean temperature, hot-day, and frost-day series at four meteorological stations) during the study period. The Mann-Kendall (MK) non-parametric test has been widely used in detecting whether monotonic trends exist in non-normally distributed data [42,43,44]. Nonparametric Theil–Sen (TS) linear regressions can collect the slope of a time series and locate the median value of these slopes [45,46]. The Hurst coefficient, proposed by Hurst [47], enables researchers to forecast the hydrological series trend in the future via the logarithmic relationship among the range of cumulative departures from the mean, the standard deviation series, and observations [48]. The Pettitt method is a nonparametric test that can detect whether any change points exist in the observed series [49]. The detailed calculation processes of these methods are described in the Supplementary material.
2.4. SWAT Model Set Up and Calibration
2.4.1. Model Description
The SWAT model is a distributed hydrological model developed from the Simulator for Water Resources in Rural Basins (SWRRB). It can predict the effect of management on water, sediment, and agrochemical yields during a continuous period in a large-scale river basin [50,51]. Based on a continuous water balance, the model inflow is precipitation, while ET, surface runoff, lateral flow, and base flow are outflows [52]. Owing to spatial heterogeneity, complex basins can be divided into sub-basins and further delineated by hydrological response units (HRUs) to reflect differences in precipitation, ET, infiltration, surface water, etc. [21,50] Then, Runoff is produced separately from each subarea and gathered to calculate the total runoff for the whole basins [50]. In this study, the water yield is calculated with the method of SCS curve law, and potential evapotranspiration is simulated by the Penman-Monteith formula.
2.4.2. Model Calibration and Validation
In this research, the baseline period was determined by a combination of the “human-designated” method and “abrupt change” method [25]. Because construction of the water diversion projects in the Juma River basin started in 1961, we could not find a stage without human disturbance during the entire study period. Hence, the restoring runoff was calculated using the observed runoff and diverted water volume of Wuyi diversion canal, based on the water budget balance. Then, the abrupt change point was detected by the Pettitt method. The period up to the abrupt change year was selected as the baseline period, in which the restoring runoff variation was assumed to only be influenced by climate change.
Model calibration and validation were carried out in the baseline period, with SUFI-2 (sequential uncertainty fitting program) [53] in SWAT-CUP. Initially, the physically meaningful ranges of parameters were identified. When finishing one iteration, a new range of parameters was obtained from the calibration output. After performing a number of iterations, parameter ranges were constantly narrowed. P-factor and R-factor together demonstrate the robustness of the parameter uncertainty assessment. The range of P-factor is 0 to 1, while the range of R-factor is from 0 to infinity [54]. The closer P-factor and R-factor approach 1 and 0, respectively, the more suitable the selective scope of parameter values. In the attribution analysis, the parameters are calibrated to represent the natural hydrological processes during the baseline period [55]. Hence, the restoring runoff, equivalent to natural runoff, was used in model calibration and validation in our study, and the calibrated parameters were considered to represent the natural state of the water cycle. This method was applied and verified in some research of the SWAT model [56] or Variable Infiltration Capacity (VIC) model [57]. The parameters of the runoff at Zijingguan Station were initially calibrated using the restoring runoff, and these parameters were then sequentially calibrated for the downstream controlled by Zhangfang Station. The Nash-Sutcliffe efficiency (Ens), the relative coefficient (R2), and relative error (Re) were used to evaluate the performance of the model. When Ens > 0.5, R2 > 0.6, and |Re| ≤ 15%, the simulated accuracy of runoff by the SWAT model was satisfied [58].
2.4.3. Evaluating the Relative Contribution of Climate, Land Use Change, and Direct Human Intervention
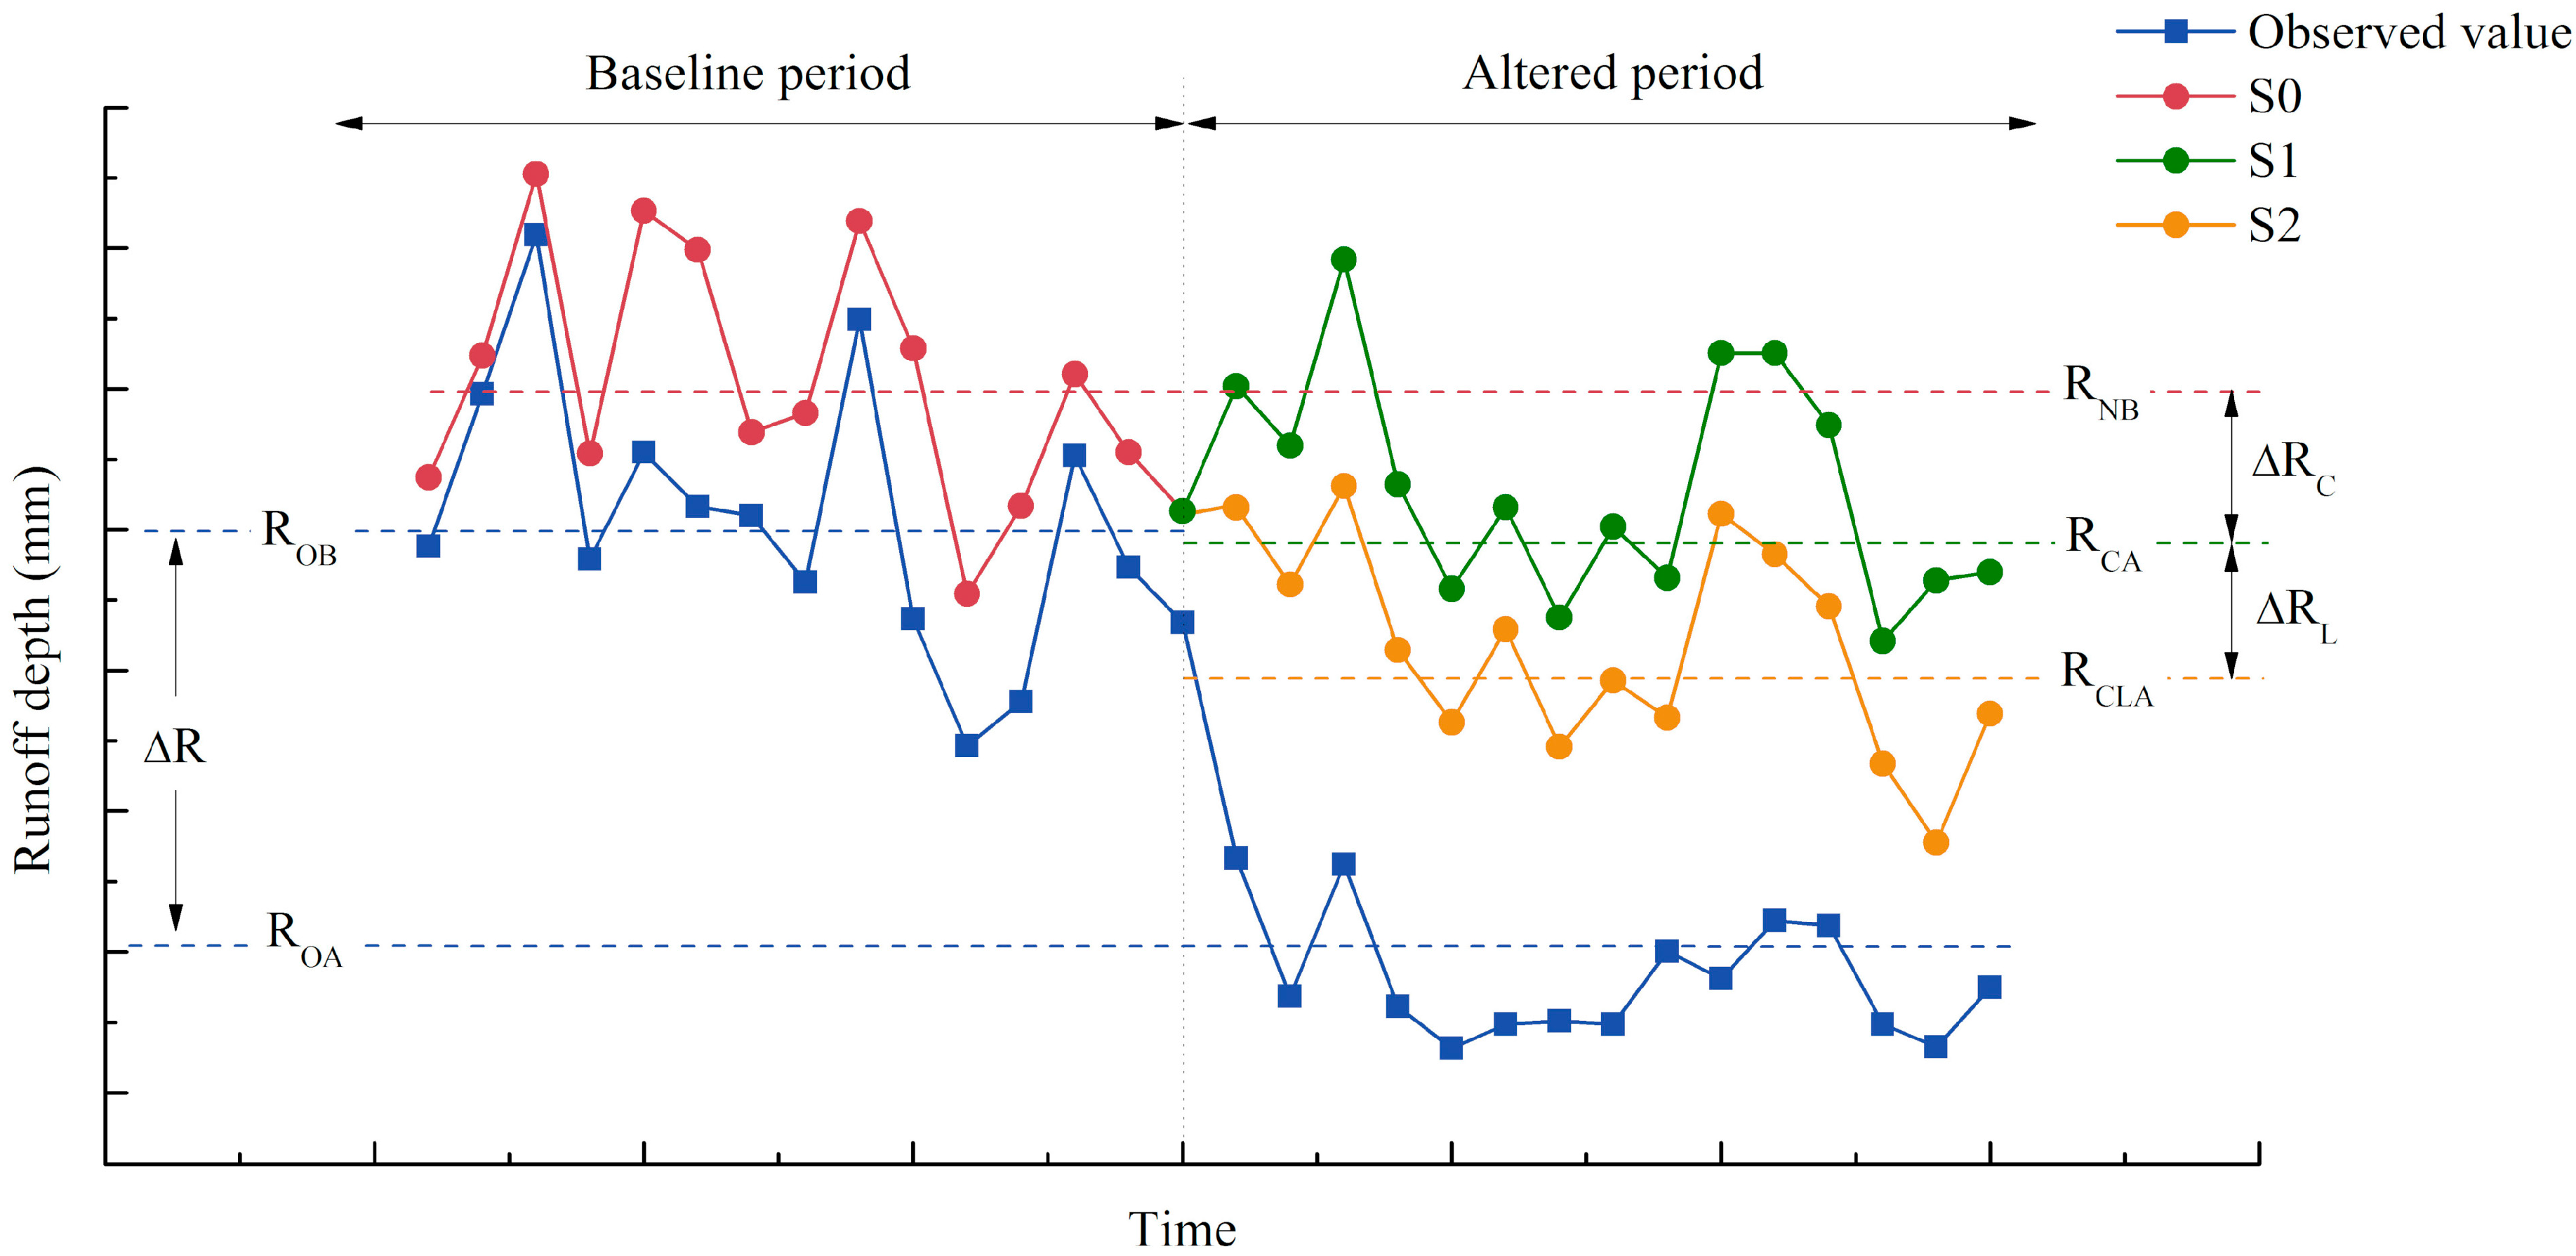
Under the basis of previous studies [9,55,59], the runoff changes attributed to climate variation, land use change, and direct human intervention were estimated as follows:
The annual runoff variation () is the difference between the observed mean annual runoff in the baseline period () and the altered period ():
In this study, runoff variation is affected by both climate change and human activities. Human impacts are divided into two parts: the land use change and direct intervention. Thus, the annual runoff variation () can be calculated as:
where and , respectively, represent the effect of climate change and human activities. is the sum of the variation in the runoff because of the land use change () and the direct intervention ().
Different scenarios (S0–S2) were developed with the calibrated SWAT model in our study:
S0: Meteorological data in the baseline period and LU data in the baseline period.
S1: Meteorological data in the altered period and LU data in the baseline period.
S2: Meteorological data in the altered period and LU data in the altered period.
Firstly, climate data and LU data, both in the baseline period, were donated by modeling S0, and its output () represents the natural mean annual runoff during the baseline period. Climate data in the altered period and LU data in the baseline period were used as the SWAT model input (S1), and its output () is only the influence of climate change. The equation for computing the is:
Secondly, with climate data constant, LU data in the same period of S1 was applied as the model inputs (S2). The output () is considered as the co-product of climate change and land use change. Hence, the can be expressed as:
Only one unknown variable () can be derived from Equations (2–4). Finally, the effect of the climate change (), the land use change () and the direct intervention () on runoff in the altered period can be calculated as:
3. Results
3.1. Changing Trends of Observed Runoff
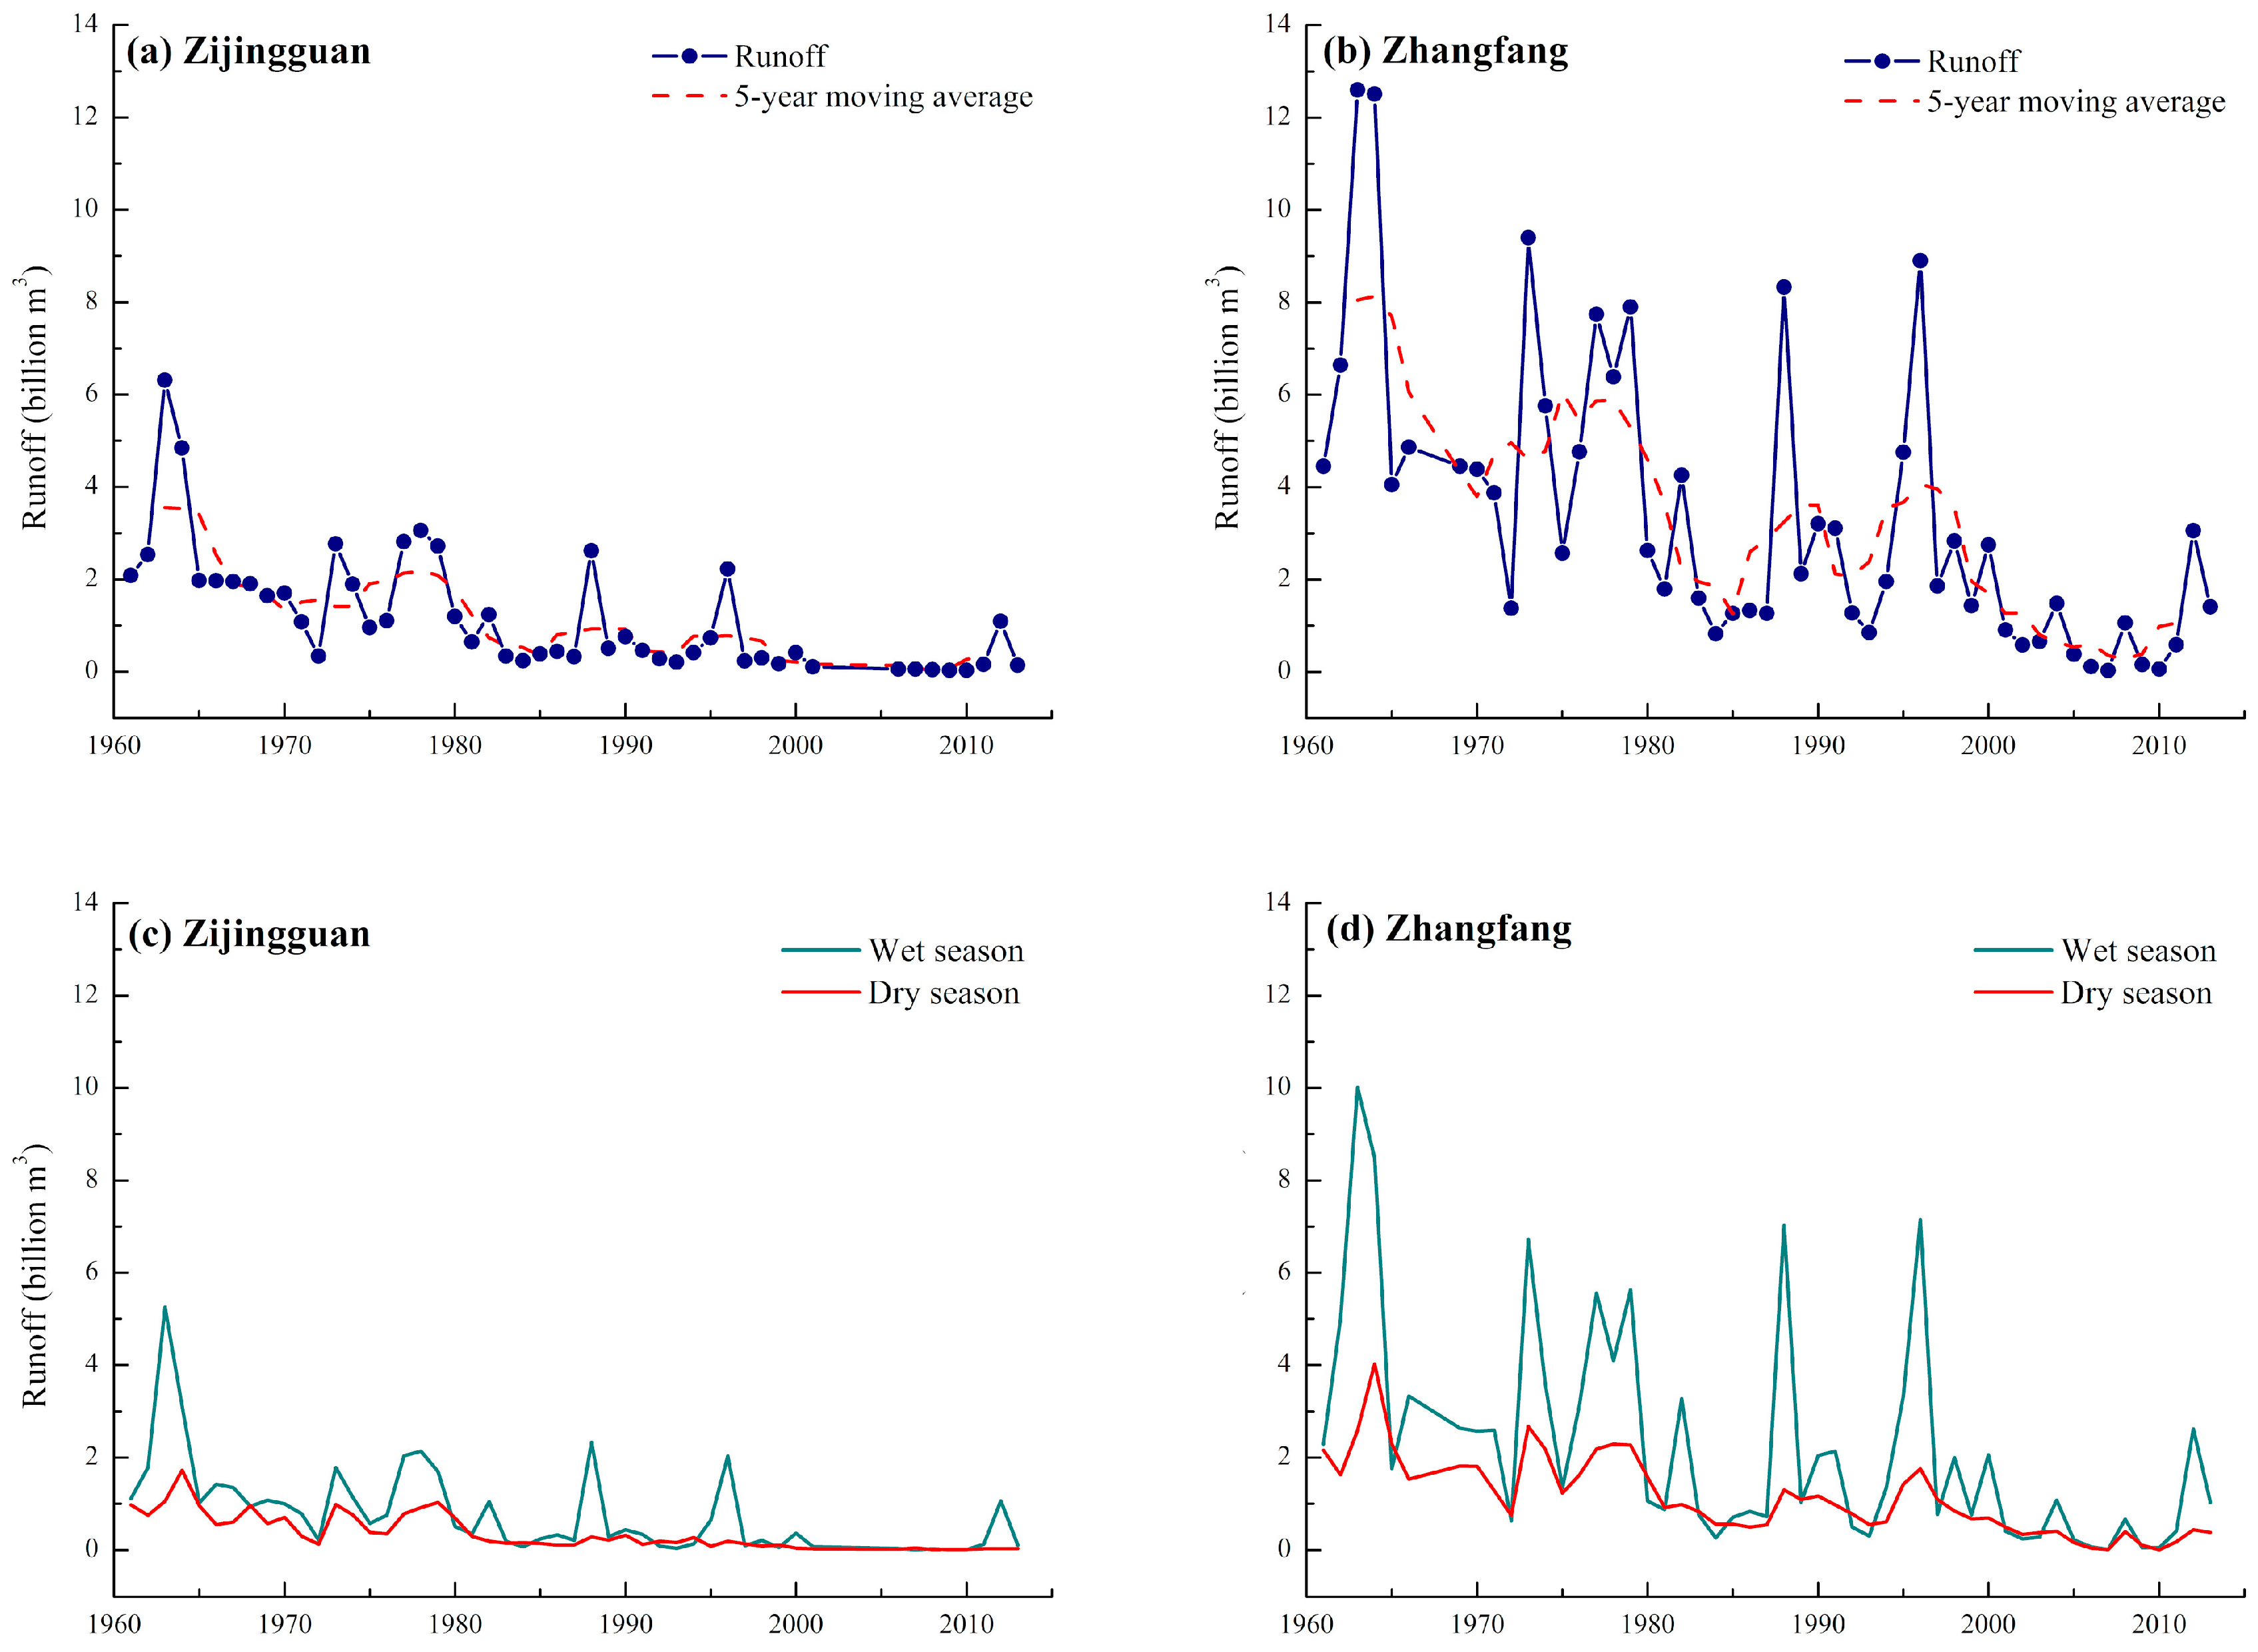
Annual observed runoff of two stations and five-year running means are shown in Figure 4a,b. Overall, the annual runoff of Juma River has declined obviously for the past decade. Especially after 2000, the river almost dried up. The results of the Mann-Kendall test show that the annual runoff series of both Zijingguan station and Zhangfang station presented a significant downtrend at the 0.001 significance level, and reduction rates were −0.054 billion m3 and −0.10 billion m3, respectively. Moreover, the Hurst coefficient for Zijingguan station is 0.91 (>0.50), and the coefficient for Zhangfang station is 0.79 (>0.50). This indicates a presumable decreasing tendency of river runoff in the future. Abrupt change points have been tested using the Pettitt method. From Figure 5a,b, it can be found that the curves of Ut exhibited multi-peaks modes. The value of Ut reached the maximum in 1982 (p < 0.001), at both Zijingguan and Zhangfang stations. This means that 1982 was the most probable change point of the two observed runoff time series of Juma River, which is in agreement with the findings of Yang and Tian [37]. The value of Ut around 1988 and 1996 at Zijingguan Station was clearly higher than the adjacent points. Similarly, the local extreme values also occurred around 1991 and 1996 at Zhangfang. This is because the statistical test is somewhat sensitive to the existence of outliers in the time series. The amount of summer streamflow in 1988 and 1996 was well above that in other years after 1982 (Figure 4). Moreover, these extreme floods in some years exerted an influence on detecting the change point in the mean value of observed series. Thus, the sequences were divided into two stages: 1961–1982 and 1982–2013. The annual average runoff volume of Zijingguan station was 2.15 billion m3 in the period of 1961–1982, and then decreased to 0.50 billion m3 in 1982–2013. The relative variation between the two periods was about −76.6%. Additionally, the annual average runoff volume of Zhangfang station was 5.62 billion m3 in the period of 1961–1982 and then decreased to 2.19 billion m3 in 1983–2013. The relative variation between the two periods was about −61.0%. These changes are statistically significant at the 0.001 level according to a t-test (results not presented in the paper).
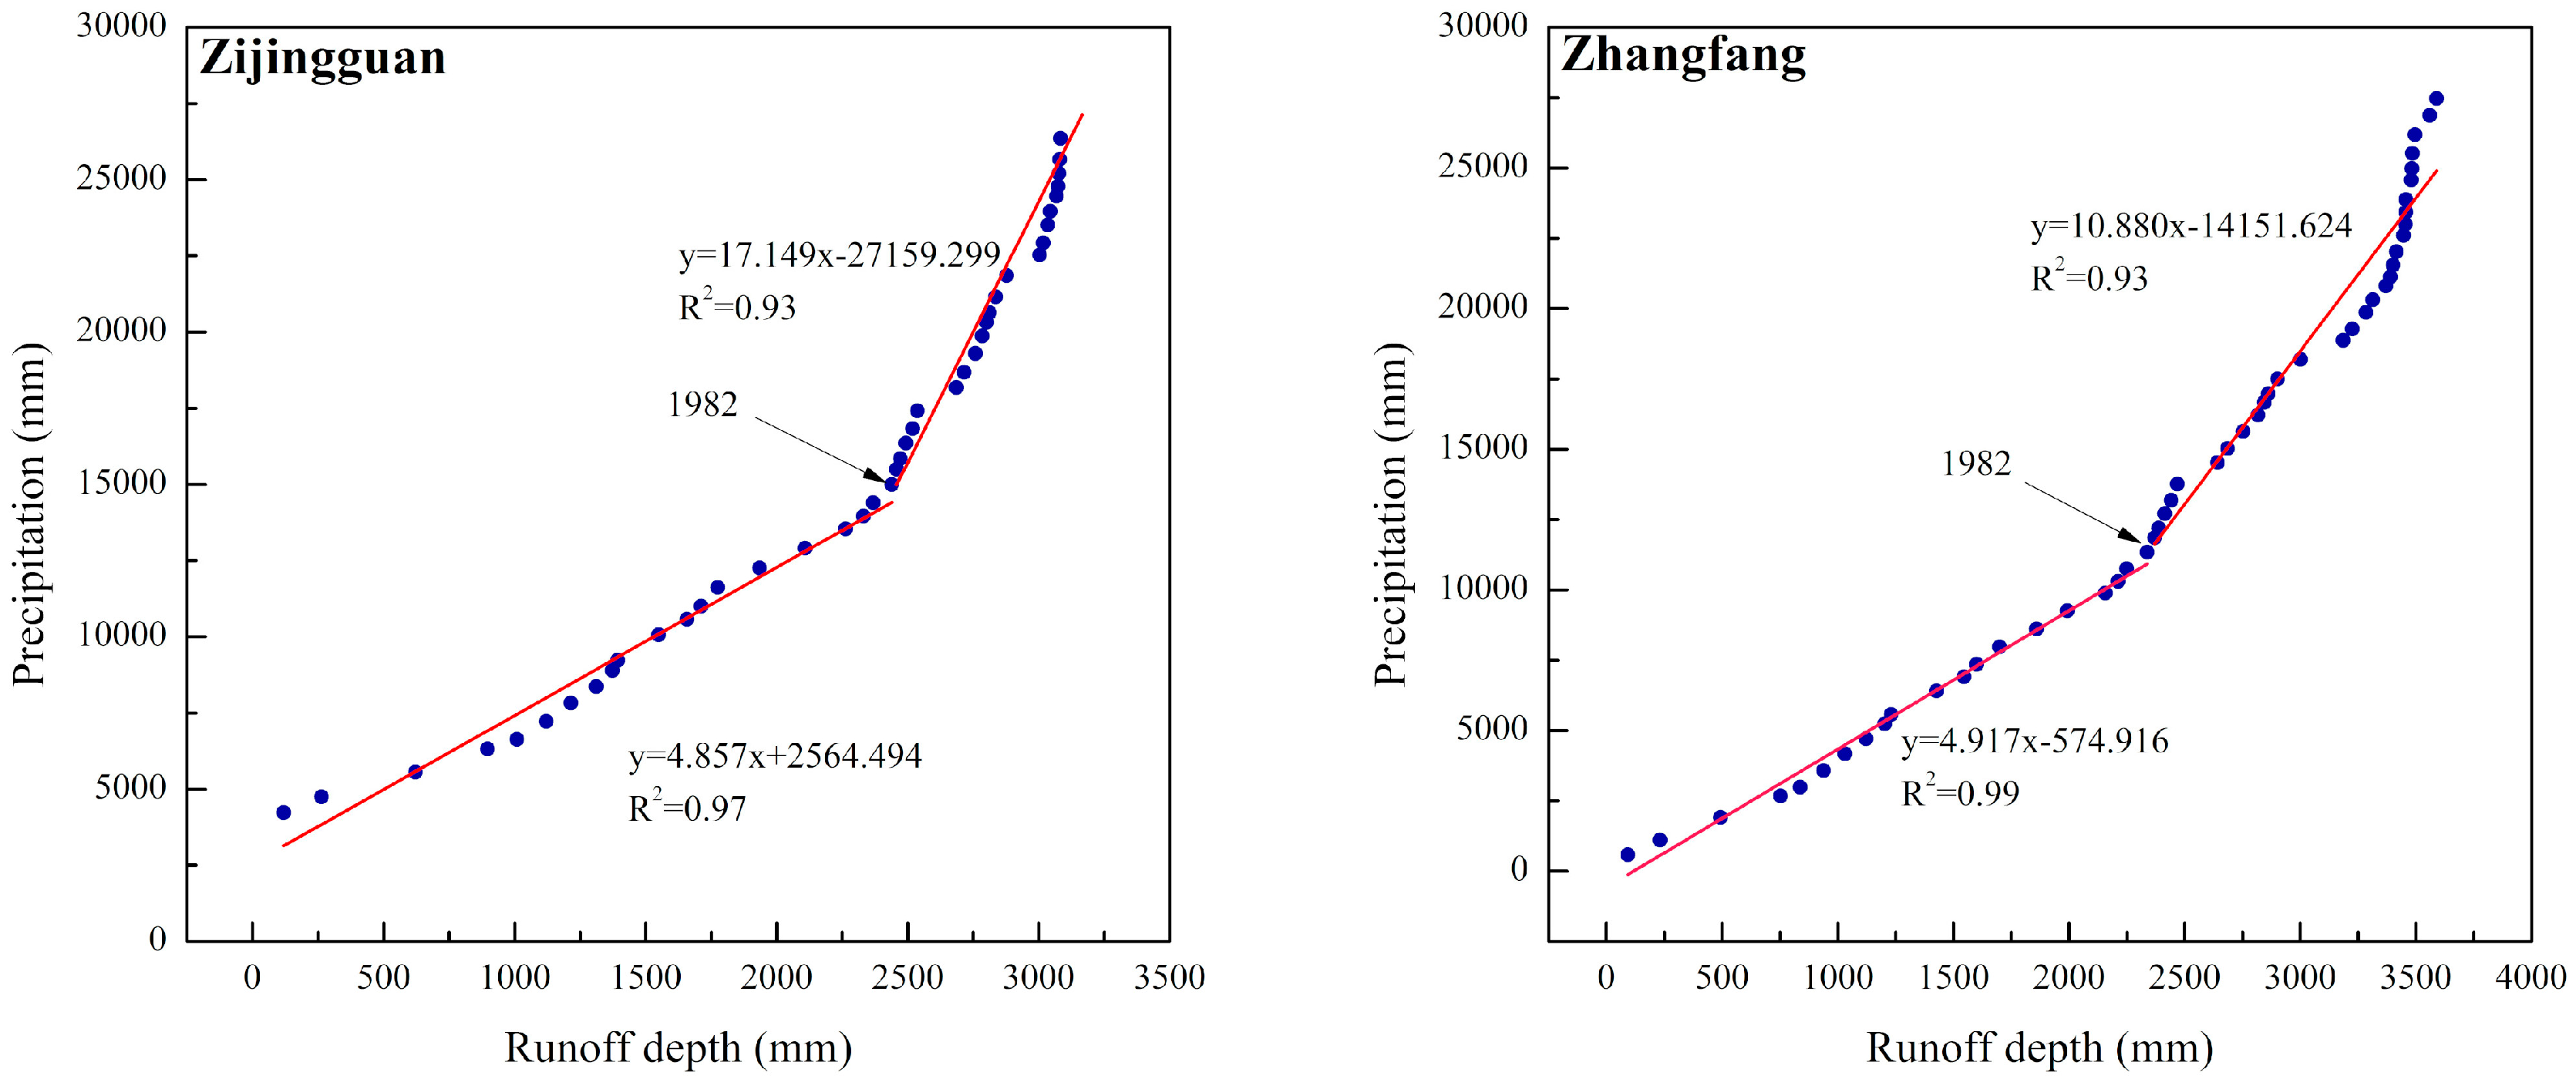
The comparison of annual observed runoff during the dry season (December to February) and wet season (May to September) is shown in Figure 4c,d, respectively. Both dry-season and wet-season series during 1961–2013 at two stations markedly reduced at the 0.001 significance level. Moreover, the two values got closer and closer over time after the change point year. This phenomenon disaccords with characteristics of rivers in the Semiarid region that runoff distribution is uneven in a year [60]. Furthermore, the double mass plot of cumulative precipitation and cumulative runoff (Figure 6) has bent upwards, away from a straight line, since 1982. This implies that some non-precipitation factors (e.g., human activities) have changed hydrological processes and the mechanism of runoff yield in the Juma River basin [61].
3.2. Model Valuation
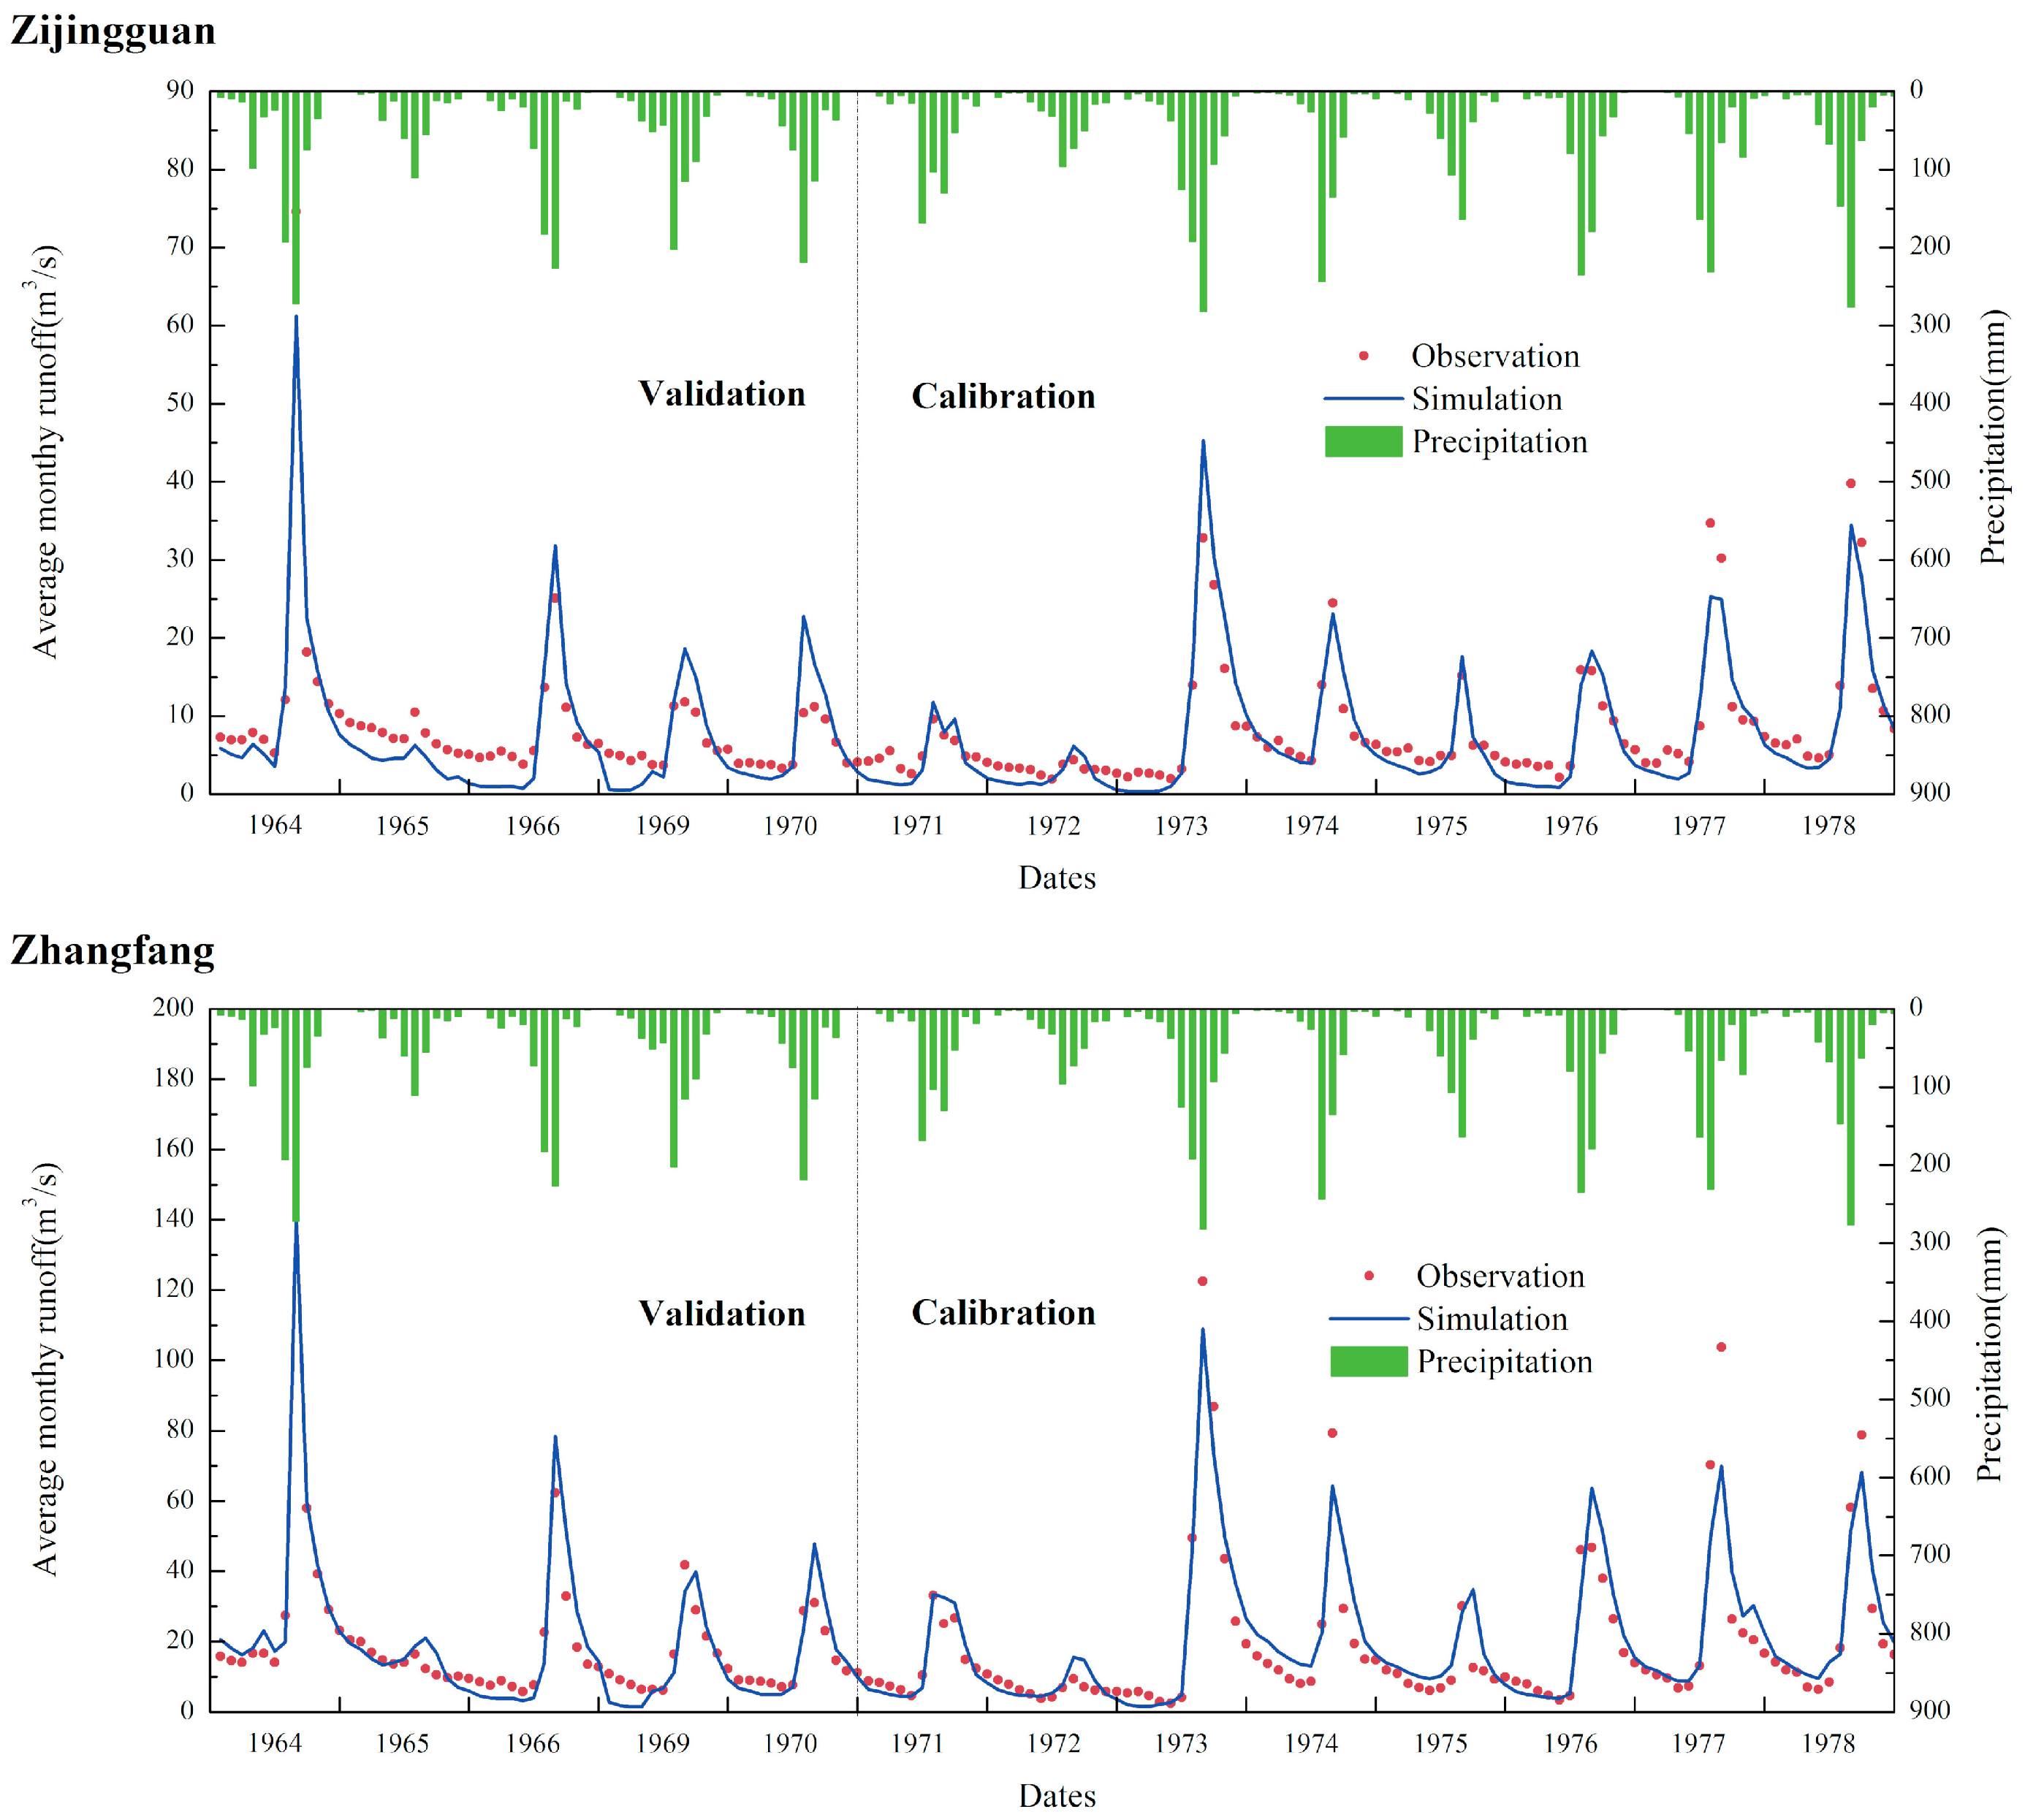
According to the results of the Pettitt method, restoring runoff series of Zijingguan Station exhibited a sudden change in 1982, while restoring runoff series of Zhangfang Station changed significantly in 1979, which coincides with the development of hydraulic engineering in the Juma River basin. Thus, 1961–1978 was deemed to be the baseline period. The SWAT model was set up based on the LU data for the late 1970s and the meteorological data from 1964 to 1978. In order to quantify the relative attribution of different factors both in the long-term and intra-annual period, the model simulation was conducted at a monthly scale. Monthly restoring runoff of 1971–1978 was used for model calibration and monthly restoring runoff of 1964–1970 was used to validate the parameters. Among them, the data for the period of 1967–1968 was missing. Nine of most sensitive parameters were selected for calibration of the model and are shown in Table 2.
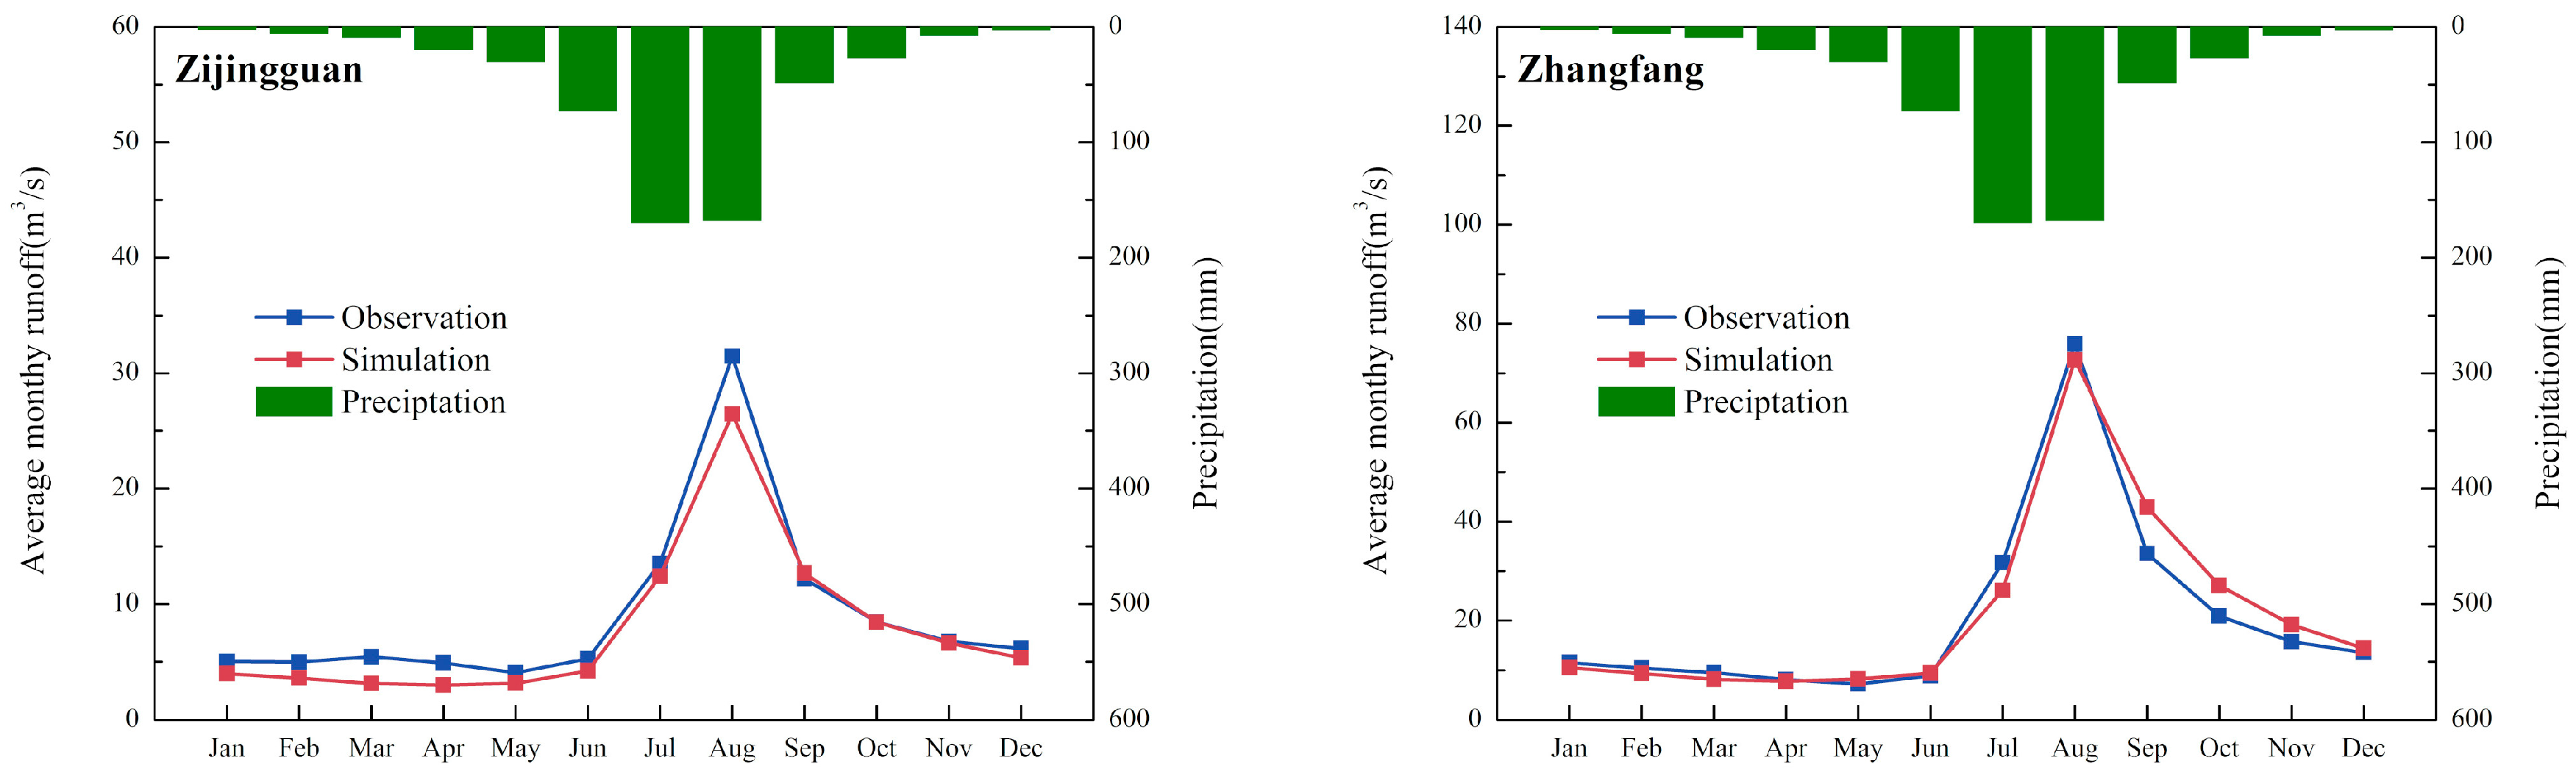
As presented in Table 3 and Figure 7, the Ens, R2, and Re were 0.89, 0.86, and 8.2%, respectively, in the calibration period, while they were 0.84, 0.86, and 12.15% in the validation period, respectively, at Zijingguan Station. Similarly, the Ens, R2, and Re were 0.88, 0.89, and −6.4%, respectively, in the calibration period, while they were 0.86, 0.87, and 3.21% in the validation period, respectively, at Zhangfang Station. The simulation results of two control stations met the evaluation criteria (Ens > 0.5, R2 > 0.6, |Re| ≤ 15%) for both calibration and validation periods [58]. This suggested that good agreement was obtained between monthly simulated runoff and restoring values after nine parameters were optimized. The model had a better temporal performance in the calibration period than in the validation period. However, underestimation was found in the dry season, especially at Zijingguan Station. This may be because the water that flowed into the deep aquifer in the SWAT model is considered to be the loss from the system and not included in water budget [62]. Furthermore, the monthly mean value of runoff was simulated well in most months during the baseline period, which is illustrated in Figure 8. Given the above, the calibrated SWAT model can be used in our study area.
3.3. Contributions of Different Factors to Runoff Change
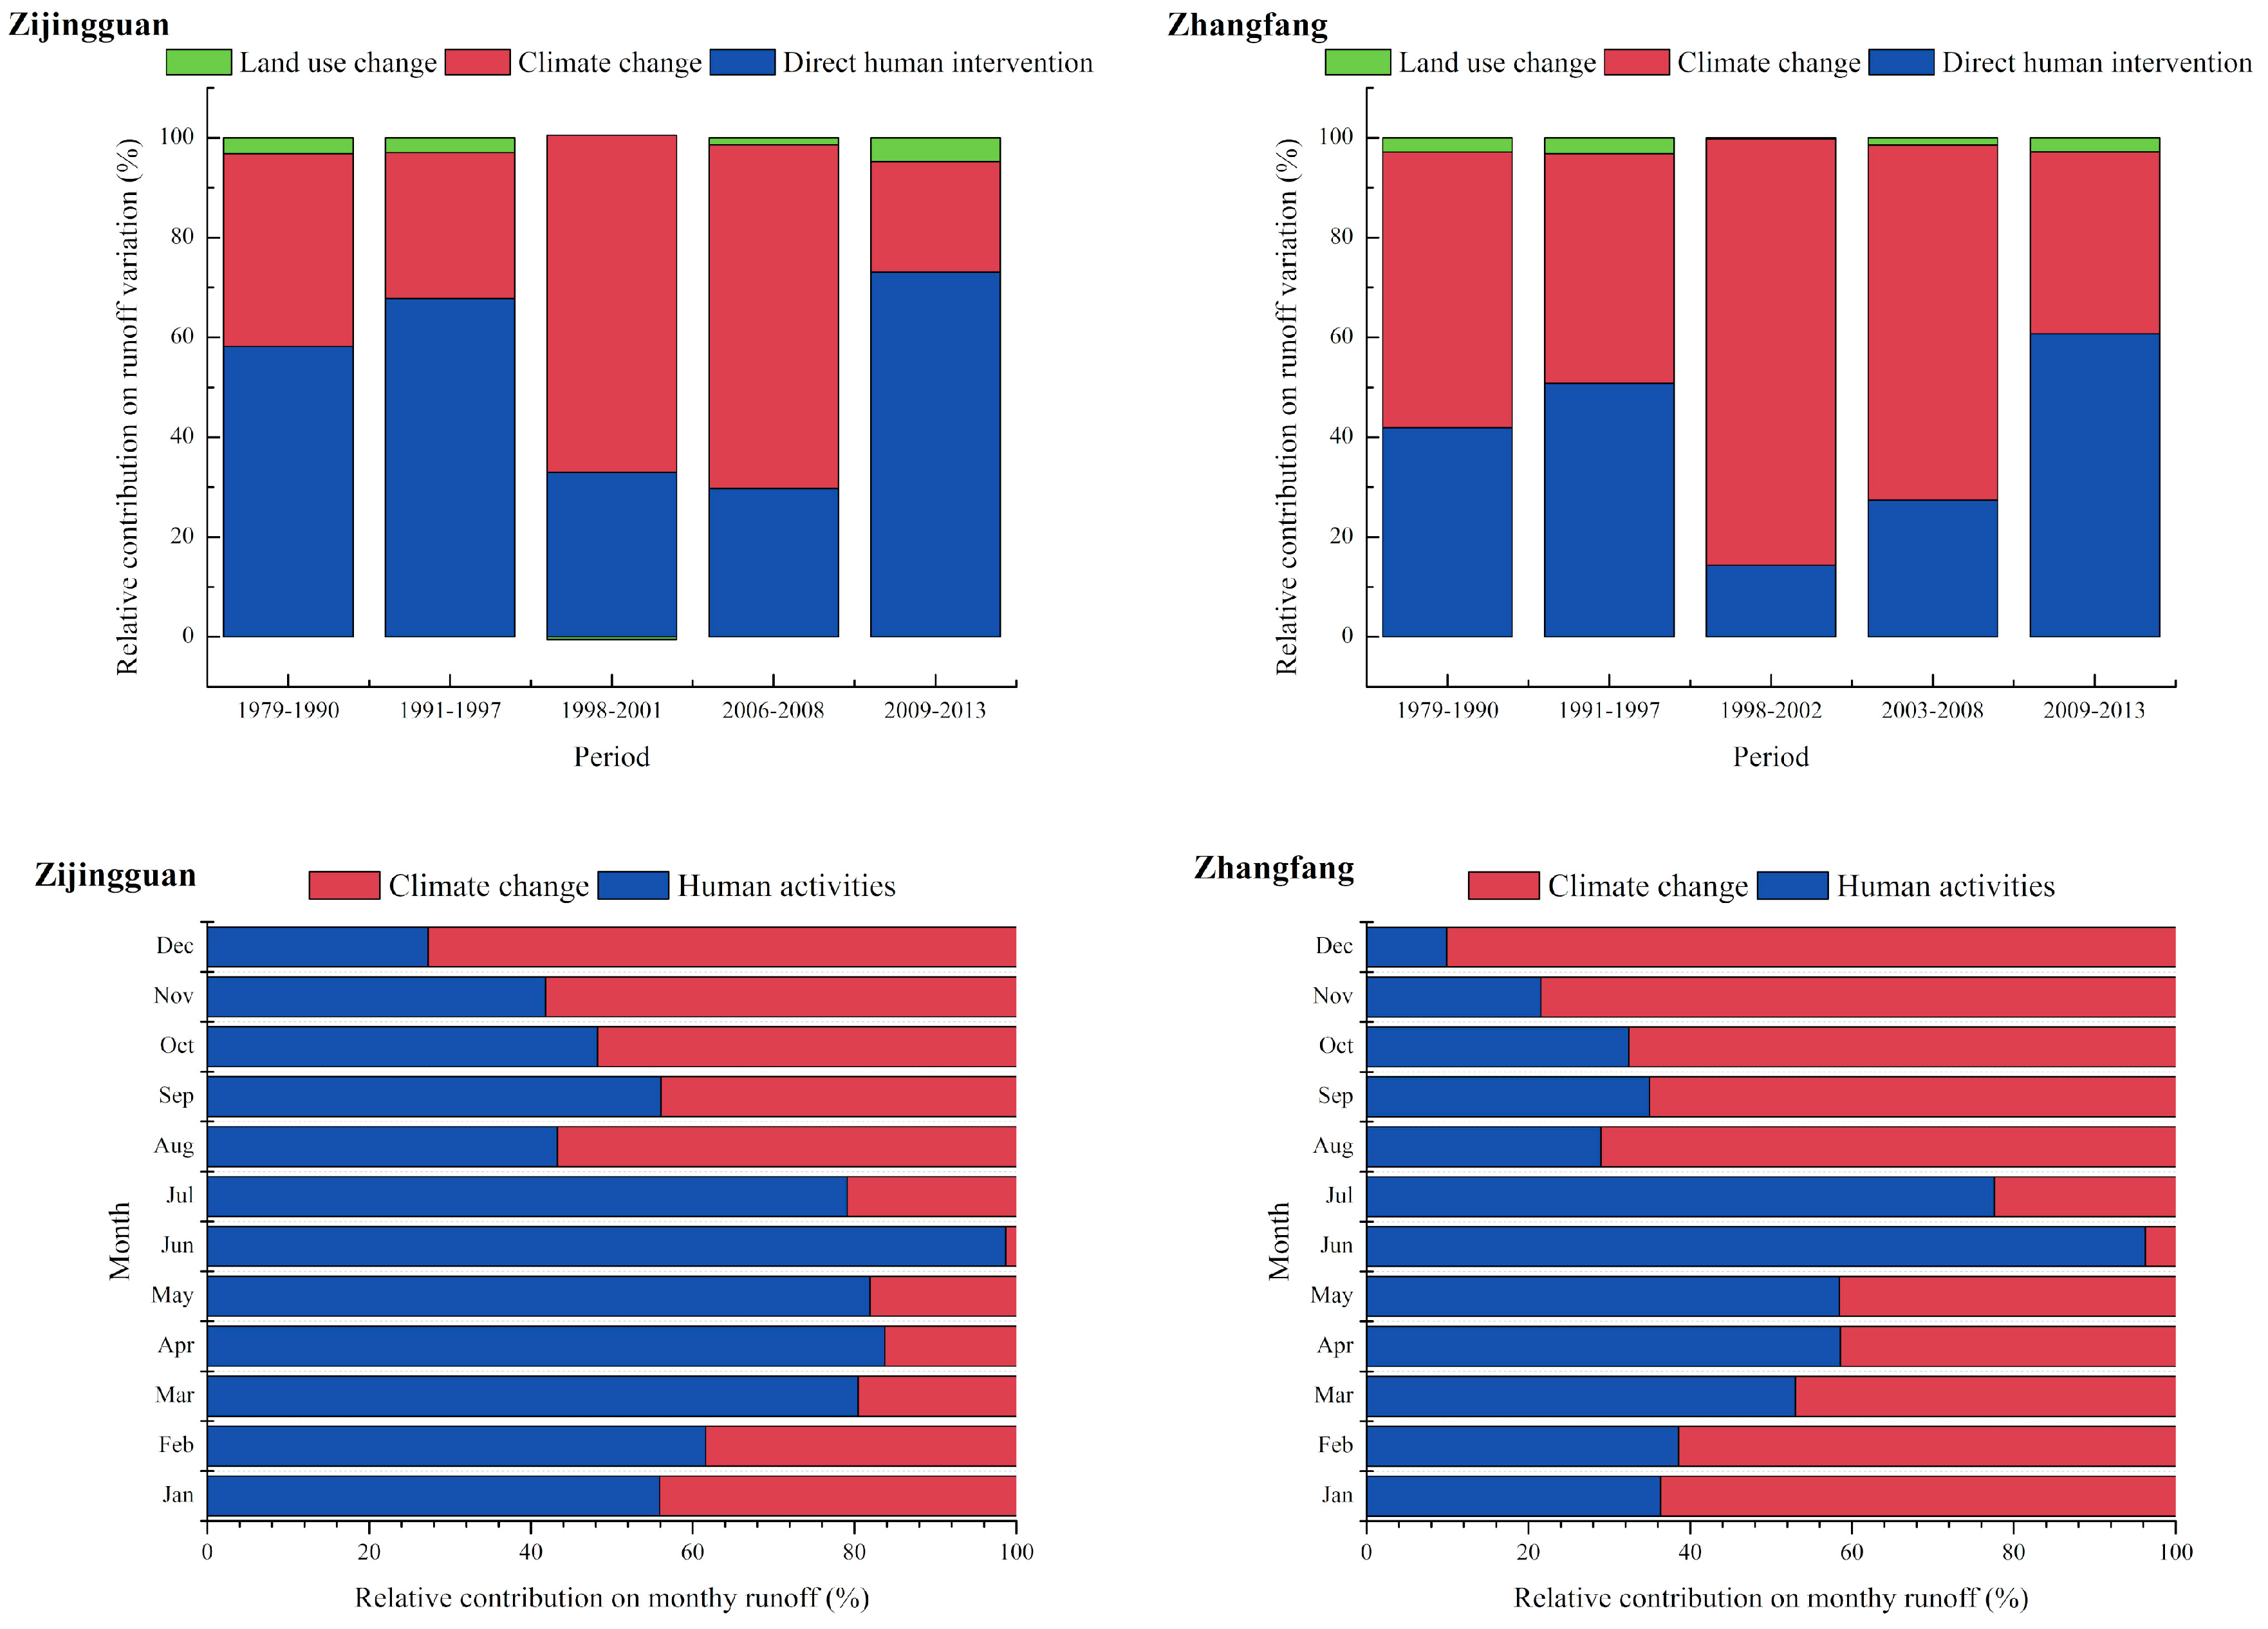
In order to evaluate the impact of climate change, land use change, and human direct intervention on the runoff variation, the altered period was divided into 1979–1990, 1991–1997, 1998–2002, 2003–2008, and 2009–2013 (the runoff data of Zijingguan Station during 2002–2005 was missing). Additionally, the land use map of the late 1980s, 1995, 2000, 2005, and 2010 is the representative underlying surface regime in above five periods. The inputs and outputs of the model in different scenarios are listed in the Supplementary material (Table S1–S4).
The results of attribution analysis are shown in Figure 9. Overall, the degrees of effects on the runoff of different factors at the two stations were roughly consistent. The impact of climate change was more obvious in the whole Juma River basin, while the runoff variation of the upstream was mainly affected by human activities. Initially, runoff variation was collectively controlled by climate change and human direct intervention at Zhangfang Station, but the effect of human direct intervention (58.2%) was even stronger at Zijingguan Station. In 1991–1997, the contribution of human direct intervention climbed 9.6 percent (8.9 percent) at Zijingguan Station (at Zhangfang Station) from the previous period. Then, during 1998–2008, climate change played a dominate role in runoff reduction, especially at Zhangfang Station. The contribution of climate change was largest (85.5%) at Zhangfang Station in the period of 1998–2002, and was largest (68.8%) at Zijingguan Station in the period of 2006–2008. Nevertheless, the impact of human direct intervention certainly overwhelmed the influence of climate change at two stations after 2009. It is worth noting that the relative contribution of land use change was very small over the entire study period, and was even negative at both Zijinguan Station (from −0.5% to 4.8%) and Zhangfang Station (from 0.2% to 3.2%). However, each absolute value was less than the threshold (12.15%), so it can be deduced that land use change in the Juma River basin has had almost no effects on runoff decreasing.
The relative attribution of climate change and human activities to monthly runoff change exhibited some regularities that varied from season to season. Runoff was mainly drawn by human activities in summer, and the effect intension tended to weaken as the climate became cold. On the contrary, the colder the weather, the greater the impact of climate change on runoff reduction. At Zijingguan Station, the contribution of climate change reached the maximum (72.73%) in December, and that of human activities reached the maximum (98.66%) in June. Similarly, the contribution of climate change reached the maximum (90.10%) in December at Zhangfang Station, and that of human activities reached the maximum (96.27%) in June. However, there was an exception in that the runoff variation of the two stations was actually more influenced by climate change in August.
4. Discussion
4.1. The Effects of Climate Change on Runoff
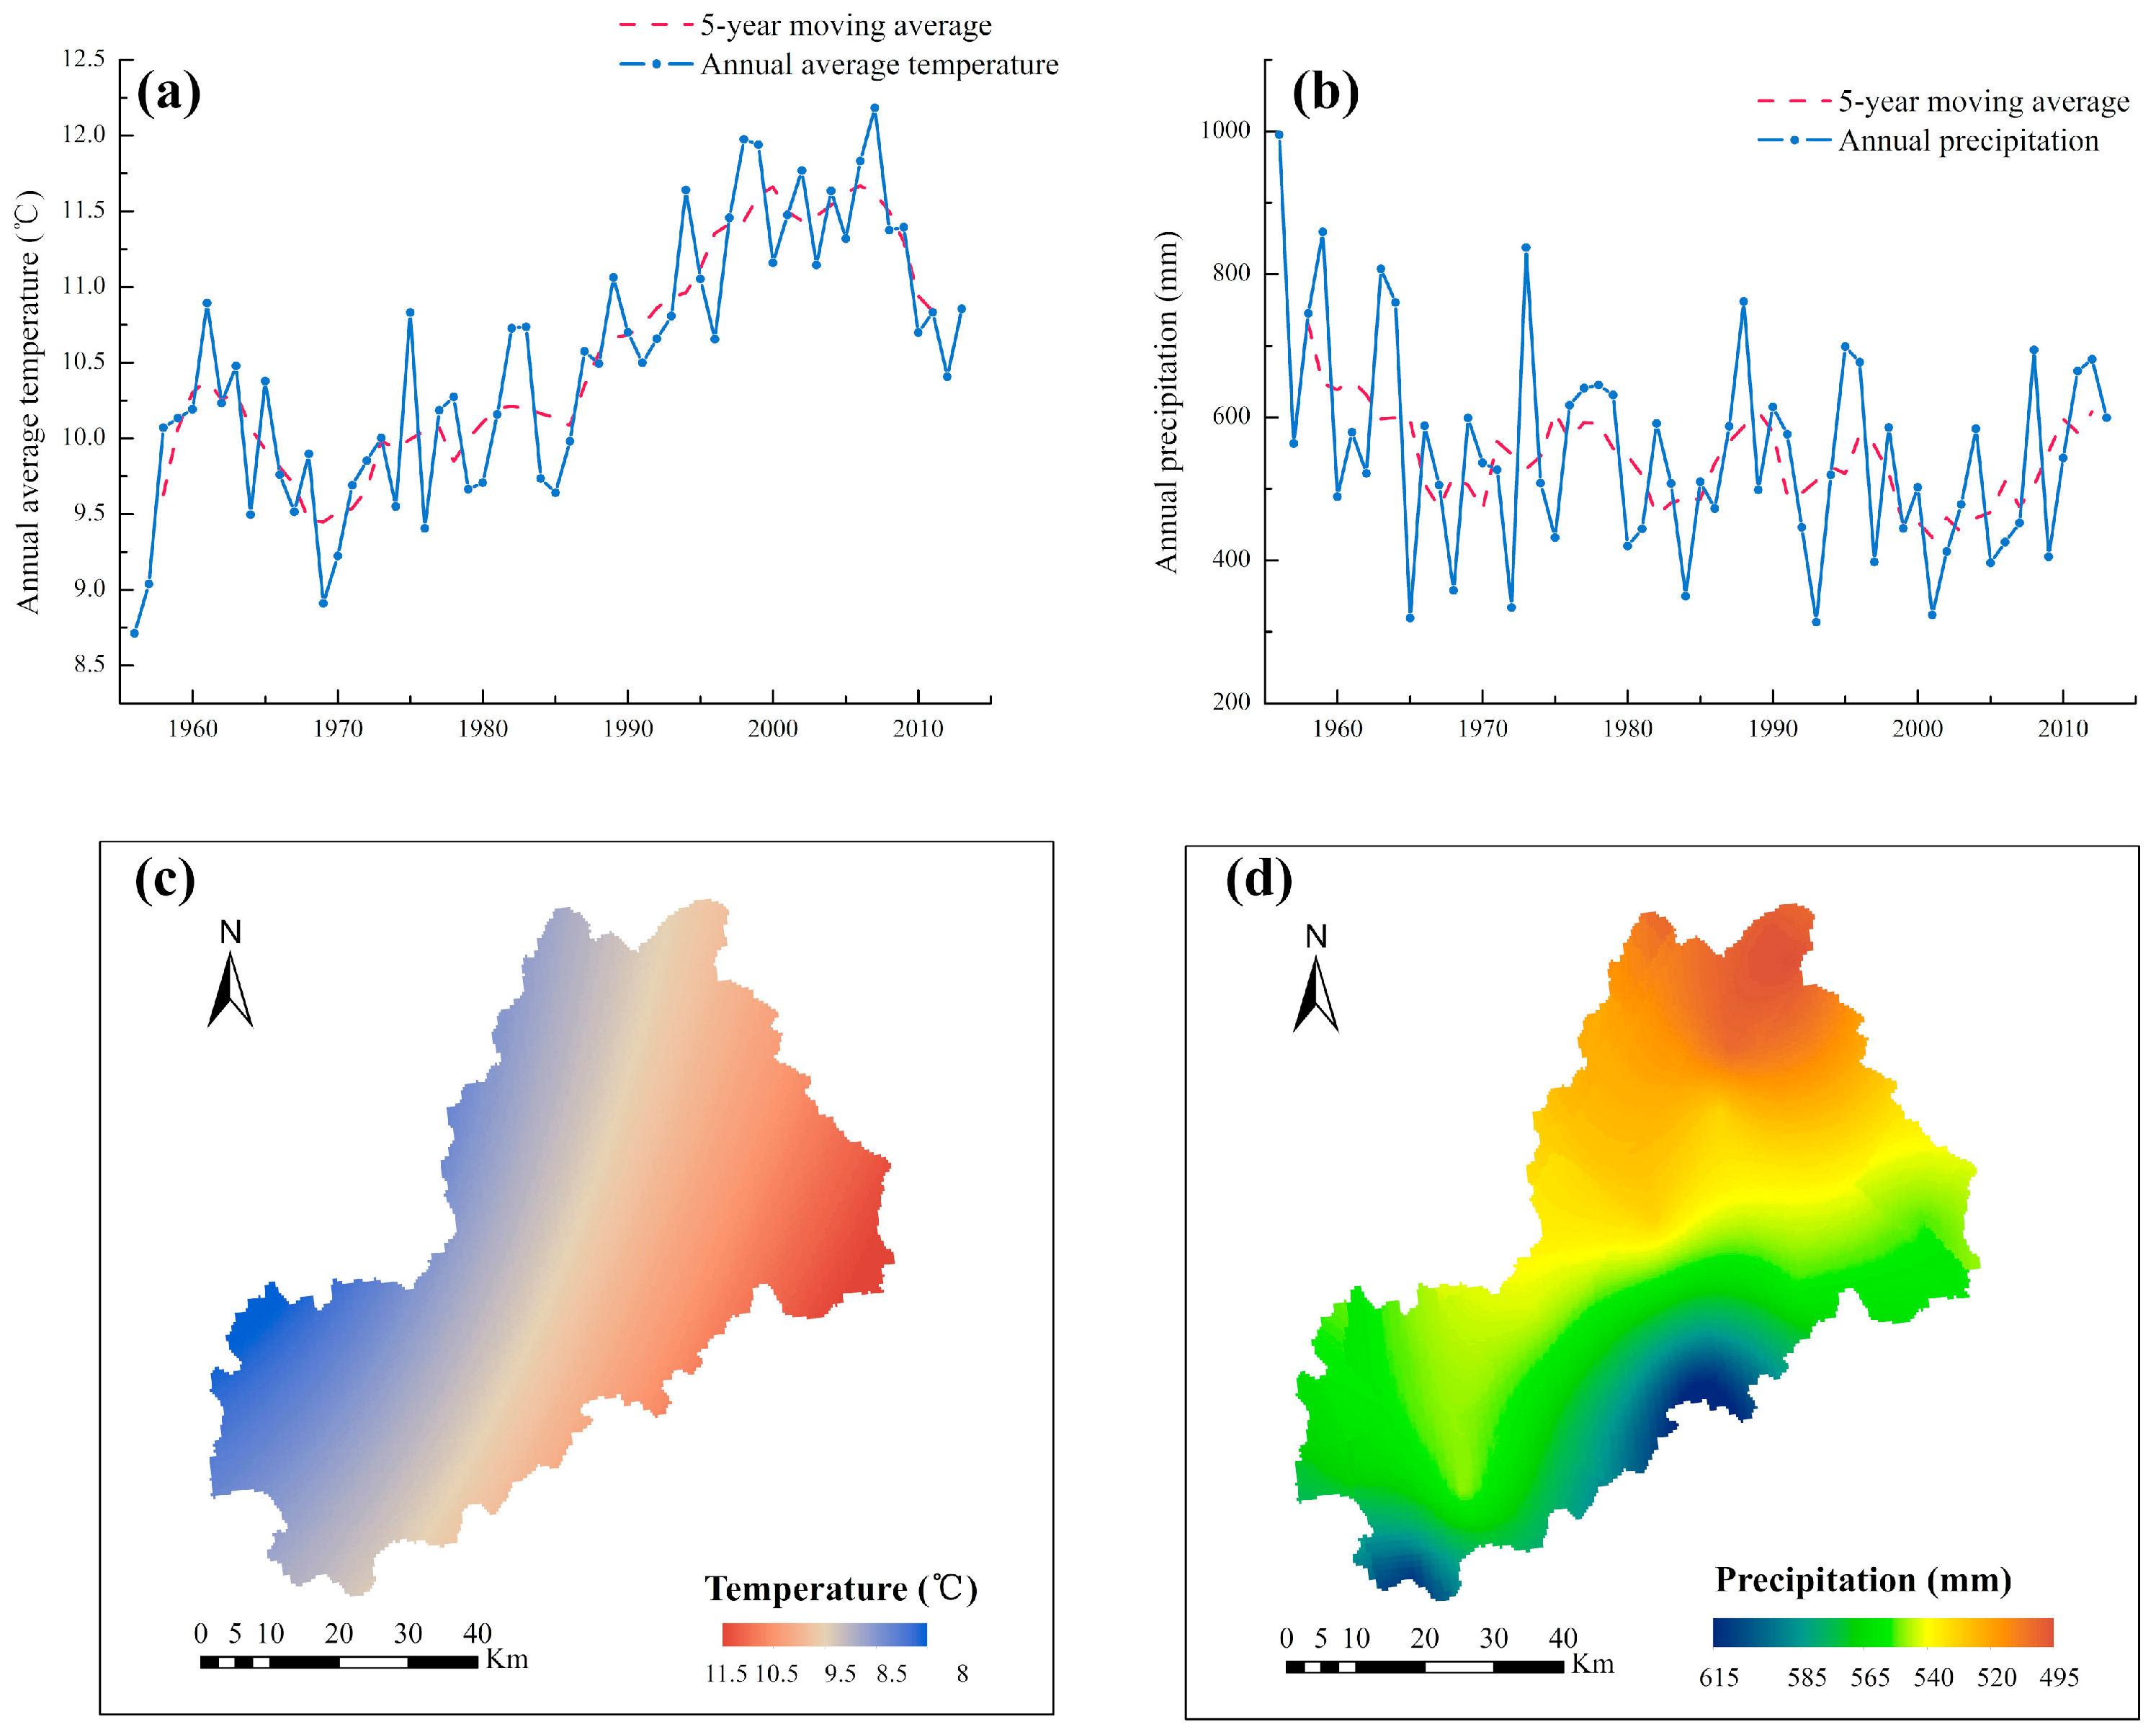
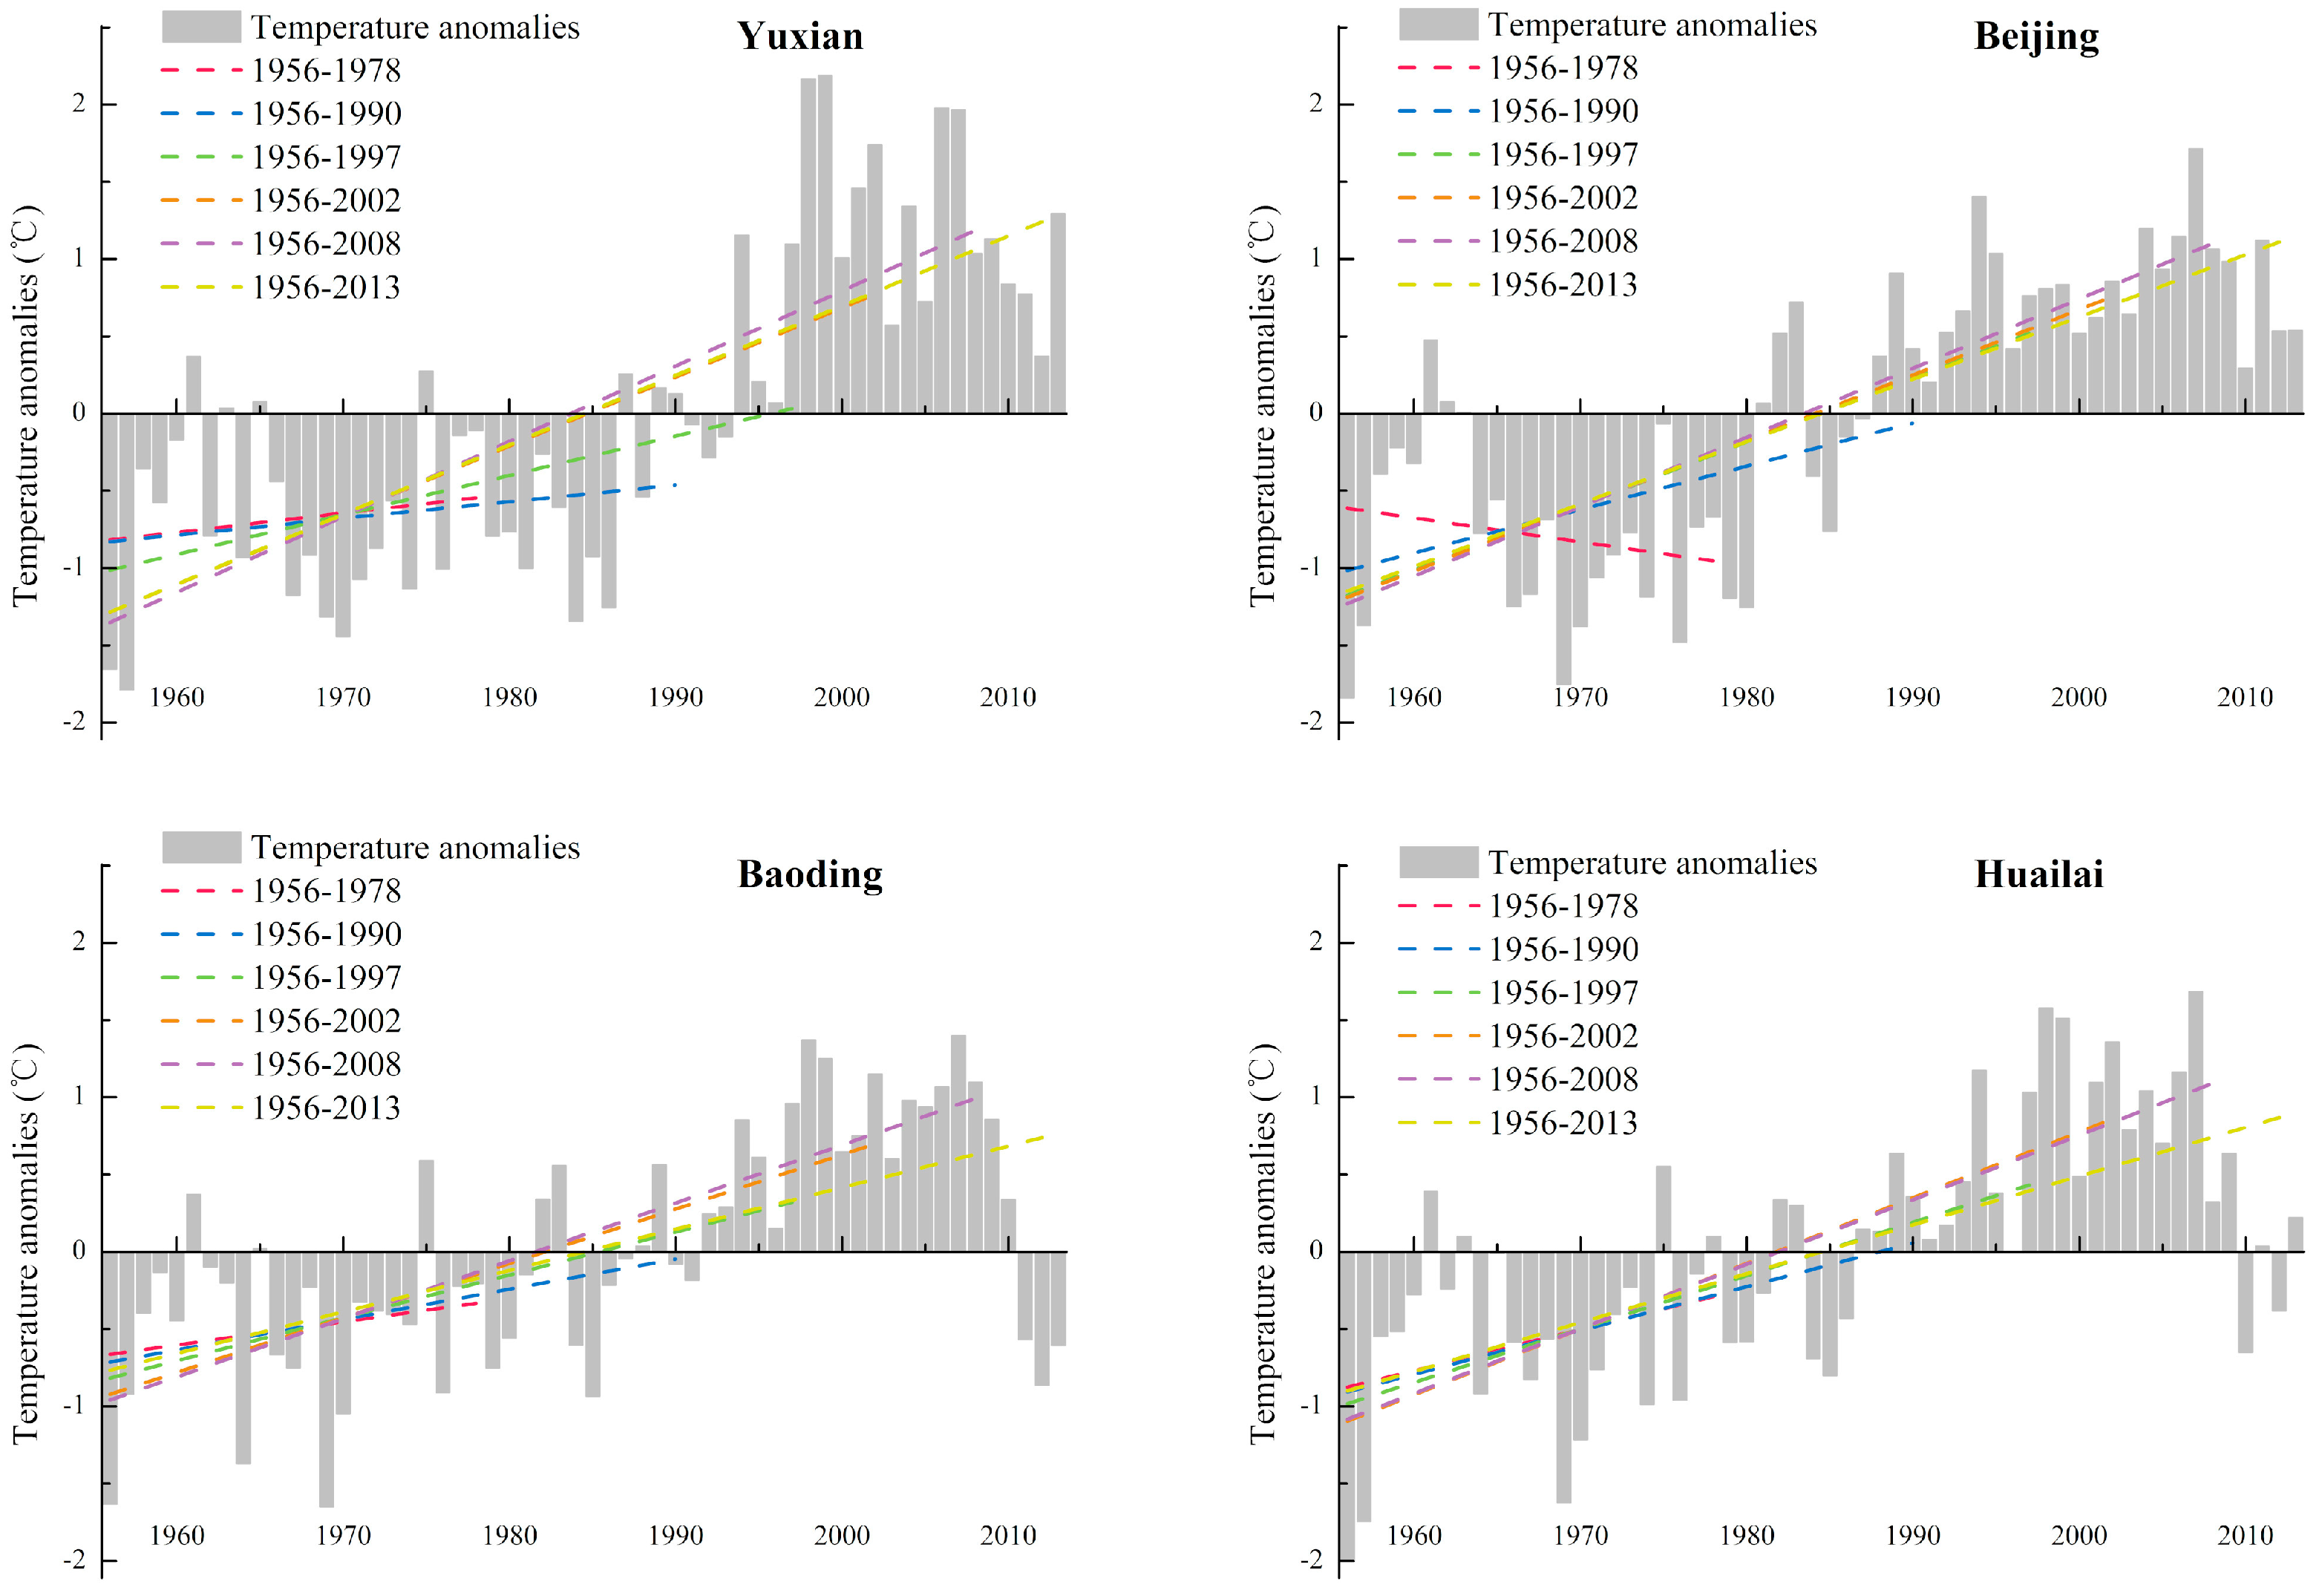
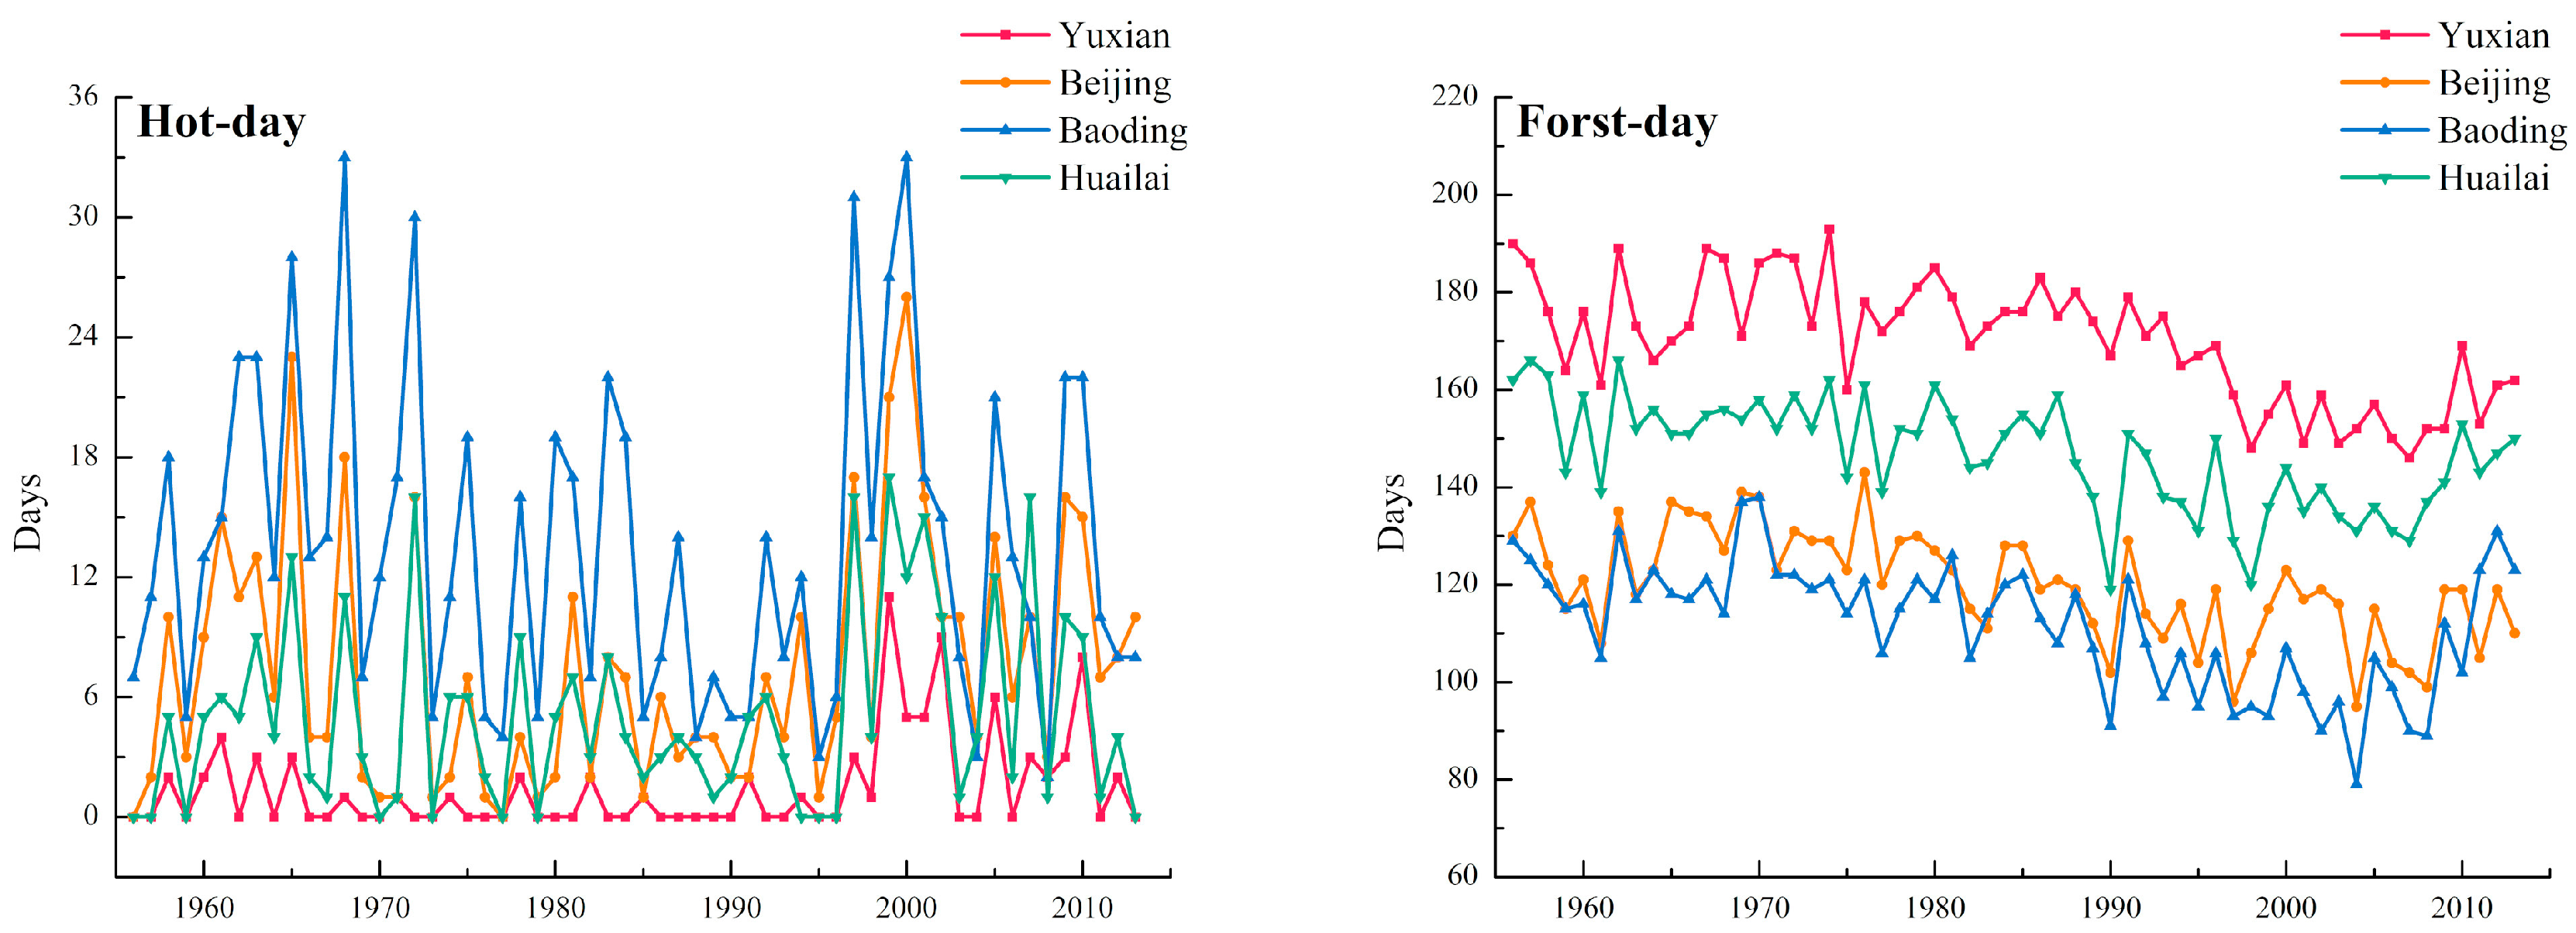
In order to investigate the impact of climate change on runoff variation, regional change of temperature and precipitation in the Juma River Basin was statistically analyzed from different angles. The annual average temperature over the period of 1956–2013 was 10.5 degrees Celsius, which decreased from southeast to northwest and decreased with elevating altitude (Figure 10). The MK results of measured data from meteorological stations around the study area indicated that the warming trend of temperature in the Juma River Basin was evident at the 0.001 significance level (Table A1). The change point of annual mean temperature series at four meteorological stations was 1986 or 1987 (at the 0.001 significance level), as shown in Figure A1, which was later than that of the annual runoff series. Annual temperature anomalies changes [63] in the period of 1956–1978, 1956–1990, 1956–1997, 1956–2002, 1956–2008, and 1956–2013, were employed to study the regional temperature evolution (Figure 11). During the baseline period (1956–1978), Yuxian Station, Huailai Station, and Baoding Station showed an increasing trend, while Beijing Station showed a decreasing trend. However, as the research period became longer, the downward trend was gradually replaced by an upward trend, and the increasing trend was becoming more and more obvious. What is more, the slope of the trend lines peaked in 1956–2008 and declined in 1956–2013, especially in Hauilai Station and Baoding Station. To characterize the changes in extreme weather events, the number of days that the temperature exceeded 30 degrees Celsius (hot-day) or dropped below 0 degrees Celsius (frost-day) every year was extracted separately (Figure A2). Only the hot-day series of Beijing Station passed the MK test, with a significance level of 0.05, and there was a slight uptrend. Conversely, frost days during 1956–2013 at four stations dramatically reduced under the 0.001 significance level, which may be the reason why the annual average temperature of the study basin rose over the past decades.
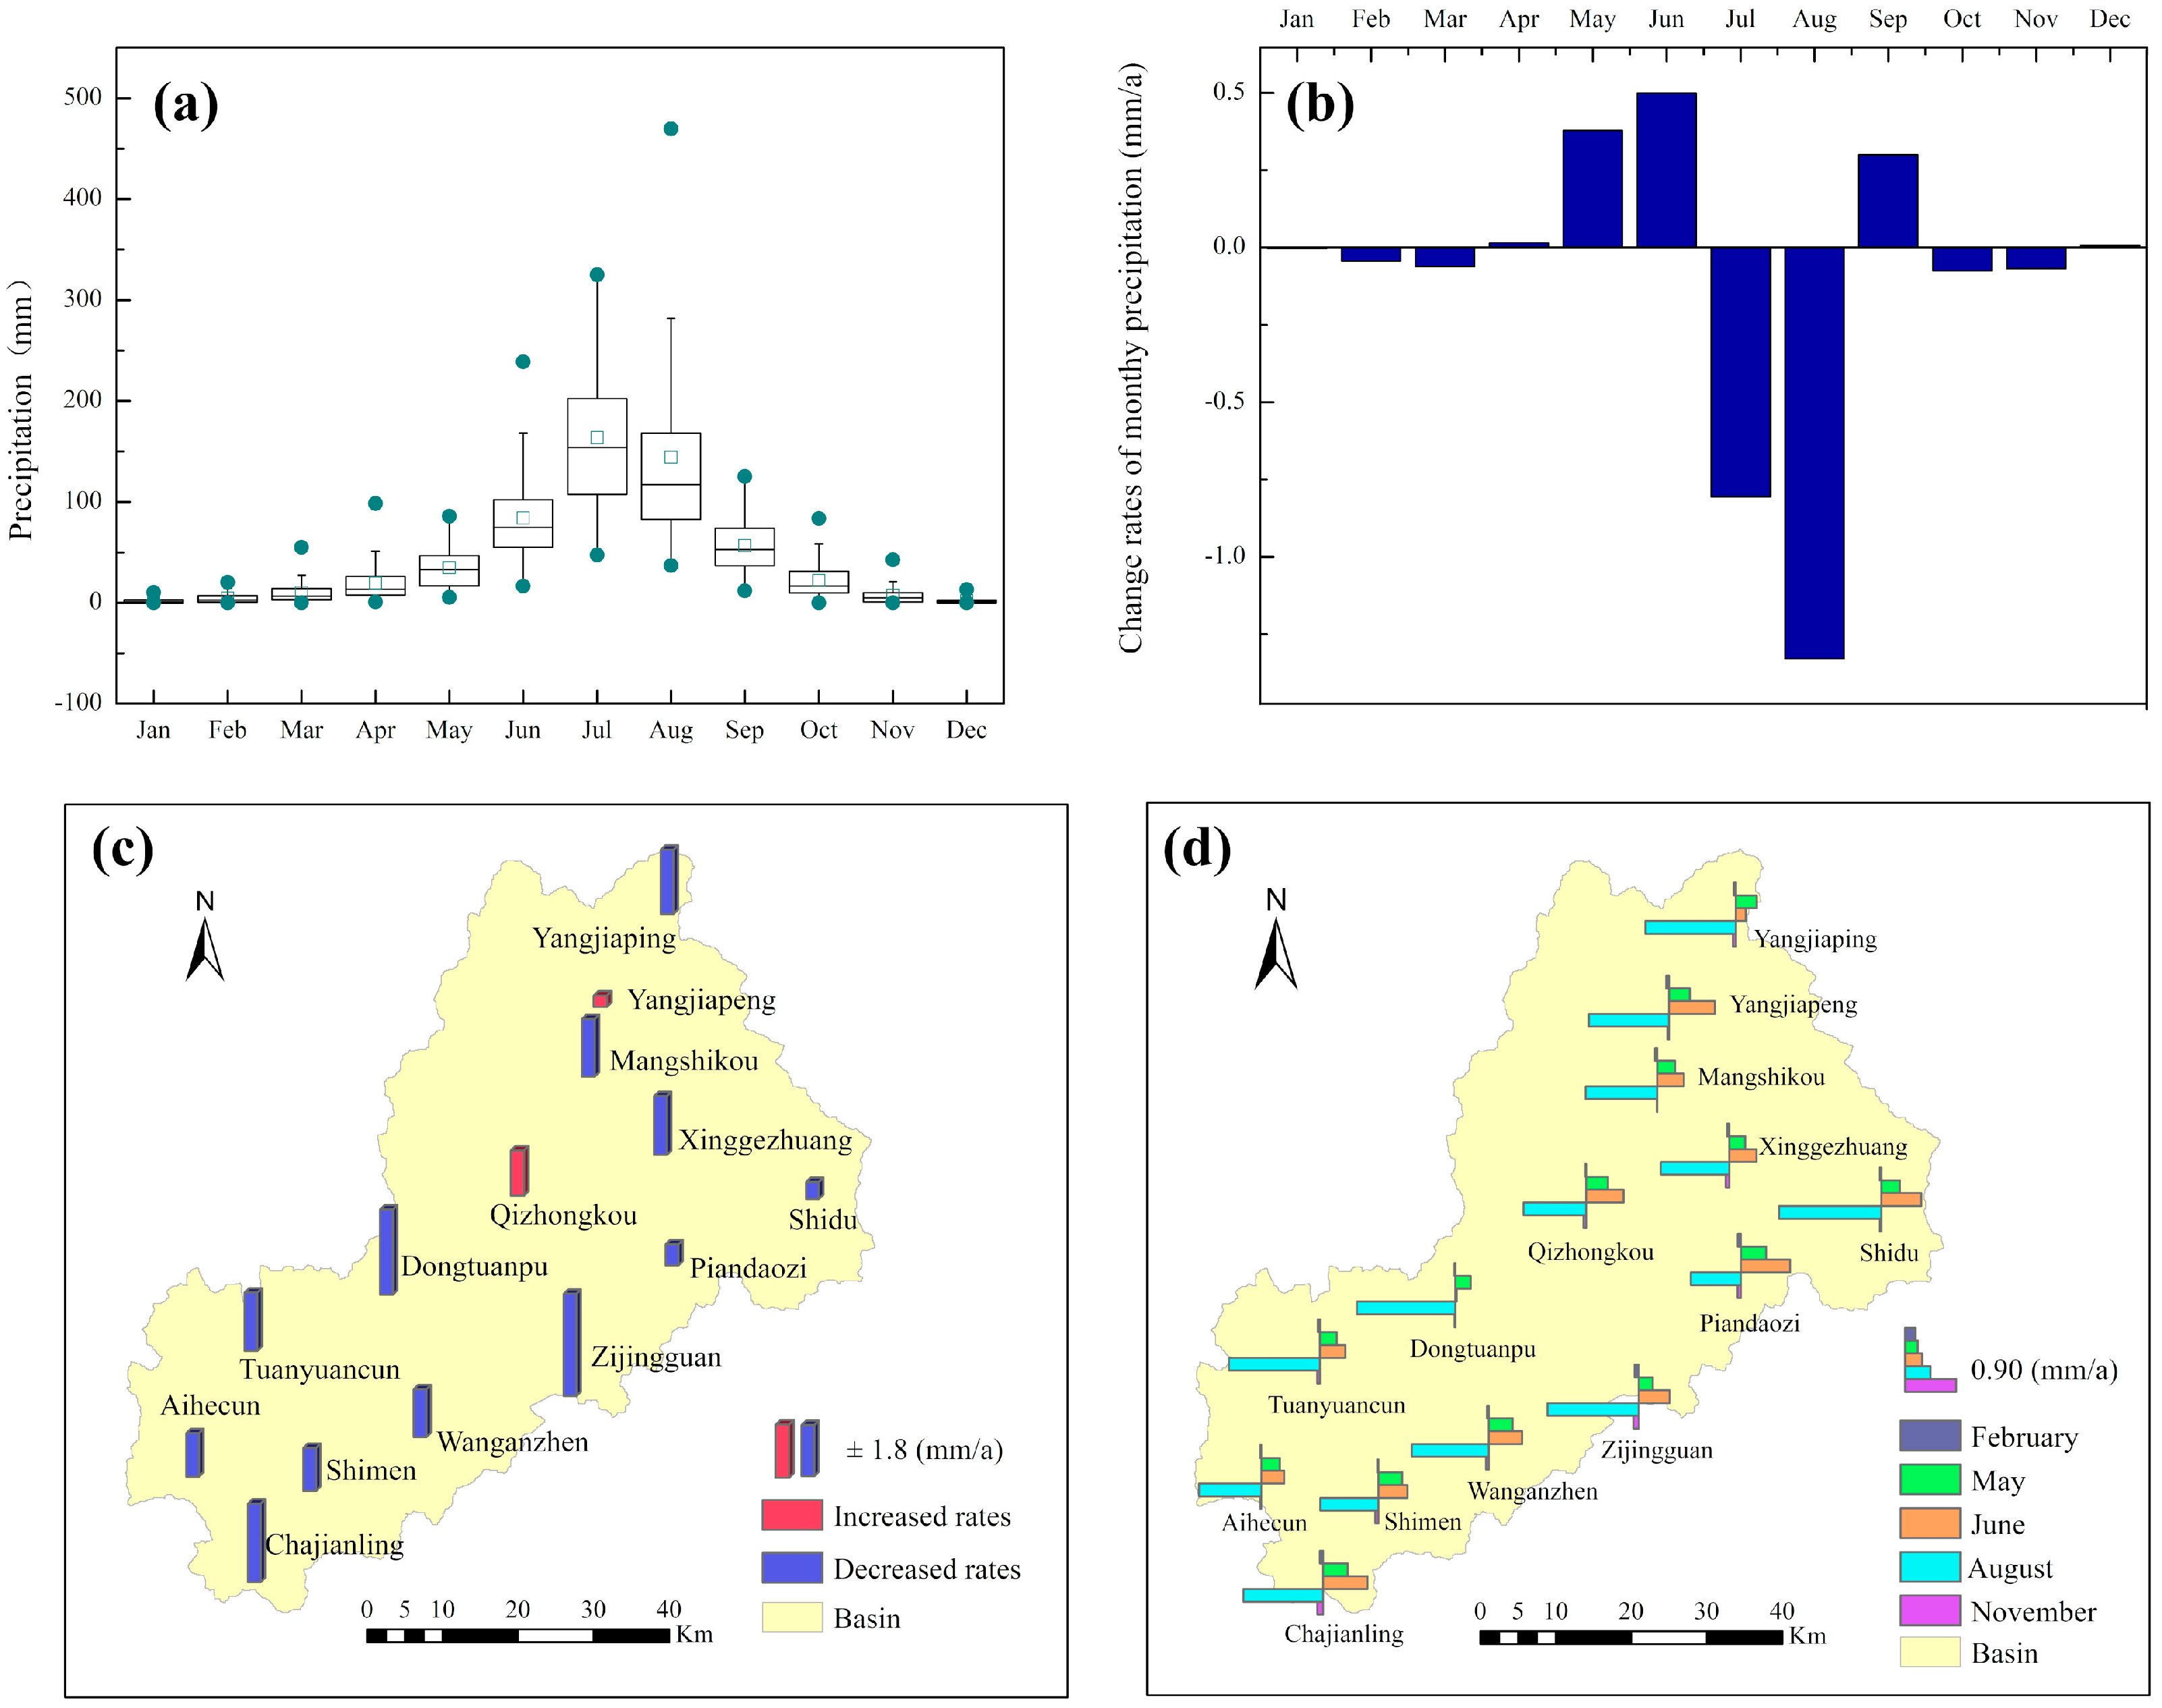
Figure 10 shows that the south of the Juma River basin was wetter than the north, and the precipitation gradually increased from north to south. The temporal distribution of rainfall throughout the region was extremely uneven (Figure 12a). The precipitation from November to March accounted for only 5% of the total amount. From April onwards, the rainfall began to increase with the increasing temperature and reached its peak value in July and August. Moreover, some extreme precipitation events occurred in the August of some years. The result of the MK test revealed a slight decrease in regional precipitation, and the annual amount of precipitation time series at half of the stations passed significance inspection (Table A2). Besides, there was no abrupt change in precipitation series at 14 stations. The mean monthly precipitation data series exhibited a mixed changing trend. Five months showed an increasing trend, while the rest showed a decreasing trend. The greatest reduction was for precipitation in August, with a decrease of 1.33 mm/year.
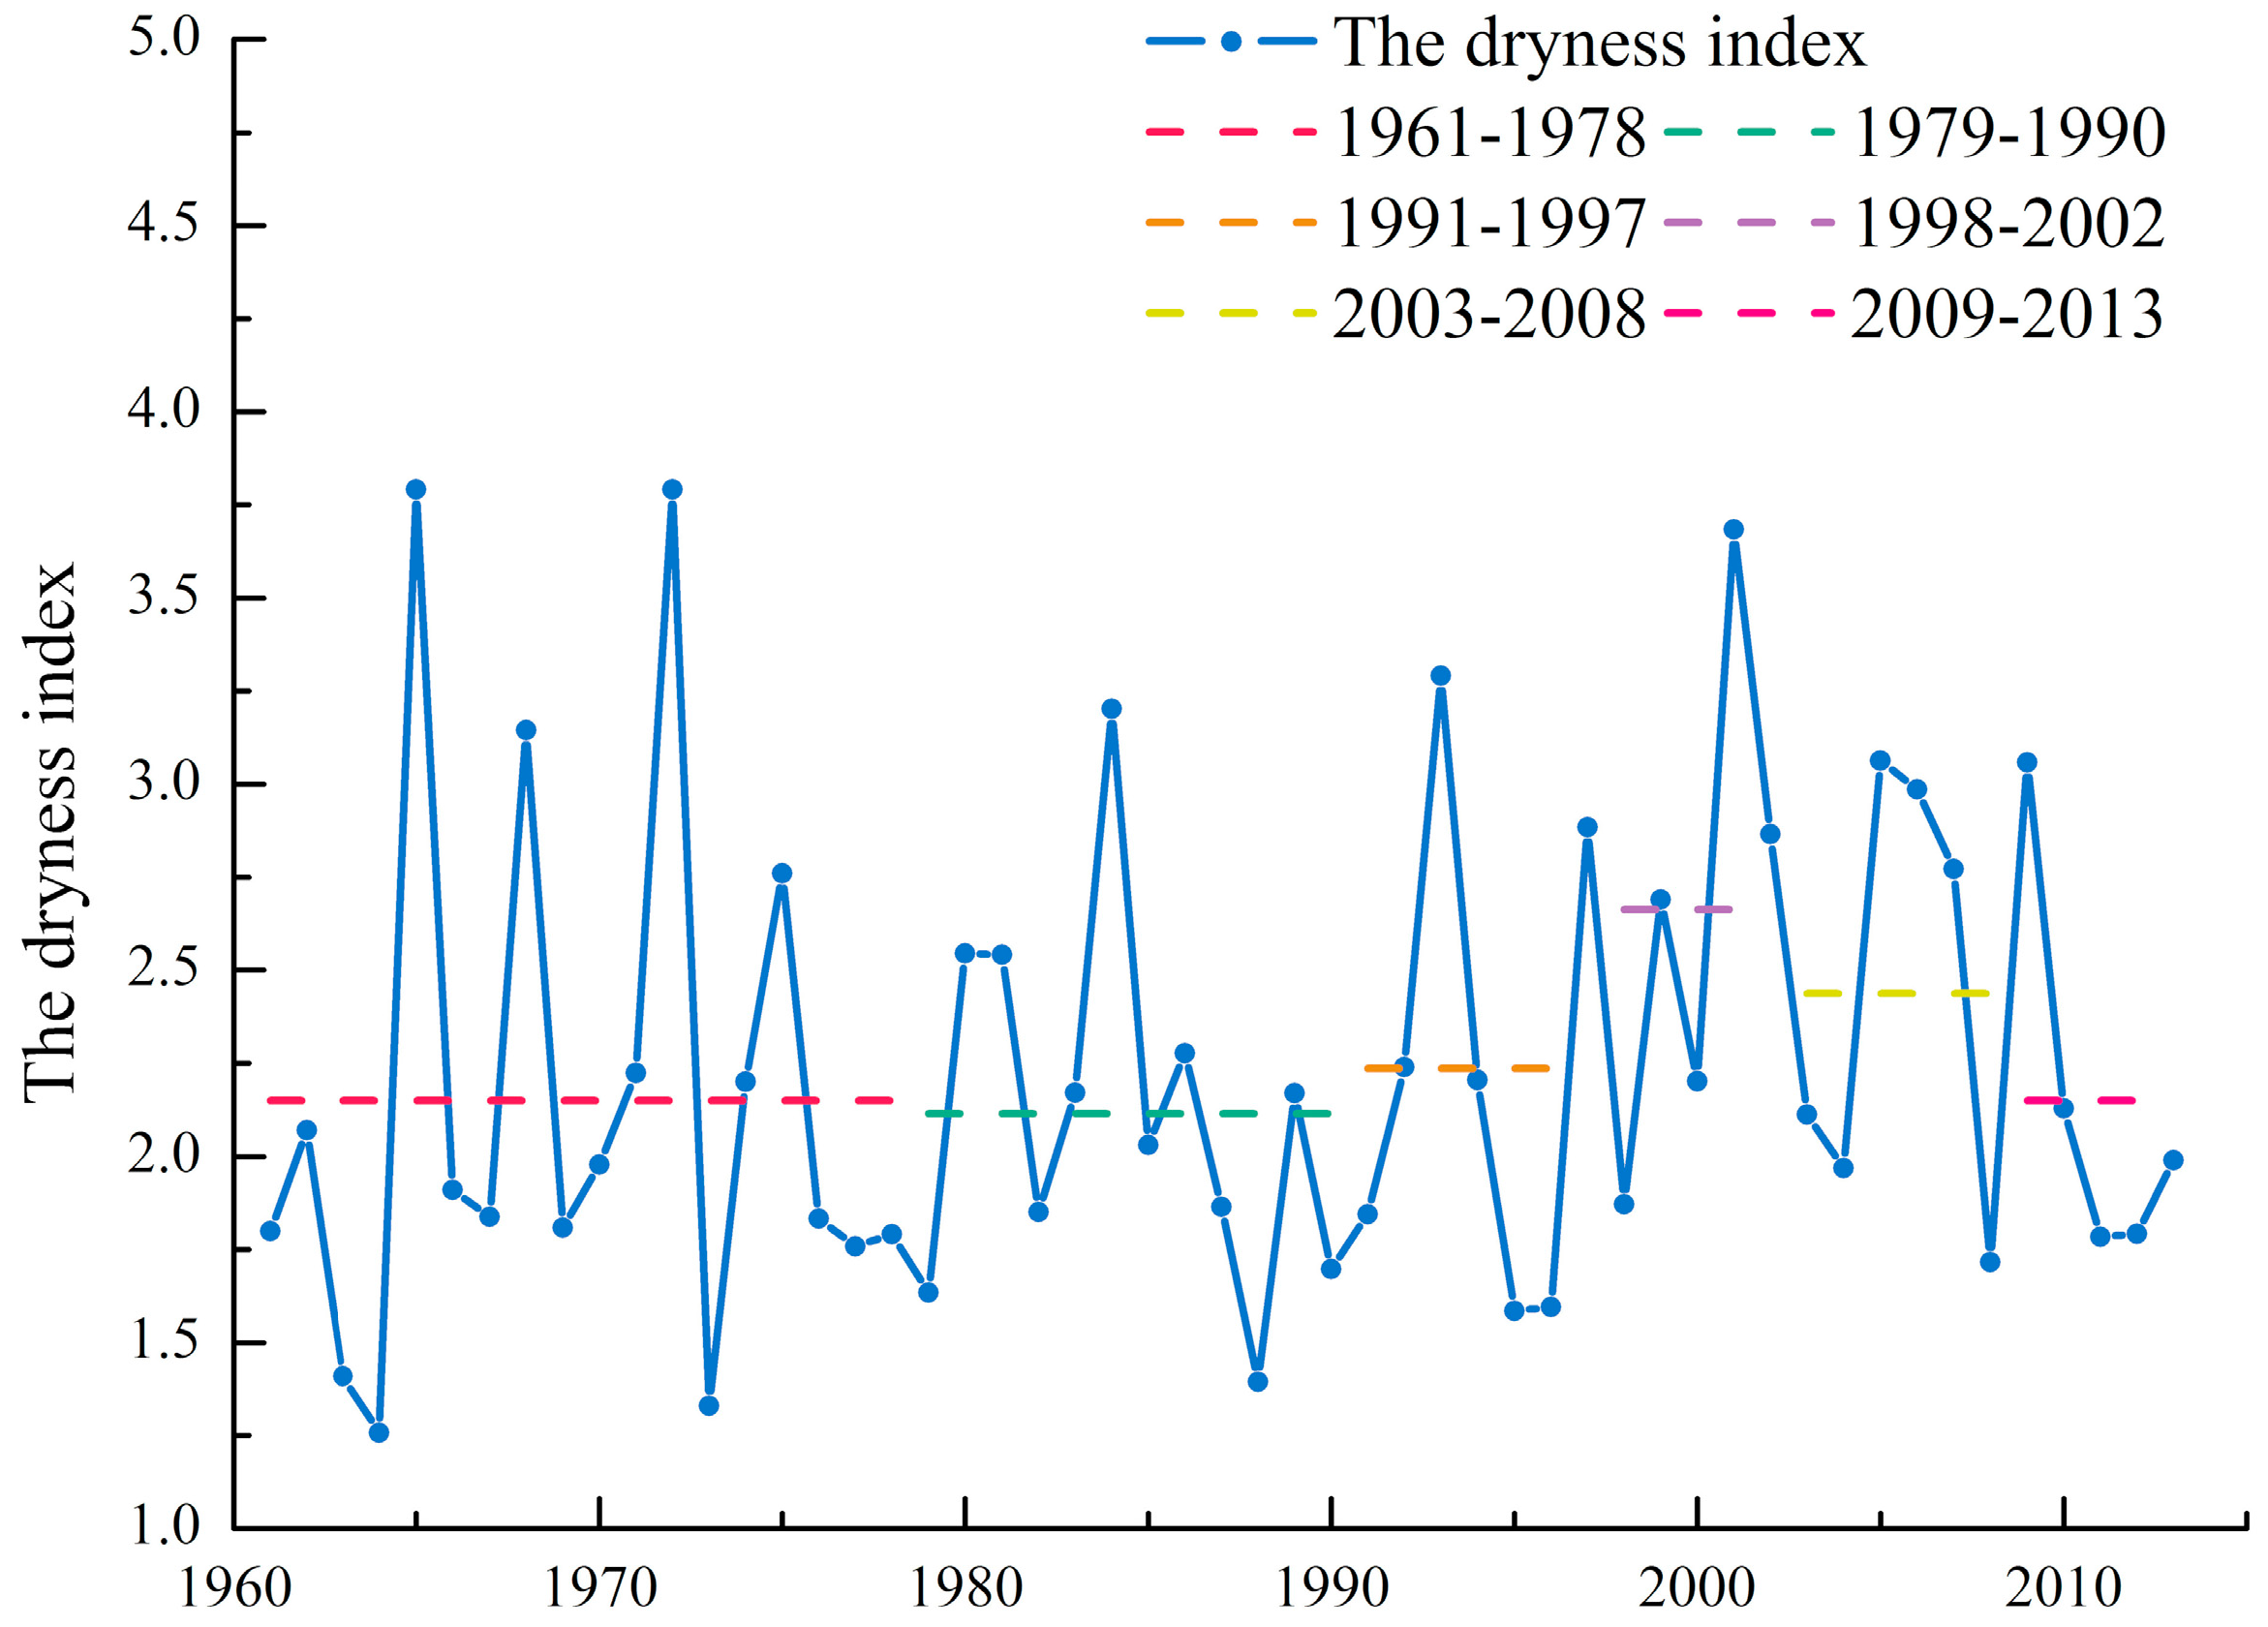
Given the above, the Juma River Basin became hotter and less humid in past decades. Generally, the temperature rise can increase evaporation and then decrease the runoff in the water circulating processes. Meanwhile, regional precipitation decreases may directly aggravate the reduction of runoff. Hence, to some extent, climate change in the study area resulted in the decline in water of the Juma River. During the two periods of 1998–2002 and 2003–2008, the drought index () reached its peak (Figure 13), which led to the largest relative contribution of climate change to runoff reduction at two stations.
4.2. The Effects of Land Use Change on Runoff
The main land use types of the Juma River Basin were agriculture, forest (dense forest, shrubwood, and open forest), and grass, which accounted for about 98.5% of the entire region, as shown in Table 4. Overall, there existed some slight changes in land use of the region in the past few decades. From the late 1970s to 2000, land use conversion mainly occurred in the northeastern part, that is, in the middle reaches of the basin. The area of open forest and shrubwood decreased, while the dense forestland and grassland slightly increased. After 2000, the land use of the region basically reverted to its previous state. During the study period, the area of urbanization in the upper reaches of the basin, controlled by the Zijingguan Station, increased gradually, thus making the area of agricultural land smaller.
In order to explore the possible impacts of land use change on hydrological processes, we selected two regions with obvious land use change and a large water yield (Figure 14). AREA 1 and AREA 2 were located in the middle and upper reaches of the basin, respectively. The hydrological processes of both AREA 1 and AREA 2 were associated with the streamflow of Zhangfang station, and the water yield of AREA 2 had direct effects on the streamflow of Zijingguan station. The area-weighted mean of WYLD (water yield) was extracted under each scenario and then compared with the simulated value of the original underlying surface (the late 1970s). It was found that the change of the underlying surface had a slight effect on the water yield of the sub-basin. In AREA 1, the water yield of different scenarios was about 0.8–1.4 mm smaller than that of the original underlying surface scenario in five stages during the altered period. In AREA 2, the value change is around −0.5 mm to 8.7 mm.
The relationship between forest change and the hydrological process is a worthy topic. A series of studies [64,65,66] in the Dragonja catchment (SW Slovenia) indicated that natural reforestation from 1954 to 2002 directly led to the reduction in discharge (75%) and sedimentation (85%) and narrowing incision of the riverbed. Though the forest area has increased in this region, the difference of water yield under different scenarios was small compared to the total amounts and can be almost negligible, as it was most likely to have resulted from system error. Hence, our conclusion is that land-use types in Juma River basin have changed weakly over the study period, which had less impact on runoff variation.
4.3. The Combined Effects of Climate Change and Human Direct Intervention on Runoff
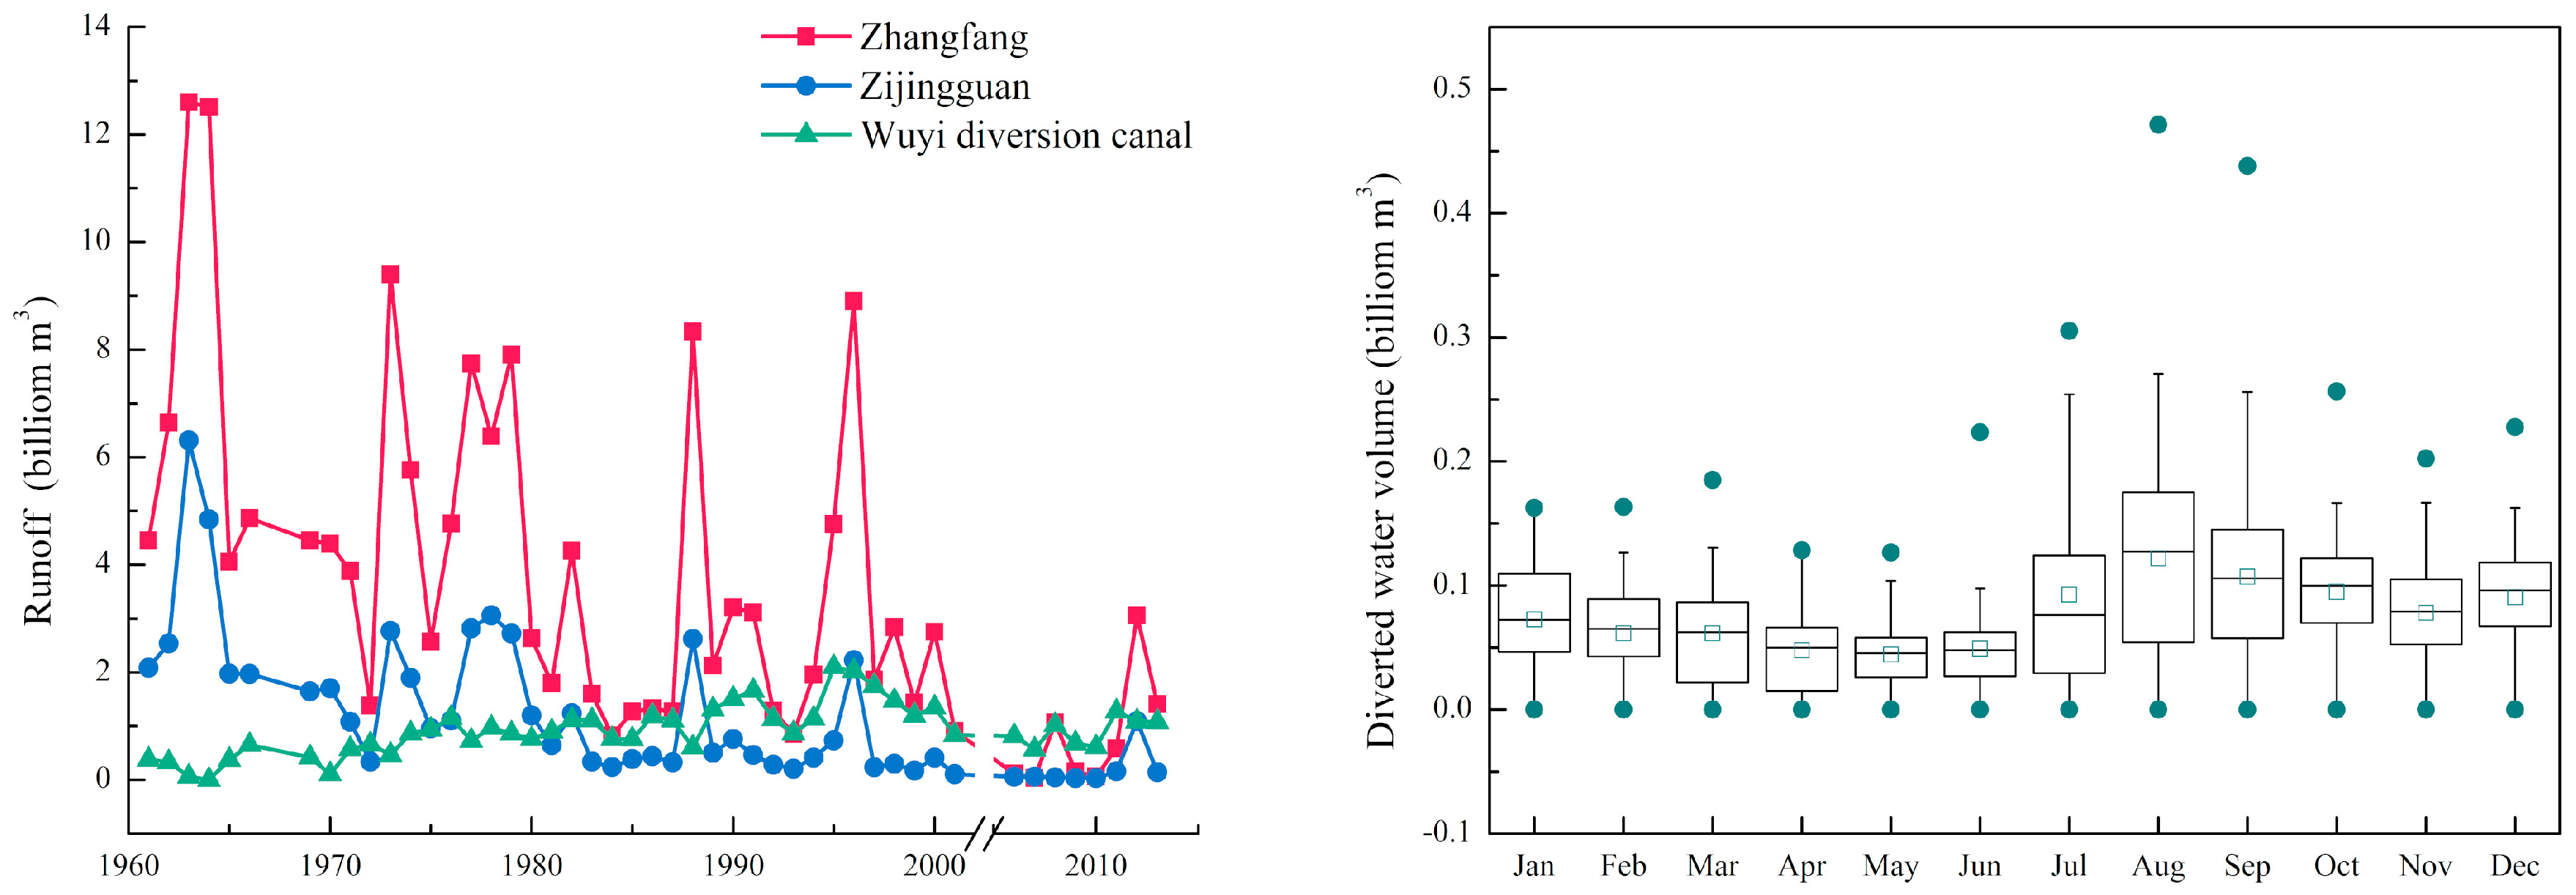
Human direct intervention influenced the runoff in the Juma River basin, mainly by water diversion for agricultural, domestic, and industrial purposes. The construction of water intake engineering played an important role in local development. Wuyi diversion canal is a project of interbasin water transfer by which part of the water in the Juma River was transported into Angezhuang Reservoir. The annual mean diverted water volume during 1959–2013 was 0.89 billion m3. The canal mainly provided drinking water for 13 million in Yi County, as well as irrigation water for Yishui Irrigation District and Shengli Irrigation District [67]. Moreover, it met requirements for landscape water in Western Qing Tombs and hydroelectric power along the way. In addition, Wuyi diversion canal could relieve any excess water from Juma River in the flooding season and supply water to Baiyang Lake through Angezhuang Reservoir in the dry season [68]. Guandaoling diversion canal is also a project of the interbasin from Juma River to Longwang Reservoir in Yi River. The annual mean diverted water volume during 1977–2005 was 0.3 billion m3, of which 76 % was used for irrigation and landscape water and 24 % for domestic and industrial use [67]. Shengtian diversion canal, which is about 21 km long, was a source of drinking and irrigation water along the way, and annual mean diverted water volume was about 0.1 billion m3. Among the diversion projects mentioned above, the impact of Wuyi diversion canal on the natural runoff process of Juma River is the most serious and the longest. Based on the diverted water volume of the Wuyi diversion canal during 1961–2013 (the data during 1968–1969 and 2002–2005 were missing), the effect of the human direct intervention on the runoff of the Juma River was discussed in this paper.
Since the 1960s, water withdrawal of Wuyi canal has increased gradually and reached a peak value in 1995. Followed by a slight decline, it returned to a stage of positive growth after 2010 (Figure 15). Extreme precipitation occurred in the Haihe River Basin during the summer of 1995 and 1996 [69]. In order to save downstream communities from the flood, a large quantity of water was diverted from the river into Angezhuang Reservoir through the Wuyi canal, and the annual diverted water volume of 1995 and 1996 was 2.10 billion m3 and 2.03 billion m3, respectively, the highest ever recorded. The contribution of human activities to runoff during 1991–1997 was a little larger than that of the previous period. During 1998–2008, the drought index exceeded long-run averages. Resulting from the violent change of climate, the runoff in Juma River sharply decreased, and there was a corresponding drop in water withdrawal. The annual diverted water volume of 2002 was only 7467 million m3, which was the smallest amount over a decade [67]. Meanwhile, the impact of human direct activities was much lower than that of climate change in this period. After 2009, the river was replenished because the climate became more humid and rainy. During this period, human activities during this period played a dominant role in the decreasing runoff at two stations owing to the increasing water withdrawal of Wuyi canal.
Water withdrawal through Wuyi diversion canal was not evenly distributed throughout the year. It was relatively small from April to June and peaked in August and September, which was almost determined by the amount of rainfall and water demand. In winter, the climate was cold and dry, and the water of the Juma River was diverted to meet the domestic and industrial needs of the urban population. Because the Juma river never froze in this season, remarkable temperature rising in this season led not to ice melting and runoff increasing, but to runoff reduction. Although the diverted water in this season was not the smallest amount of the year, the impact of climate change overwhelmed the influence of human activities owing to the violent variation of temperature. In the stormy summer months, large volumes of water were transported into Angezhuang Reservoir in order to reduce the flooding. This meant that the impact of human direct activities on runoff reduction was dominant during this season, except for August, and this exception was due to the obvious trend of climate change that precipitation decreased dramatically in August. Besides, the contribution rate of anthropogenic activity in June was the highest in the year. However, water withdrawal in this month was almost the lowest. This demonstrated that the relative contribution ratio of the two factors was mainly determined by climate change.
Hydrologic connectivity refers to the transport of matter, energy, and organisms from one part of the landscape to another through the hydrologic cycle, which can reflect the continuity of water flow and connectedness of the water system [70,71]. Water and sediment dynamics are usually divided into two portions: system phases (structural connectivity) and system fluxes (functional connectivity), and each part can be separately quantified in both temporally and spatially multiple scales through models and tracer experiments [72,73,74]. There are many factors (climate environment, landscape position, delivery pathway, soil type and structure, etc.) that can cause varying degrees of influence on hydrologic connectivity for a watershed scale [71,73]. Human alteration of the hydrologic cycle has the characteristics of complexity, but policy about land management and hydropower development was made in most regions, without giving sufficient thought to hydrologic connectivity [70]. Beguería et al. [17] found that land use change led to the water yield decreasing by about 30% between 1945 and 1995 in an irrigated district of the Central Spanish Pyrenees. The study, based on paired catchments, stated that vegetable cover is the main factor that affects the frequency, intensity, and timing of floods [13]. Marhaento et al. [52] argued that deforestation and urbanization increased the runoff coefficient from 35.7% to 44.6% and decreased the ratio of baseflow to streamflow from 40% to 31.1% in the Samin catchment of Indonesia, which may add to risks of flooding and drought. The comparative research on the abandonment of agricultural land in Mediterranean agriculture fields indicated that bare soils and low vegetation coverage led to higher soil loss and runoff, compared to natural vegetation recovery [75]. Good water management can not only satisfy the need for water supply and flood control, but also avoid the occurrence of the second disaster. A complex of man-made modifications in the Adda basin (Italy) significantly reduced the flooding risk in the littoral of Lake Como during 1946–2007, without worsening it in the downstream, thus ensuring the safety of urbanized areas [2]. Different types of soil and water conservation in Minizr catchment of the northwest Ethiopian highlands, like soil bunds, micro-trenches, etc, effectively decreased sediment loads entering Koga reservoir [76]. Cerdà et al. [77] suggested that growing catch crops or weeds in orange plantations can reduce water and soil erosion as dense vegetation cover would enhance infiltration and avert surface wash.
Juma in Chinese means the sounds of the stream like the hoofs of ten thousand horses, and Juma River was famous for its large discharge in the past. However, the area is now seriously threatened by water shortages. In the 1970s and 1980s, China carried out land reform, and the Haihe River was diverted in many places for irrigation to meet the crop water requirements and numerous compact towns [37]. This was particularly true in the Juma River basin. After 2000, a water deficit continuously occurred due to the prolonged, severe drought. Disorder in water resources planning and management finally resulted in a water dispute between Beijing and Hebei. Under the rapid development of industry and tourism up and down the Juma River, increasing water demand will exacerbate the crisis of water shortages in the future [78]. Agriculture depletes the largest sector of water in Haihe River basin, which makes up above 70% of total water consumption [79]. In the conditions of a complex and changeable climate, the establishment of strict water resource management measures and water-saving high efficiency crop systems based on adequate information on hydrologic connectivity would have a far-reaching impact on regional water resources of the Juma River basin.
4.4. Uncertainty Analysis
This study examined the trend and causes of runoff variation of Juma River during 1961–2013 by the SWAT model and statistical methods. However, it is necessary to analyze the uncertain factors and produce a further, in-depth exploration.
Firstly, there is no meteorological station that collected long-term data within the basin. Additionally, the nearest station, Yuxian station, is 27 kilometers away from the study area. The lack of precise meteorological inputs would have a negative influence on the validity of simulation though the results met the accuracy requirement. Secondly, the missing value, measured runoff at Zijingguan Station and water withdrawals at Wuyi diversion canal during 2001–2005, somewhat affected the completeness and precision of the attribution analysis. Last but not least, water storage variation and deep groundwater loss are usually neglected in the attribution analysis of runoff change [28]. However, in the Haihe River basin, excessive groundwater exploitation has severely impacted the water cycle [80]. Therefore, future studies that explore the influence of human activities on runoff variation of Juma River should take the conditions of groundwater exploitation into account.
5. Conclusions
In this paper, the impacts of climate variation, land use change, and direct human intervention on runoff change in the Juma River basin were investigated with the SWAT model. Annual runoff series of both Zijingguan station and Zhangfang station appeared to exhibit an obvious declining trend at the 0.001 significance level in 1961–2013, and the reduction rates were −0.054 billion m3 and −0.10 billion m3, respectively. Compared to the baseline period, runoff reduction was mainly affected by climate change and direct human intervention in 1979–1997. Additionally, flood control in the upstream regions led to a greater impact of human direct intervention on runoff at Zijingguan Station. During 1998–2008, runoff variation was under direct control of climate change due to rising temperatures and declining precipitation. Furthermore, the influence of direct human intervention was more powerful after 2009. However, the impact of land use change can be seen as negligible in the entire study period. Besides, monthly runoff reduction was more greatly affected by climate change in winter and more greatly affected by human activities in the summer, except for August.
This study will provide a useful reference for water resources allocation against climate warming in the Juma River basin. However, the lack of sufficient meteorological inputs and the missing runoff records may adversely affect the precision of the simulation and completeness of attribution analysis. Additionally, there was almost no consideration of the possible impact of groundwater exploitation in this region, which is the focus of our future research.
Supplementary Materials
The following are available online at https://www.mdpi.com/2073-4441/10/12/1775/s1, Table S1: Evaluation results of climate variation, land use change, and direct human intervention impacts on annual runoff variation at Zijingguan Station, Table S2: Evaluation results of climate variation, land use change, and direct human intervention impacts on annual runoff variation at Zhangfang Station, Table S3: Evaluation results of climate variation and human activities impacts on monthly runoff variation at Zijingguan Station, Table S4: Evaluation results of climate variation and human activities impacts on monthly runoff variation at Zhangfang Station.
Author Contributions
Conceptualization, J.B. and Y.G.; Methodology, J.B.; Software, J.B.; Validation, J.N., C.L. and Y.G.; Formal Analysis, J.B.; Investigation, J.B. and Y.G.; Resources, C.L. and Y.G.; Data Curation, Y.G.; Writing-Original Draft Preparation, J.B.; Writing-Review & Editing, Y.G., J.N. and C.L.; Visualization, J.B.; Supervision, C.L. and Y.G.; Project Administration, C.L. and Y.G.; Funding Acquisition, C.L. and Y.G.
Funding
This research was funded by the National Key Project for Basic Research (973) (No. 2015CB452705); Study on the general planning for maintaining water conservation function and optimizing ecological space in Zhangjiakou region, Hebei province, China (No. 2017ZX07101); and the National Natural Science Foundation of China (No. 41371486).
Acknowledgments
We would like to express our sincere gratitude to the academic editor and two anonymous reviewers for their careful work and precious suggestions that have substantially improved the paper.
Conflicts of Interest
The authors declare no conflict of interest.
Appendix A

Table A1.
The MK test for temperature time series.
| Station | Period | Change Rate (°C/year) | The Significance Level |
|---|---|---|---|
| Yuxian | Annual | 0.05 | 0.001 |
| Hot-day | 0 | - | |
| Frost-day | −0.54 | 0.001 | |
| Beijing | Annual | 0.04 | 0.001 |
| Hot-day | 0.01 | 0.05 | |
| Frost-day | −0.43 | 0.001 | |
| Baoding | Annual | 0.03 | 0.001 |
| Hot-day | 0 | - | |
| Frost-day | −0.50 | 0.001 | |
| Huailai | Annual | 0.03 | 0.001 |
| Hot-day | 0 | - | |
| Frost-day | −0.44 | 0.001 |
Table A2.
The MK results of precipitation time series.
| Station | Change Rate (mm/year) | The Significance Level | Month | Change Rate (mm/year) | The Significance Level |
|---|---|---|---|---|---|
| Xinggezhuang | −2.121 | 0.1 | January | −0.002 | - |
| Zijingguan | −3.681 | 0.05 | February | −0.044 | 0.1 |
| Yangjiaping | −2.314 | 0.05 | March | −0.062 | - |
| Shimen | −1.547 | - | April | 0.015 | - |
| Aihecun | −1.566 | - | May | 0.379 | 0.05 |
| Dongtuanbao | −3.061 | 0.05 | June | 0.499 | - |
| Qizhongkou | 1.558 | - | July | −0.806 | - |
| Mangshikou | −2.080 | 0.05 | August | −1.330 | 0.05 |
| Piandaozi | −0.760 | - | September | 0.300 | - |
| Shidu | −0.612 | - | October | −0.076 | - |
| Zhaojiapeng | 0.390 | - | November | −0.069 | 0.1 |
| Chajianling | −2.830 | 0.1 | December | 0.007 | - |
| Wanganzhen | −1.722 | - | |||
| Tuanyuancun | −2.100 | 0.1 |
Figure A1.
Pettitt tests for time series of average annual temperature at four stations.

Figure A2.
Time series of Hot-day (Temperature ≥ 30 °C) and Frost-day (Temperature ≤ 0 °C).

References
- Vorosmarty, C.J.; Green, P.; Salisbury, J.; Lammers, R.B. Global water resources: Vulnerability from climate change and population growth. Science 2000, 289, 284–288. [Google Scholar] [CrossRef]
- Moisello, U.; Todeschini, S.; Vullo, F. The effects of water management on annual maximum floods of Lake Como and River Adda at Lecco (Italy). Civ. Eng. Environ. Syst. 2013, 30, 56–71. [Google Scholar] [CrossRef]
- Oki, T.; Kanae, S. Global hydrological cycles and world water resources. Science 2006, 313, 1068–1072. [Google Scholar] [CrossRef]
- Todeschini, S. Trends in long daily rainfall series of Lombardia (northern Italy) affecting urban stormwater control. Int. J. Climatol. 2012, 32, 900–919. [Google Scholar] [CrossRef]
- Barnett, T.P.; Adam, J.C.; Lettenmaier, D.P. Potential impacts of a warming climate on water availability in snow-dominated regions. Nature 2005, 438, 303–309. [Google Scholar] [CrossRef]
- Deb, P.; Babel, M.S.; Denis, A.F. Multi-GCMs approach for assessing climate change impact on water resources in Thailand. Model. Earth Syst. Environ. 2018, 4, 825–839. [Google Scholar] [CrossRef]
- McCabe, G.J.; Wolock, D.M. Independent effects of temperature and precipitation on modeled runoff in the conterminous United States. Water Resour. Res. 2011, 47. [Google Scholar] [CrossRef] [Green Version]
- Bao, Z.; Zhang, J.; Wang, G.; Fu, G.; He, R.; Yan, X.; Jin, J.; Liu, Y.; Zhang, A. Attribution for decreasing streamflow of the Haihe River basin, northern China: Climate variability or human activities? J. Hydrol. 2012, 460–461, 117–129. [Google Scholar] [CrossRef]
- Li, Y.; Chang, J.; Wang, Y.; Jin, W.; Guo, A. Spatiotemporal Impacts of Climate, Land Cover Change and Direct Human Activities on Runoff Variations in the Wei River Basin, China. Water 2016, 8, 220. [Google Scholar] [CrossRef]
- Zhang, K.; Li, L.; Bai, P.; Li, J.; Liu, Y. Influence of climate variability and human activities on stream flow variation in the past 50 years in Taoer River, Northeast China. J. Geogr. Sci. 2017, 27, 481–496. [Google Scholar] [CrossRef]
- Zimmermann, B.; Elsenbeer, H.; de Moraes, J.M. The influence of land-use changes on soil hydraulic properties: Implications for runoff generation. For. Ecol. Manag. 2006, 222, 29–38. [Google Scholar] [CrossRef]
- Germer, S.; Neill, C.; Krusche, A.V.; Elsenbeer, H. Influence of land-use change on near-surface hydrological processes: Undisturbed forest to pasture. J. Hydrol. 2010, 380, 473–480. [Google Scholar] [CrossRef]
- García-Ruiz, J.M.; Regüés, D.; Alvera, B.; Lana-Renault, N.; Serrano-Muela, P.; Nadal-Romero, E.; Navas, A.; Latron, J.; Martí-Bono, C.; Arnáez, J. Flood generation and sediment transport in experimental catchments affected by land use changes in the central Pyrenees. J. Hydrol. 2008, 356, 245–260. [Google Scholar] [CrossRef] [Green Version]
- Ren, L.; Wang, M.; Li, C.; Zhang, W. Impacts of human activity on river runoff in the northern area of China. J. Hydrol. 2002, 261, 204–217. [Google Scholar] [CrossRef]
- He, Y.; Lin, K.; Chen, X. Effect of Land Use and Climate Change on Runoff in the Dongjiang Basin of South China. Math. Probl. Eng. 2013, 2013, 1–14. [Google Scholar] [CrossRef]
- Huo, Z.; Feng, S.; Kang, S.; Li, W.; Chen, S. Effect of climate changes and water-related human activities on annual stream flows of the Shiyang river basin in arid north-west China. Hydrol. Processes 2008, 22, 3155–3167. [Google Scholar] [CrossRef]
- Beguería, S.; López-Moreno, J.I.; Lorente, A.; Seeger, M.; García-Ruiz, J.M. Assessing the Effect of Climate Oscillations and Land-use Changes on Streamflow in the Central Spanish Pyrenees. AMBIO J. Hum. Environ. 2003, 32, 283–286. [Google Scholar] [CrossRef] [Green Version]
- Liang, W.; Bai, D.; Wang, F.; Fu, B.; Yan, J.; Wang, S.; Yang, Y.; Long, D.; Feng, M. Quantifying the impacts of climate change and ecological restoration on streamflow changes based on a Budyko hydrological model in China’s Loess Plateau. Water Resour. Res. 2015, 51, 6500–6519. [Google Scholar] [CrossRef]
- Gao, G.; Fu, B.; Wang, S.; Liang, W.; Jiang, X. Determining the hydrological responses to climate variability and land use/cover change in the Loess Plateau with the Budyko framework. Sci. Total Environ. 2016, 557, 331–342. [Google Scholar] [CrossRef] [Green Version]
- Wang, D.; Hejazi, M. Quantifying the relative contribution of the climate and direct human impacts on mean annual streamflow in the contiguous United States. Water Resour. Res. 2011, 47. [Google Scholar] [CrossRef]
- Yin, J.; He, F.; Xiong, Y.J.; Qiu, G.Y. Effects of land use/land cover and climate changes on surface runoff in a semi-humid and semi-arid transition zone in northwest China. Hydrol. Earth Syst. Sci. 2017, 21, 183–196. [Google Scholar] [CrossRef] [Green Version]
- Luo, K.; Tao, F.; Moiwo, J.P.; Xiao, D. Attribution of hydrological change in Heihe River Basin to climate and land use change in the past three decades. Sci. Rep. 2016, 6, 33704. [Google Scholar] [CrossRef] [Green Version]
- Wang, G.; Xia, J.; Chen, J. Quantification of effects of climate variations and human activities on runoff by a monthly water balance model: A case study of the Chaobai River basin in northern China. Water Resour. Res. 2009, 45. [Google Scholar] [CrossRef] [Green Version]
- Ahn, K.-H.; Merwade, V. Quantifying the relative impact of climate and human activities on streamflow. J. Hydrol. 2014, 515, 257–266. [Google Scholar] [CrossRef]
- Wu, J.; Miao, C.; Zhang, X.; Yang, T.; Duan, Q. Detecting the quantitative hydrological response to changes in climate and human activities. Sci. Total Environ. 2017, 586, 328–337. [Google Scholar] [CrossRef]
- Chawla, I.; Mujumdar, P.P. Isolating the impacts of land use and climate change on streamflow. Hydrol. Earth Syst. Sci. 2015, 19, 3633–3651. [Google Scholar] [CrossRef]
- Ma, X.; Lu, X.X.; van Noordwijk, M.; Li, J.T.; Xu, J.C. Attribution of climate change, vegetation restoration, and engineering measures to the reduction of suspended sediment in the Kejie catchment, southwest China. Hydrol. Earth Syst. Sci. 2014, 18, 1979–1994. [Google Scholar] [CrossRef] [Green Version]
- Wang, X. Advances in separating effects of climate variability and human activity on stream discharge: An overview. Adv. Water Resour. 2014, 71, 209–218. [Google Scholar] [CrossRef]
- Li, Z.; Liu, W.; Zhang, X.; Zheng, F. Impacts of land use change and climate variability on hydrology in an agricultural catchment on the Loess Plateau of China. J. Hydrol. 2009, 377, 35–42. [Google Scholar] [CrossRef]
- Xia, J.; Feng, H.; Zhan, C.-S.; Niu, C. Determination of a reasonable percentage for ecological water-use in the Haihe River basin, China. Pedosphere 2006, 16, 33–42. [Google Scholar] [CrossRef]
- Yang, H. Water, environment and food security: A case study of the Haihe River basin in China. River Basin Manag. II 2003, 60. [Google Scholar] [CrossRef]
- Xia, J.; Zhang, L.; Liu, C.; Yu, J. Towards better water security in North China. Water Resour. Manag. 2006, 21, 233–247. [Google Scholar] [CrossRef] [Green Version]
- Wu, G.; Chen, S.; Su, R.; Jia, M.; Li, W. Temporal trend in surface water resources in Tianjin in the Haihe River Basin, China. Hydrol. Processes 2011, 25, 2141–2151. [Google Scholar] [CrossRef]
- Xu, X.; Yang, D.; Yang, H.; Lei, H. Attribution analysis based on the Budyko hypothesis for detecting the dominant cause of runoff decline in Haihe basin. J. Hydrol. 2014, 510, 530–540. [Google Scholar] [CrossRef]
- Guo, Y.; Shen, Y. Quantifying water and energy budgets and the impacts of climatic and human factors in the Haihe River Basin, China: 2. Trends and implications to water resources. J. Hydrol. 2015, 527, 251–261. [Google Scholar] [CrossRef]
- Li, R.; Zheng, H.; Huang, B.; Xu, H.; Li, Y. Dynamic Impacts of Climate and Land-Use Changes on Surface Runoff in the Mountainous Region of the Haihe River Basin, China. Adv. Meteorol. 2018, 2018, 3287343. [Google Scholar] [CrossRef]
- Yang, Y.; Tian, F. Abrupt change of runoff and its major driving factors in Haihe River Catchment, China. J. Hydrol. 2009, 374, 373–383. [Google Scholar] [CrossRef]
- Wang, W.; Shao, Q.; Yang, T.; Peng, S.; Xing, W.; Sun, F.; Luo, Y. Quantitative assessment of the impact of climate variability and human activities on runoff changes: A case study in four catchments of the Haihe River basin, China. Hydrol. Processes 2013, 27, 1158–1174. [Google Scholar] [CrossRef]
- Lu, S.; Wu, B.; Wei, Y.; Yan, N.; Wang, H.; Guo, S. Quantifying impacts of climate variability and human activities on the hydrological system of the Haihe River Basin, China. Environ. Earth Sci. 2014, 73, 1491–1503. [Google Scholar] [CrossRef]
- Lei, H.; Yang, D.; Huang, M. Impacts of climate change and vegetation dynamics on runoff in the mountainous region of the Haihe River basin in the past five decades. J. Hydrol. 2014, 511, 786–799. [Google Scholar] [CrossRef]
- Liu, J.; Kuang, W.; Zhang, Z.; Xu, X.; Qin, Y.; Ning, J.; Zhou, W.; Zhang, S.; Li, R.; Yan, C.; et al. Spatiotemporal characteristics, patterns, and causes of land-use changes in China since the late 1980s. J. Geogr. Sci. 2014, 24, 195–210. [Google Scholar] [CrossRef]
- Kendall, M. Rank Correlation Measures; Charles Griffin: London, UK, 1975; p. 202. [Google Scholar]
- Yadav, S.; Deb, P.; Kumar, S.; Pandey, V.; Pandey, P.K. Trends in major and minor meteorological variables and their influence on reference evapotranspiration for mid Himalayan region at east Sikkim, India. J. Mt. Sci. 2016, 13, 302–315. [Google Scholar] [CrossRef]
- Mann, H.B. Nonparametric tests against trend. Econ. J. Econ. Soc. 1945, 13, 245–259. [Google Scholar] [CrossRef]
- Sen, P.K. Estimates of the regression coefficient based on Kendall’s tau. J. Am. Stat. Assoc. 1968, 63, 1379–1389. [Google Scholar] [CrossRef]
- Theil, H. A rank-invariant method of linear and polynomial regression analysis. In Henri Theil’s Contributions to Economics and Econometrics; Springer: Dordrecht, The Netherlands, 1992; pp. 345–381. [Google Scholar]
- Hurst, H.E. Long-term storage capacity of reservoirs. Trans. Am. Soc. Civ. Eng. 1951, 116, 770–799. [Google Scholar]
- Matalas, N.; Wallis, J. Small sample properties of Hand K--estimators of the Hurst coefficient h. Water Resour. Res. 1970, 6, 1583–1594. [Google Scholar]
- Pettitt, A. A non-parametric approach to the change-point problem. Appl. Stat. 1979, 28, 126–135. [Google Scholar] [CrossRef]
- Arnold, J.G.; Srinivasan, R.; Muttiah, R.S.; Williams, J.R. Large area hydrologic modeling and assessment—Part 1: Model development. J. Am. Water Resour. Assoc. 1998, 34, 73–89. [Google Scholar] [CrossRef]
- Santhi, C.; Arnold, J.G.; Williams, J.R.; Dugas, W.A.; Srinivasan, R.; Hauck, L.M. Validation of the swat model on a large rwer basin with point and nonpoint sources. JAWRA J. Am. Water Resour. Assoc. 2001, 37, 1169–1188. [Google Scholar] [CrossRef]
- Marhaento, H.; Booij, M.J.; Rientjes, T.H.M.; Hoekstra, A.Y. Attribution of changes in the water balance of a tropical catchment to land use change using the SWAT model. Hydrol. Processes 2017, 31, 2029–2040. [Google Scholar] [CrossRef]
- Abbaspour, K. Calibration of hydrologic models: When is a model calibrated. In Proceedings of the MODSIM 2005 International Congress on Modelling and Simulation, Modelling and Simulation Society of Australia and New Zealand, Melbourne, Australia, 12–15 December 2005. [Google Scholar]
- Abbaspour, K.C. SWAT-CUP 2012: SWAT Calibration and Uncertainty Programs—A User Manual; Eawag: Dübendorf, Switzerland, 2013; p. 103. [Google Scholar]
- Zhang, A.; Zhang, C.; Fu, G.; Wang, B.; Bao, Z.; Zheng, H. Assessments of Impacts of Climate Change and Human Activities on Runoff with SWAT for the Huifa River Basin, Northeast China. Water Resour. Manag. 2012, 26, 2199–2217. [Google Scholar] [CrossRef]
- Shi, X.; Yang, Z.; Yan, D.; Li, Y.; Yuan, Z. On hydrological response to land-use/cover change in Luanhe River basin. Adv. Water Sci. 2014, 25, 21–27. (In Chinese) [Google Scholar]
- He, S.; Nan, Z.; Zhang, L.; Yu, W. Spatial-temporal distribution of water and energy fluxes in the upper reaches of the Heihe River simulated with VIC model. J. Glaciol. Geocryol. 2015, 37, 211–225. (In Chinese) [Google Scholar]
- Moriasi, D.N.; Gitau, M.W.; Pai, N.; Daggupati, P. Hydrologic and water quality models: Performance measures and evaluation criteria. Trans. Asabe 2015, 58, 1763–1785. [Google Scholar]
- Zhang, L.; Li, L.; Xia, J.; Wang, R. Quantitative assessment of the impact of climate variability and human activities on runoff change in the Luanhe River Catchment. J. Nat. Resour. 2015, 4, 664–672. (In Chinese) [Google Scholar]
- Qian, Y.; Leung, L.R. A long-term regional simulation and observations of the hydroclimate in China. J. Geophys. Res. 2007, 112. [Google Scholar] [CrossRef] [Green Version]
- Peng, S.; Liu, W.; Wang, W.; Shao, Q.; Jiao, X.; Yu, Z.; Xing, W.; Xu, J.; Zhang, Z.; Luo, Y. Estimating the effects of climatic variability and human activities on streamflow in the Hutuo River basin, China. J. Hydrol. Eng. 2013, 18, 422–430. [Google Scholar] [CrossRef]
- Xu, Y.-P.; Zhang, X.; Ran, Q.; Tian, Y. Impact of climate change on hydrology of upper reaches of Qiantang River Basin, East China. J. Hydrol. 2013, 483, 51–60. [Google Scholar] [CrossRef]
- Xia, F.; Liu, X.M.; Xu, J.M.; Wang, Z.G.; Huang, J.F.; Brookes, P.C. Trends in the daily and extreme temperatures in the Qiantang River basin, China. Int. J. Climatol. 2015, 35, 57–68. [Google Scholar] [CrossRef]
- Keesstra, S.D.; van Huissteden, J.; Vandenberghe, J.; Van Dam, O.; de Gier, J.; Pleizier, I.D. Evolution of the morphology of the river Dragonja (SW Slovenia) due to land-use changes. Geomorphology 2005, 69, 191–207. [Google Scholar] [CrossRef]
- Keesstra, S.D.; van Dam, O.; Verstraeten, G.; van Huissteden, J. Changing sediment dynamics due to natural reforestation in the Dragonja catchment, SW Slovenia. Catena 2009, 78, 60–71. [Google Scholar] [CrossRef]
- Keesstra, S.D.; Bruijnzeel, L.A.; van Huissteden, J. Meso-scale catchment sediment budgets: Combining field surveys and modeling in the Dragonja catchment, southwest Slovenia. Earth Surf. Processes Landforms 2009, 34, 1547–1561. [Google Scholar] [CrossRef]
- Hao, X. Study on the Water Allocation Acheme of Juma River 2010; Tsinghua University: Beijing, China, 2010. (In Chinese) [Google Scholar]
- Meng, X.; Wu, X.B. Analysis on Flood Control Unified Regulation of Baiyangdian Wetland and its Upstream Reservoir Group. Appl. Mech. Mater. 2013, 353–356, 2591–2594. [Google Scholar] [CrossRef]
- Fan, J.; Tian, F.; Yang, Y.; Han, S.; Qiu, G. Quantifying the magnitude of the impact of climate change and human activity on runoff decline in Mian River Basin, China. Water Sci. Technol. 2010, 62, 783–791. [Google Scholar] [CrossRef]
- Pringle, C. What is hydrologic connectivity and why is it ecologically important? Hydrol. Processes 2003, 17, 2685–2689. [Google Scholar] [CrossRef]
- Bracken, L.J.; Croke, J. The concept of hydrological connectivity and its contribution to understanding runoff-dominated geomorphic systems. Hydrol. Processes 2007, 21, 1749–1763. [Google Scholar] [CrossRef]
- Masselink, R.; Temme, A.J.A.M.; Giménez, R.; Casalí, J.; Keesstra, S.D. Assessing hillslope-channel connectivity in an agricultural catchment using rare-earth oxide tracers and random forests models. Cuadernos Investig. Geográfica 2017, 43, 19–39. [Google Scholar] [CrossRef]
- Keesstra, S.; Nunes, J.P.; Saco, P.; Parsons, T.; Poeppl, R.; Masselink, R.; Cerda, A. The way forward: Can connectivity be useful to design better measuring and modelling schemes for water and sediment dynamics? Sci. Total Environ. 2018, 644, 1557–1572. [Google Scholar] [CrossRef]
- Keesstra, S.D.; Temme, A.; Schoorl, J.M.; Visser, S.M. Evaluating the hydrological component of the new catchment-scale sediment delivery model LAPSUS-D. Geomorphology 2014, 212, 97–107. [Google Scholar] [CrossRef]
- Rodrigo-Comino, J.; Martinez-Hernandez, C.; Iserloh, T.; Cerda, A. Contrasted Impact of Land Abandonment on Soil Erosion in Mediterranean Agriculture Fields. Pedosphere 2018, 28, 617–631. [Google Scholar] [CrossRef]
- Mekonnen, M.; Keesstra, S.D.; Baartman, J.E.M.; Stroosnijder, L.; Maroulis, J. Reducing sediment connectivity through man-made and natural sediment sinks in the minizr catchment, northwest ethiopia. Land Degrad. Dev. 2017, 28, 707–717. [Google Scholar] [CrossRef]
- Cerda, A.; Rodrigo-Comino, J.; Gimenez-Morera, A.; Keesstra, S.D. Hydrological and erosional impact and farmer’s perception on catch crops and weeds in citrus organic farming in Canyoles river watershed, Eastern Spain. Agric. Ecosyst. Environ. 2018, 258, 49–58. [Google Scholar] [CrossRef]
- Ji, Y.; Chen, L.; Sun, R. Temporal and Spatial Variability of Water Supply Stress in the Haihe River Basin, Northern China1. JAWRA J. Am. Water Resour. Assoc. 2012, 48, 999–1007. [Google Scholar] [CrossRef]
- Pan, Y.; Zhang, C.; Gong, H.; Yeh, P.J.F.; Shen, Y.; Guo, Y.; Huang, Z.; Li, X. Detection of human-induced evapotranspiration using GRACE satellite observations in the Haihe River basin of China. Geophys. Res. Lett. 2017, 44, 190–199. [Google Scholar] [CrossRef]
- Zou, J.; Xie, Z.; Zhan, C.; Qin, P.; Sun, Q.; Jia, B.; Xia, J. Effects of anthropogenic groundwater exploitation on land surface processes: A case study of the Haihe River Basin, northern China. J. Hydrol. 2015, 524, 625–641. [Google Scholar] [CrossRef] [Green Version]
Figure 1.
The Juma River basin.

Figure 2.
A diagrammatic plot of evaluating the effects of climate variation, land use change, and direct human intervention on runoff variation.
Figure 2.
A diagrammatic plot of evaluating the effects of climate variation, land use change, and direct human intervention on runoff variation.

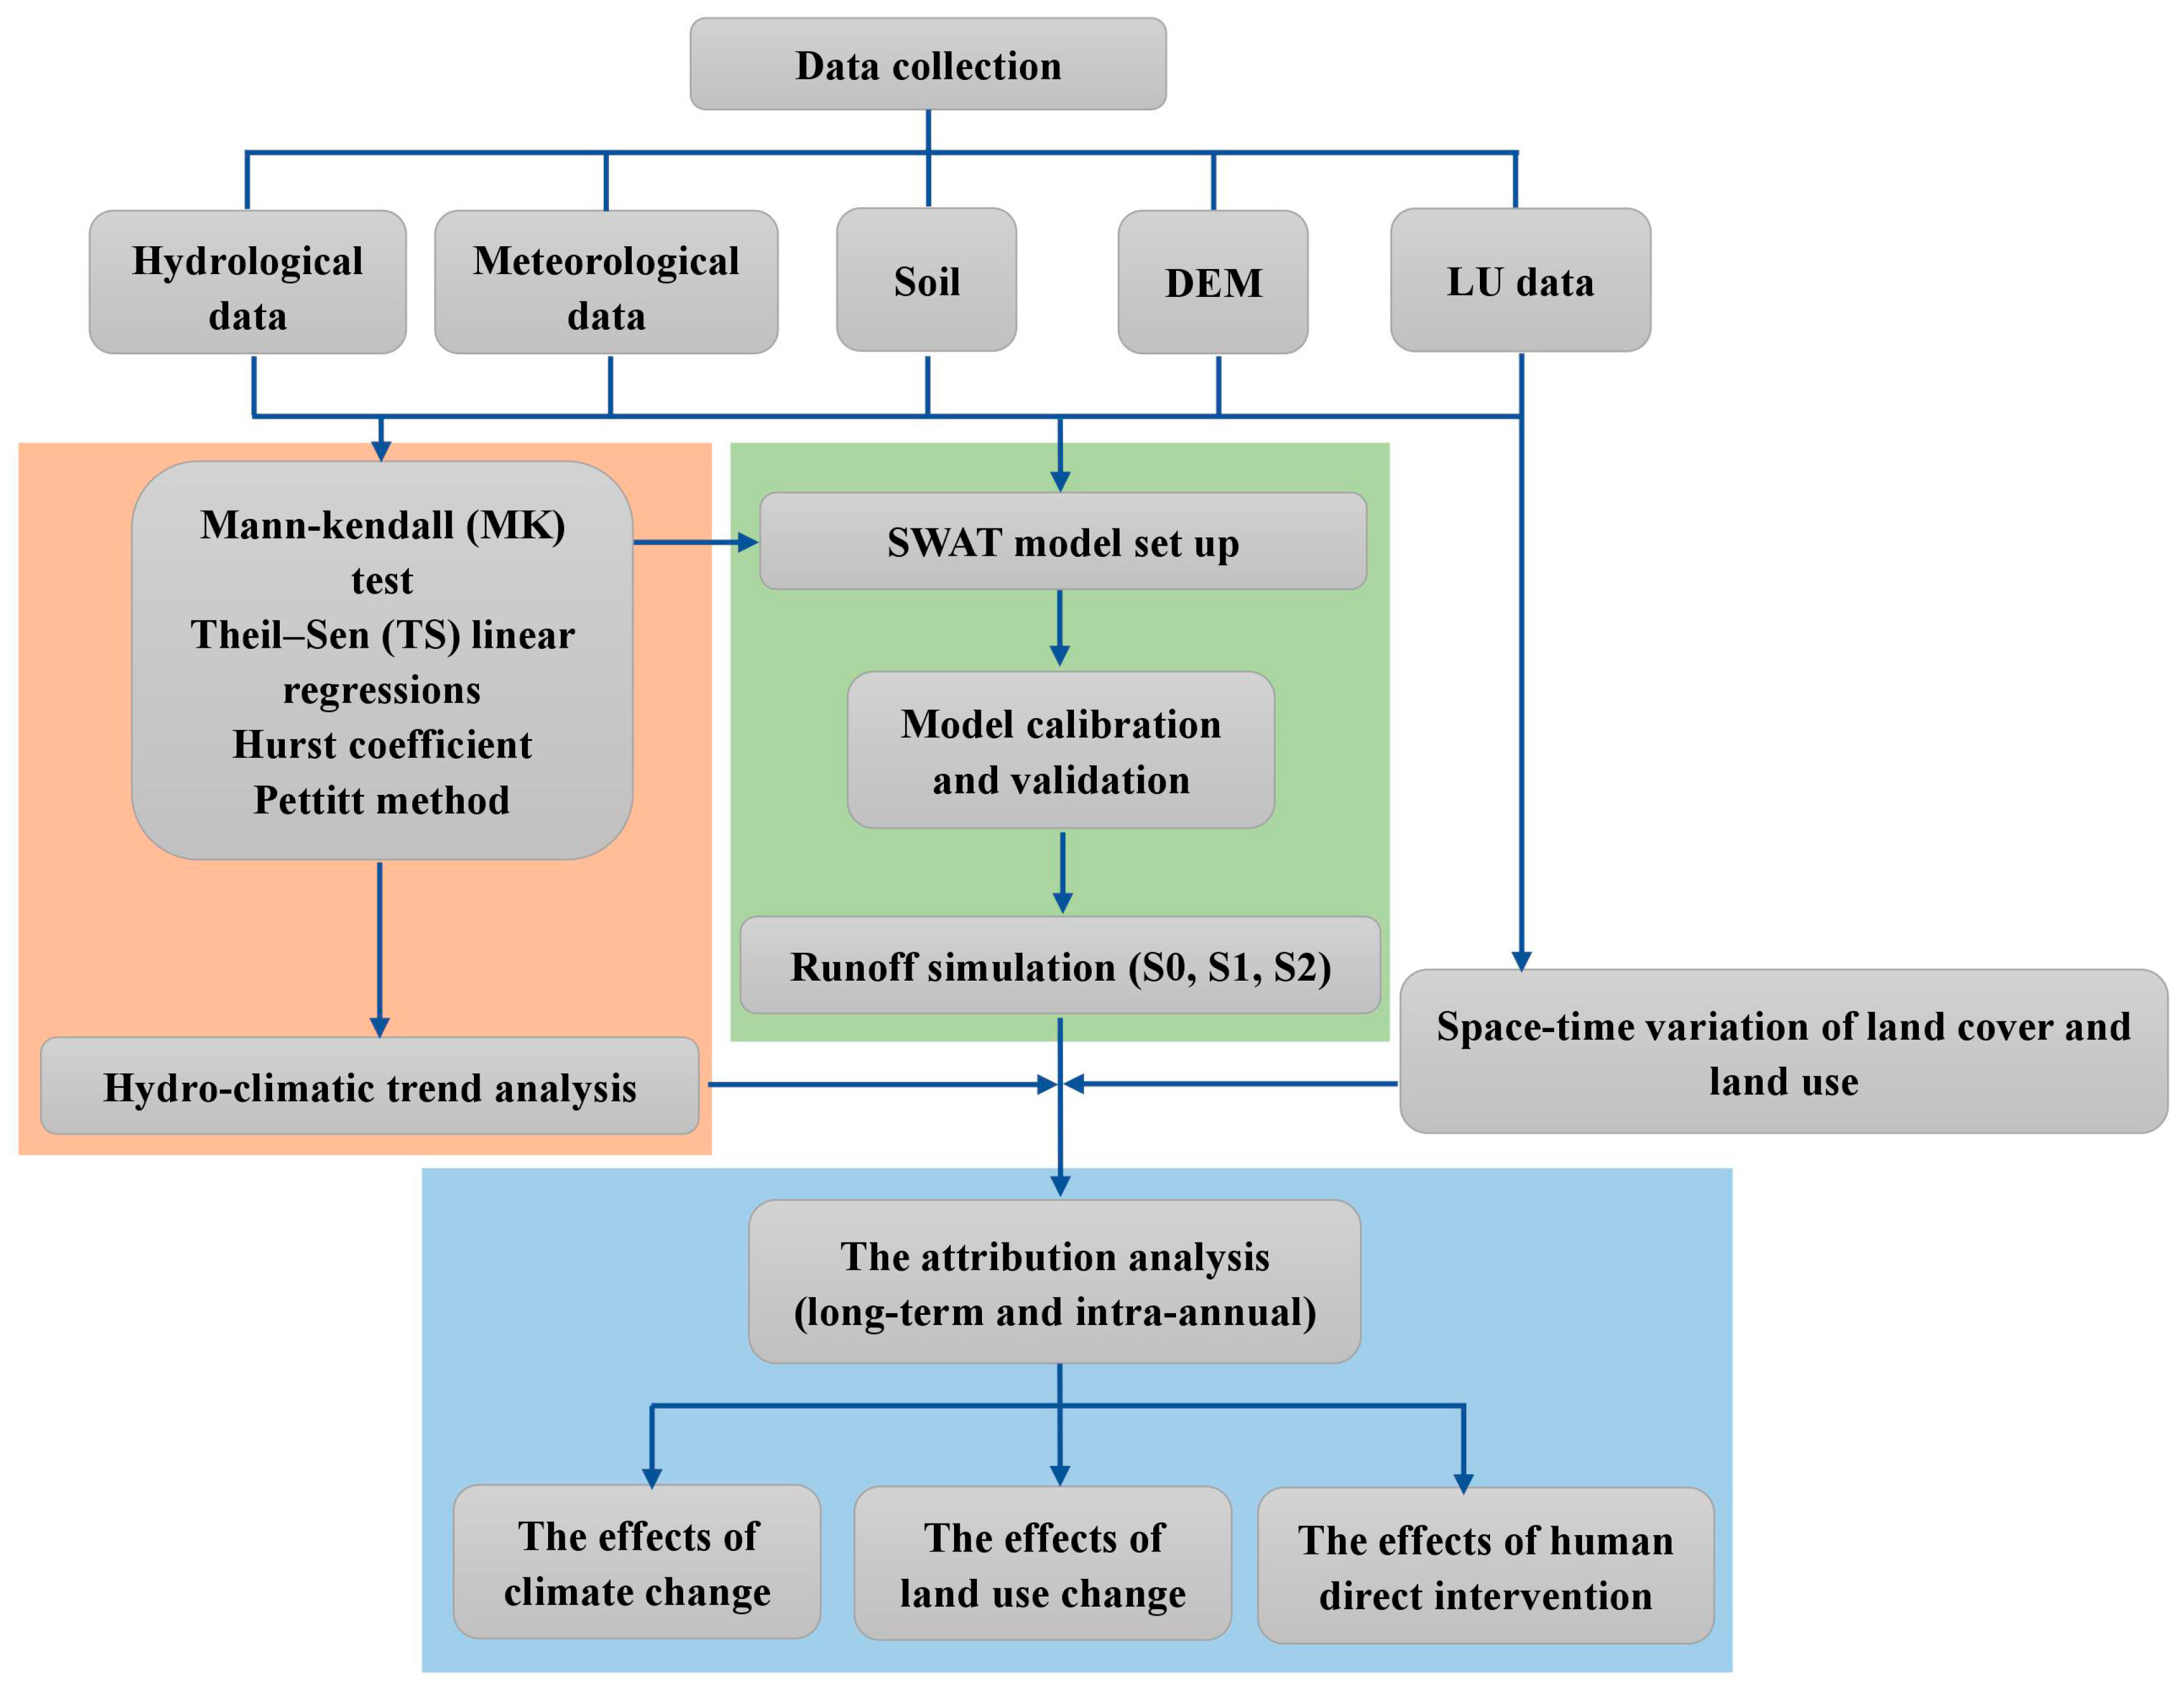
Figure 3.
Overview of this study.

Figure 4.
Time series of measured runoff for two stations during 1961–2013.

Figure 5.
Pettitt tests for time series of measured annual runoff (a,b) and restored annual runoff (c,d).
Figure 5.
Pettitt tests for time series of measured annual runoff (a,b) and restored annual runoff (c,d).

Figure 6.
The double cumulative curve for the precipitation and runoff of two stations.

Figure 7.
Comparison of the observed monthly runoff and simulated monthly runoff.

Figure 8.
Comparison of the observed runoff and simulated runoff at a monthly scale during the baseline period.
Figure 8.
Comparison of the observed runoff and simulated runoff at a monthly scale during the baseline period.

Figure 9.
The runoff changes attributed to the climate change and human activities (land use change and direct human intervention) (Note: Attribution analysis of monthly runoff change was analyzed for the entire study period).
Figure 9.
The runoff changes attributed to the climate change and human activities (land use change and direct human intervention) (Note: Attribution analysis of monthly runoff change was analyzed for the entire study period).

Figure 10.
Time series of annual average temperature (a) and annual precipitation (b) during 1961–2013, and the spatial distribution of annual average temperature (c) and annual precipitation (d) in the Juma River basin.
Figure 10.
Time series of annual average temperature (a) and annual precipitation (b) during 1961–2013, and the spatial distribution of annual average temperature (c) and annual precipitation (d) in the Juma River basin.

Figure 11.
The trend of annual region anomalies in temperature of four meteorological stations.

Figure 12.
Distribution of precipitation during the year (a) and the variation rate of precipitation (b–d).
Figure 12.
Distribution of precipitation during the year (a) and the variation rate of precipitation (b–d).

Figure 13.
Variation in the dryness index from 1961 to 2013.

Figure 14.
Selected areas and their water yield change.

Figure 15.
Comparison of annual observed runoff for Zijngguan station, Zhangfang station, and Wuyi diversion canal, and distribution of water withdrawal over the year for Wuyi diversion canal.
Figure 15.
Comparison of annual observed runoff for Zijngguan station, Zhangfang station, and Wuyi diversion canal, and distribution of water withdrawal over the year for Wuyi diversion canal.

Table 1.
Hydrological properties of the soil classes.
| Types | Area (% of Total Area) | Wilting Point (% Vol) | Field Capacity (% Vol) | Saturation (% Vol) | Sat Hydraulic Cond (mm/h) | Matric Bulk Density (g/cm3) |
|---|---|---|---|---|---|---|
| Cambisols | 21.54 | 6.2–26.3 | 12.9–38.7 | 39.6–47.1 | 1.49–50.9 | 1.4–1.6 |
| Luvisols | 59.95 | 6.6–14.4 | 11.8–30.9 | 39.6–42.9 | 3.59–49.88 | 1.51–1.59 |
| Leptosols | 4.98 | 13.3–13.9 | 26.1–29.5 | 43.8–49.6 | 9.9–16.8 | 1.33–1.49 |
| Regosols | 10.96 | 11.4–15.6 | 22.7–28.5 | 40.4–48.3 | 4.99–15.3 | 1.37–1.58 |
| Fluvisols | 2.58 | 11.6–11.8 | 25.9–26.7 | 41.2–42.2 | 8.49–8.81 | 1.53–1.56 |
Table 2.
The calibrated values of the model parameters.
| Parameter Name | Description | Initial Range | Zijingguan | Zhangfang | ||
|---|---|---|---|---|---|---|
| Final Range | Calibrated Value | Final Range | Calibrated Value | |||
| r__CN2 | Initial SCS runoff curve number for moisture condition II | (−0.3, 0.3) | (−0.190, 0.108) | −0.162 | (−0.172, 0) | −0.12 |
| v__ALPHA_BF | Baseflow alpha factor (1/days) | (0, 1) | (0.016, 0.43) | 0.39 | (0.036, 0.318) | 0.19 |
| v__GW_DELAY | Groundwater delay time (days) | (0, 500) | (150.84, 391.96) | 195.11 | (140.84, 264.65) | 255.36 |
| v__GWQMN | Threshold depth of water in the shallow aquifer required for return flow to occur (mm H2O) | (20, 5000) | (150.49, 584.01) | 478.45 | (273.05, 581.89) | 427.5 |
| v__GW_REVAP | Groundwater “revap” coefficient. | (0.02, 0.2) | (0.109, 0.2) | 0.18 | (0.11, 0.16) | 0.14 |
| v__ESCO | Soil evaporation compensation factor | (0, 1) | (0.494, 0.887) | 0.84 | (0.429, 0.756) | 0.47 |
| v__CH_K2 | Effective hydraulic conductivity in tributary channel alluvium (mm/h) | (0.02, 150) | (69.31, 109.89) | 74.04 | (72.11, 112.89) | 78.46 |
| r__SOL_AWC | Available water capacity of the soil layer (mm H2O/mm soil) | (−0.5, −0.5) | (−0.040, 0.154) | 0.057 | (−0.081, −0.120) | 0.03 |
| r__SOL_K | Saturated hydraulic conductivity (mm/h) | (−0.5, 0.5) | (−0.0.34, 0.169) | 0.067 | (−0.154, 0.061) | −0.04 |
Notes: “v__”: parameter value should be replaced by a given value; “r__”: parameter value should be multiplied by (1 + a given value) or relative change.
Table 3.
The results of calibration and validation.
| Station | Period | Monthly Discharge (m3/s) | Ens | R2 | Re | |
|---|---|---|---|---|---|---|
| Simulated | Measured | |||||
| Zijingguan | calibration | 7.38 | 8.04 | 0.89 | 0.86 | 8.2% |
| Validation | 7.59 | 8.64 | 0.84 | 0.86 | 12.15% | |
| Zhangfang | calibration | 20.24 | 19.02 | 0.88 | 0.89 | −6.4% |
| Validation | 19.42 | 20.07 | 0.86 | 0.87 | 3.21% | |
Table 4.
Land use changes in the Juma River basin from the late 1970s to 2010 (km2).
| Types | Late 1970s | Late 1980s | 1995 | 2000 | 2005 | 2010 |
|---|---|---|---|---|---|---|
| Agriculture | 565.4 | 565.5 | 560.7 | 561.4 | 559.6 | 556.5 |
| Dense Forest | 1653.1 | 1653.7 | 1756.3 | 1670.7 | 1671.0 | 1670.1 |
| Shrubwood | 1138.6 | 1139.6 | 1103.6 | 1136.0 | 1136.2 | 1135.2 |
| Open Forest | 301.7 | 301.8 | 225.9 | 252.8 | 253.2 | 253.1 |
| Grass | 1011.4 | 1011.8 | 1021.3 | 1047.1 | 1046.1 | 1046.2 |
| Water Bodies | 34.0 | 34.0 | 34.1 | 34.1 | 34.1 | 34.1 |
| Urban | 29.5 | 29.5 | 34.0 | 34.2 | 36.6 | 41.0 |
| Unused Land | 1.5 | 1.5 | 1.5 | 1.5 | 1.5 | 1.5 |
© 2018 by the authors. Licensee MDPI, Basel, Switzerland. This article is an open access article distributed under the terms and conditions of the Creative Commons Attribution (CC BY) license (http://creativecommons.org/licenses/by/4.0/).
Share and Cite
MDPI and ACS Style
Bu, J.; Lu, C.; Niu, J.; Gao, Y. Attribution of Runoff Reduction in the Juma River Basin to Climate Variation, Direct Human Intervention, and Land Use Change. Water 2018, 10, 1775. https://doi.org/10.3390/w10121775
AMA Style
Bu J, Lu C, Niu J, Gao Y. Attribution of Runoff Reduction in the Juma River Basin to Climate Variation, Direct Human Intervention, and Land Use Change. Water. 2018; 10(12):1775. https://doi.org/10.3390/w10121775
Chicago/Turabian StyleBu, Jingyi, Chunxia Lu, Jun Niu, and Yanchun Gao. 2018. "Attribution of Runoff Reduction in the Juma River Basin to Climate Variation, Direct Human Intervention, and Land Use Change" Water 10, no. 12: 1775. https://doi.org/10.3390/w10121775
Note that from the first issue of 2016, this journal uses article numbers instead of page numbers. See further details here.