Article

Quantifying the Effects of Dramatic Changes in Runoff and Sediment on the Channel Morphology of a Large, Wandering River Using Remote Sensing Images

1
Key Lab. of Water Cycle and Related Land Surface Processes, Institute of Geographic Sciences and Natural Resources Research, Chinese Academy of Sciences, Beijing 100101, China
2
College of Resources and Environment, University of the Chinese Academy of Sciences, Beijing 100049, China
3
Key Lab. of the Yellow River Sediment of the Ministry of Water Resources, Institute of Hydraulic Research, Yellow River Water Conservancy Commission, Zhengzhou 450003, China
*
Author to whom correspondence should be addressed.
Water 2018, 10(12), 1767; https://doi.org/10.3390/w10121767
Submission received: 17 October 2018 / Revised: 16 November 2018 / Accepted: 27 November 2018 / Published: 1 December 2018
(This article belongs to the Special Issue Applications of Remote Sensing and GIS in Hydrology)

Abstract

:
The Yellow River (Huanghe River), which is the second largest river in China, has experienced dramatic changes in both runoff and sediment over the last 60 years. To quantify the effects on the channel morphology of the wandering reach on the Lower Yellow River (LYR), this study extracts morphological indices from Landsat imageries taken between 1979 and 2015. Over the dynamically adjusting complex channel-floodplain system, the spatial distribution of NDVI (Normalized Difference Vegetation Index) is found helpful for identifying the wandering belt created by the frequent migrations of the pathways of the main flow, which are determined from the reflection of the sediment-laded water body in remote sensing images taken at low flows. The extracted results show clearly that the average width and area of the wandering belt over the entire study reach declined in a dramatic fashion between 1979 and 2000 and yet both varied respectively within very narrow ranges from 2000 to 2015. Although the number of bends increased significantly since the 1990s, the sinuosity of the pathways of the main flow remained almost unchanged. By combining the morphological indices extracted from the remote sensing images with field hydrological and geomorphological measurements, our regression analysis identifies that the width of the wandering belt changes at the highest degree of correspondence with the width/depth ratio of the main channel and the variations of both are related most closely to the average flow discharge and then to sediment concentration during the flood seasons. These implicate that a significant reduction of the magnitude of floods and sediment concentration is beneficial not only for making the main channel transit from a wider and shallower cross-section into a narrower and deeper profile but also for narrowing the wandering range of the LYR.

1. Introduction

Both physical factors (climate, geology, vegetation, and soil) and anthropogenic factors (dams, water intake, mining, urbanization, channelization, and land use change) can impact fluvial process directly or indirectly through an alternation of flow and sediment transport processes. The evaluation of river geomorphological adjustment to the alternation is a fundamental work for fluvial geomorphologists and river engineers. Numerous studies on this subject have been conducted [1,2,3,4,5,6,7,8,9,10]. However, a large number of previous studies have described the morphological change of river channels qualitatively and attributed to the complexity of the causes and processes underlying river channel-form adjustments [5,11,12,13,14]. As a result, there has been a lack of generally applicable quantitative relationships between river morphology and sediment-laded flow process, which are very important for river health maintenance and sustainable river regulation in alluvial systems.
In the channel of an unstable braided or a wandering alluvial river, avulsion, confluence, and bifurcation of flow occur frequently [15,16,17]. Although a number of studies have focused on the deposition, structure, and evolutional process of central bars in this type of alluvial rivers [9,18,19,20], some of these rivers even with relative stable channel platforms [21,22] have difficulties remaining for quantifying the morphologic adjustments of the river channels especially in large alluvial rivers with wandering or unstable braided channel patterns. This is largely due to the high susceptibility of morphologic adjustments to sediment-laded flow conditions and the difficulties in directly measuring the morphological adjustments of the river channels that occur predominantly during flood seasons.
The Yellow River (Huanghe River) has been the world’s largest carrier of fluvial sediment and, over the last 70 years, it has delivered 1.08 billion tons of sediment to the sea annually on average, which accounts for 6% of the total fluvial terrestrial-sediment into global oceans [23,24]. In recent decades, however, sediment supply to the Lower Yellow River (LYR) has decreased by nearly 90% and runoff into the LYR has been controlled to a significant degree particularly under the joint operation of several large reservoirs constructed in the upper and middle drainage basins of the Yellow River [25]. Many studies have recorded intense adjusting processes in the LYR in response to the alterations in the water and sediment supply [7,26,27,28,29]. For example, an analysis of the planform adjustment in the wandering reach of the LYR prior to 2000 by Reference [30] indicated a weakening in the degree of wandering from the middle of 1980 to 2003. This tendency of the channel adjustment in the LYR is also found by Reference [31] who identified a gradual change from an unstable wandering channel to a stable, confined sinuous channel from 1990. These studies, however, have been based largely on a limited number of field measurements in the pre-flooding and post-flooding periods and difficulties remain in accurately quantifying the morphological adjustments of the wandering reach of the LYR likely because the wandering reach of the LYR is a very complex channel-floodplain system within which very frequent migrations of the pathways of the main flow occur during flood seasons [17,29].
Although RS (remote sensing) and GIS have been shown to be effective methods for evaluating short-term and medium-term morphological changes in alluvial rivers [9,12,32,33], few studies have used them to determine the planimetric and transverse adjustments of river channels in response to alterations in river runoff and sediment. This study is an attempt to quantify the spatio-temporal adjustment of river morphology in the wandering reach of the LYR since 1979 by using multi-period Landsat images in combination with field observations. For this purpose, this study performed a detailed investigation of the planimetric and transverse morphological changes of the wandering reach of the LYR by extracting representative morphological indices (including wandering belt area and width, pathway length of the main flow, water surface area, and number of bends) from available Landsat satellite images and, consequently, determines the quantitative relationships between the indices and river flow conditions.

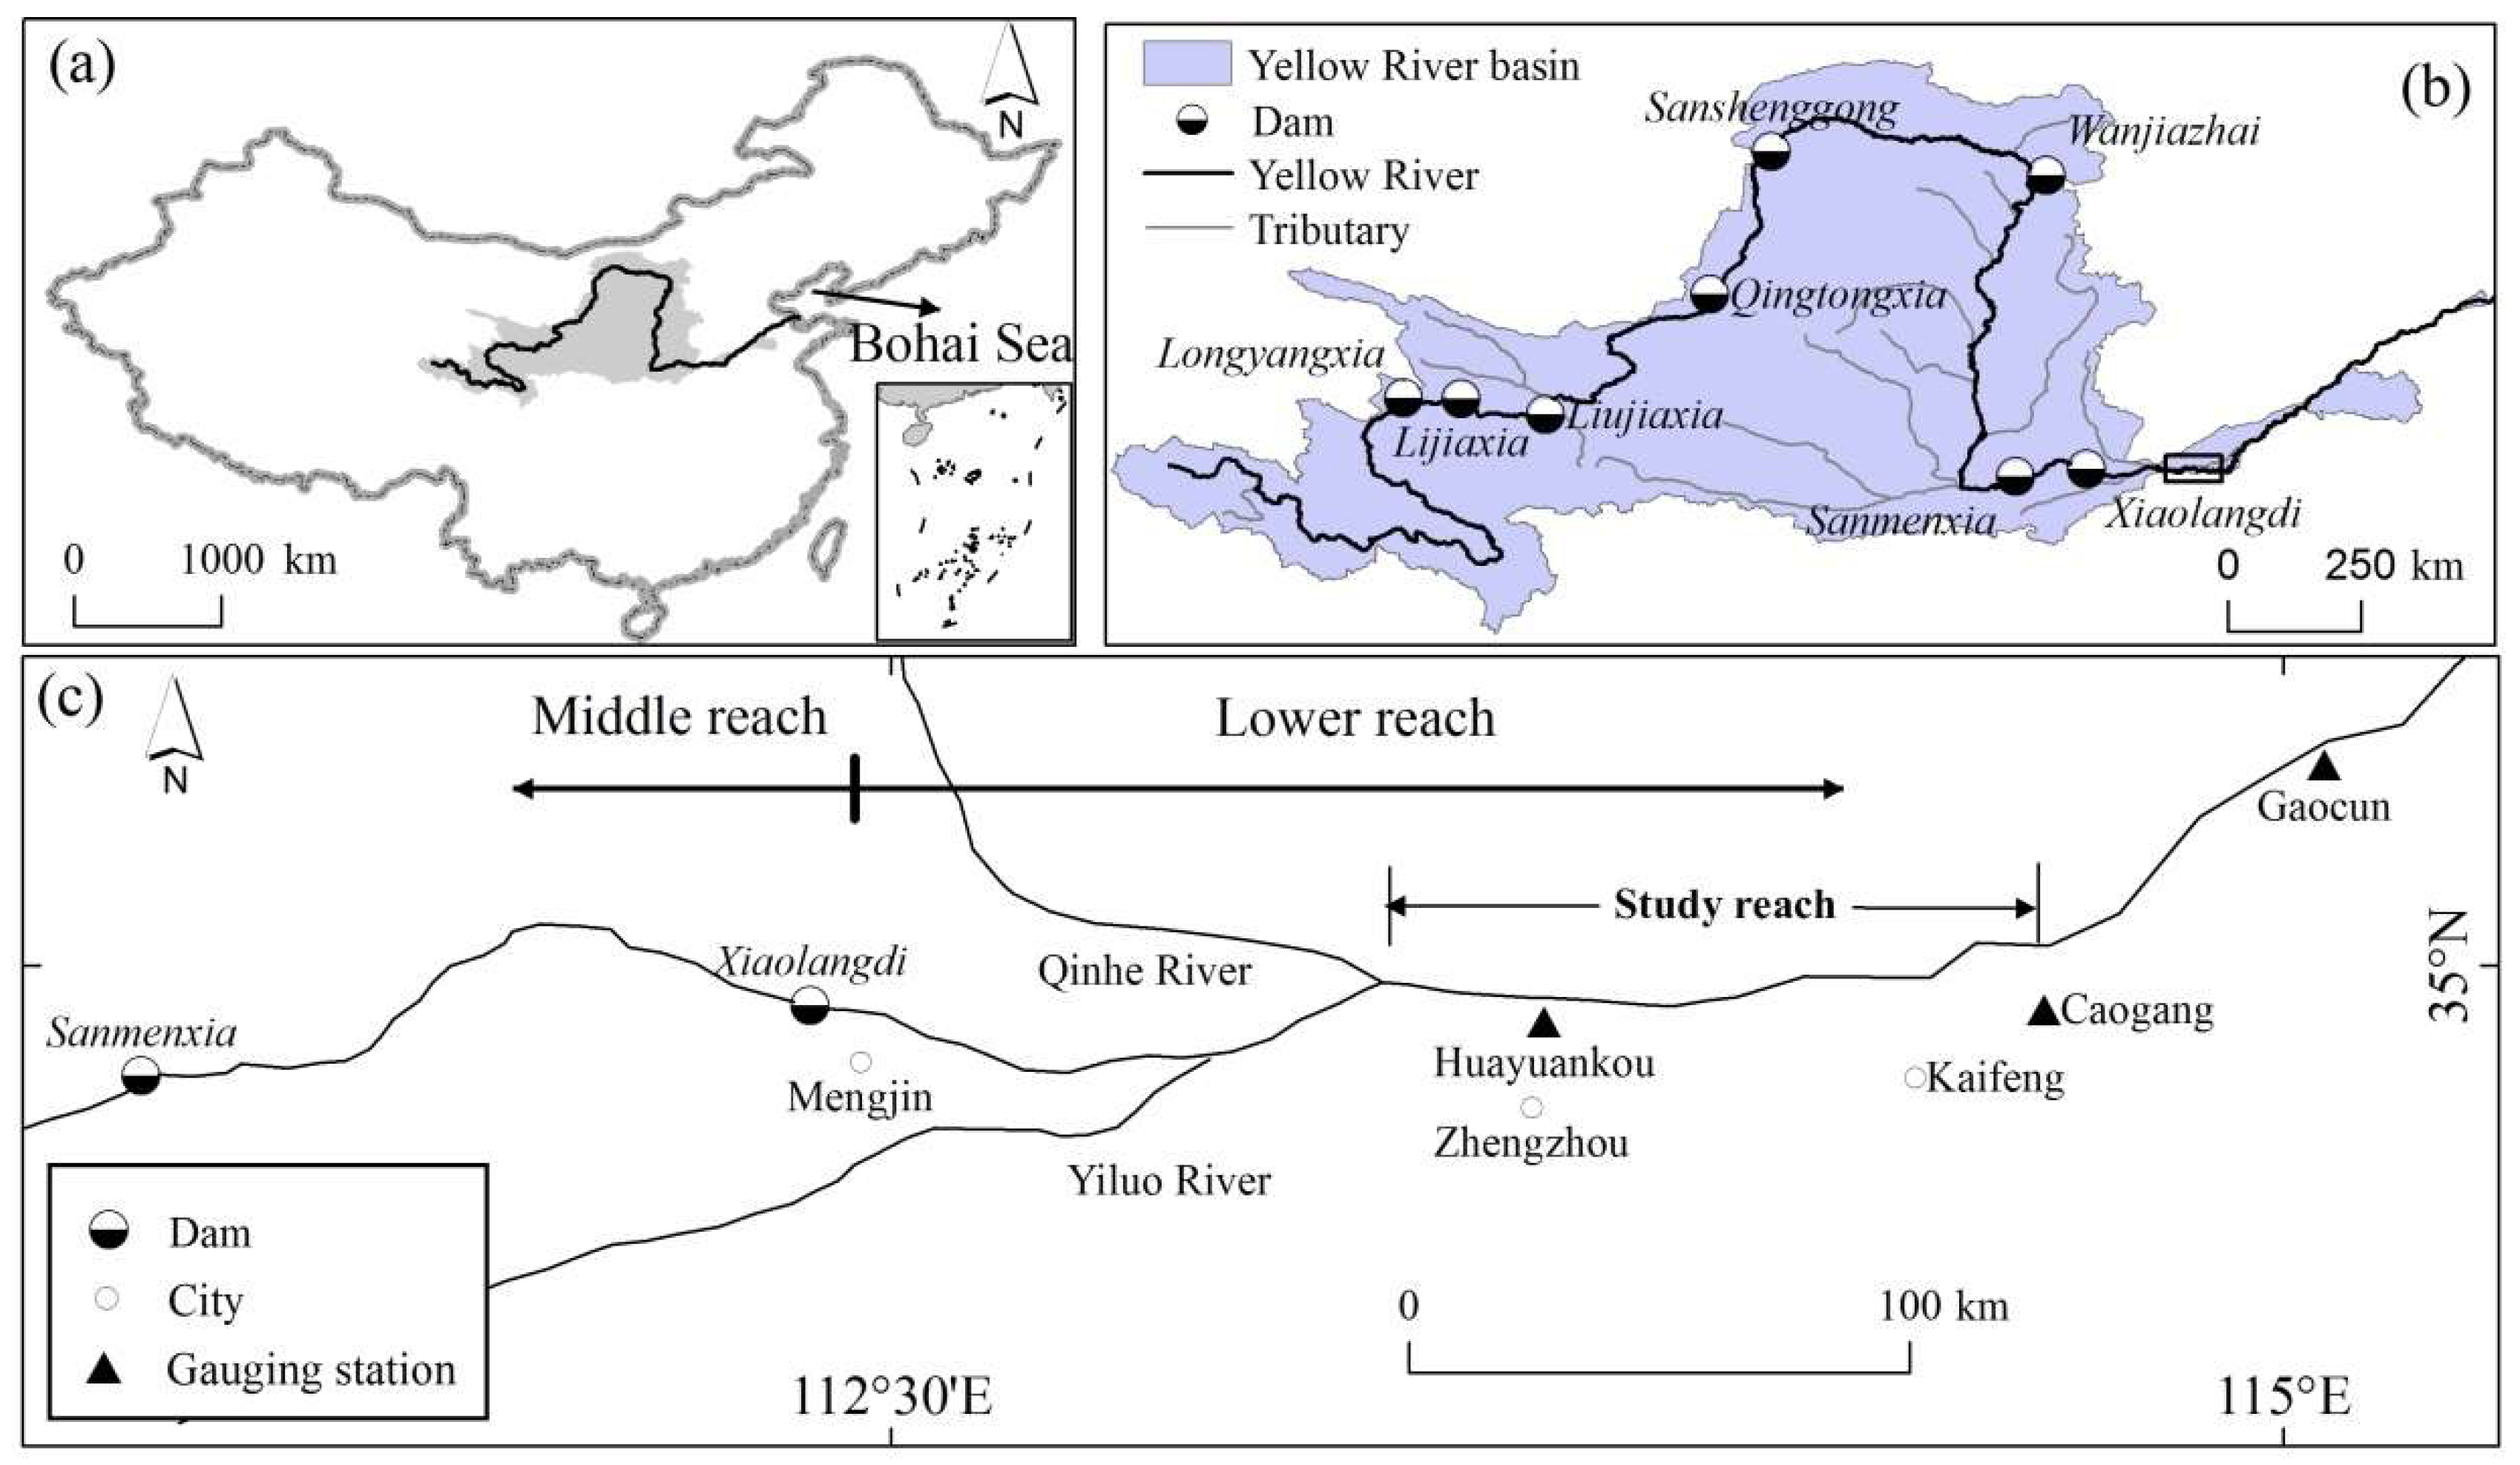
2. Regional Setting of the Study Area

The Yellow River originates on the Tibet Plateau and follows a tortuous 5464 km course to eventually enter the Bohai Sea, which is a continental sea of China (Figure 1a,b) and one of the world’s longest rivers. In the middle reach, the Yellow River traverses the extremely erodible Loess Plateau, which contributes to the majority of the river’s sediment supply and makes the Yellow River the most sediment-laden river in the world [25]. With the continual input of a huge amount of sediment, the Lower Yellow River (LYR) has encountered a high rate of sedimentation over a very long period and the riverbed has consequently been uplifted considerably. To prevent disastrous effects of large floods from happening in the LYR, main dykes on the opposite sides of the LYR have been continuously reinforced and raised since 1950, which resulted in a so-called “perched” or “hung” river with some parts of the riverbed being even more than 10 m higher than the ground outside the main dykes where millions of people are living [29].
Over a total length of 878 km, the LYR develops a typical wandering planform in the upper reach of 97 km long and gradually transits into a typical meandering planform in the downstream reach (Figure 1c). In contrast to the relatively stable channel morphology in the downstream reach, the wandering reach of the LYR has been very active in adjusting channel morphology in response to the variation of water and sediment input. Over this reach, the flow runs in a very complex channel-floodplain system in which the transverse cross-profile takes a spacing of 5–20 km between the opposite main dykes and consists of a very wide channel and floodplains within the main and secondary dykes constructed by local farmers since the 1970s [29]. Although the river channel over the reach is very wide and shallow at the bankfull level, a very large proportion of flow or main flow concentrates only in a small part of the channel and forms a main channel in the deepest part of the channel. As a result, sandy bars occupy the largest part of the channel except the main channel when the water level is lower than the bankfull. Due to the continual sediment deposition, the main channel and pathway of the main flow have been subject to frequent migrations, which consequently develops a wandering belt over the whole study reach [15,17,34]. Figure 2 presents the cross-sectional profiles of the Yellow River near the Huayuankou gauging station (covering main and secondary floodplains and river channel) measured from the south dyke to the north dyke in the pre-flood seasons of 1979, 1983, and 1989 and from the north dyke to the south dyke in the pre-flood seasons of 2006, 2010, and 2015, respectively. Clearly seen from Figure 2 is the year-scale migration of the main channels below the red lines, which represent the water levels when the cross-sectional profiles were measured. It can also be noticed from Figure 2 that between 1979 and 2015, the width of the main channel varies between 600 m and 3000 m, which is much larger than the resolution of 30 m of the selected remote sensing images. Hence, the use of the remote sensing images to evaluate the wandering range of the main flow in the LYR is an acceptable method.
Since the 1950s, the Yellow River basin has been subject to intense water resources development and practices of various soil and water conservation measures [30,35]. Typically, many large water conservancy projects have been constructed in the upper and middle drainage basins including the Longyangxia, Liujiaxia, and Sanmenxia Reservoirs (Figure 1b). All of these have contributed to the significant reductions of runoff and sediment input to the LYR before 2002 [35]. Since 2002, a very large reservoir constructed at Xiaolangdi or the Xiaolangdi Reservoir took full operation jointly with the other large reservoirs constructed previously such as the Sanmenxia, Longyangxia, Liujiaxia, and Wanjiazhai Reservoirs. As a result, the runoff entering into the LYR increases to a degree since 2002 while sediment input to the LYR still follows a declining trend [29].

3. Data and Methods

3.1. Data Sources

The Landsat remote sensing images used in this study were derived from a range of sensors including MSS (Multispectral Scanner), TM (Thematic Mapper), ETM (Enhance Thematic Mapper), and OLI-TIRS (Operational Land Imager- Thermal Infrared Sensor) and are obtained from the USGS (http://glovis.usgs.gov/). These images have a spatial resolution of 30 m except the MSS images, which have a spatial resolution of 78 m. We selected images taken during January or February each year because they correspond to low flows and can give a maximum exposure of the main channel and the pathway of the main flow including some that are often inundated at a higher water level. Due to the scarcity and poor quality of the early Landsat imagery, the December image is selected for 1979. In addition, the Landsat ETM7 image taken in February 2001 is used after restoration due to a component failure. All of the images selected have a cloud cover of <30% so that a maximum visibility of morphological features in the study reach can be obtained. Detailed information on the Landsat images used in the study is presented in Table 1.
The longest hydrological record for the Lower Yellow River (LYR) is held at the Huayuankou gauging station, which was set up in 1938. Flow discharge, the water level, and suspended sediment concentration entering into the LYR are measured daily while the transverse cross-profile of the river near the gauging station is measured twice each year, respectively, in the pre-flood and post-flood seasons. The hydrological data recorded at the station are made available by the Yellow River Conservancy Commission (YRCC) of China. The annual maximum flow discharges from 1990 to 1999 and 2002 to 2005 and in 2007 used in this study are obtained from the Hydrology Bureau of YRCC. The remaining annual maximum flow discharges are obtained from the hydrological statistical yearbooks released by YRCC each year. Eight cross-profile measurements on the study reach used to calculate the geometries of the bankfull and main channels in this study are also obtained from YRCC.

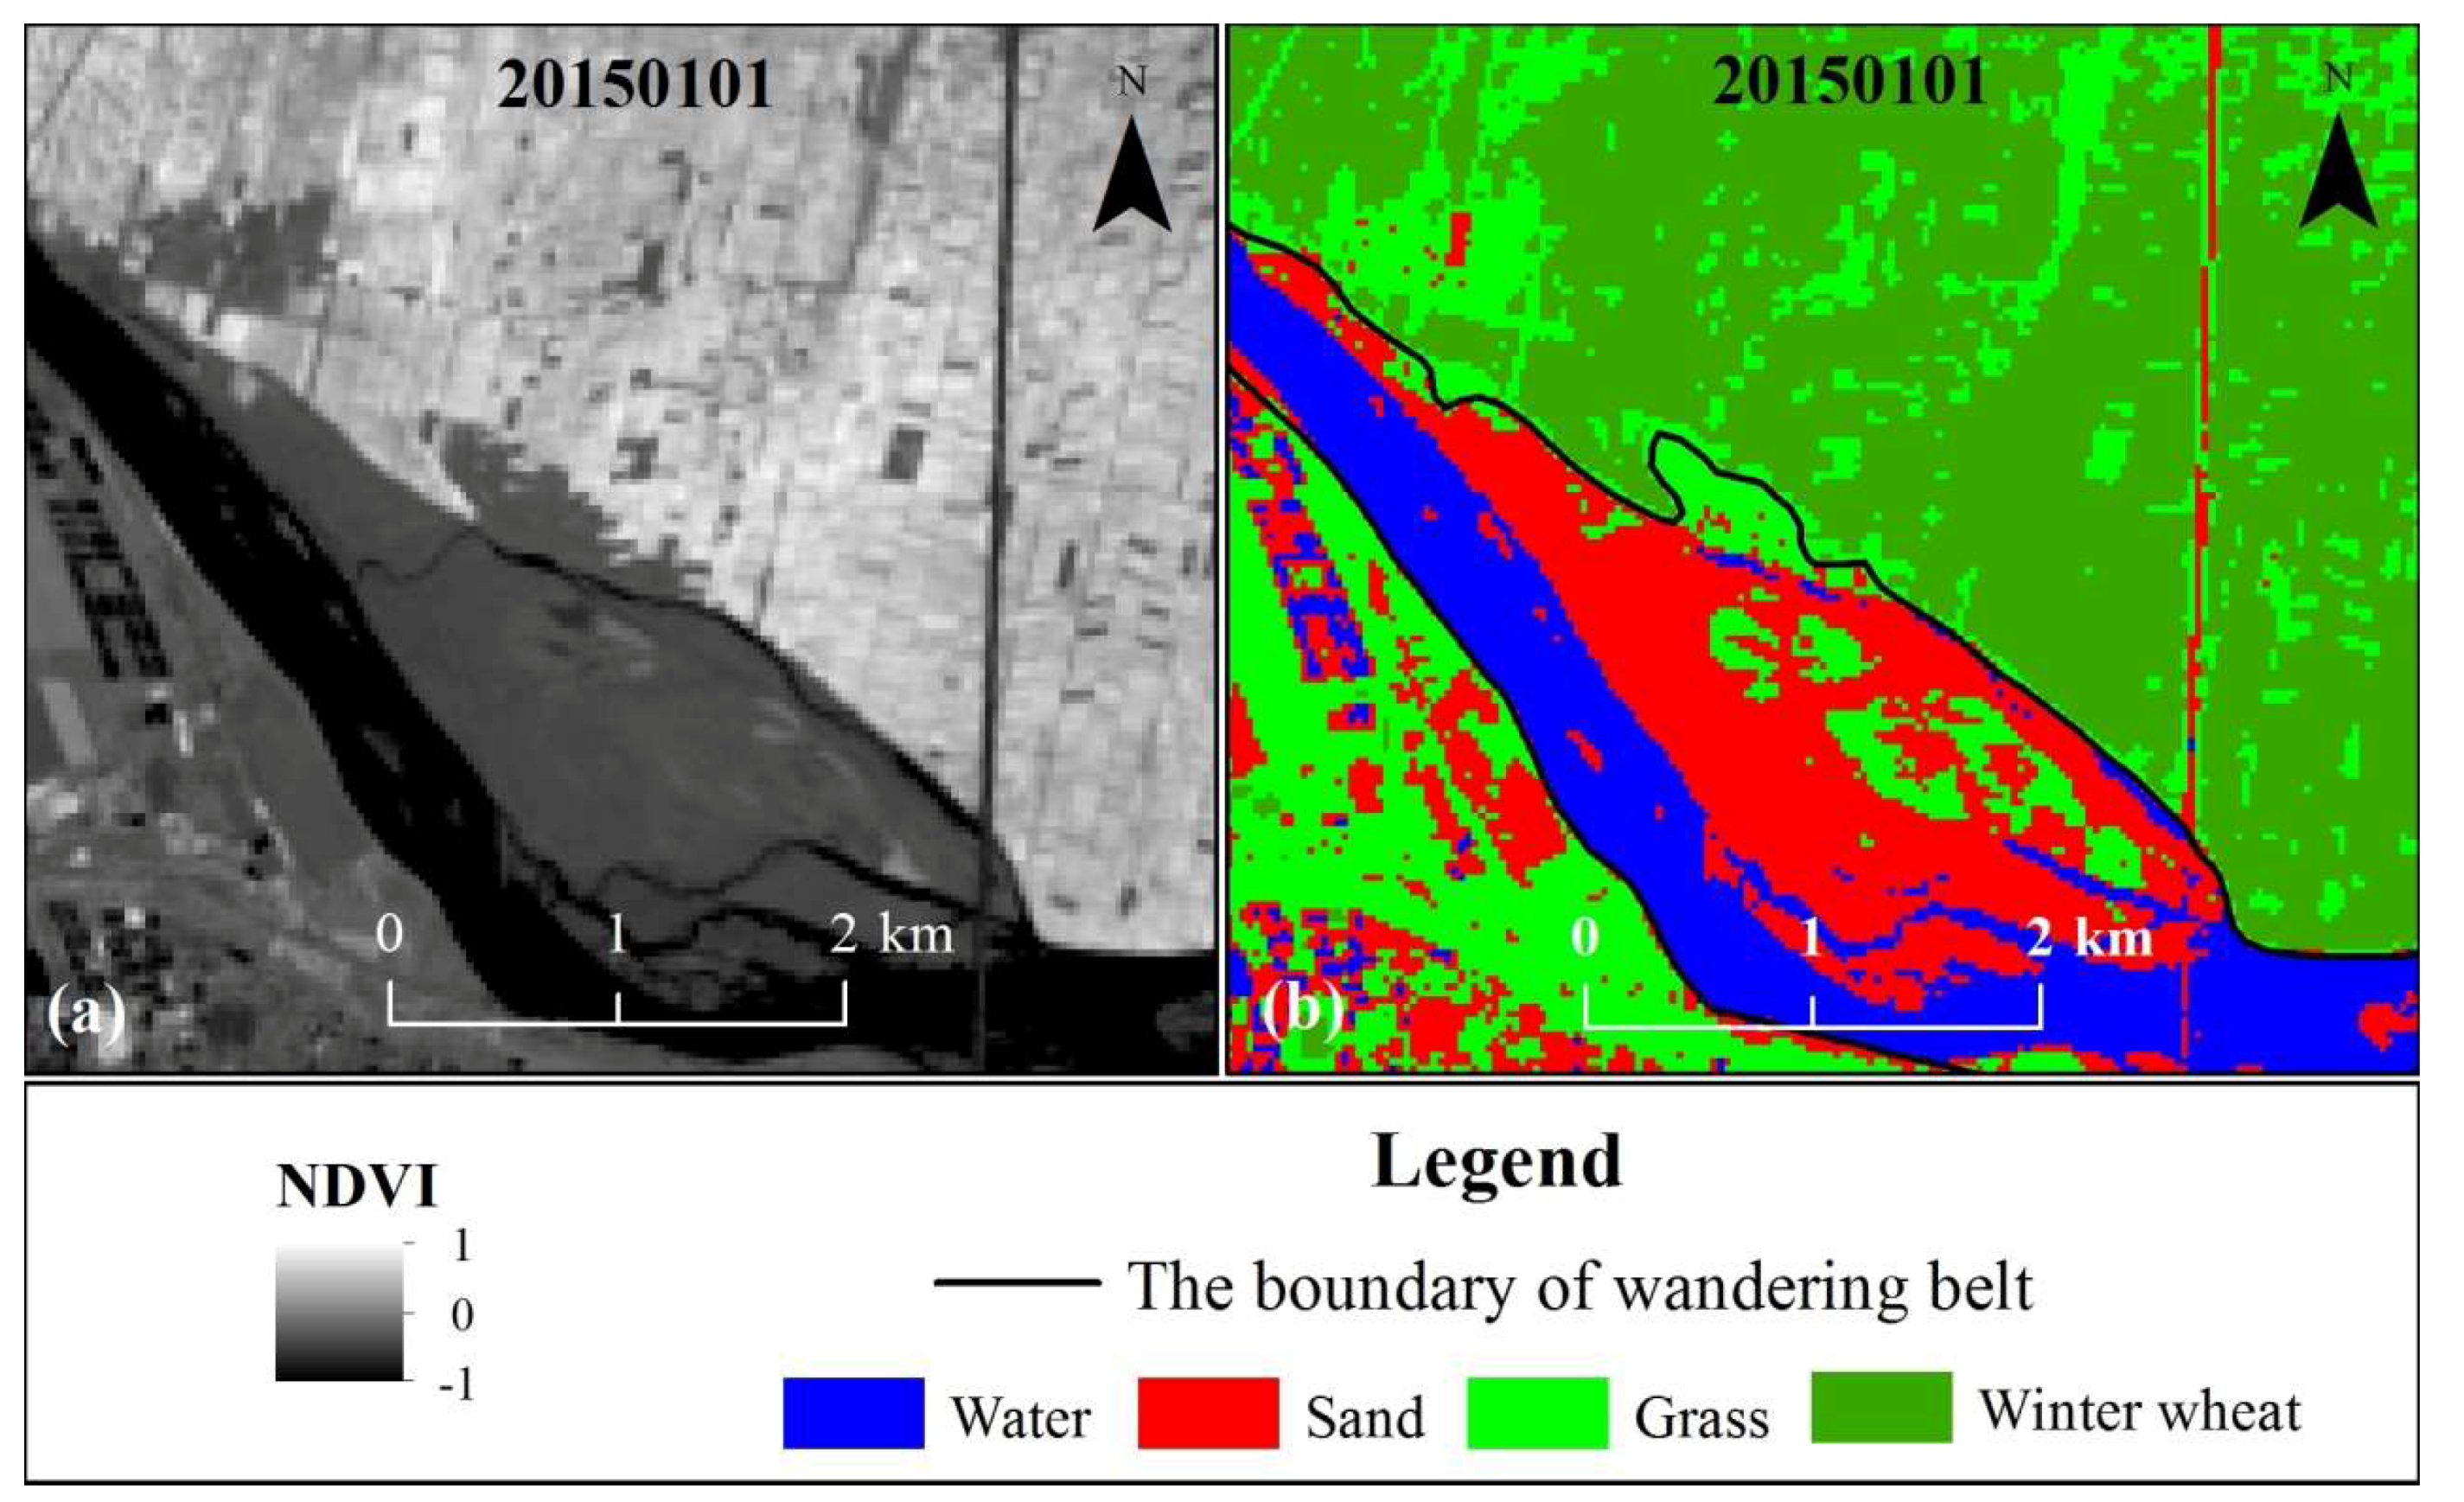
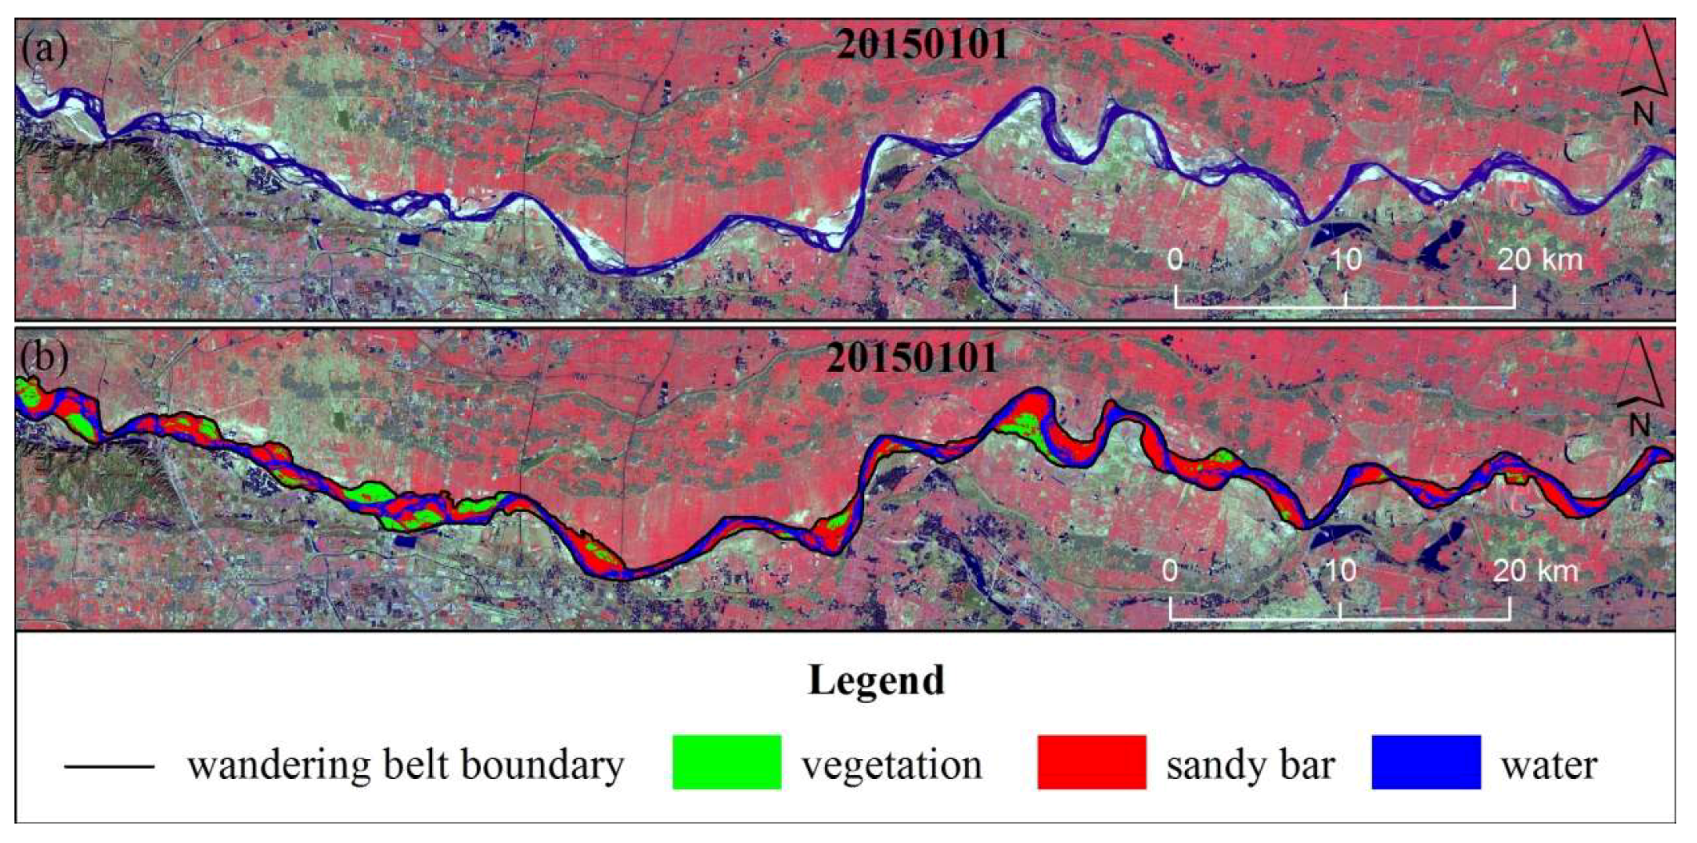
3.2. Methods for Identifying the Morphological Changes in the Study Reach

The use of remote sensing based satellite images in river morphological change research has been practiced in various river basins worldwide [4,9,10,33]. In this study, 10 Landsat images taken during 1979 to 2015 are selected to evaluate the channel morphological change of the study reach and Figure 3 presents the selected images of a false color composite. Since the rotation and curvature of the Earth and many other factors can result in a degree of geometric deformation in satellite imageries, the selected Landsat images are pre-processed for geometric correction prior to the extraction of morphological indices. To ensure a high level of accuracy in extracting morphological indices, the root mean squared error (RMSE) in our geometric correction for each selected image is kept within the range of ≤1.5 pixels.
After the geometric correction, ENVI 5.1 software (ITT Visual Information Solutions, Broomfield, CO, USA) is deployed to perform a non-supervised classification of the objects that can be identified at different spectral bands in the selected images using the ISODATA (Iterative Self-Organizing Data Analyze Technique) tool (ITT Visual Information Solutions, Broomfield, CO, USA). Afterward, a detailed field investigation is conducted to examine the overlaps among the objects. Consequently, the objects with a similar property are merged and then a supervised classification is conducted using the maximum likelihood classification tool in ENVI 5.1 to obtain a very accurate spatial distribution of the objects in the selected images.
Because the cross-profile of the river is a very complex channel-floodplain system shown in Figure 2 within which the channel of the Yellow River is very wide and shallow, a very large proportion of flow, i.e., main flow, concentrates in only a small part of the channel, i.e., main channel. Furthermore, the pathway of the main flow migrates frequently within the wide cross-profile of the river. Even though Figure 2 shows the migration of the main channel at a very long timescale, the migration takes place mainly during flood seasons with many occurrences often in one flood season [29]. Consequently, a belt within which the main flow has reached is formed in space for the period concerned, which is shown in Figure 4 and Figure 5 and explained by Reference [17]. As stated earlier, identifying the boundary of the wandering belt from the selected remote sensing images is the main purpose of this study.
Vegetation has long been regarded as a main criterion in extracting the boundaries of morphological changes from remote sensing images and, in many circumstances, it has been demonstrated clearly that using remote sensing technology to investigate geomorphological changes is an effective and economical method [10,36]. For a remote sensing image, the spatial distribution of Normalized Difference Vegetation Index (NDVI) can be calculated directly using the following commonly applied equation.
NDVI = ρ N I R ρ R ρ N I R + ρ R
where ρ N I R is the reflectivity of the near infrared band. ρ R is the reflectivity of the red light band.
With the calculated distributions of NDVI from the selected remote sensing images for our study area, our detailed field investigations have found that, within the vegetation area classified from the selected remote sensing images, the subareas with large NDVI values (>0.25) are planted with winter wheat while the subareas with small NDVI values (<0.25 and >0) are covered with wild grass or vegetables or scarcely planted winter wheat. Local residents planted winter wheat in those subareas because floods hardly affect the areas. Hence, those subareas with large NDVI values are outside the wandering belt. To determine which subareas with low NDVI values are also located outside the wandering belt, our field investigations found that the subareas cultivated by local farmers take regular shapes and exhibit consistent textures, which are consequently regarded as suitable criteria for determining if the subareas with lower NDVI values are also outside the wandering belt. In addition, Google Earth is used to help identify the locations of the main dykes on the opposite sides of the river and the flow control projects constructed from all of the selected remote sensing images. Moreover, fishponds constructed by local farmers are also located largely outside the wandering belt because floods affect them less.
The water body except fishponds constructed by local farmers and unvegetated sandy central and point bars developed in the complex channel-floodplain system of the study reach have low NDVI values (<0.0) and are the major parts of the wandering belt. Nevertheless, those central and point bars covered with low grass with low NDVI values (<0.25 and >0.0) also need to be included in the wandering belt because they encounter frequent inundations by floods and yet the generally small depth of water over them does not allow grass to grow to a significant height there.
In light of the links between the values of NDVI and vegetation types and using Google Earth, the outcome of the supervised classification and the regular and consistent characteristics of human cultivation and construction as aids, we examined all of the selected original remote sensing images in a more detail form and obtained the spatio-temporal variation of the wandering belt for the study reach. Following the differentiation of all the areas inside and outside the wandering belt, the boundary of the wandering belt in our study reach is extracted manually from all the selected remote sensing images. To evaluate the degree of wandering in the channel morphology of the LYR each year, an index termed wandering belt width is used in this study, which is defined as the ratio of the wandering belt area to the length of the main flow pathway in the entire study reach.
With the original Landsat image taken in January 2015 for the study reach as an example, Figure 4 presents the spatial distributions of NDVI calculated, different objects and the boundary of the wandering belt extracted from the remote sensing image in a small area enlarged for a clearer visual comparison while Figure 5 shows the spatial distributions of those variables in the entire study area.
The main flow in a river channel occurs in the zone of maximum longitudinal velocity and, therefore, has a high carrying capacity of sediment or a higher sediment concentration [37]. This zone can be detected from the band difference in a remote sensing image. For a visible spectral remote sensing, the red band with a wavelength of 0.63–0.68 μm is the most sensitive for identifying the change in sediment concentration of flow. Hence, the spatio-temporal distribution of NDVI in the study reach computed using the near-infrared and red bands provides an effective means for identifying the pathways of the main flow. Since high sediment concentration takes place along the main flow pathway, the values of NDVI are generally higher on the pathway. In a grey color map of NDVI distribution, the pathway of the main flow is generally brighter. Based on the visual difference, the central line of each main-flow pathway is extracted manually from the selected remote sensing images.
The sinuosity of a river channel is defined as the ratio of channel length to valley length [38,39]. In this study, the central line length of the pathway of the main flow is taken as the channel length. However, the sinuosity of the channel computed from the metrics extracted from the selected remote sensing images reflects its value at a one-year scale and, therefore, is different from its value at the other timescales to a degree. Both manual and automated extraction methods such as the supervised and non-supervised classification methods deployed in this study have been adopted in previous geomorphological studies [10,40,41,42,43,44,45]. Although some studies claimed advantages of automated methods, the automated methods are more suitable to extract channels of mountainous rivers, single thread rivers, and rivers with a detectable slope difference between the banks and the channel in the Digital Elevation Models (DEM) [40,43,44]. In contrast, manual methods appear more reliable to extract complicated channel boundaries of alluvial rivers [10,41,45]. Even though some studies raised the accuracy problem of using supervised classification methods when remote sensing images are used to distinguish fluvial units (e.g., sandy bars, vegetation, and water body) [42,46], Reference [42] claimed that the misclassification problem in large rivers should not be apparent when the simple route can be resolved in distinguishing geomorphological features at the basic level of a fluvial system. In this study, both supervised (maximum likelihood classification method) and unsupervised classifications are used in a combined way to distinguish the areas of the wandering belt, central bars, and the water body in the large wandering reach of the LYR at the low flows.

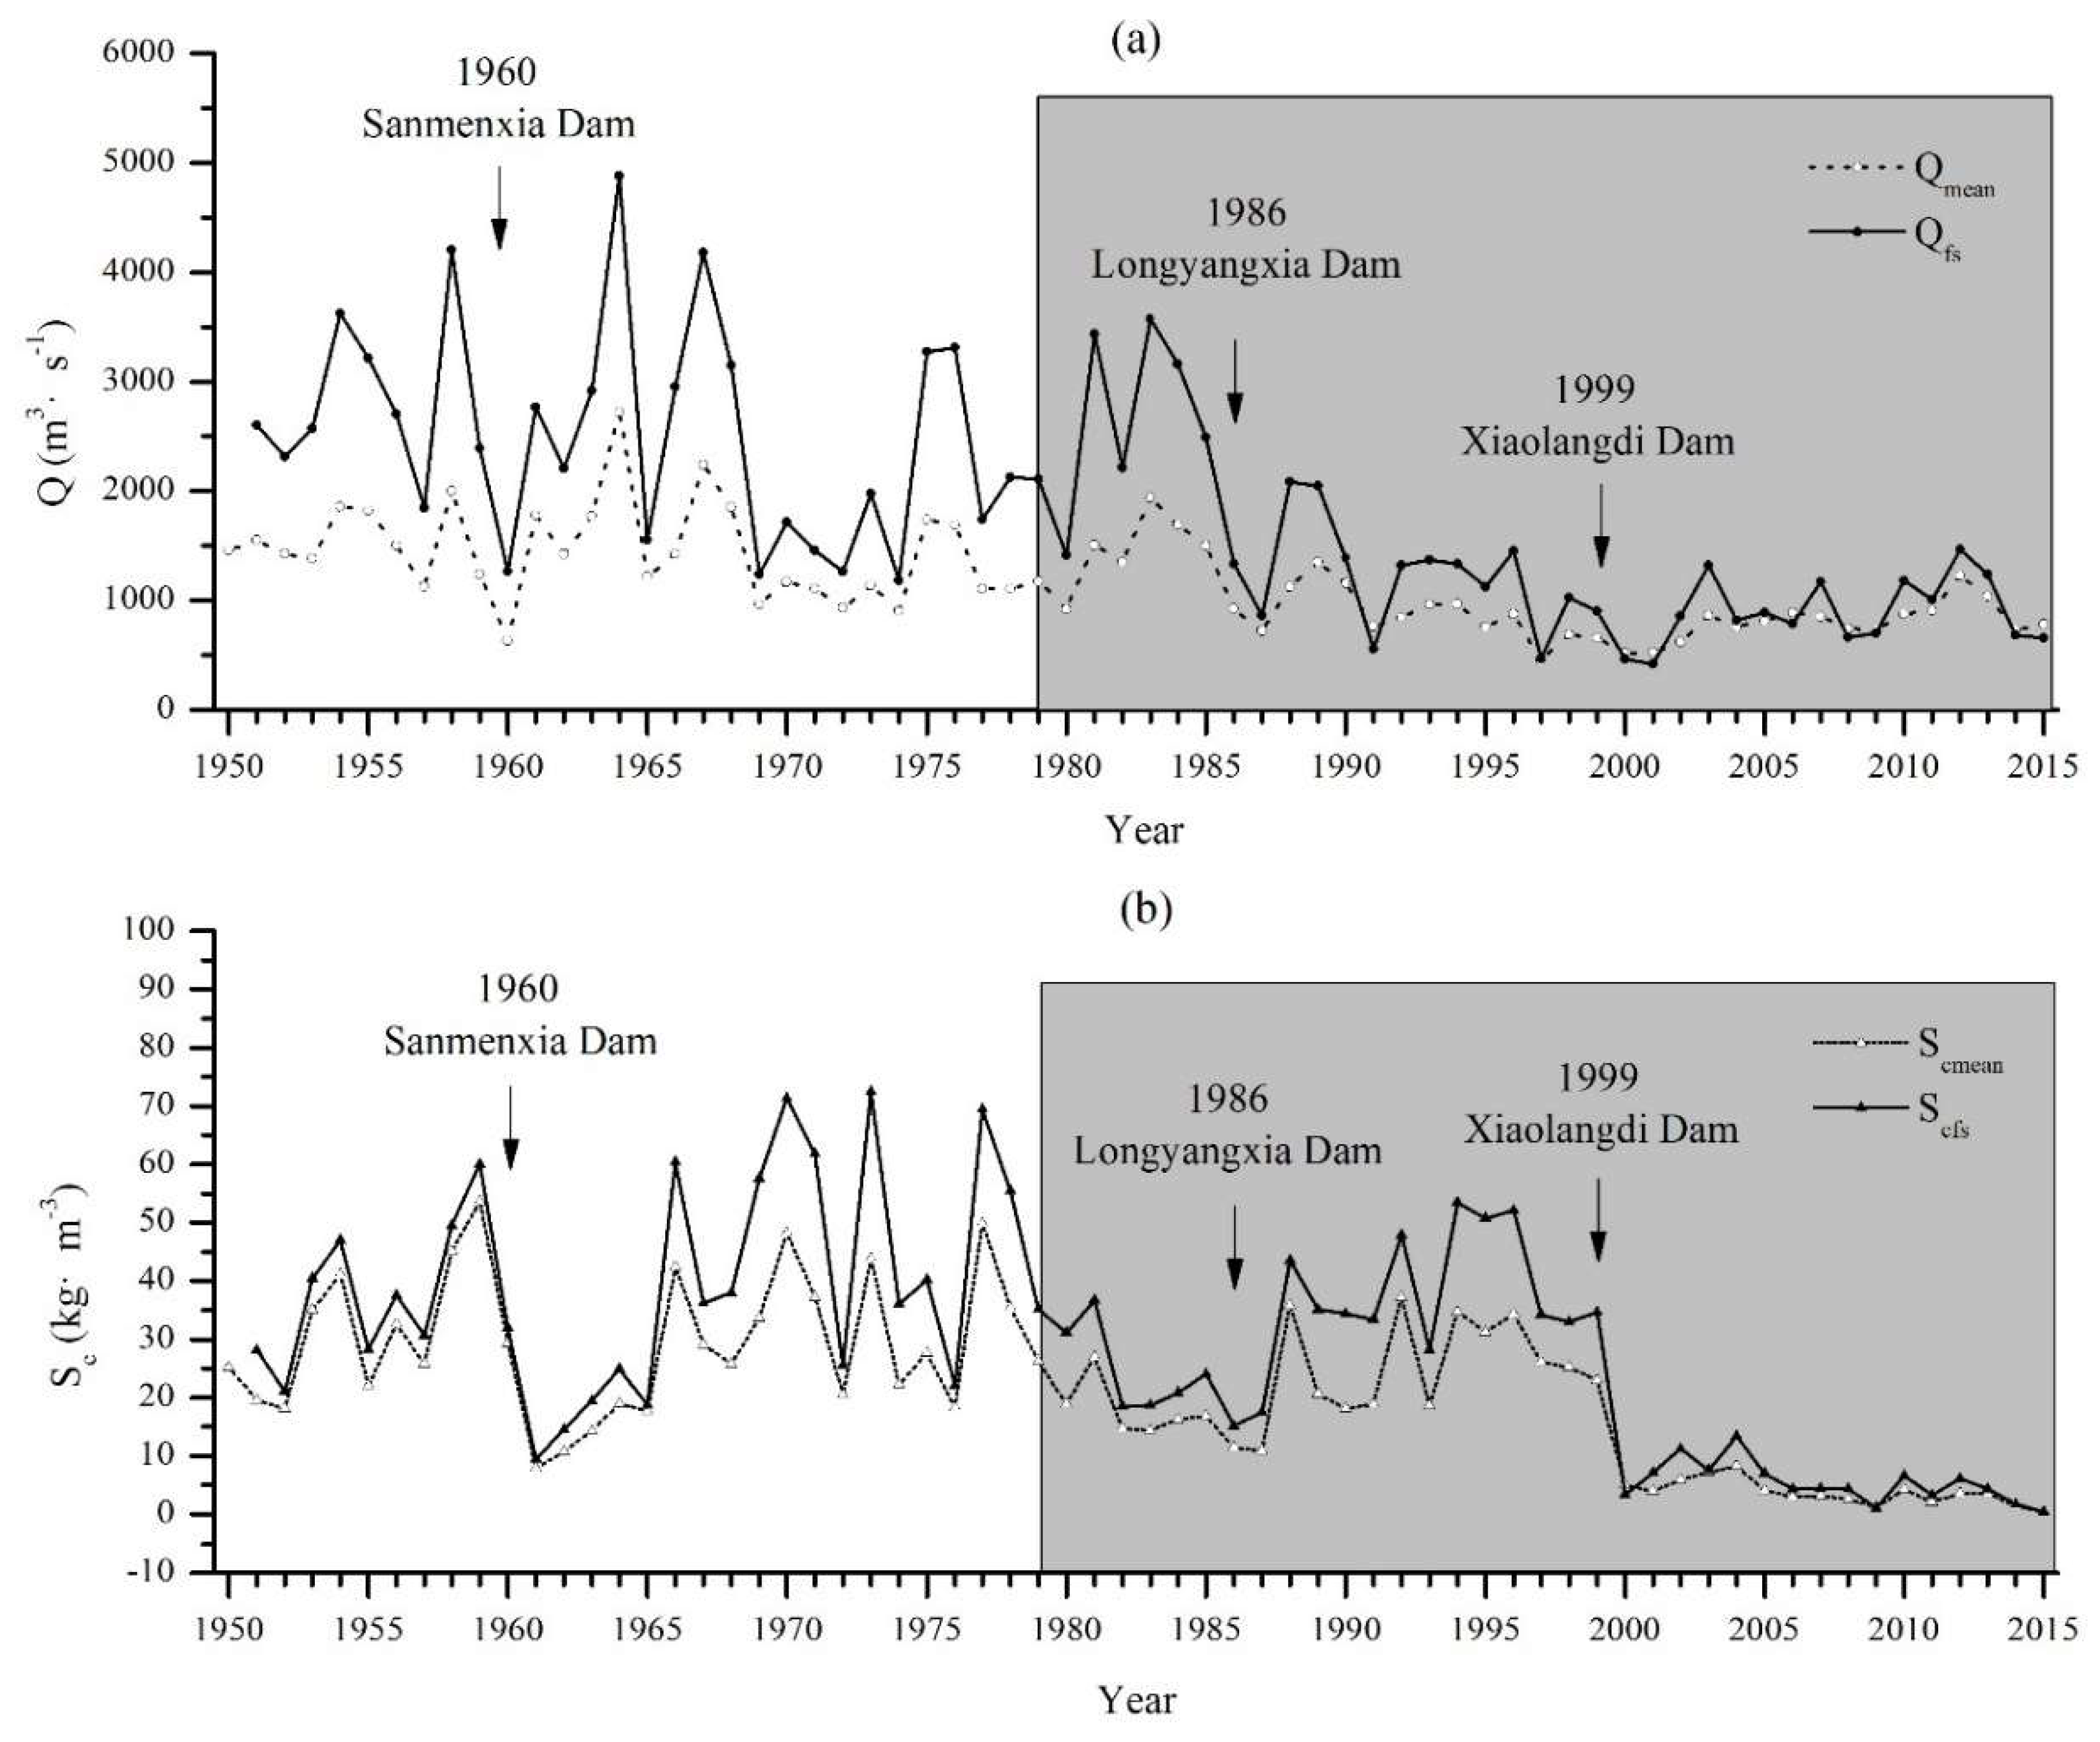
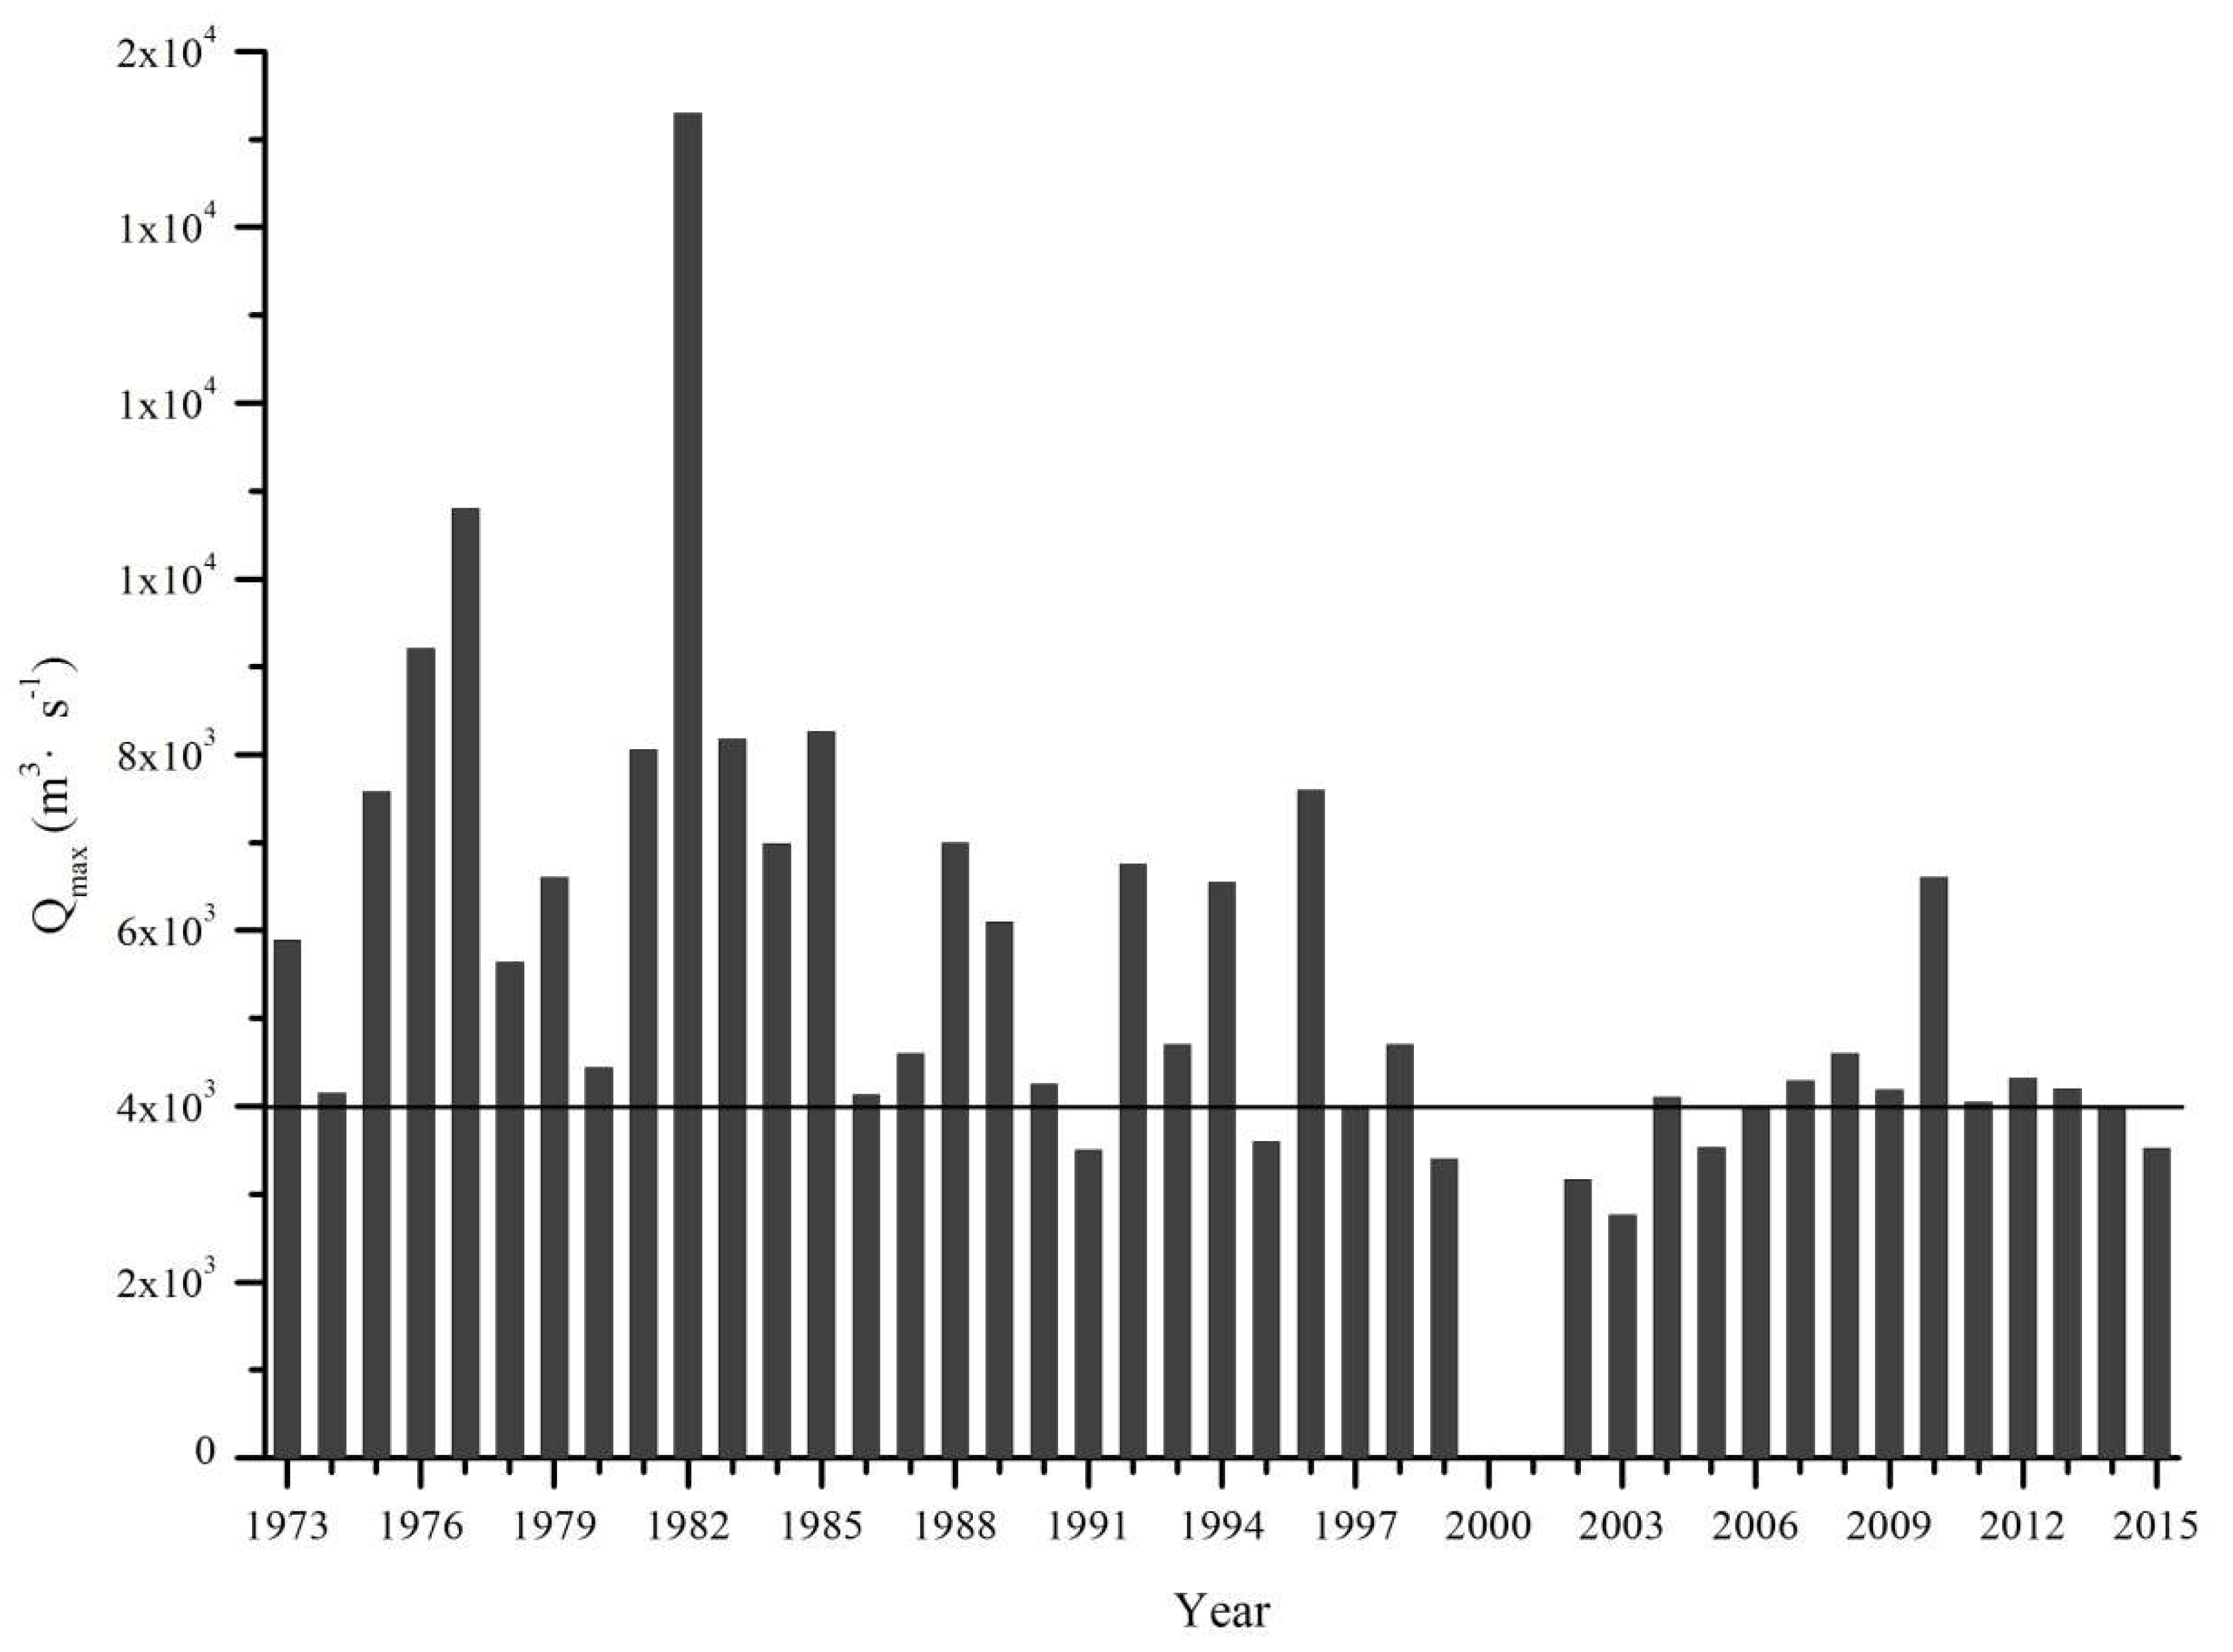
4. Variations in Flow Discharge and Sediment Concentration from 1979–2015

Figure 6 shows the variations in flow discharge (Q) and suspended sediment concentration of flow (Sc) at different timescales recorded at Huayuankou gauging station from 1950–2015. It can be seen that both the annual mean flow discharge (Qmean) and the mean flow discharge in the flood season (Qfs) varied in very complex forms: fluctuating within large ranges before 1985 and then taking a step-wise decline from 1985 to 2001 and reaching the lowest values in 2001. Since 2002, both Qmean and Qfs increased slightly and varied in very small ranges (Figure 6a). The annual mean suspended sediment concentration of flow (Smean) and the annual mean suspended sediment concentration in the flood season (Scfs) fluctuated within very large ranges and took relatively large values on average before 1999 while both took much smaller values varying in smaller ranges since 2000 with an overall very significant decline from 26.2 kg·m−i in 1979 to only 0.52 kg·m−n in 2015.
The variation in the annual maximum flow discharge (Qmax) recorded at Huayuankou gauging station is presented in Figure 7. It can be noticed that, from 1973 to 1990, all of the annual maximum flow discharges were larger than 4000 m3·s−1 with a maximum of 15,300 m3·s−1 in 1982. Between 1991 and 1999, however, almost half of the annual maximum flow discharges were less than or close to 4000 m3·s−1 and none were larger than 8000 m3·s−1. After 1999, almost all of the annual maximum flow discharges took values of around 4000 m3·s−1 except in 2010.

5. Results and Discussion

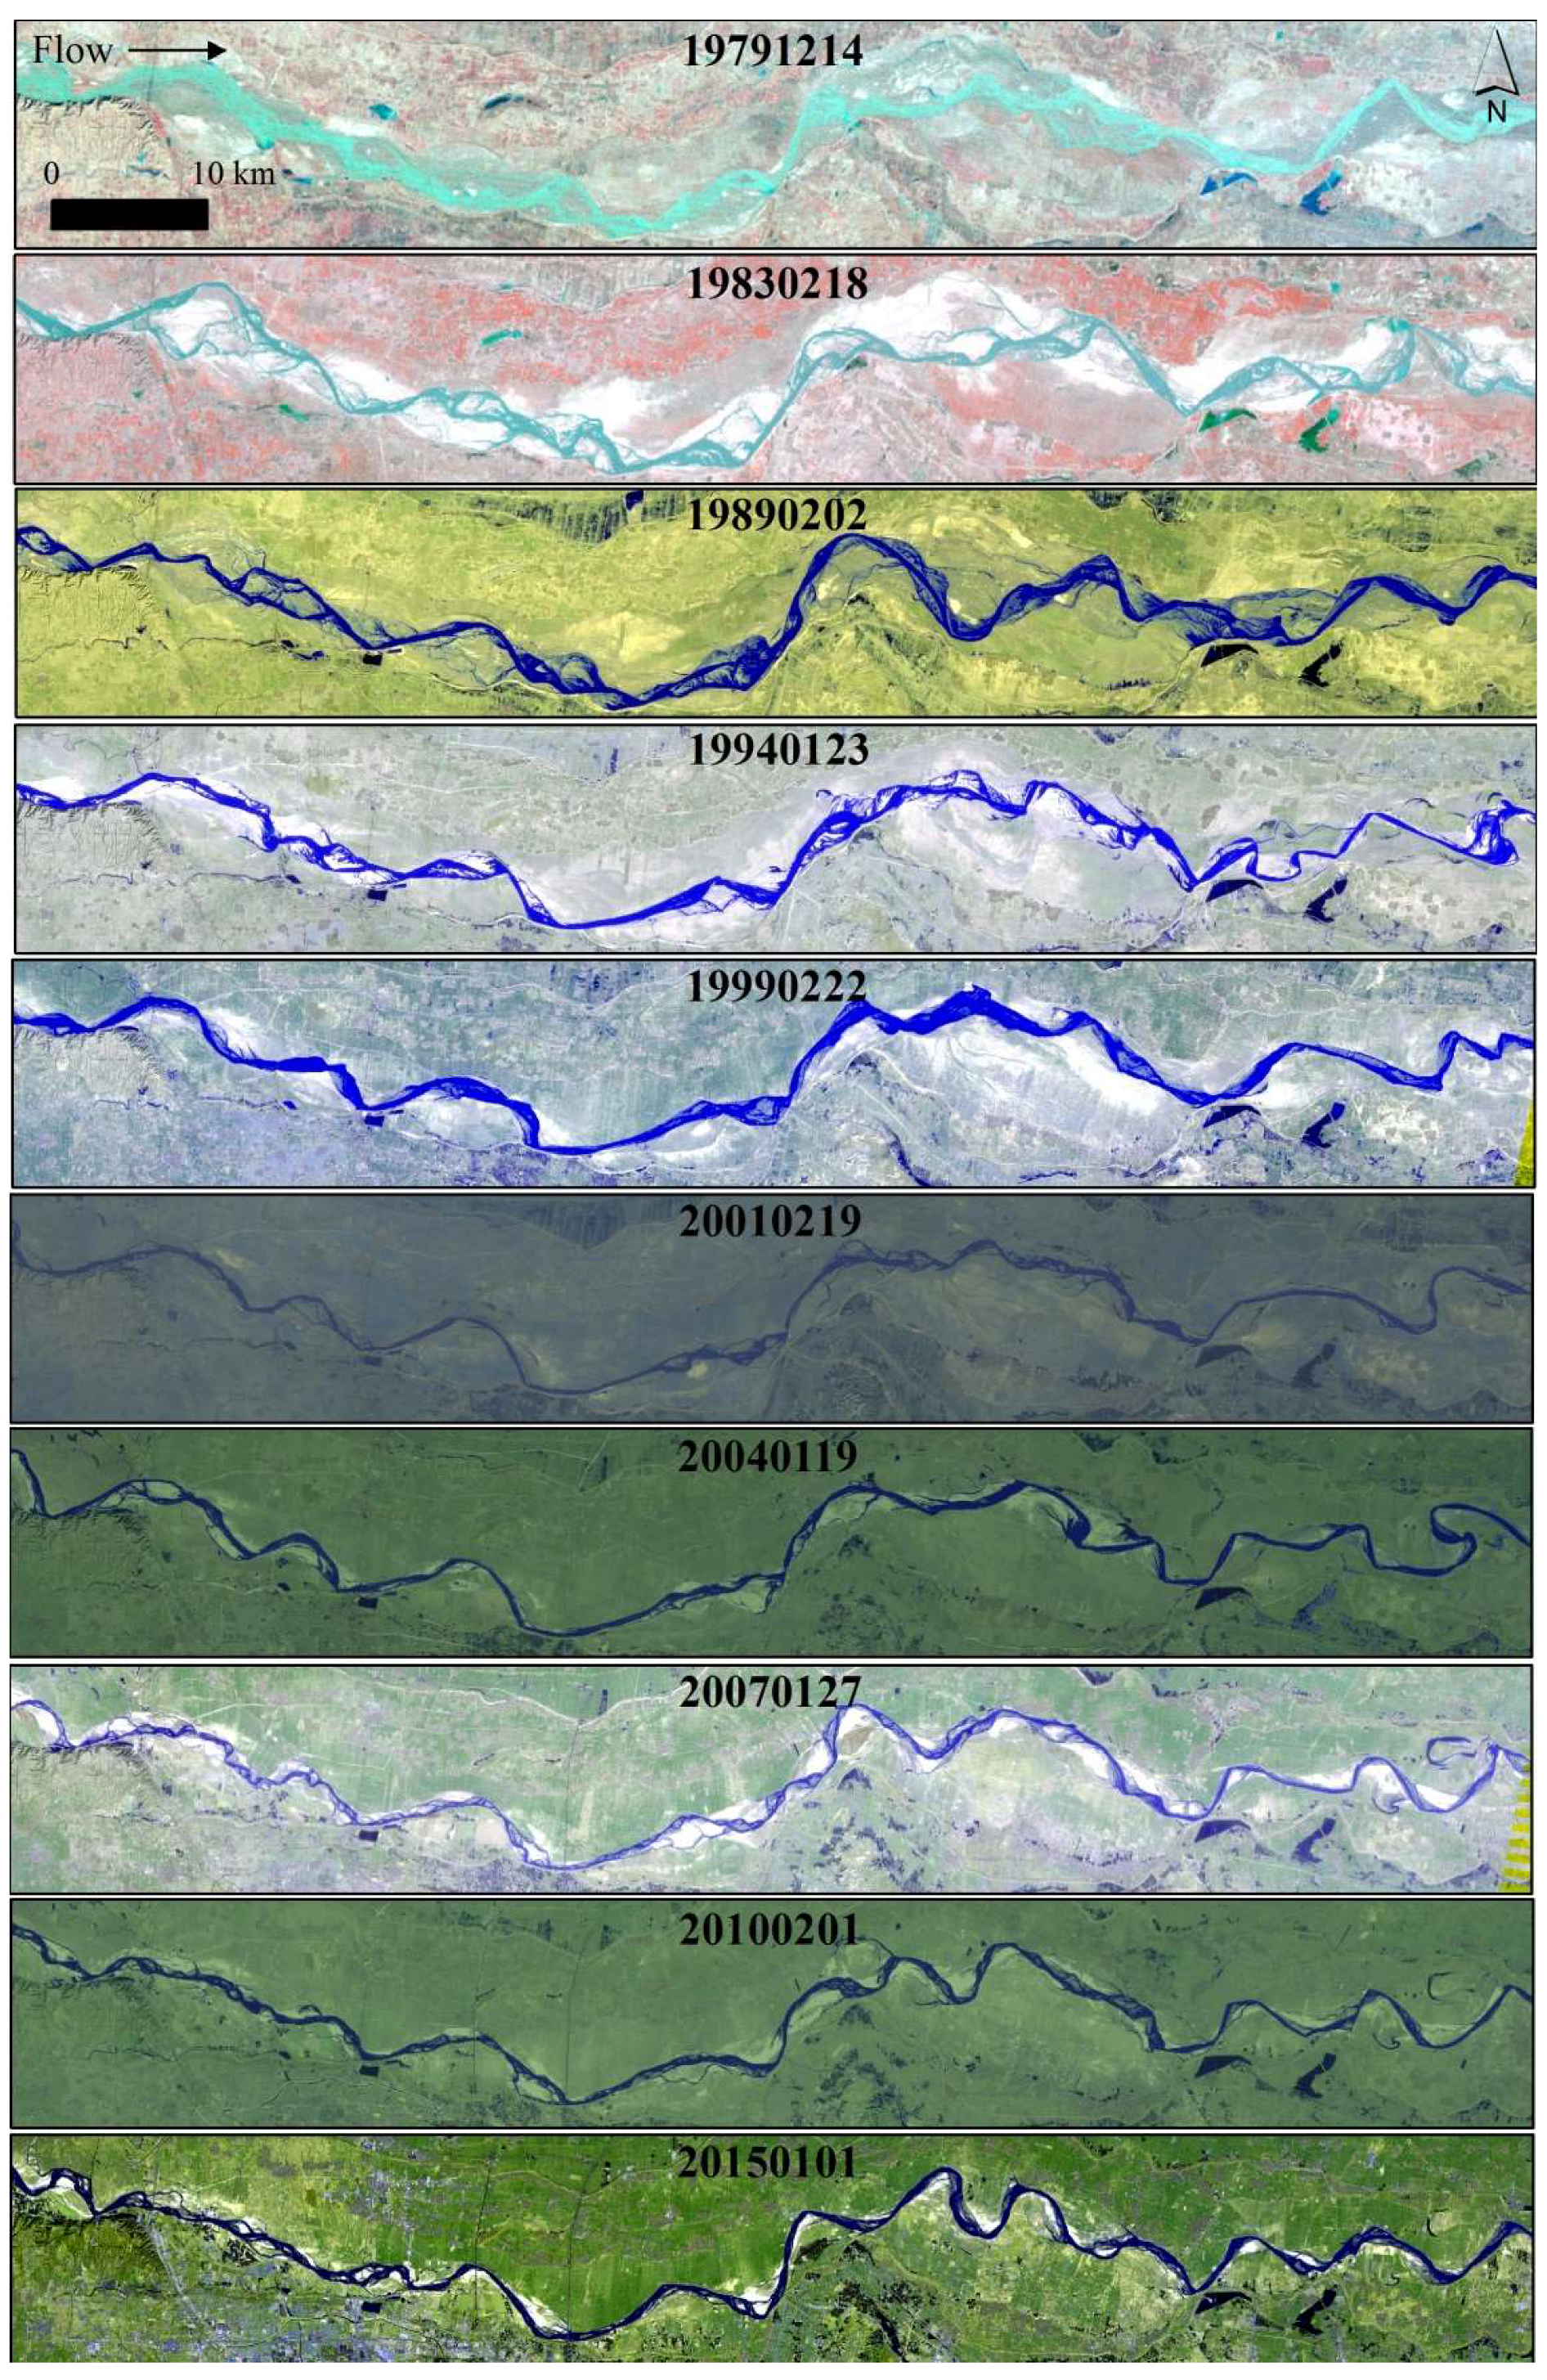
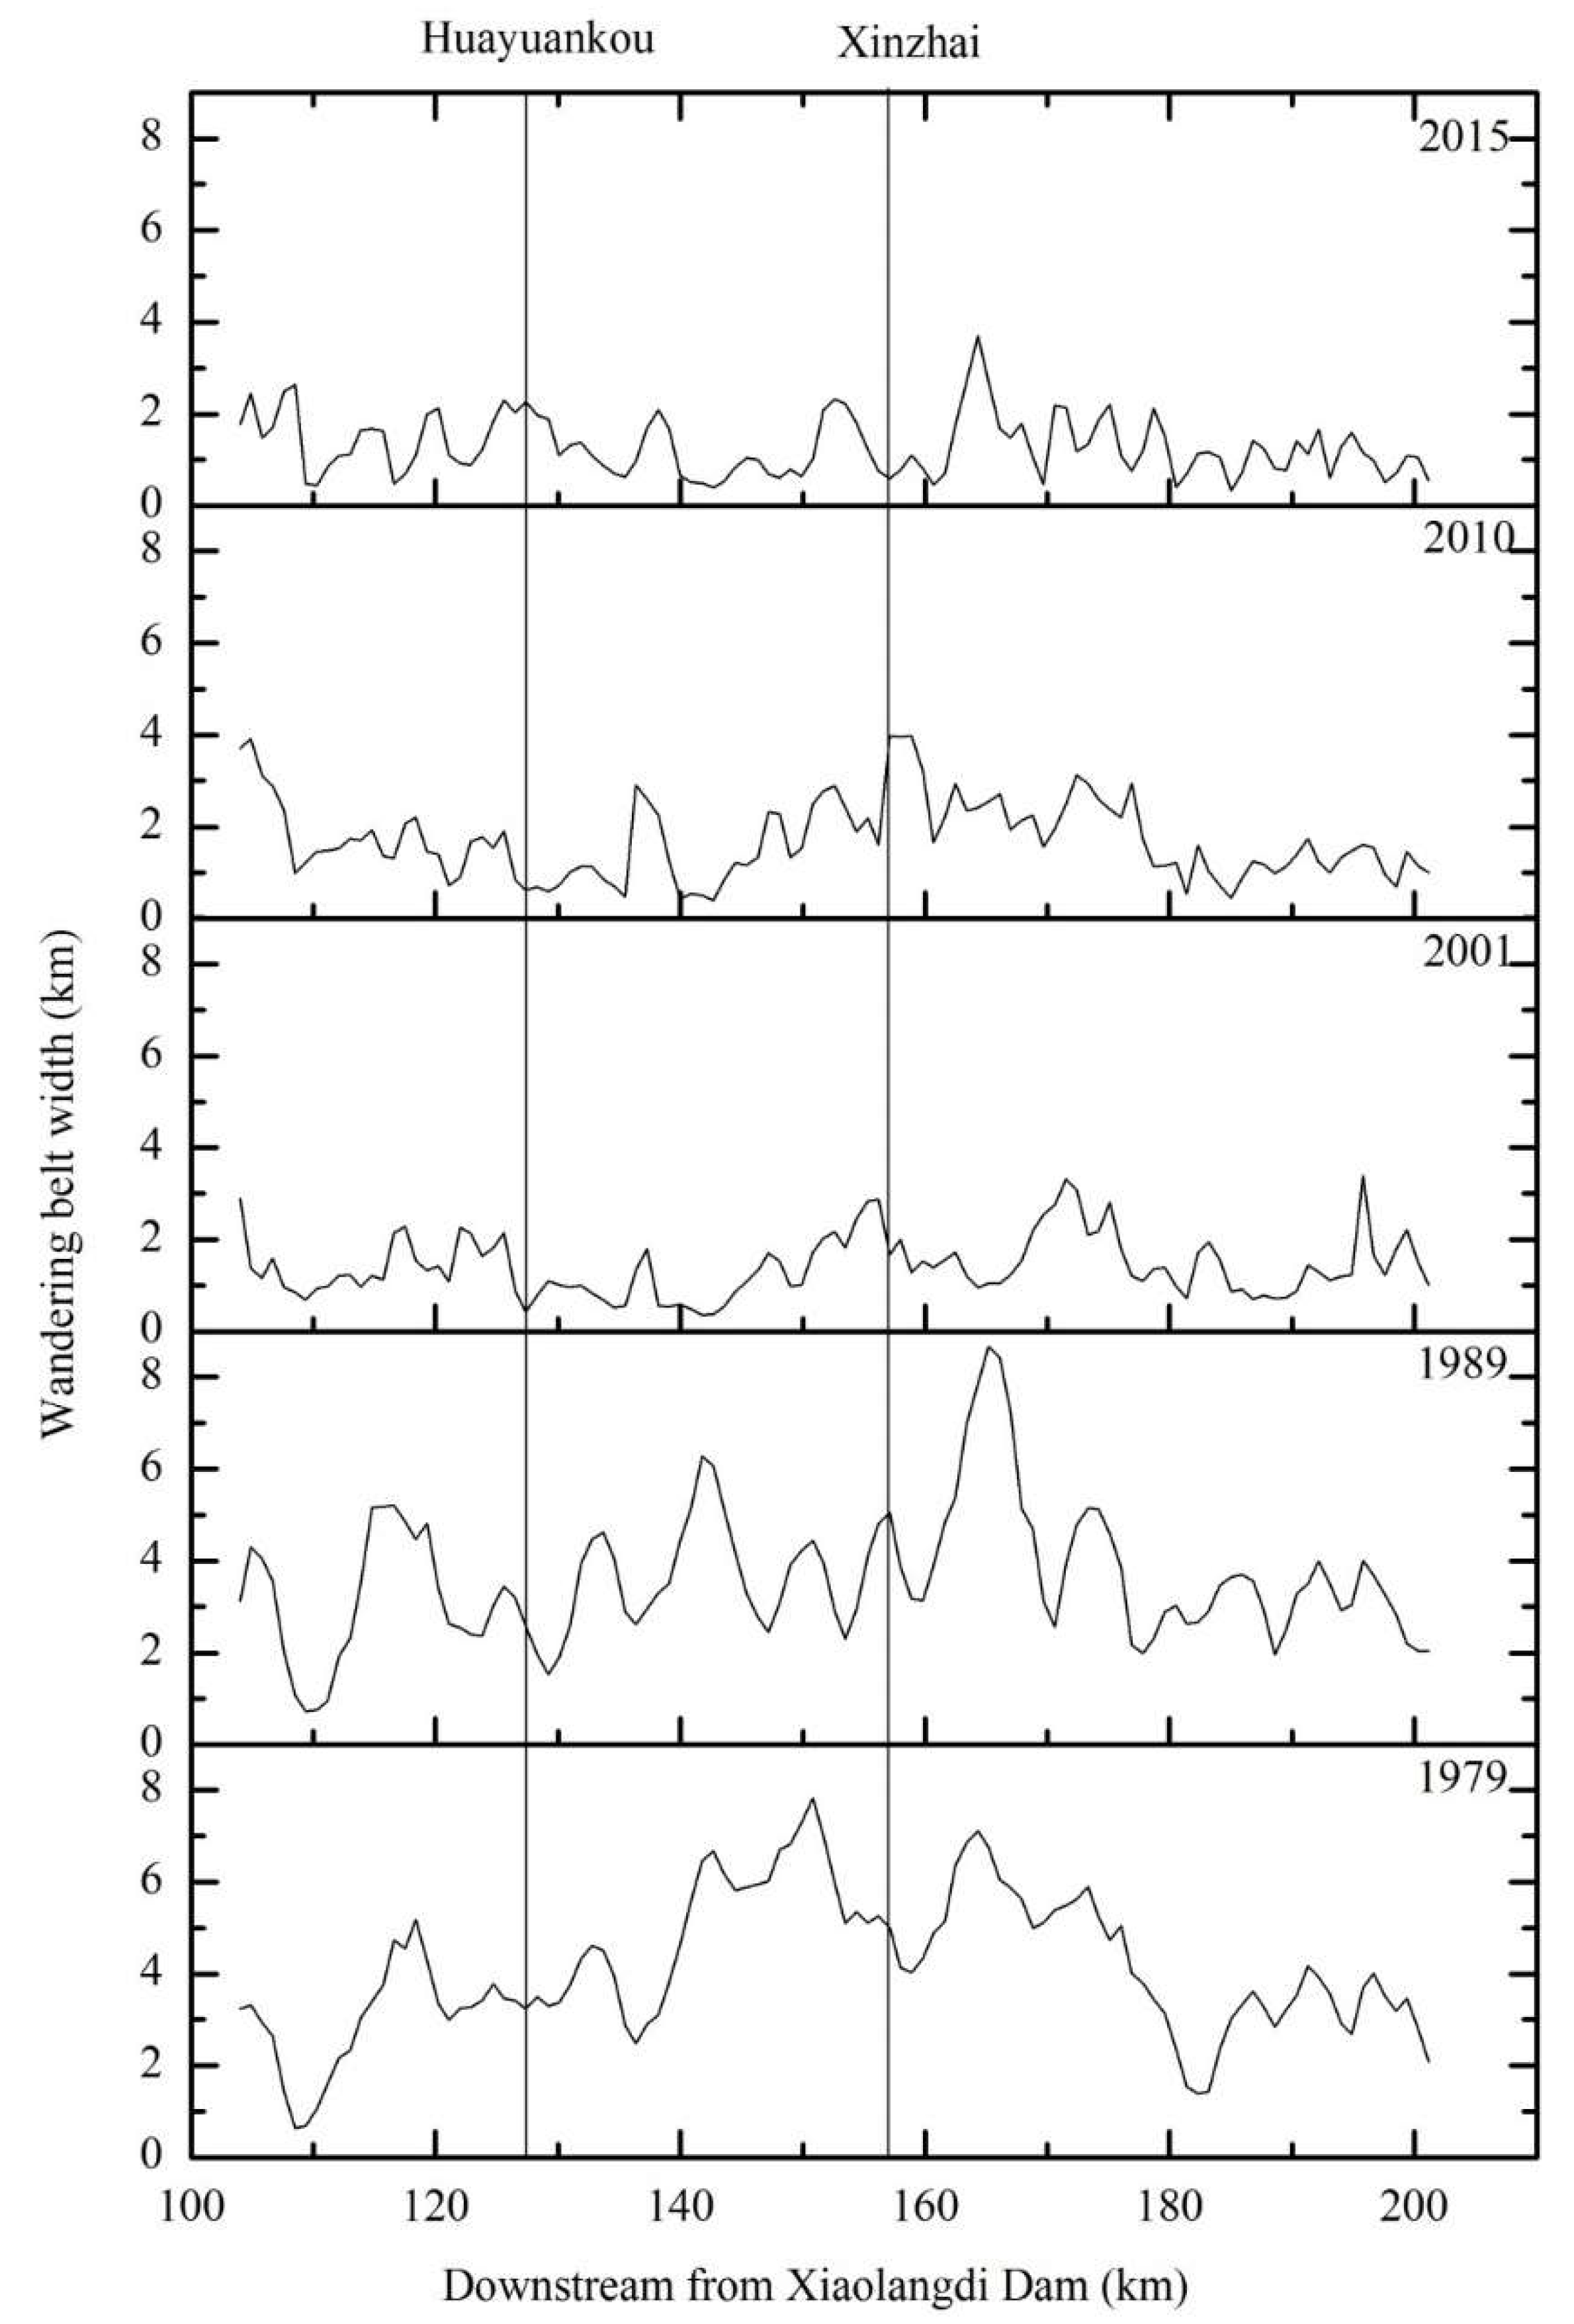
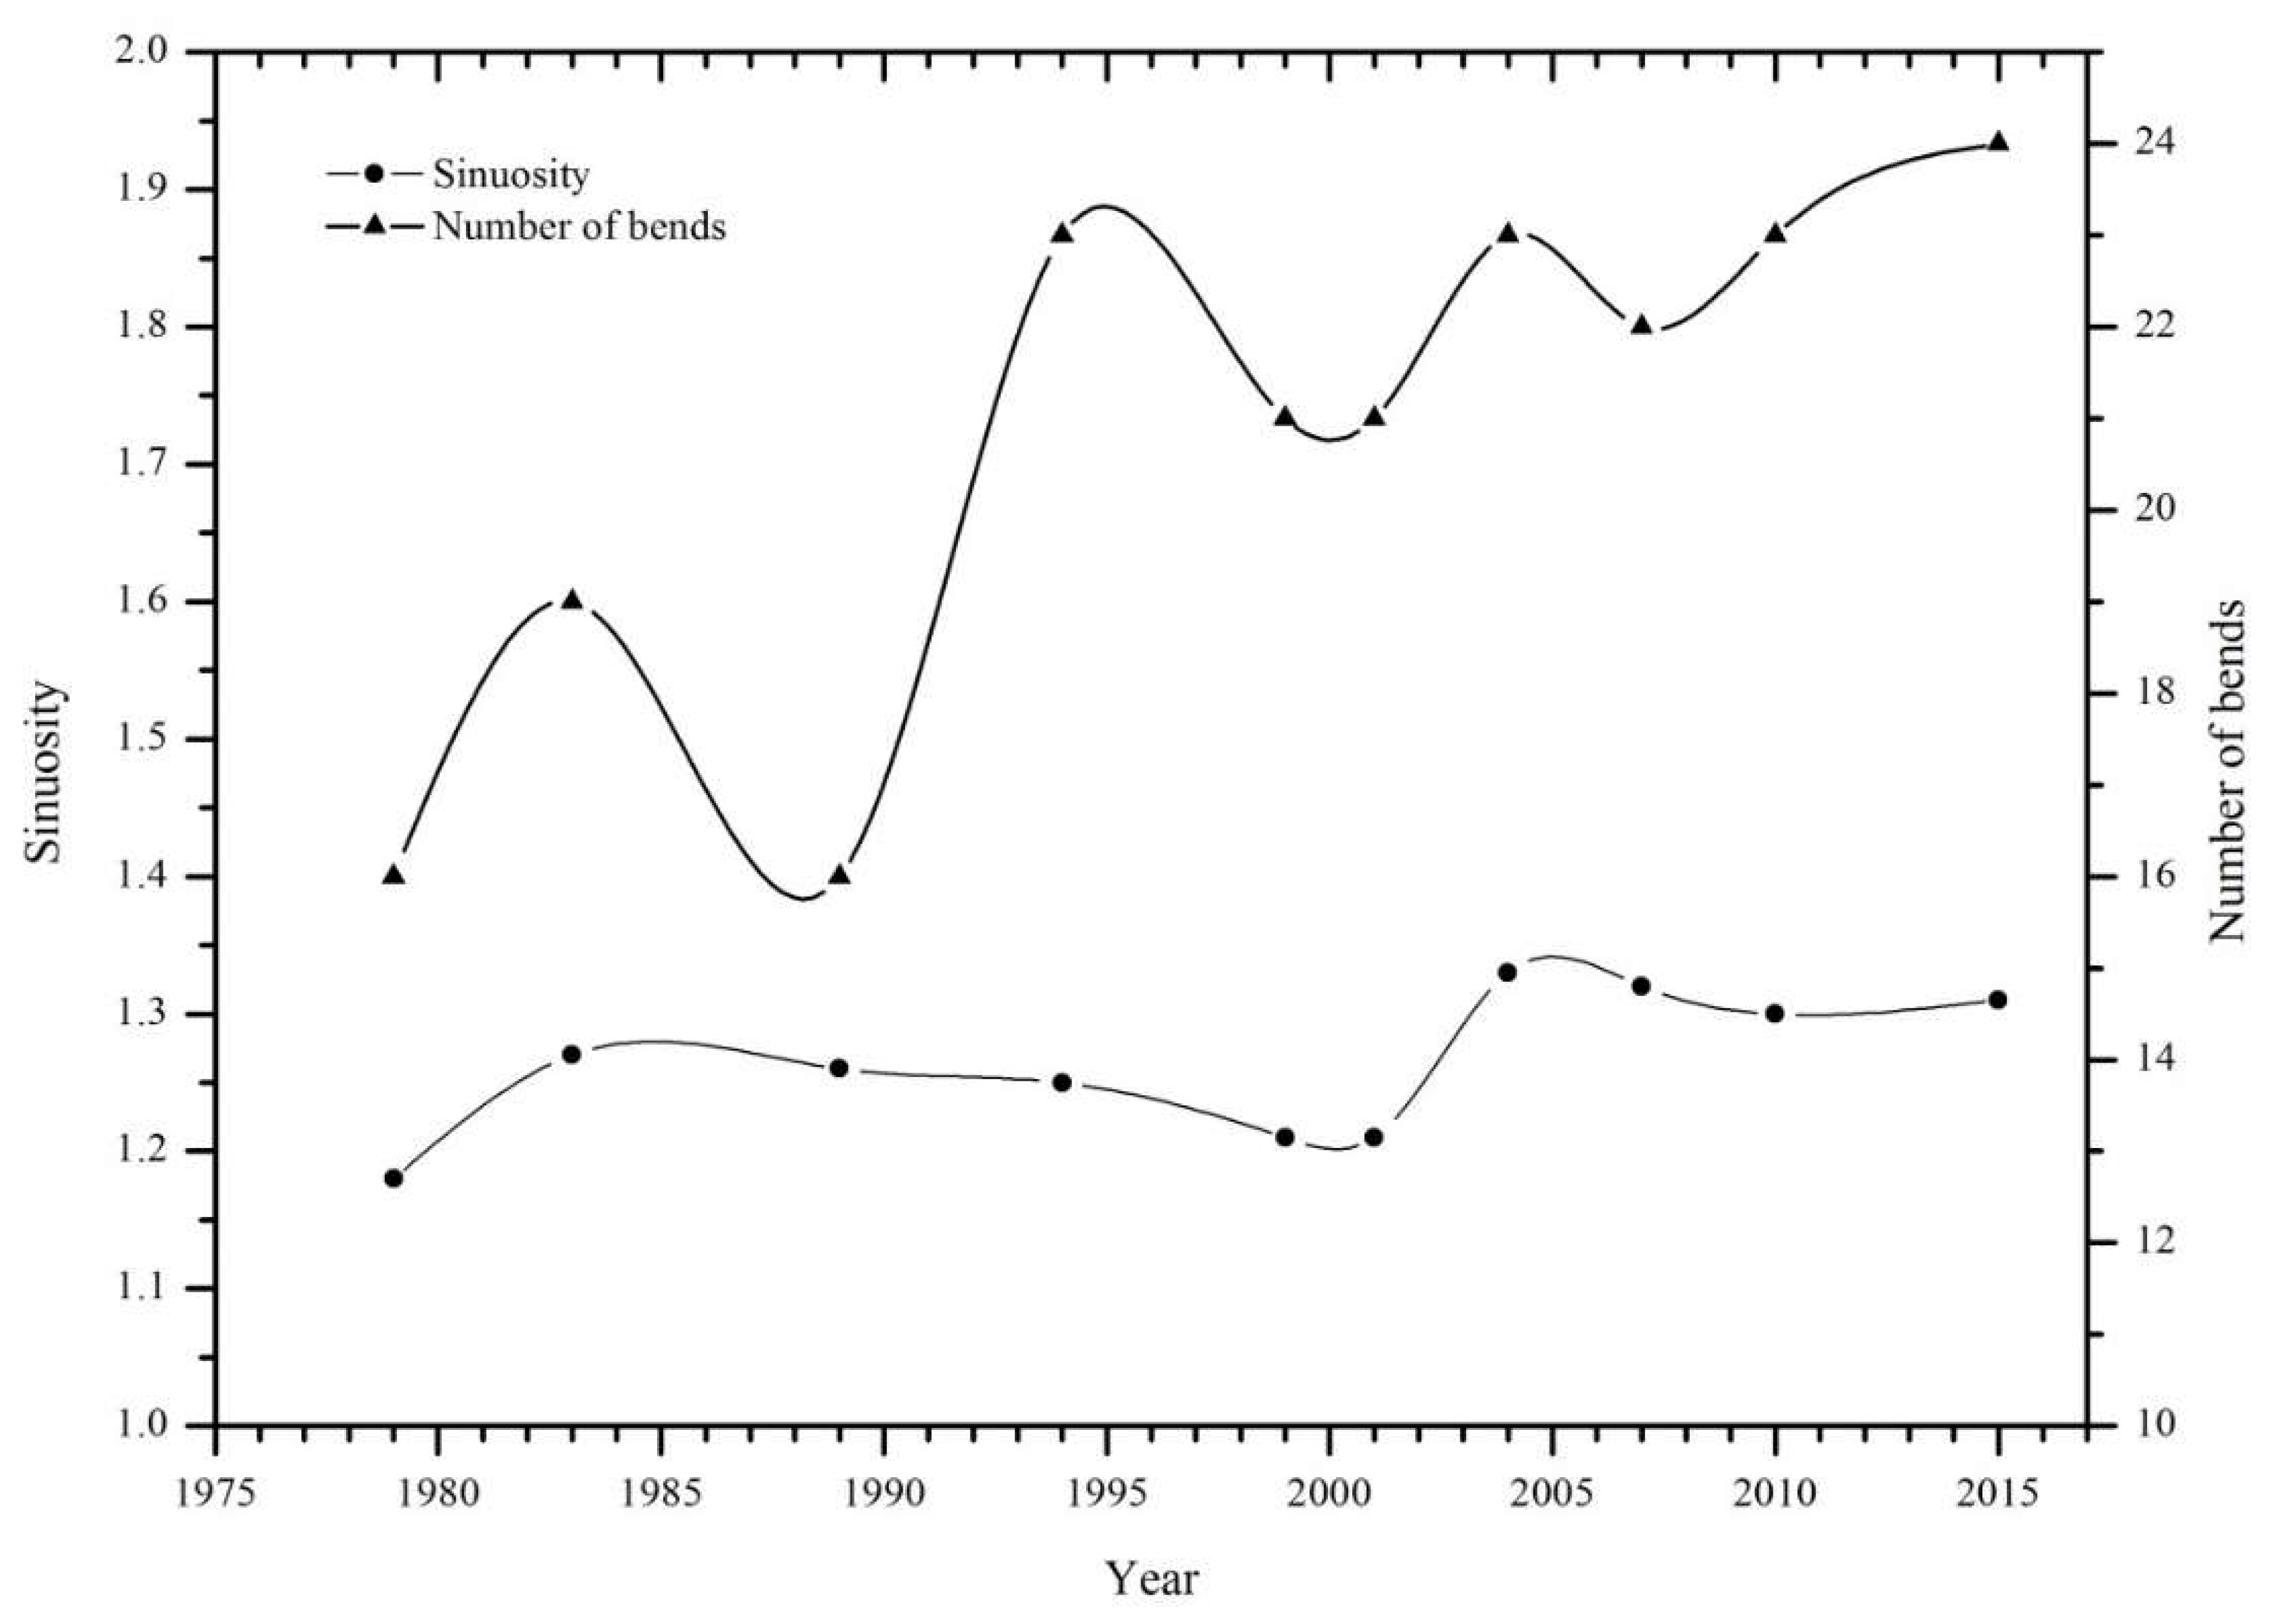
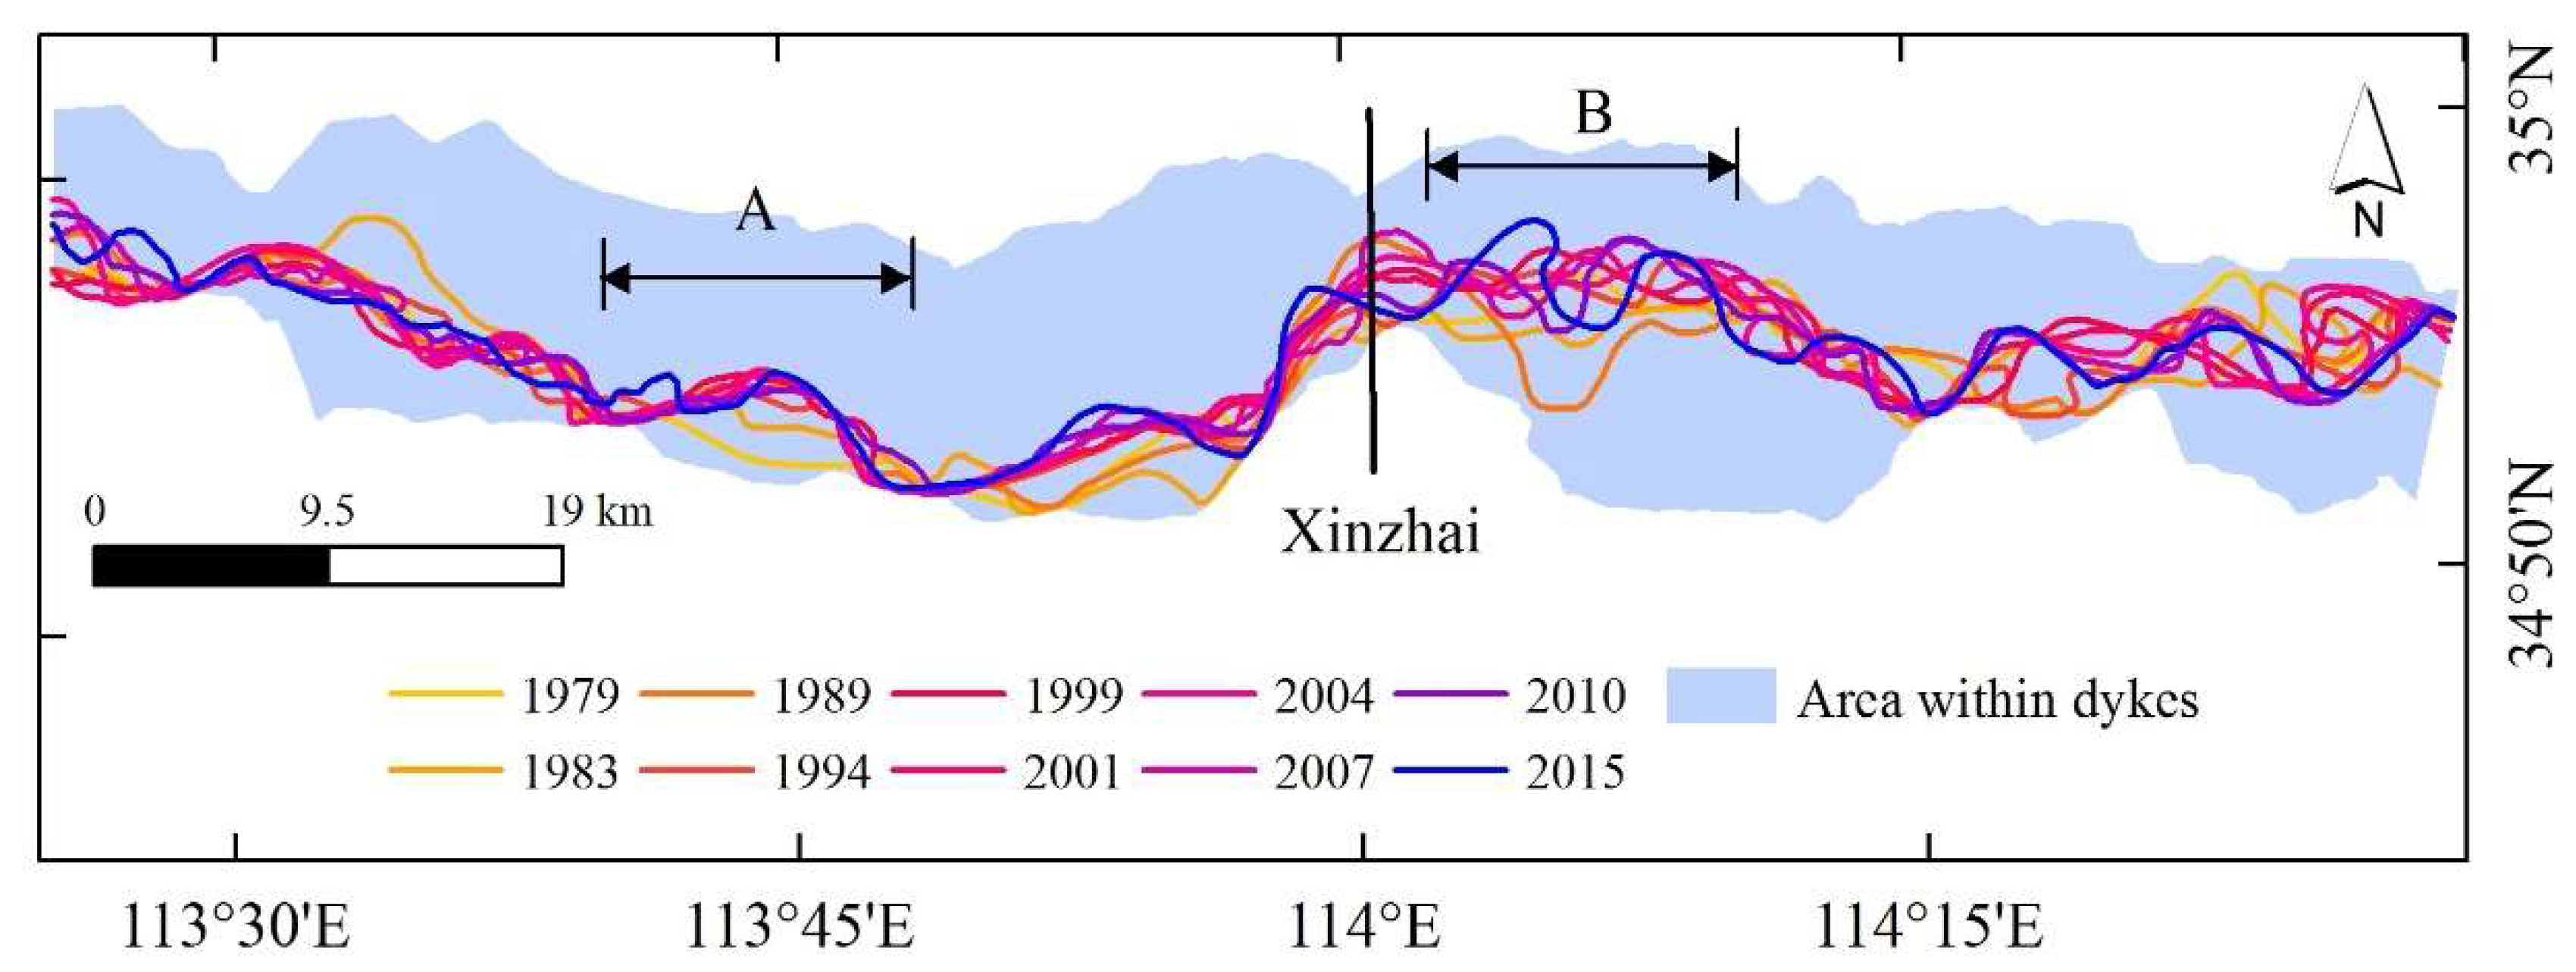
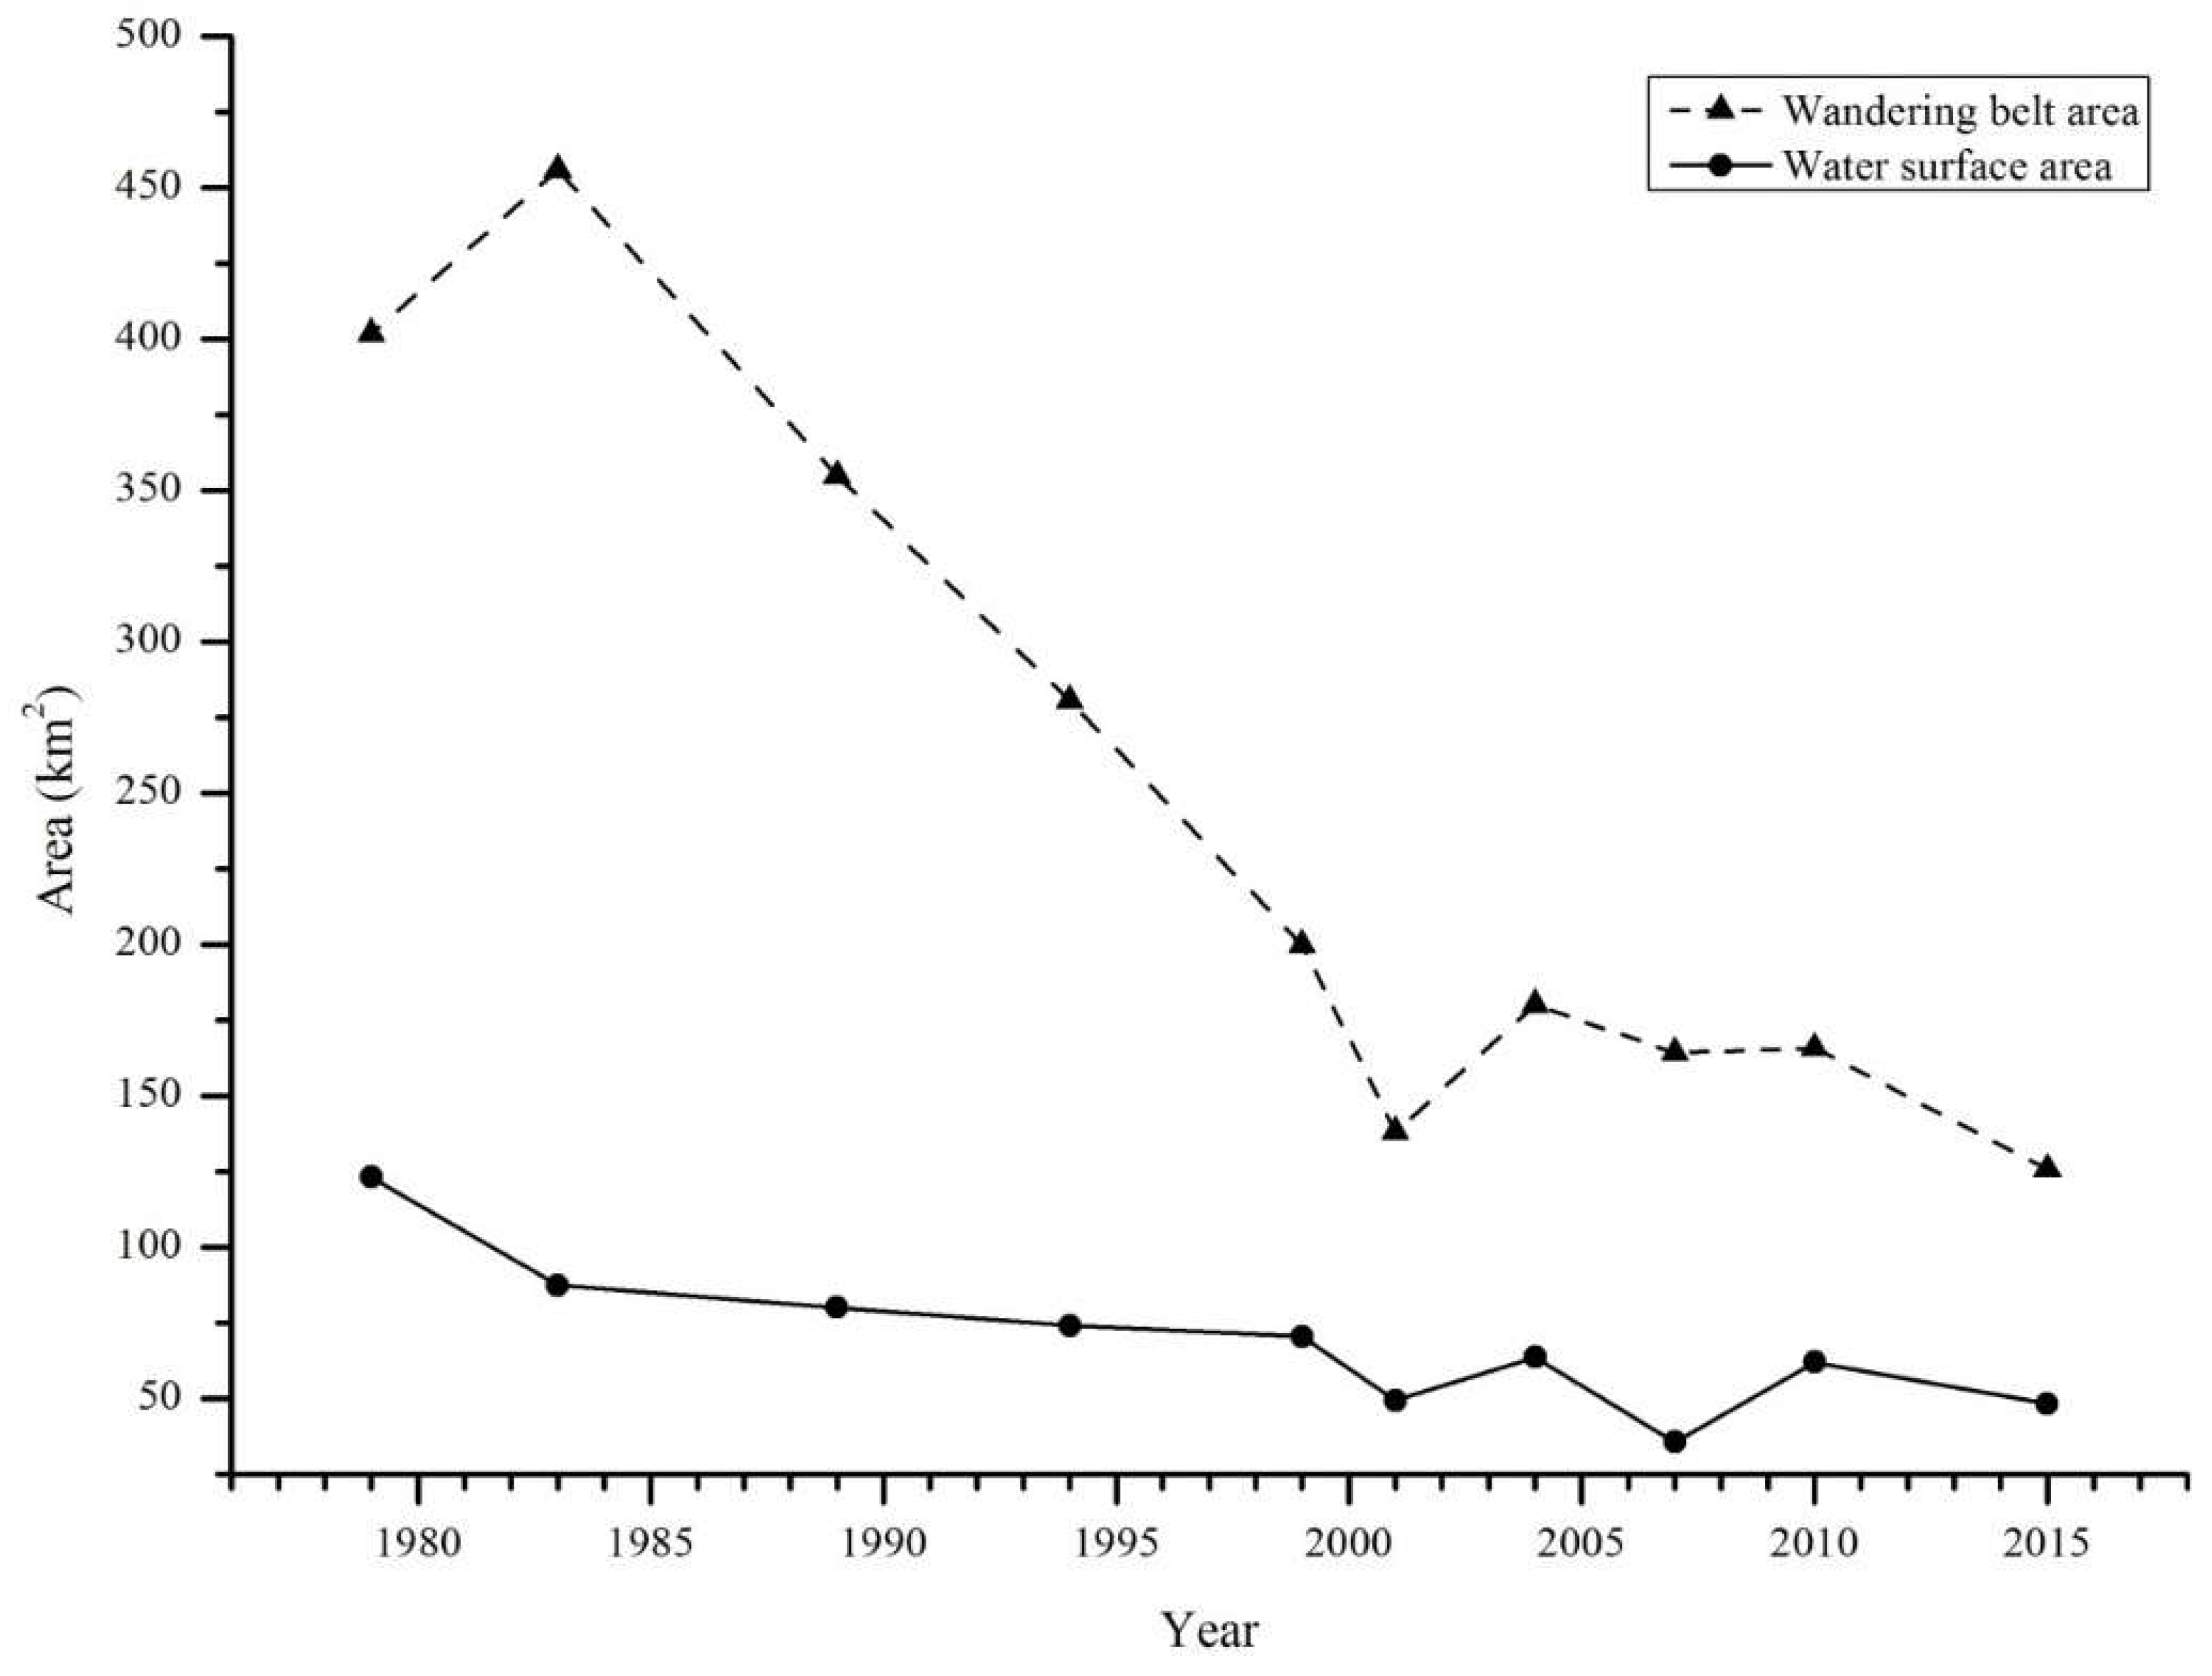
5.1. Planform Changes of the Wandering Channel

Maps of the wandering belt configurations over the entire study reach in 10 periods from 1979 to 2015 are presented in Figure 8 and it can be seen that there are significant variations in both the configurations and areas of the wandering belt. The most significant change is an overall shrinkage in the wandering belt of the study reach over the whole period from 1979 to 2015. Although the first period of 1979–1983 saw an expansion of the wandering belt occurring downstream from Heigangkou, a significant shrinkage in the wandering belt occurred during the second period from 1983 to 1989 downstream from Laitongzhai. During the subsequent seven periods, the wandering belt shrank continuously.
The second major change is that the pathways of the main flow tended to be more and more sinuous throughout the whole study period. While the pathway changes were not very significant during the first three periods from 1979–1983, 1983–1989, and 1989–1994, the following six periods saw a very significant change in the sinuosity of the main flow pathways with the migrations of bends on both upstream and downstream directions as a typical feature. The most significant upstream migration of bends occurred at Shunhejie from 1979 to 1983 and at Sanguanmiao from 1983 to 1989, which is in contrast with the most significant downstream migration of bends that occurred at Sanguanmiao from 1989–1994 and 1994–1999, respectively. By 2015, the pathways of the main flow displayed a lotus-like shape with alternate wide and narrow sections.
To evaluate how the spatial variation in the wandering belt width against the distance downstream from the Xiaolangdi Dam varies, Figure 9 is plotted with the wandering belt widths of 109 cross-lines across the entire wandering belt, which are evenly distributed along the 97.3 km length of the study reach at an average interval of 0.9 km. Since the interval is smaller than the average wandering belt width of about 1 km, a high accuracy of the spatial variation can be expected. It can be seen from Figure 9 that, from 1979 to 1989, there was no significant overall change occurring in the width of wandering belt but significant localized increases and reductions. The most significant overall reduction in the wandering belt width occurred from 1989 to 2001. In the following period from 2001 to 2010, however, a small overall increase in the wandering belt width occurred over the whole study reach. In the final period between 2010 and 2015, there was no significant overall change in the width of the wandering belt. However, there was a localized decrease in the middle of the study reach around Xinzhai. During all of the periods, the most variable width of the wandering belt took place in the reach around Xinzhai.
Table 2 presents the temporal changes in the wandering belt width averaged for the entire study reach and it can be seen clearly that the width decreased from 3.5 km in 1979 to only 1.17 km in 2001 with a slight increase in 1983 and then a continuous decrease. There was a slight increase from 2001 to 2010 with a peak occurring in 2004 while the period from 2010 to 2015 saw a significant decrease in the wandering belt width. From 1979 to 2015, the maximum and minimum changes in the wandering belt width occurred in 1989 (−0.81 km) and 2010 (0.07 km), respectively. However, the annual mean rate of the changes in the wandering belt width peaked in 2001 (−260 m·y−1). Broadly speaking, the wandering belt width varied in a continuously declining trend. This includes the increment and change rate (−2.53 km, −70.28 m·y−1) over the whole study period from 1979 to 2015.
The pathway of the main flow in the wandering reach of the LYR is characterized by instability with active migrations and, to evaluate the tempo-spatial change in the study reach, several parameters are extracted from the selected remote sensing images including the sinuosity and length of flow pathways and the number of bends. Figure 10 shows that a very significant increase in the number of bends occurred overall from 1979 to 2015, which is characterized with two different phases of change. The first phase took place before 1995 with the number of bends varying between 16–19 while the second phase since 1995 saw the number of bends varying between 21–24. In contrast, the sinuosity of the main flow pathway varied in a much smaller range of 1.16–1.35 between 1979 and 2015 (Figure 10).
The spatial migrations of the central lines of the main flow pathways in the study reach from 1979 to 2015 are extracted from the selected Landsat images and shown in Figure 11. The migrating pattern of the main flow in the upper part of the study reach was significantly different from the lower part. Upstream of Xinzhai, the central lines of the main flow pathways varied within a relative narrower range, which implies less active lateral migrations occurring in the reach. Although the pathways of the main flow in the whole study reach became more and more sinuous, the degree of the change in the sinuosity was much larger in the lower reach. This can be seen more clearly from two typical reaches representing, respectively, the upper and low reaches highlighted in Figure 11. In reach A, the central lines of the main flow pathways were essentially straight in 1979 and 1983 and yet became sinuous separately in 1989, 1999, and 2015. In reach B, the central lines of the main flow pathways were straight in 1979 and became more and more sinuous since due to only one bend being developed in 1989 and three bends in 2015.
While the area of the wandering belt in the entire study reach varied in a dramatically declining trend from 1979–1999, its variation over the period from 1999–2015 was limited in a much smaller range (Figure 12). In contrast, the surface area of the water body extracted from the selected remote sensing images took a gradually declining trend between 1979 and 2001 and then fluctuated within a small range since 2000.

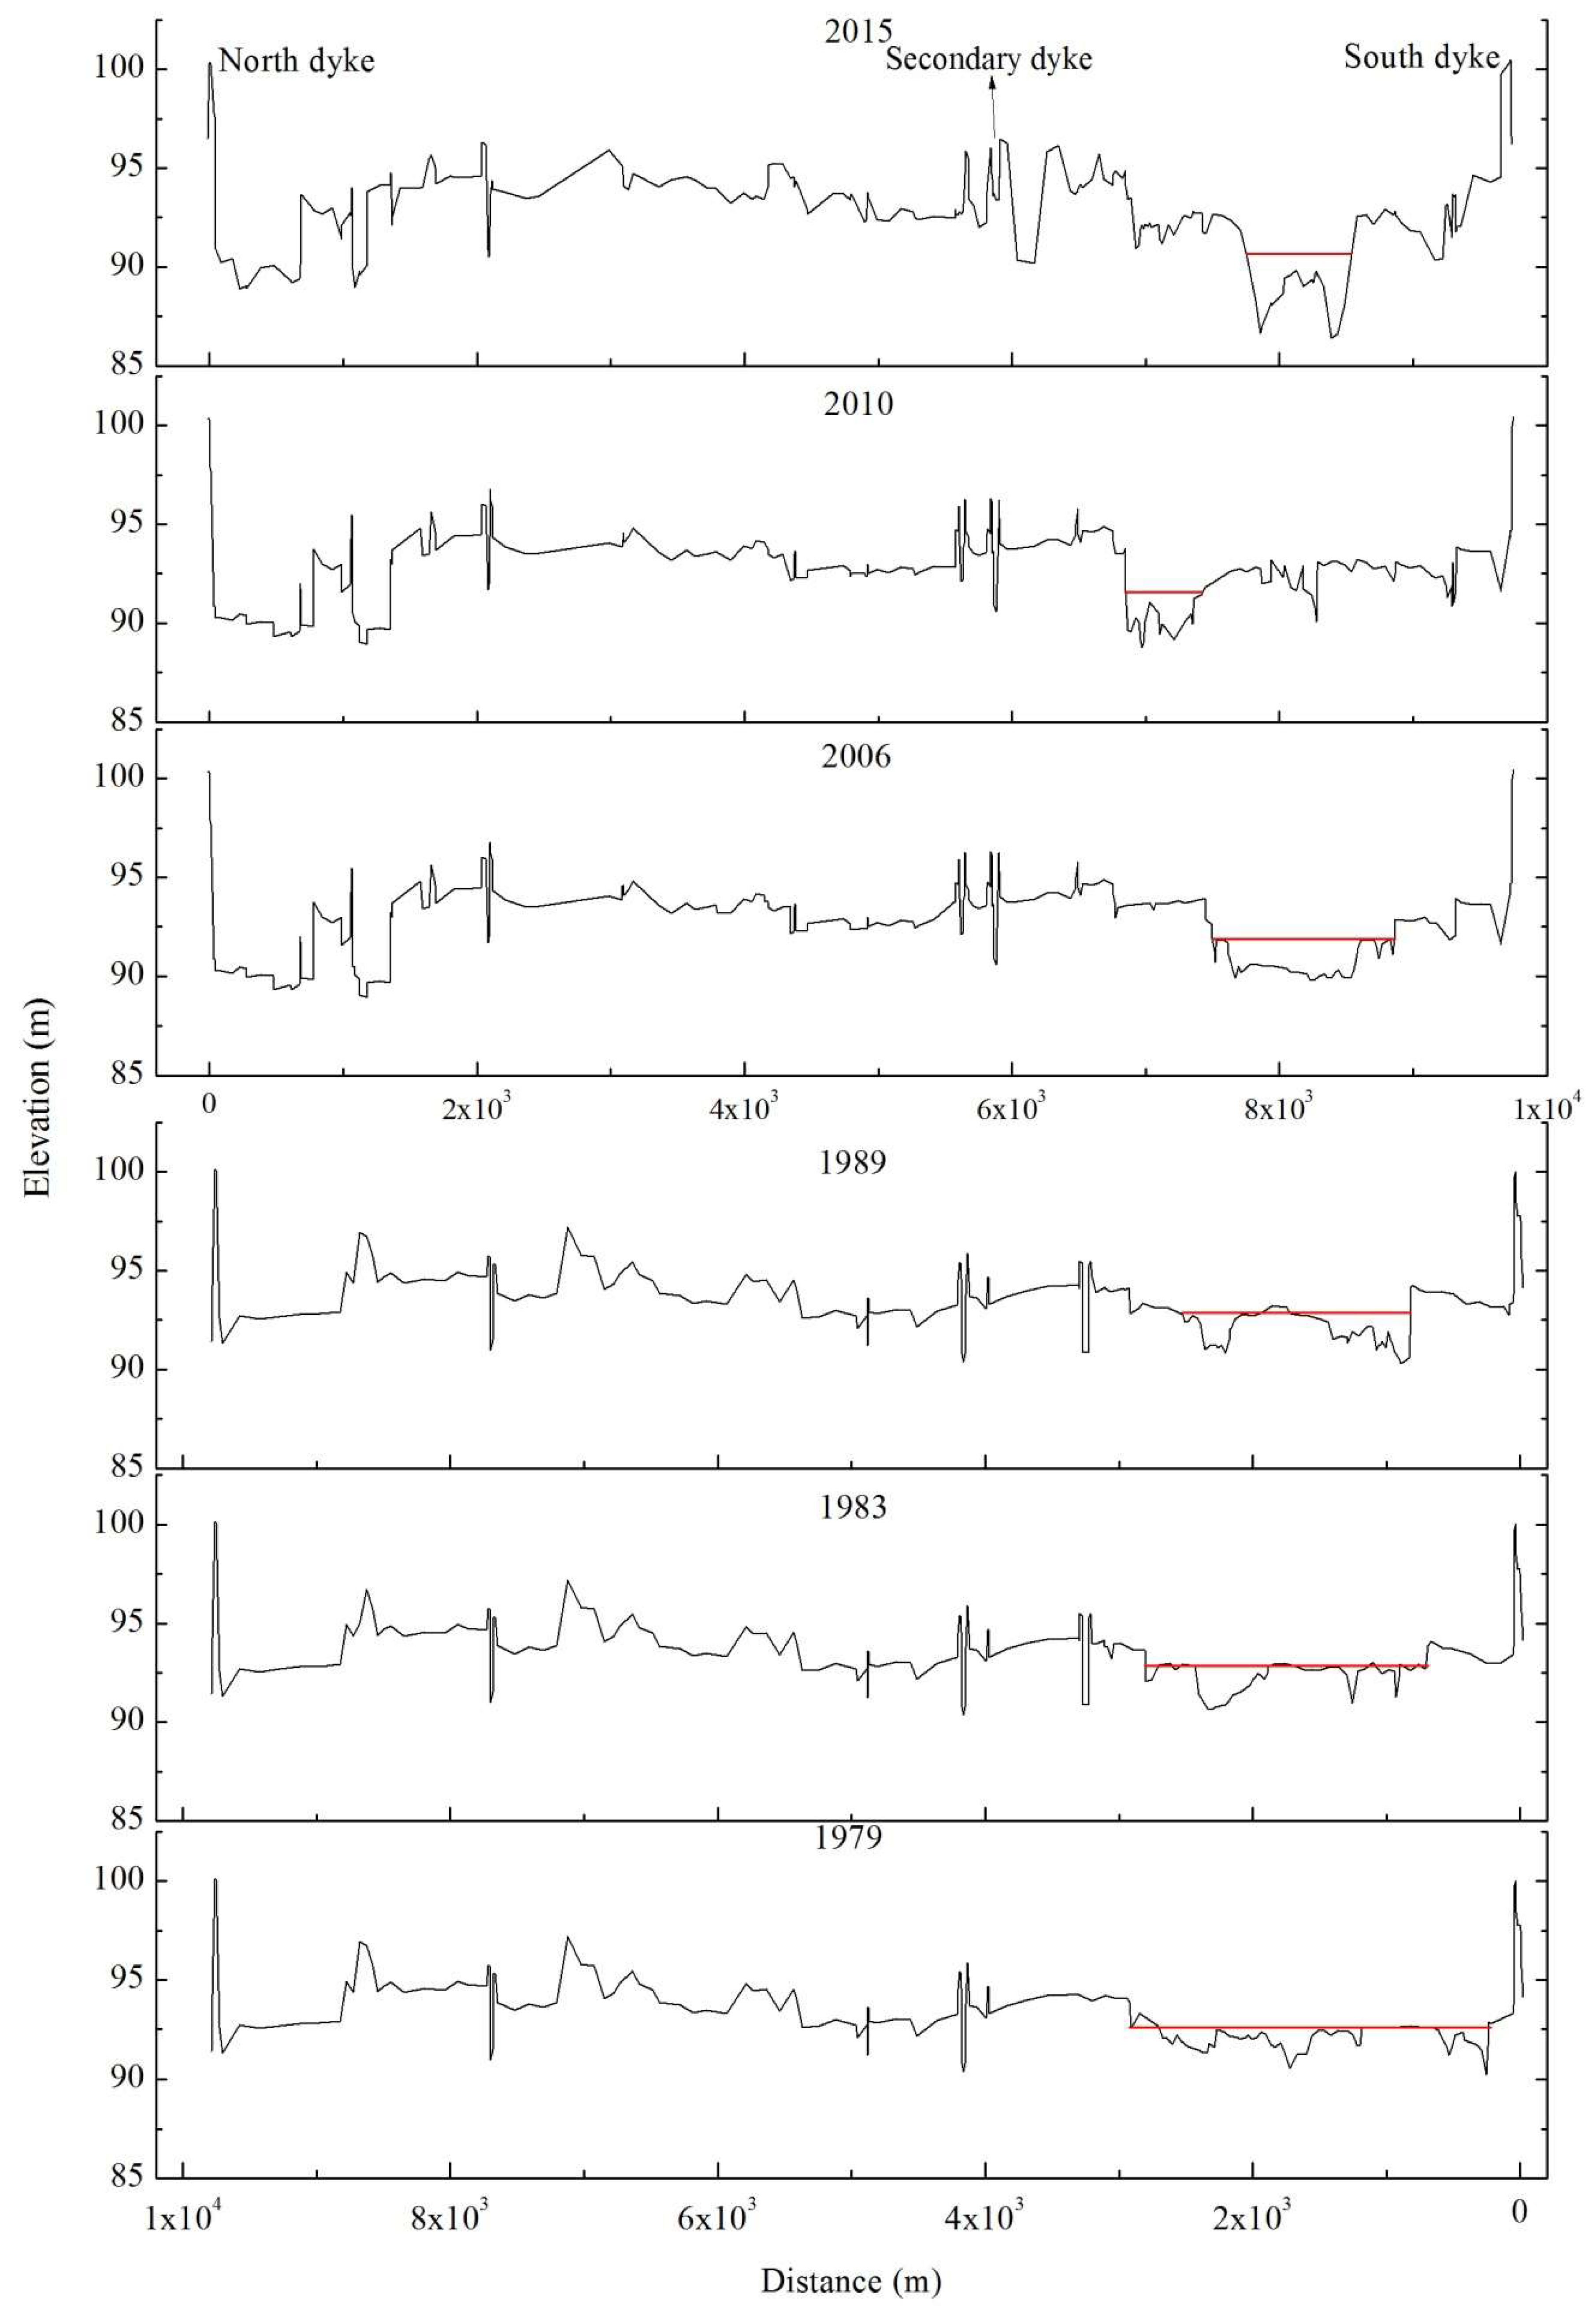
5.2. Changes in Cross-Profile Morphology

The transverse cross-profiles of the Lower Yellow River near the Huayuankou gauging station measured in the pre-flood seasons of 1979, 1983, 1989, 2006, 2010, and 2015, respectively, are presented in Figure 2. The distance between the opposite main dykes in all of the cross-profiles is close to 10 km and all of the main channels of flow (under the red line) have always been near the south dyke during the study period. A significantly gradual decrease can be seen in the width of the main channel over the whole study period from approximately 3 km in 1979 to about 2 km in 1989 and <1 km in 2015. Correspondingly, the average depth of the main channel increased continuously and the deepest part of the main channel has lowered gradually under almost the same flow discharge.
Figure 2 shows the cross-profiles measured near the Huayuankou gauging station and it is seen clearly that each of them is very complex in space and exhibits two-level floodplains that have been called, respectively, the secondary and main floodplains [29]. Nevertheless, the main and secondary dykes constructed by humans and the natural levee formed by the overbank flow at the edge of the bankfull channel can be clearly identified from each of the complex cross-profiles and, consequently, the geometry of the bankfull channel is computed. To reflect the variation of the bankfull channel-forms at reach scale, the computed widths and average depths of the bankfull channels at eight sites on the study reach are averaged in each pro-flood season and Figure 13 shows the variations of these geometrical factors at reach scale. It can be seen that both bankfull width (B) and bankfull width/depth ratio (B/H) decreased gradually from 1979 to 2006, then increased from 2006 to 2010, and remained unchanged or decreased slightly until 2015. Consequently, the average depth of the bankfull channel (H) decreased slightly from 1979 to 1983 and then gradually increased until 2015 with a peak occurring in 2006. In contrast, both width and width/depth ratio of the main channel decreased with a relatively faster rate before 2010 while the average depth of the main channel increased at a relatively faster rate from 1979 to 1986 and then at a relatively slower rate since 1986.

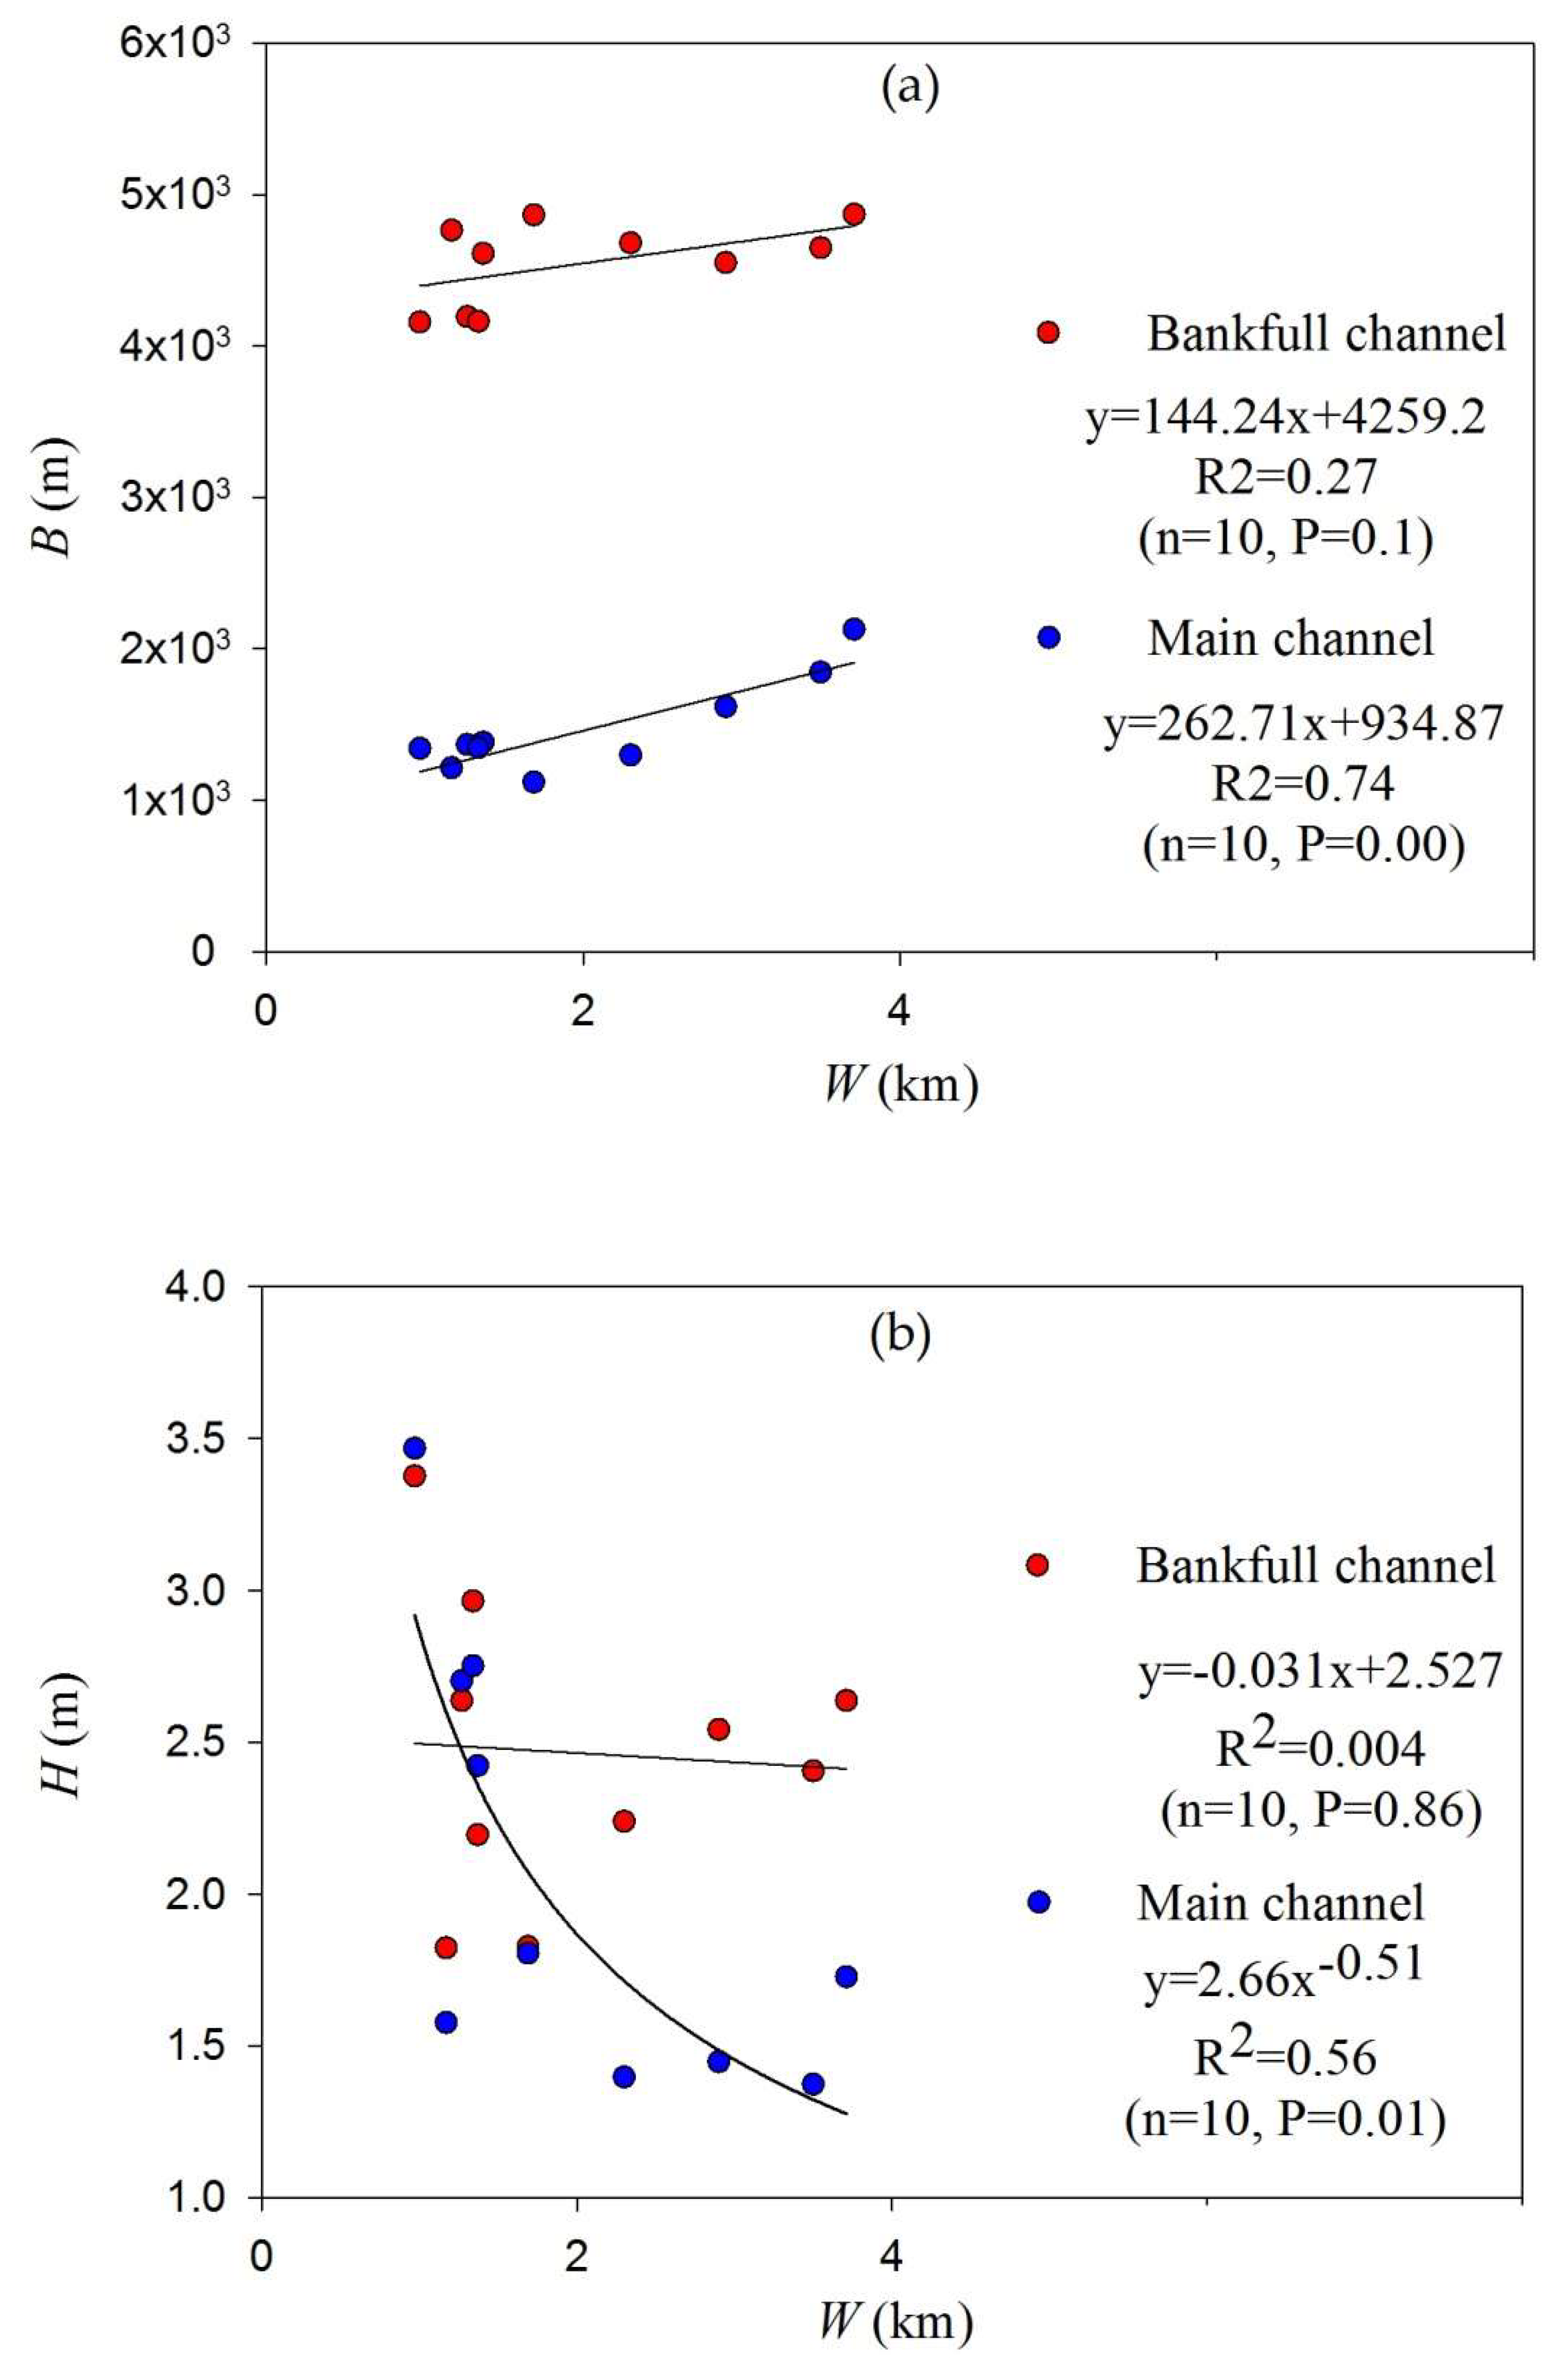
5.3. Interrelationships between Adjustments in the Wandering Belt and Channel Geometry

Alluvial rivers adjust the longitudinal planform and transverse cross-profiles of the channel simultaneously and the reach-scale variations of widths, average depths, and width/depth ratios of the main and bankfull channels computed from the collected field measurements at 8 sites in the study reach against the corresponding change in the wandering belt width extracted from the selected remote sensing images, which are plotted in Figure 14. Both widths of the bankfull and main channels are positively related with the wandering belt width and the width of the bankfull channel is generally larger than the wandering belt width while the width of the main channel is generally smaller. This is because, as stated earlier and shown in Figure 2 and Figure 8, the main flow of floods in the Lower Yellow River migrated beyond the boundary of the bankfull channel only during the extremely large floods. Since the floods entering the LYR have been reducing in magnitude and frequency in recent decades, as shown in Figure 7, the wandering range of the main flow has been limited mostly within the bankfull channel. However, the wandering range of the main flow is always beyond the main channel of flow [15,17,29,34].
In contrast, the average depths of both the bankfull and main channels at reach scale are negatively related with the wandering belt width while the width/depth ratios of both the bankfull and main channels are positively related with the wandering belt width (Figure 14b,c). These reach-scale interrelationships are shown in Figure 14 and can be seen more clearly from the following regression relationships between the wandering belt width and the channel geometrical factors.
For the bankfull channel:
B b = 44.24 W + 4259.2   ( R 2   =   0.27 )
H b = 0.031 W + 2.527   ( R 2   =   0.004 )
B b H b = 3.12 W + 2300.78   ( R 2   =   0.00 )
For the main channel:
B m = 262.71 W + 934.87   ( R 2   =   0.74 )
H m = 2.66 W 0.51   ( R 2   =   0.56 )
B m H m = 374.85 W + 161.87 .   ( R 2   =   0.91 )
where Bb and Bm are, respectively, the average widths of the bankfull and main channels. Hb and Hm are, respectively, the average depths of the bankfull and main channels and W is the width of the wandering belt.
Interestingly, Equations (2)–(7) show that the reach-scale geometry of the main channel has a higher degree of correspondence with the wandering belt than the counterpart of the bankfull channel. In addition, among all three channel geometrical factors (channel width, average depth, and width/depth ratio) of the main channel, the width/depth ratio has the highest degree of correspondence with the wandering belt width. This means that a transition of the main channel from a wider and shallower shape into a narrower and deeper profile is beneficial for reducing the wandering degree of the LYR. This is physically reasonable because such a transition in the shape of the main channel means the reinforcement of flow momentum on the vertical direction of the channel, which consequently results in the weakening of flow momentumn the lateral direction.

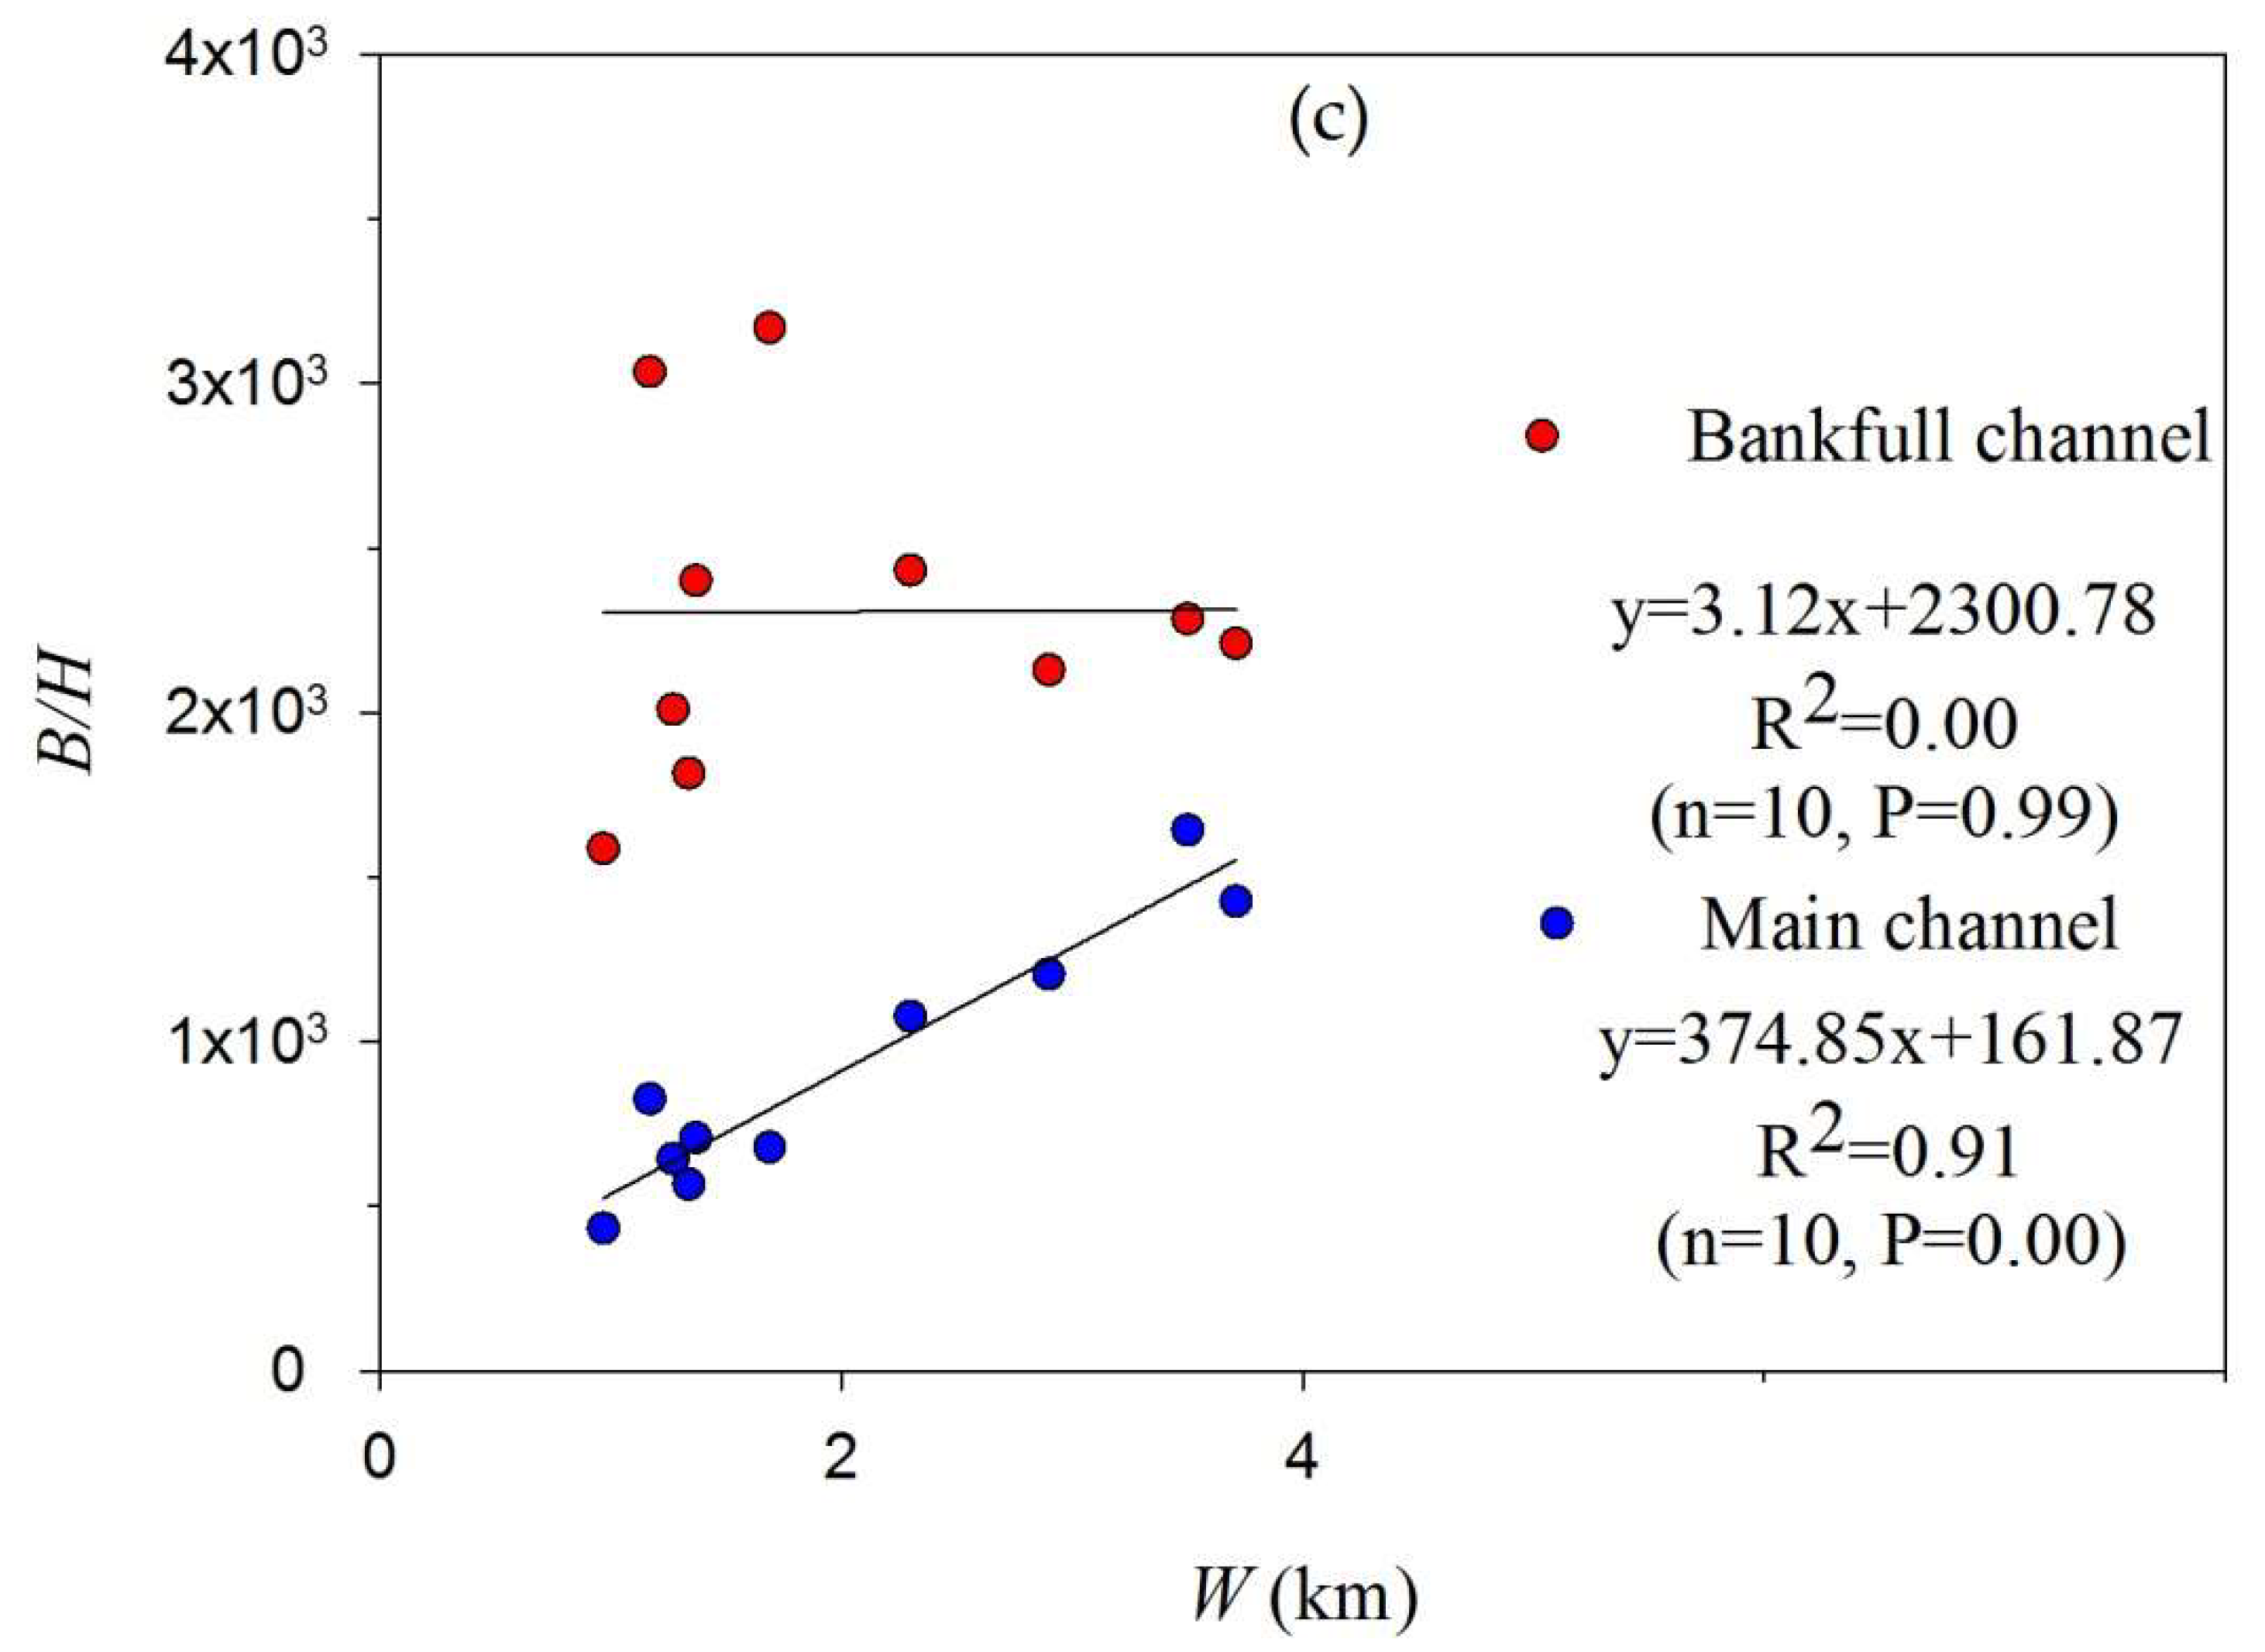
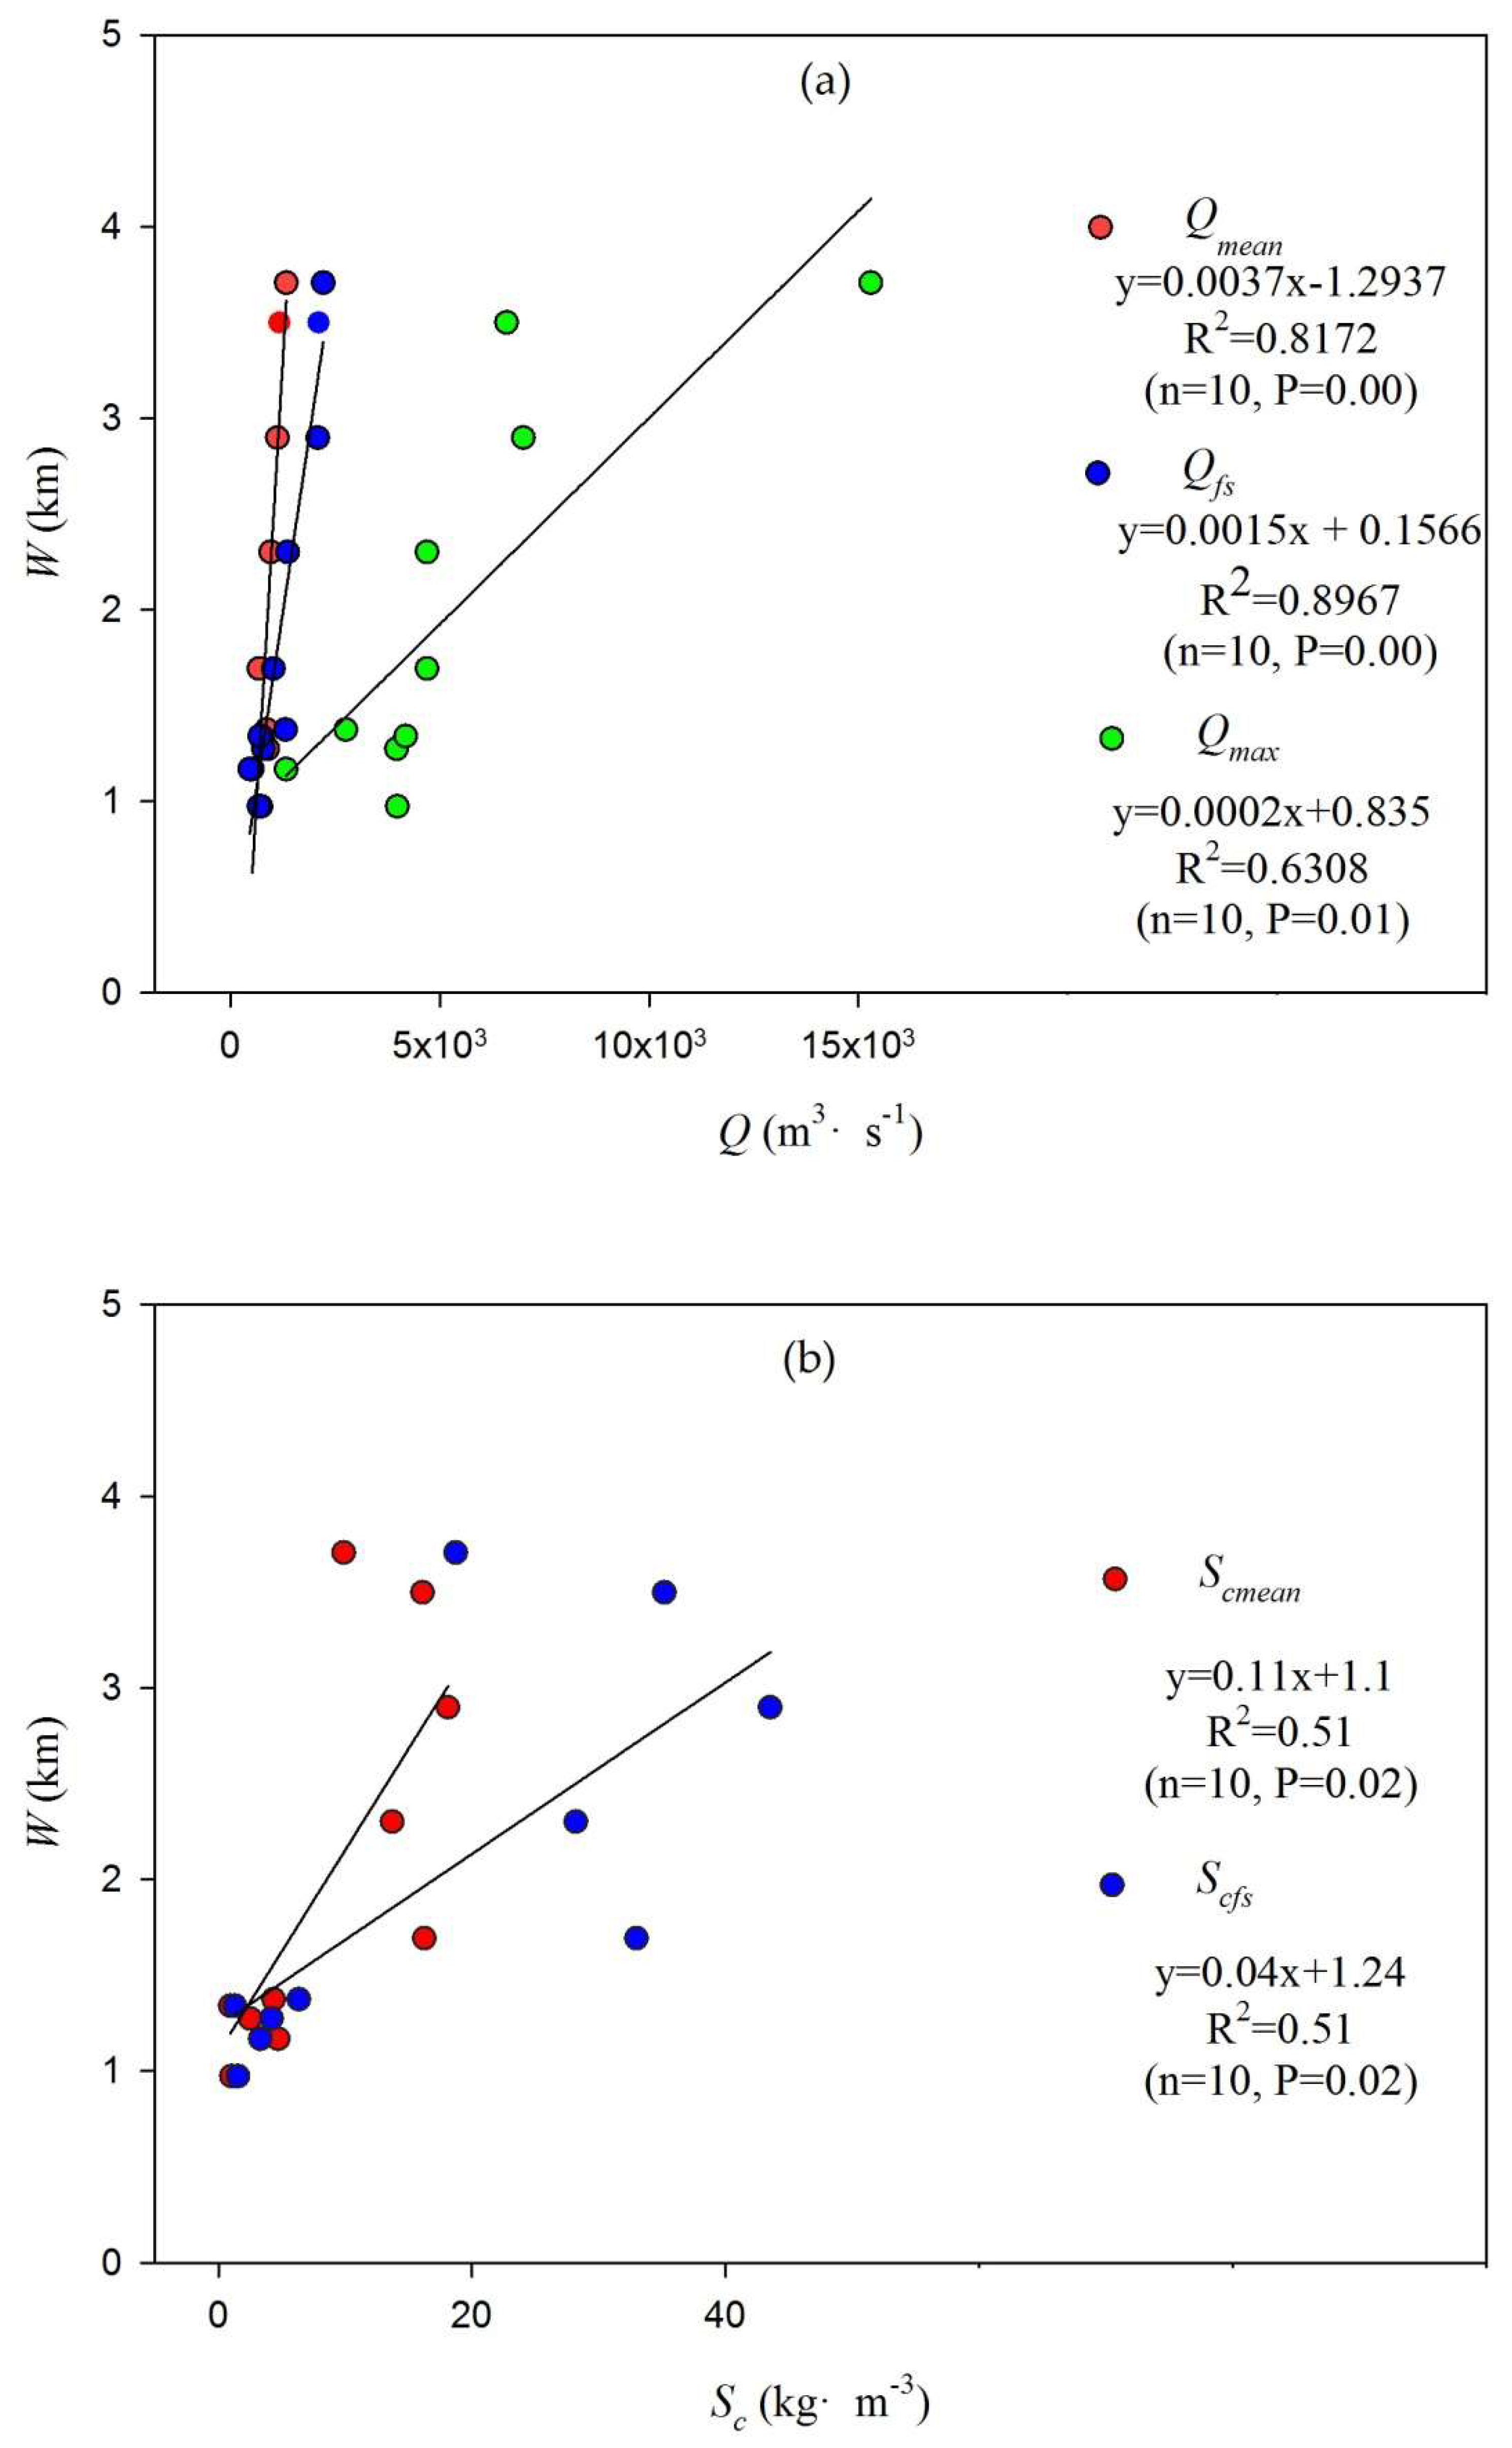
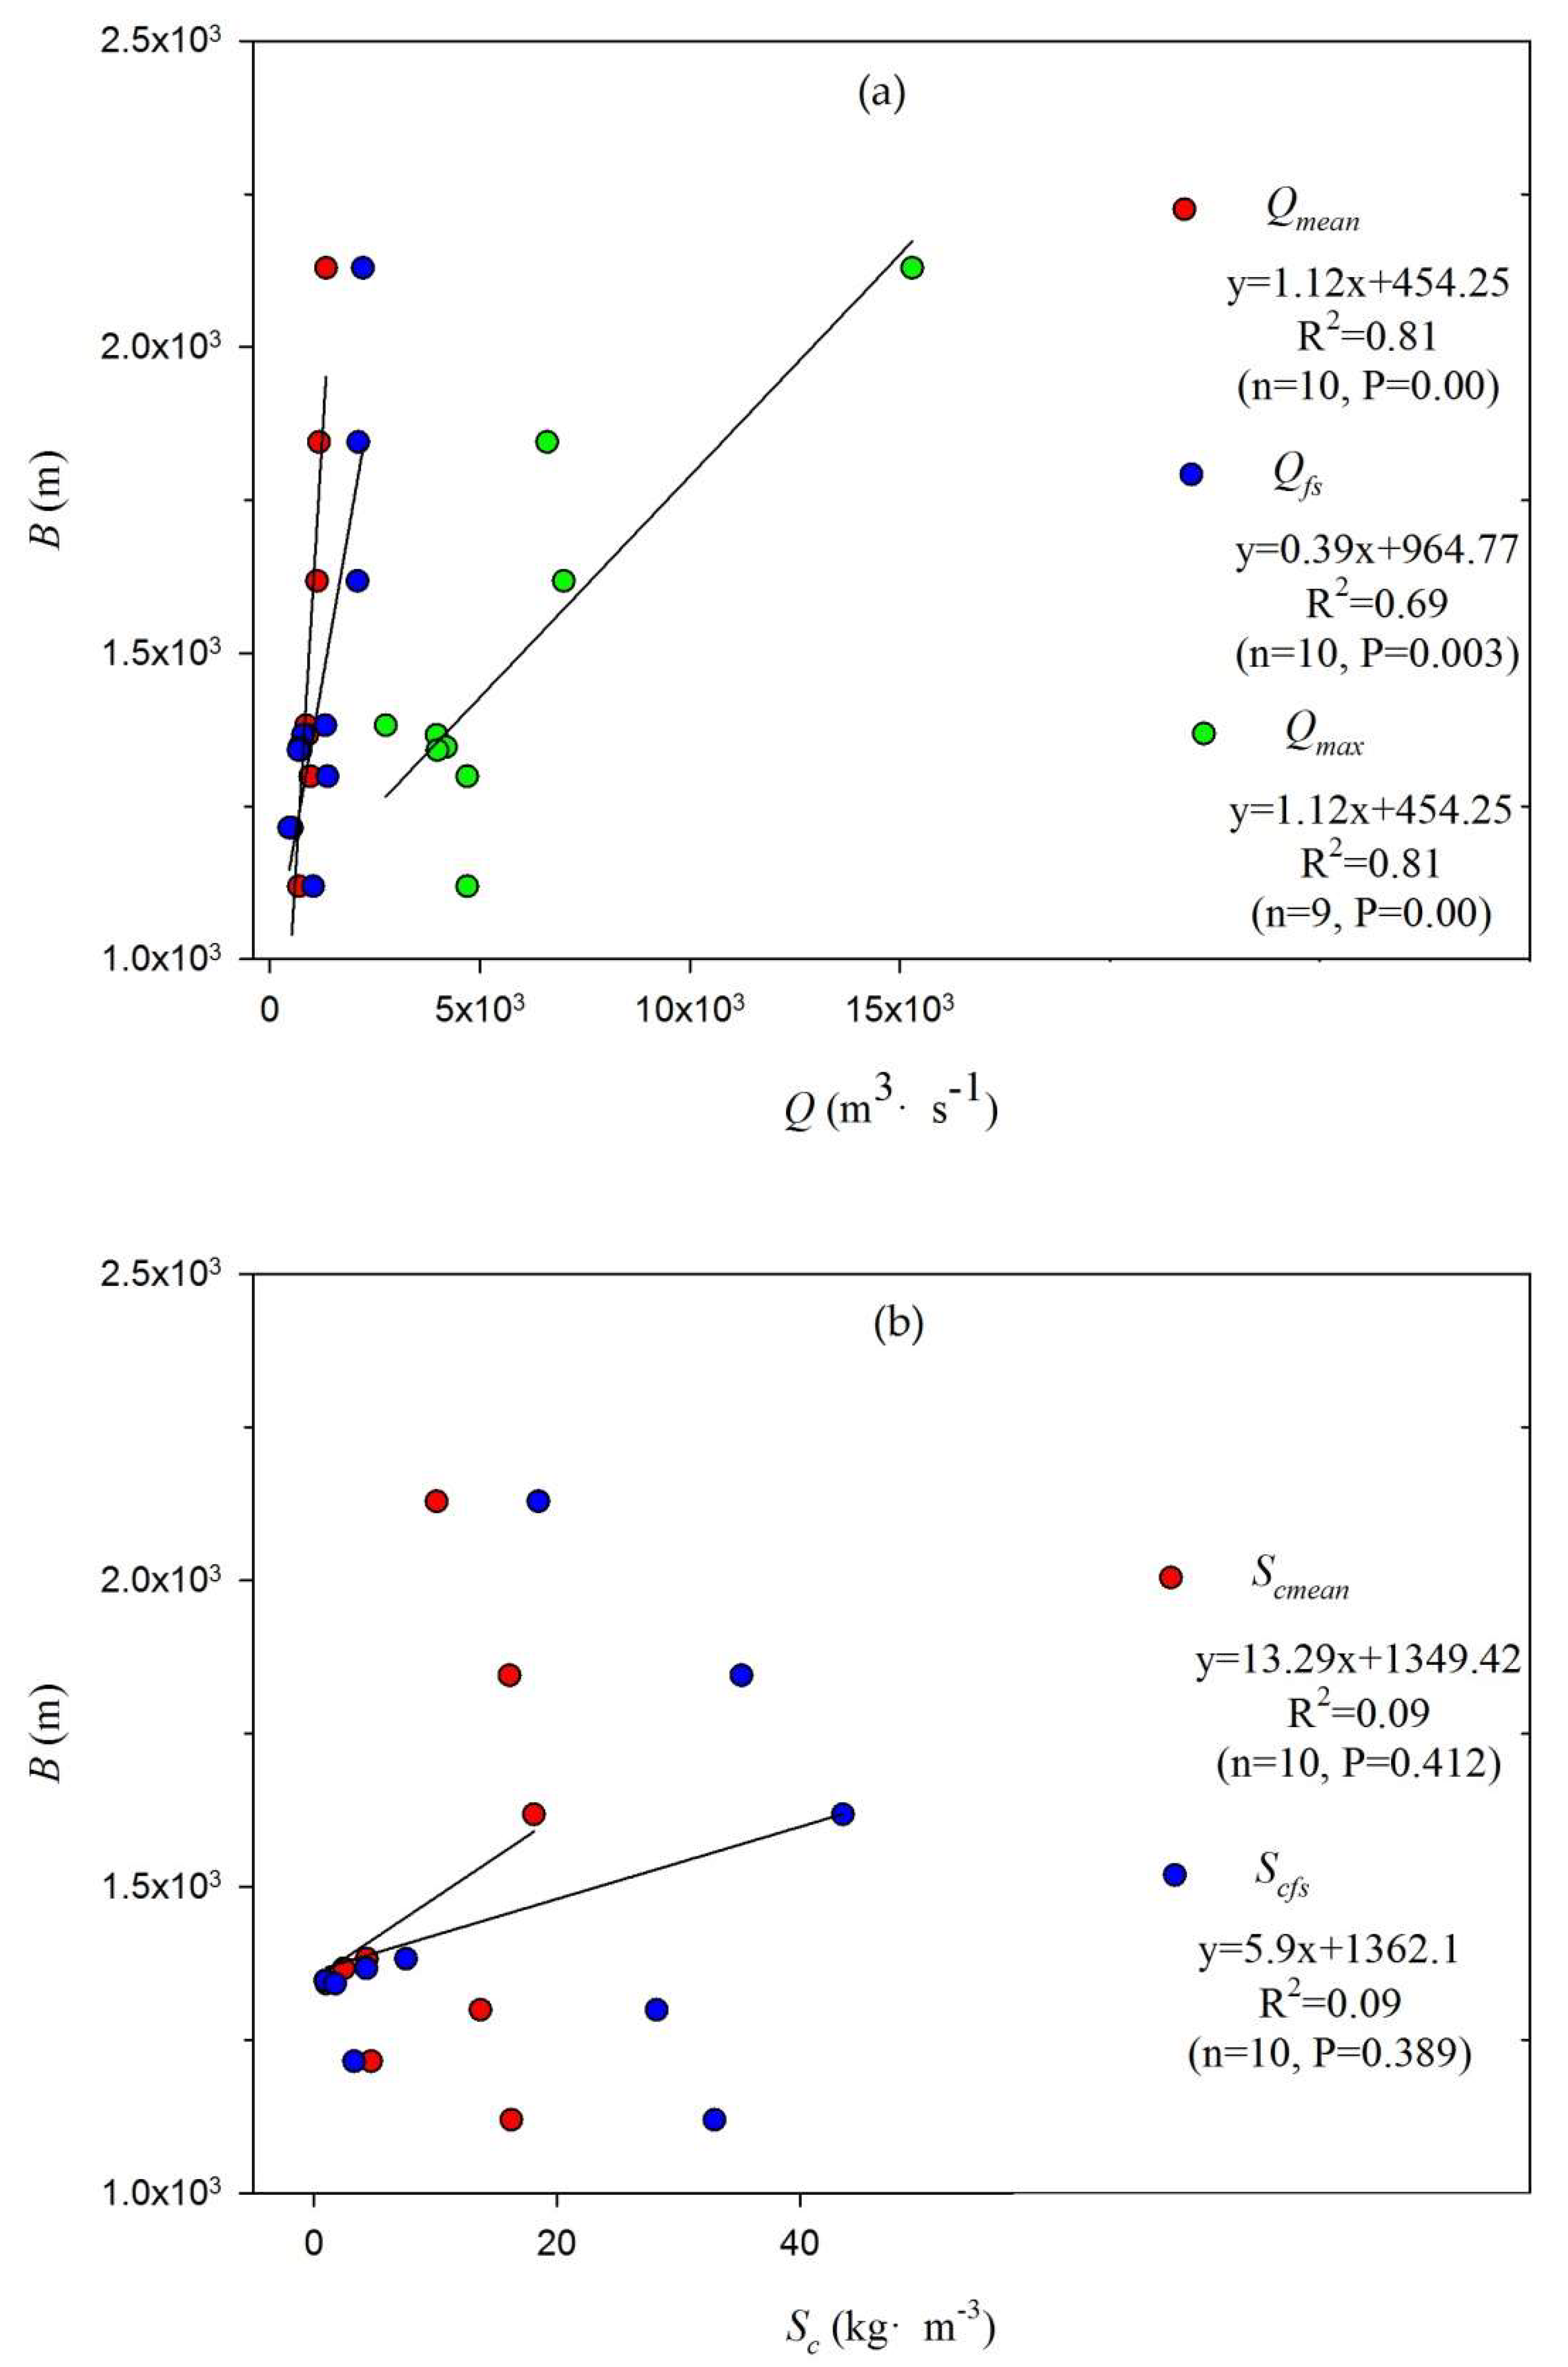
5.4. Responses of River Morphology to Flow and Sediment Changes

Figure 15 and Table 3 show how the reach-scale width of the wandering belt varies against flow discharge and suspended sediment concentration of flow at the timescale of one year or the flood season (May to October each year). It can be seen clearly that, among the flow discharge and the suspended sediment concentration at different timescales, the annual mean flow discharge in the flood season, or Q f s , is much more closely related with the wandering belt width. In other words, the mean flow discharge in the flood season plays a much more influential role for the development of the wandering belt in the LYR. This is consistent with field observations, which demonstrate clearly that the migrations of the main flow predominantly occurred in the flood seasons and not only in the LYR [15,34]. In the other rivers, large flooding events are very important for triggering widening and renewing the planimetric configuration of river channels [10,47,48]. In addition, the results presented in Figure 15 and Table 3 also show that the mean sediment concentration of flow in the flood season or S c f s exerts influence on the wandering belt width to a degree.
Figure 16 and Table 3 show how the reach-scale width, the average depth, and the width/depth ratio of the main channel against flow discharge and suspended sediment concentration of flow at the timescale of one year or the flood season (May to October each year). It can be seen clearly that, among all of the flow and sediment factors, the reach-scale width, the average depth, and the width/depth ratio are generally more closely related with flow and sediment factors at the timescale of one year, i.e., Qmean and Scmean.

6. Conclusions

Under the combined effects of human activities and climate change, the last several decades have seen a very dramatic change in water and sediment regime in the Lower Yellow River (LYR) with a significant decrease in the suspended sediment concentration of flow since 2000, which is a significant step-wise decline between 1979 and 2001 and then a slight increase in river runoff since 2002. To quantify the morphological response to the change in the wandering reach of the Lower Yellow River (LYR), this study examined the applicability of available Landsat images taken since 1979 and then presented an investigation of the relationships between the longitudinal and transverse morphological adjustments of the wandering river driven by the dramatic change in flow and sediment regime.
The most important finding of this study is that Landsat remote images provide a very useful means to quantify the variation in the wandering belt of the LYR. In particular, the spatio-temporal distribution of NDVI (Normalized Difference Vegetation Index) aided with field investigations is found suitable to identify the wandering belt created by the frequent migrations of the pathways of the main flow over the study reach. The pathways of the main flow are determined from the reflection of the sediment-laded water body in remote sensing images taken at low flows. As a consequence, the extracted results show clearly that the average width and area of the wandering belt over the entire study reach declined in a dramatic fashion from 1979 to 2000 and yet both varied, respectively, within a very narrow range between 2000 and 2015. Even though the number of bends increased significantly since the 1990s, the sinuosity of the pathways of the main flow remained almost unchanged.
Furthermore, by combining the morphological indices extracted from the selected remote sensing images with field hydrological and geomorphological measurements, our regression analysis identifies that the width of the wandering belt changes at the highest degree of correspondence with the width/depth ratio of the main channel and the variations of both related most closely to the average flow discharge and then to sediment concentration during the flood seasons. These implicate that a significant reduction of the magnitude of floods or/and sediment concentration is beneficial not only for making the main channel transit from a wider and shallower cross-section into a narrower and deeper profile but also for narrowing the wandering range of the main flow in the LYR.
Although these findings highlight the important role of hydrological controls for the adjustment of channel morphology in the wandering reach of the LYR, the study evaluates the role only at a one-year scale. More detailed investigations are required. In addition, while the regression results of this study reveals the high level of correspondence between the width of the wandering belt and the geometry of the main channel, the physical mechanism underlying the interaction between the two is not clear and needs more detailed investigations in order to accurately evaluate the effects of engineering projects for stabilizing the pathways of the river flow.

Author Contributions

Conceptualization, H.H. and G.Y.; Methodology, Z.X., H.H. and G.Y.; Software, Z.X.; Validation, Z.X., M.Z. and G.Y.; Formal analysis, Z.X. and H.H.; Investigation, H.H., Z.X., G.Y. and M.Z.; Data curation, Z.X. and M.Z.; Writing—original draft preparation, Z.X. and H.H.; Writing—review and editing, Z.X. and H.H.; Visualization, Z.X. and H.H.; Supervision, H.H. and G.Y.; Project administration, H.H. and G.Y.; Funding acquisition, H.H. and G.Y.

Funding

This research was funded by the National Natural Science Foundation of China (41330751, 41561144012, 41661144030) and the National Key R&D Program of China (2016YFC0402502).

Acknowledgments

The authors would like to thank the Yellow River Water Conservancy Commission of China for permission to access the observed hydrological data. The reviewers are thanked for their valuable comments that significantly improved the quality of our paper.

Conflicts of Interest

The authors declare no conflict of interest.

References

  1. Lane, E.W. The importance of fluvial geomorphology in hydraulic engineering. Proc. Am. Soc. Civ. Eng. 1955, 81, 1–17. [Google Scholar]
  2. Schumm, S.A. River metamorphosis. Journal of Hydraulics Division of American. Soc. Civ. Eng. 1969, 95, 255–273. [Google Scholar]
  3. Surian, N.; Rinaldi, M. Morphological response to river engineering and management in alluvial channels in Italy. Geomorphology 2003, 50, 307–326. [Google Scholar] [CrossRef] [Green Version]
  4. Rinaldi, M. Recent channel adjustments in alluvial rivers of Tuscany, Central Italy. Earth Surf. Process. Landf. 2003, 28, 587–608. [Google Scholar] [CrossRef]
  5. Gregory, K.J. The human role in changing river channels. Geomorphology 2006, 79, 172–191. [Google Scholar] [CrossRef]
  6. Welber, M.; Bertoldi, W.; Tubino, M. The response of braided planform configuration to flow variations, bed reworking and vegetation: The case of the Tagliamento River, Italy. Earth Surf. Process. Landf. 2012, 37, 572–582. [Google Scholar] [CrossRef]
  7. Ma, Y.X.; Huang, H.Q.; Nanson, G.C.; Li, Y.; Yao, W.Y. Channel adjustments in response to the operation of large dams: The upper reach of the lower Yellow River. Geomorphology 2012, 147–148, 35–48. [Google Scholar] [CrossRef]
  8. Chu, Z.X. The dramatic changes and anthropogenic causes of erosion and deposition in the Lower Yellow River since 1952. Geomorphology 2014, 216, 171–179. [Google Scholar] [CrossRef]
  9. Rozo, M.G.; Nogueira, A.C.R.; Castro, C.S. Remote sensing-based analysis of the planform changes in the Upper Amazon River over the period 1986-2006. J. South Am. Earth Sci. 2014, 51, 28–44. [Google Scholar] [CrossRef]
  10. Dewan, A.; Corner, R.; Saleem, A.; Rahman, M.M.; Haider, M.R.; Rahamn, M.M.; Sarker, M.H. Assessing channel changes of the Ganges–Padma River system in Bangladesh using Landsat and hydrological data. Geomorphology 2017, 276, 257–279. [Google Scholar] [CrossRef]
  11. Peixoto, J.M.A.P.; Nelson, B.W.; Wittmann, F. Spatial and temporal dynamics of river channel migration and vegetation in central Amazonian white-water floodplains by remote-sensing techniques. Remote Sens. Environ. 2009, 113, 2258–2266. [Google Scholar] [CrossRef]
  12. Abate, M.; Nyssenb, J.; Steenhuisa, T.S.; Mogesa, M.M.; Tilahuna, S.A.; Enkua, T. Adgo, E. Morphological changes of Gumara River channel over 50 years, upper Blue Nile basin, Ethiopia. J. Hydrol. 2015, 525, 152–164. [Google Scholar] [CrossRef]
  13. Clerici, A.; Perego, S.; Chelli, A.; Tellini, C. Morphological changes of the floodplain reach of the Taro River (Northern Italy) in the last two centuries. J. Hydrol. 2015, 527, 1106–1122. [Google Scholar] [CrossRef]
  14. Nanson, G.C.; Huang, H.Q. Self-adjustment in rivers: Evidence for least action as the primary control of alluvial-channel form and process. Earth Surf. Process. Landf. 2017, 42, 575–594. [Google Scholar] [CrossRef]
  15. Chien, N.; Zhou, W.H. Channel Processes of the Lower Yellow River; Science Press: Beijing, China, 1965. (In Chinese) [Google Scholar]
  16. Ashmore, P.E. How do gravel-bed rivers braid. Can. J. Earth Sci. 1991, 28, 326–341. [Google Scholar] [CrossRef]
  17. Xie, Z.; Huang, H.Q.; Zhou, Y.; Zhang, M. Progress on the study of the fluvial process of wandering rivers and discussion about its channel pattern classification. Prog. Geogr. 2016, 35, 898–909. (In Chinese) [Google Scholar]
  18. Hein, F.S.; Walker, R. Bar evolution and development of stratification in the gravelly, braided, Kicking Horse River, British Columbia. Can. J. Earth Sci. 1977, 14, 562–570. [Google Scholar] [CrossRef]
  19. Ferguson, R.I.; Werritty, A. Bar Development and channel changes in the gravelly River Feshie, Scotland. In Modern and Ancient Fluvial Systems; Collinson, J.D., Lewin, J., Eds.; Blackwell: Oxford, UK, 1983. [Google Scholar]
  20. Church, M.; Rice, S.P. Form and growth of bars in a wandering gravel-bed river. Earth Surf. Process. Landf. 2009, 34, 1422–1432. [Google Scholar] [CrossRef]
  21. Luo, Z.; Bai, Y.; Cai, W. Characteristics of evolution and its impact factors of the Yellow River along the Lanzhou urban reach from 1949 to 2005. Arid Land Geogr. 2009, 32, 403–411. (In Chinese) [Google Scholar]
  22. Liu, Y.; Chen, L.; Sun, Z. Influence of discharge process on shoal evolution in Luohuzhou reach. Eng. J. Wuhan Univ. 2014, 47, 445–451. (In Chinese) [Google Scholar]
  23. Milliman, J.D.; Meade, R.H. World-wide delivery of sediment to the oceans. J. Geol. 1983, 91, 1–21. [Google Scholar] [CrossRef]
  24. Saito, Y.; Chaimanee, N.; Jarupongsakul, T.; Syvitski, J.P. Shrinking megadeltas in Asia: Sea-level rise and sediment reduction impacts from case study of the Chao Phraya Delta. Inprint Newsletter of the IGBP/IHDP. Land Ocean Interact. Coast. Zone 2007, 2, 3–9. [Google Scholar]
  25. Wang, S.; Fu, B.; Piao, S.; Lü, Y.; Philippe, C.; Feng, X. Reduced sediment transport in the Yellow River due to anthropogenic changes. Nat. Geosci. 2016, 9, 38–42. [Google Scholar] [CrossRef]
  26. Pan, X.D.; Li, Y.; Zhang, X.; Shen, G.; Yue, D. Chapter four: The fluvial process in the Lower Yellow River prior to operation of Sanmenxia Reservoir by mode of storing clear water and discharging muddy. In The Fluvial Process in the Lower Yellow River after Completion of Sanmenxia Reservoir, 1st ed.; Yellow River Water Resources Press: Zhengzhou, China, 2006; pp. 100–101. ISBN 7-80734-033-9. [Google Scholar]
  27. Xia, J.; Wu, B.; Wang, Y. Processes and characteristics of recent channel adjustment in the Lower Yellow River. Adv. Water Sci. 2008, 19, 301–308. (In Chinese) [Google Scholar]
  28. Xia, J.; Li, X.; Li, T.; Zhang, X.; Zong, Q. Response of reach-scale bankfull channel geometry to the altered flow and sediment regime in the lower Yellow River. Geomorphology 2014, 213, 255–265. [Google Scholar] [CrossRef]
  29. Zhang, M.; Huang, H.Q.; Carling, P.A. Zhang, M. Sedimentation of overbank floods in the confined complex channel–floodplain system of the Lower Yellow River, China. Hydrol. Process. 2017, 31, 3472–3488. [Google Scholar] [CrossRef]
  30. Xu, J.; Sun, J. Influence of precipitation and human activities on water fluxes from the Yellow River into the sea in the past 50 years. Adv. Water Sci. 2003, 14, 690–695. (In Chinese) [Google Scholar]
  31. Wang, W.; Tian, S.; Meng, Z.; Lai, R. The evolutionary processes of river pattern in the Lower Yellow River after commissioning of the Xiaolangdi Reservoir. J. Sediment Res. 2012, 1, 23–31. (In Chinese) [Google Scholar]
  32. Winterbottom, S.J. Medium and short-term channel planform changes on the Rivers Tay and Tummel, Scotland. Geomorphology 2000, 34, 195–208. [Google Scholar] [CrossRef]
  33. Takagi, T.; Oguchi, T.; Matsumoto, J.; Grossman, M.J.; Sarker, M.H.; Matin, M.A. Channel braiding and stability of the Brahmaputra River, Bangladesh, since 1967, GIS and remote sensing analyses. Geomorphology 2007, 85, 294–305. [Google Scholar] [CrossRef]
  34. Chien, N.; Zhang, R.; Zhou, Z.D. Channel Processes; Science Press: Beijing, China, 1987. (In Chinese) [Google Scholar]
  35. Li, W.; Fu, X.; Wu, W.; Wu, B. Study on runoff and sediment process variation in the Lower Yellow River. J. Hydroelectr. Eng. 2014, 33, 108–113. (In Chinese) [Google Scholar]
  36. Gurnell, A.M. Channel planform change on the River Dee meanders, 1946–1992, from the analysis of air photographs. Regulated Rivers. Res. Appl. Manag. 1997, 13, 13–26. [Google Scholar]
  37. Liu, X.G.; Zhang, Y.; Han, L.; She, H. Chapter five: The apperance and spectral characteristics of the main flow. In Remote Sensing Monitoring Technology for River Regime of Yellow River Downstream; Water & Power Press: Beijing, China, 2012; p. 69. ISBN 978-7-5084-9217-9. (In Chinese) [Google Scholar]
  38. Schumm, S.A. Patterns of alluvial rivers. Annu. Rev. Earth Planet. Sci. 1985, 13, 5–17. [Google Scholar] [CrossRef]
  39. Van den Berg, J.H. Prediction of alluvial channel pattern of perennial rivers. Geomorphology 1995, 12, 259–279. [Google Scholar] [CrossRef]
  40. Gurnell, A.M.; Downward, S.R.; Jones, R. Channel planform change on the River Dee meanders, 1876–1992. River Res. Appl. 1994, 9, 187–204. [Google Scholar] [CrossRef]
  41. Yang, X.; Damen, M.C.J. Van Zuidam, R.A. Satellite remote sensing and GIS for the analysis of channel migration changes in the active Yellow River delta, China. Int. J. Appl. Earth Observ. Geoinf. 1999, 1, 146–157. [Google Scholar] [CrossRef]
  42. Boruah, S.; Gilvear, D.; Hunter, P.; Sharma, N. Quantifying channel planform and physical habitat dynamics on a large braided river using satellite data-the Brahmaputra, India. River Res. Appl. 2008, 24, 650–660. [Google Scholar] [CrossRef]
  43. Pavelsky, T.M.; Smith, L.C. RivWidth: A Software Tool for the Calculation of River Widths from Remotely Sensed Imagery. IEEE Geosci. Remote Sens. Lett. 2008, 5, 70–73. [Google Scholar] [CrossRef]
  44. Fisher, G.B.; Bookhagen, B.; Amos, C.B. Channel planform geometry and slopes from freely available high-spatial resolution imagery and DEM fusion: Implications for channel width scalings, erosion proxies, and fluvial signatures in tectonically active landscapes. Geomorphology 2013, 194, 46–56. [Google Scholar] [CrossRef]
  45. Gupta, N.; Atkinson, P.M.; Carling, P.A. Decadal length changes in the fluvial planform of the river Ganga: Bringing a mega-river to life with Landsat archives. Remote Sens. Lett. 2013, 4, 1–9. [Google Scholar] [CrossRef]
  46. Whited, D.; Stanford, F.J.A.; Kimball, J.S. Application of airborne multispectral imagery to quantify riverine habitats at different base flows. River Res. Appl. 2002, 18, 583–594. [Google Scholar] [CrossRef]
  47. Bertoldi, W.; Zanoni, L.; Tubino, M. Planform dynamics of braided streams. Earth Surf. Process. Landf. 2009, 34, 547–557. [Google Scholar] [CrossRef]
  48. Nardi, L.; Rinaldi, M. Spatio-temporal patterns of channel changes in response to a major flood event: The case of the Magra River (central–northern Italy). Earth Surf. Process. Landf. 2015, 40, 326–339. [Google Scholar] [CrossRef]
Figure 1. Location of the study area: (a) the entire drainage basin of the Yellow River; (b) Major dams and main tributaries of the Yellow River (the black rectangle is the area of this study); and (c) location of the study reach in the Lower Yellow River including major dams constructed on the river trunk, main tributaries, important places, and gauging stations.
Water 10 01767 g001
Figure 2. The transverse cross-profiles of the Yellow River near the Huayuankou gauging station (including floodplains and river channel) measured from the south dyke to the north dyke in the pre-flood seasons of 1979, 1983, and 1989 along with from the north dyke to the south dyke in the pre-flood seasons of 2006, 2010, and 2015, respectively. Data source: Hydrological Yearbooks of P. R. China (1979, 1983, 1989, 2006, 2010, 2015 for the Huanghe River (Yellow River) Drainage Basin).
Water 10 01767 g002
Figure 3. Remote sensing images of the study reach with a false color composite taken from 1979 to 2015.
Water 10 01767 g003
Figure 4. Spatial distribution maps derived from the original Landsat image taken in January 2015 in a small area enlarged for a clearer visual comparison: (a) NDVI; and (b) different objects including water body, sandy area, grass area, winter wheat area, and the boundary of the wandering belt.
Water 10 01767 g004
Figure 5. Images of the study reach derived from the original Landsat image taken in January 2015: (a) image with a false color composite and (b) image overlaid with the units of vegetation (both grass and winter wheat), sandy area, water body, and the wandering belt boundary in the study area.
Water 10 01767 g005
Figure 6. Variations of annual mean flow discharge Qmean and annual flood-season mean flow discharge Qfs: (a) and annual average concentration of suspended sediment Sc; and (b) recorded at the Huayuankou station from 1950 to 2015.
Water 10 01767 g006
Figure 7. Variation of the annual maximum flow discharge recorded at the Huayuankou gauging station between 1973 and 2015 (the maximum flow discharges occurred in 2000 and 2001 are unavailable because there was no hydrological data of this period released).
Water 10 01767 g007
Figure 8. Maps of the wandering belt configurations in different periods in the study reach extracted from the selected Landsat images. Note: In each map, the outline is drawn in terms of the Landsat image taken in the earlier date while the color area is extracted from the Landsat image taken during the later date.
Water 10 01767 g008
Figure 9. Variation of the wandering belt width in the study reach from 1979 to 2015 (Huayuankou and Xinzhai are two important locations on the wandering reach of the Lower Yellow River).
Water 10 01767 g009
Figure 10. Variations of the sinuosity of the main flow pathways and the number of bends in the study reach from 1979 to 2015.
Water 10 01767 g010
Figure 11. Variation of the main flow pathways from 1979 to 2015.
Water 10 01767 g011
Figure 12. Variations of the wandering belt area and the water surface area in the study reach extracted from the selected remote sensing images taken from 1979 to 2015.
Water 10 01767 g012
Figure 13. Reach-scale variations of the width (B), depth (H), and width/depth ratio (B/H) of bankfull and main channels measured in the pro-flood season from 1979 to 2015.
Water 10 01767 g013
Figure 14. Relationships of wandering belt width (W) with main channel geometries: (a) width of the bankfull or main channel (B); (b) average depth of the bankfull or main channel (H), and (c) width/depth ratio of the bankfull or main channel. Note: (1) All widths, average depths, and width/depth ratios are computed from the eight measured cross-profiles along the study reach; (2) The eight cross-profiles are located at Qinchang, Huayuankou, Babu, Laitongzhai, Xinzhai, Weicheng, Liuyuankou, and Caogang, respectively.
Water 10 01767 g014aWater 10 01767 g014b
Figure 15. Relationships of wandering belt width (W) with flow discharge (Q) and suspended sediment concentration of flow (Sc): (a) Qmean is the annual mean flow discharge (m3·s−1), Qfs is the annual mean flow discharge in the flood season (m3·s−1) and Qmax is the annual maximum flow discharge (m3·s−1); and (b) Scmean is the annual suspended sediment concentration of flow (kg·m−3), and Scfs is the annual mean suspended sediment concentration of flow in the flood season (kg·m−3).
Water 10 01767 g015
Figure 16. Relationships of the reach-scale width (B), depth (H), and width/depth ratio of the main channel (B/H) measured in the post-flood season, respectively, with typical flow discharge (Q) and sediment concentration of flow (Sc): (a,c,e), Qmean is the annual mean flow discharge (m3·s−1), Qfs is the annual mean flow discharge in the flood season (m3·s−1), and Qmax is the annual maximum flow discharge (m3·s−1); and (b,d,f), Scmean is the annual mean suspended sediment concentration of flow (kg·m−3) and Scfs is the annual mean suspended sediment concentration of flow during the flood season (kg·m−3).
Water 10 01767 g016aWater 10 01767 g016bWater 10 01767 g016c
Table 1. Details of the selected Landsat satellite images.
DateLandsat SensorBandResolution (m)Cloud Cover (%)
14 December 1979MSS4780
18 February 1983MSS4780
2 February 1989TM73020
23 January 1994TM7300
22 February 1999TM7303
19 February 2001ETM83010
19 January 2004TM7301
27 January 2007TM73028
1 February 2010TM7300
1 January 2015OLI_TIRS11302.95
Table 2. Variation of the averaged wandering belt width in the study reach between 1979 and 2015.
Year/PeriodWandering Belt Width (km)Change in Wandering Belt Width (km)Annual Mean Change Rate of Wandering Belt Width (m·y−1)
19793.50--
19833.710.2152.5
19892.90−0.81−135
19942.30−0.6−120
19991.69−0.61−122
20011.17−0.52−260
20041.370.266.67
20071.27−0.1−33.33
20101.340.0723.33
20150.97−0.37−74
1979–1989-−0.6−60
1989–2001-−1.73−144.17
2001–2010-0.1718.89
2010–2015-−0.37−74
1979–2015-−2.53−70.28
Table 3. Regression equations between morphological indices and water-sediment factors.
Regression EquationsR2Number of Data (n)p Value
W = 0.004Qmean − 1.290.82100.00
W = 0.002Qfs + 0.160.90100.00
W = 0.0002Qmax + 0.840.6390.01
W = 1.03Scmean0.330.6100.008
W = 0.94Scfs0.290.68100.006
Bm = 1.12Qmean + 454.250.81100.00
Bm = 0.39Qfs + 964.770.69100.00
Bm = 0.07Qmax + 1066.40.7490.00
Bm = 13.29Scmean + 1349.420.09100.5
Bm = 5.9Scfs + 1362.10.09100.4
Hm = −0.001Qmean + 3.10.16100.3
Hm = −0.0006Qfs + 2.890.35100.1
Hm = 48.82Qmax −0.370.2890.1
Hm = 3.1Scmean−0.260.81100.00
Hm = 3.03Scfs−0.190.64100.005
Bm/Hm = 1.3Qmean − 251.940.66100.00
Bm/Hm = 0.53Qfs + 236.850.77100.00
Bm/Hm = 2.86Qmax0.670.5190.031
Bm/Hm = 499.16Scmean0.310.65100.01
Bm/Hm = 494.03Scfs0.240.59100.005
Note: Bm is the average width of the main channel, Hm is the average depth of the main channel, W is the reach-scale width of the wandering belt, Qmean is the annual mean flow discharge (m3·s−1), Qfs is the annual mean flow discharge in the flood season (m3·s−1), Qmax is the annual maximum flow discharge (m3·s−1), Scmean is the annual averaged suspended sediment concentration (kg·m−3), and Scfs is the annual averaged suspended sediment concentration during the flood season (kg·m−3).

