Article

Biostability of Tap Water—A Qualitative Analysis of Health Risk in the Example of Groundwater Treatment (Semi-Technical Scale)

by
Andżelika Domoń
1,*,
Dorota Papciak
1,
Barbara Tchórzewska-Cieślak
2 and
Katarzyna Pietrucha-Urbanik
2
1
Department of Water Purification and Protection, Faculty of Civil, Environmental Engineering and Architecture, Rzeszow University of Technology, Al. Powstancow Warszawy 6, 35-959 Rzeszow, Poland
2
Department of Water Supply and Sewerage Systems, Faculty of Civil, Environmental Engineering and Architecture, Rzeszow University of Technology, Al. Powstancow Warszawy 6, 35-959 Rzeszow, Poland
*
Author to whom correspondence should be addressed.
Water 2018, 10(12), 1764; https://doi.org/10.3390/w10121764
Submission received: 13 November 2018 / Revised: 27 November 2018 / Accepted: 28 November 2018 / Published: 1 December 2018
(This article belongs to the Special Issue Biofiltration and Physicochemical Filtration for Water Treatment)

Abstract

:
This article presents results of research which aimed to assess the impact of biofiltration processing on the biological stability of water. Effectiveness of biogenic substances removal (C, N, P) and bacteriological quality of water after the biofiltration process were discussed. The research was carried out on a semi-technical scale on natural underground water rich in organic compounds. A filter with a biologically active carbon (BAC) bed was used for the research. Despite the low water temperature of between 9–12 °C, there was a high efficiency of organic matter removal—33–70%. The number of mesophilic and psychrophilic bacteria in the water before and after the biofiltration process was comparable (0–23 CFU/mL) and met the requirements for drinking water. No E. coli was detected in the water samples. The biological material washed out of the filter bed did not cause deterioration of water quality which proved that the operating parameters of the biofilters were properly chosen, i.e., contact time of 30 min, filtration speed up to 3 m/h. Reduction of the content of nutrients in the treated water limits the risk of microbial growth and thus the emergence of biological growth in the distribution system.

1. Introduction

The combination of unit processes used in water treatment technological systems should ensure not only removal of pollutants present in normative values but also guarantee water quality that reduces the risk of secondary contamination during transport to the recipient [1].
It is believed that the main cause of changes in the quality composition of water during its transport is, apart from the technical condition of the network, water instability. The result of instability is the intensification of corrosive processes through the precipitation and dissolution of accumulated deposits and the formation of biofilms [2,3]. All the factors enabling the creation and development of biofilms in water distribution systems are not presently sufficiently known [4]. A water that does not contain microorganisms and does not sustain their development in the water supply network is considered to be biologically stable. The striving to achieve the biological stability of water is associated with the need to ensure an extremely low content of food substrates, especially biodegradable organic carbon (BDOC), easily digestible nitrogen, and phosphorus [5,6,7,8,9].
The unsatisfactory efficiency of biogens removal has led to the need to expand conventional technological systems with a biofiltration process in which contaminants are removed by sorption, assimilation, and biodegradation [10,11,12].
Biofiltration makes it possible to eliminate the basic nutrients that ensure the growth of microorganisms and precursors of disinfection by-products (this is demonstrated by the decrease in UV absorbance) [13,14,15].
However, it remains doubtful how the efficiency of the biofiltration process will change after exhausting the adsorptive capacity of activated carbon. Will the water after the biofiltration process still be safe in sanitary terms and how will it affect the stability of tap water?
The greatest concerns relate to the possibility of microorganisms or fragments of biofilms, formed on activated carbon seeds which fill the biofilter, getting into the treated water. The fact that the final disinfection process does not completely eliminate bacteria, viruses, and fungi present in the treated water further intensifies these fears [16,17].
The aim of the research was to assess the impact of the biofiltration process on the microbiological quality of water and the effectiveness of biogenic substances removal which determine the biological stability of tap water.

2. Materials and Methods

2.1. Characteristics of Drawn Water (Raw)

The Water Treatment Plant (WTP) is supplied from an unconfined quaternary aquifer with a depth of about 15 m bgl using 27 wells. The physicochemical quality of the water being captured is presented in Table 1.

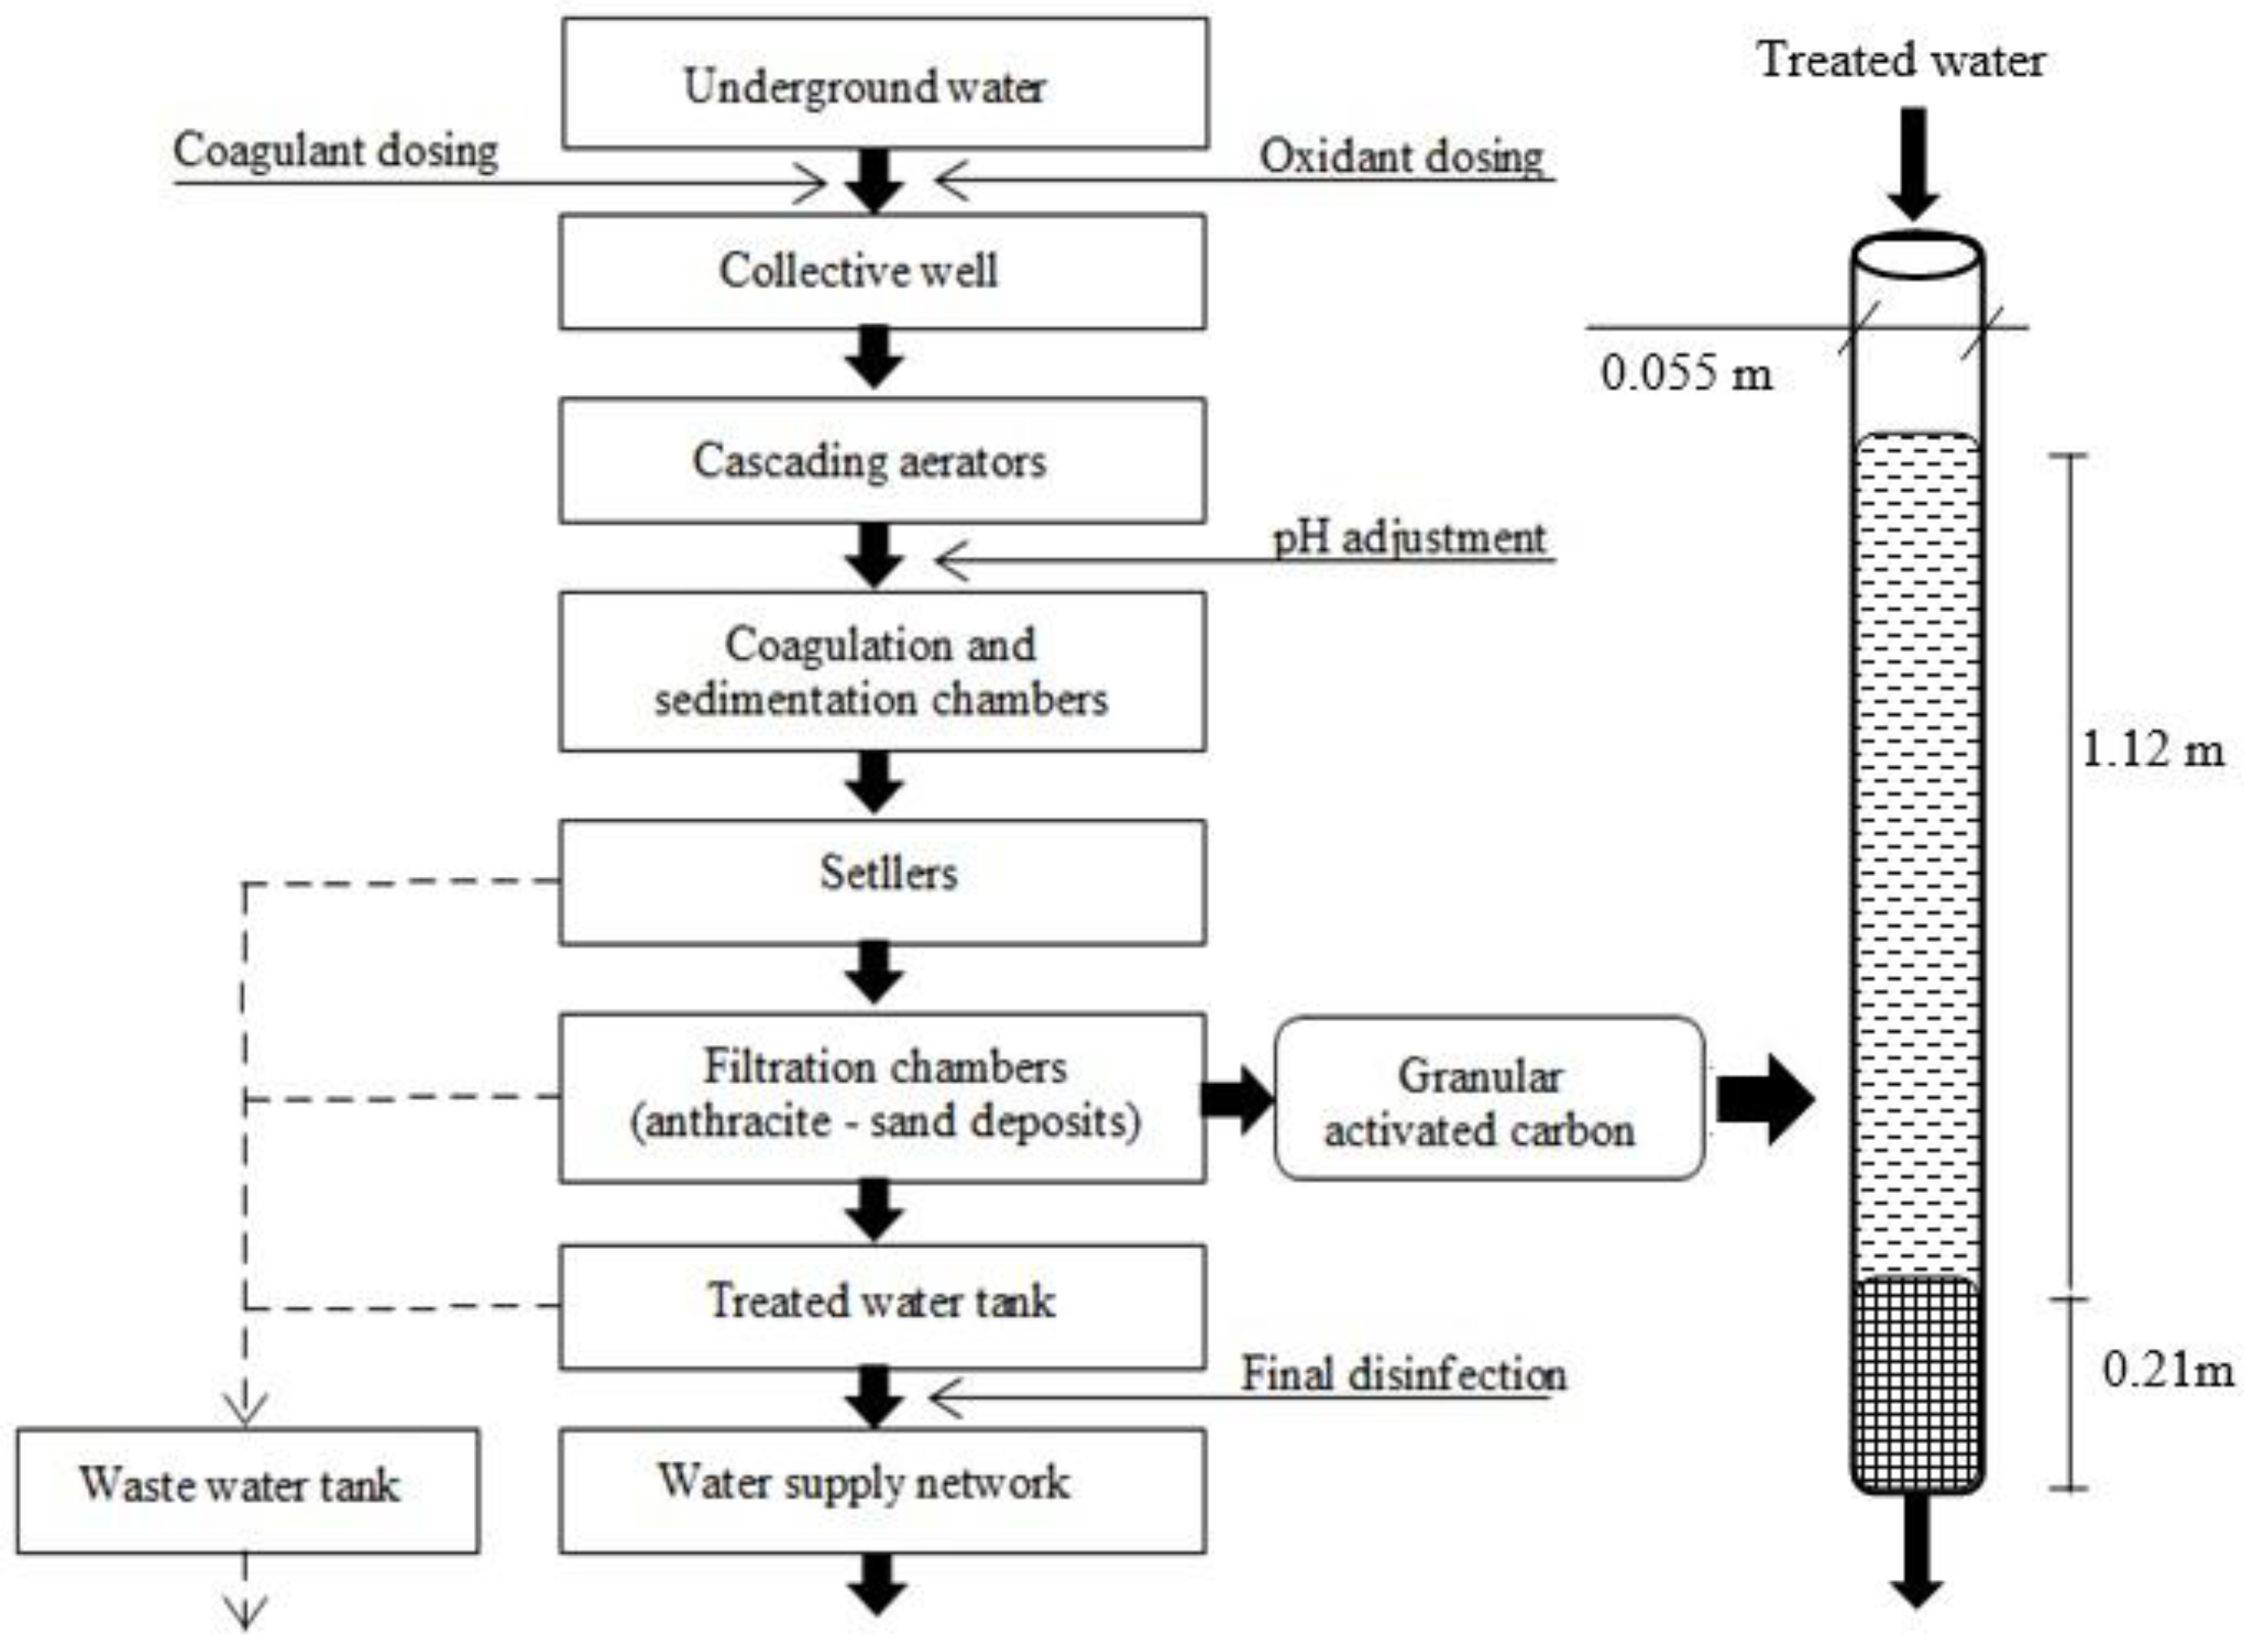
2.2. Technology System for Water Treatment

The drawn water is directed to a collective well (stoppage time of 2–4 h, depending on the current water production). The water is then directed to a cascade of oxygenation. A dispensing potassium permanganate chemical-oxidant with a dose of 2.1–2.4 mg/L and a PAX-18 coagulant in the amount of 120–140 mg/L is situated just below the cascade (11.0–12.6 mg Al/L). Vertical coagulation–sedimentation chambers with a contact time of 6–8 h are the next stage of the water treatment. Lime milk is dosed (about 10.0 mg/L) to the water in the chambers, which is directed to horizontal settler raising the pH. The retention time in the settlers is several hours. The next step involves filtration of water at a speed of 1.5–3 m/h and the final disinfection with sodium hypochlorite (Figure 1).
The filter used was a biologically active deposit of activated carbon with the parameters contained in Table 2.

2.3. Research Procedure

The research was carried out over a period of one calendar year. The list of controlled water parameters and analysis procedures is presented in Table 3. The obtained results were subjected to statistical analysis with the use of STATISTICA12 software.

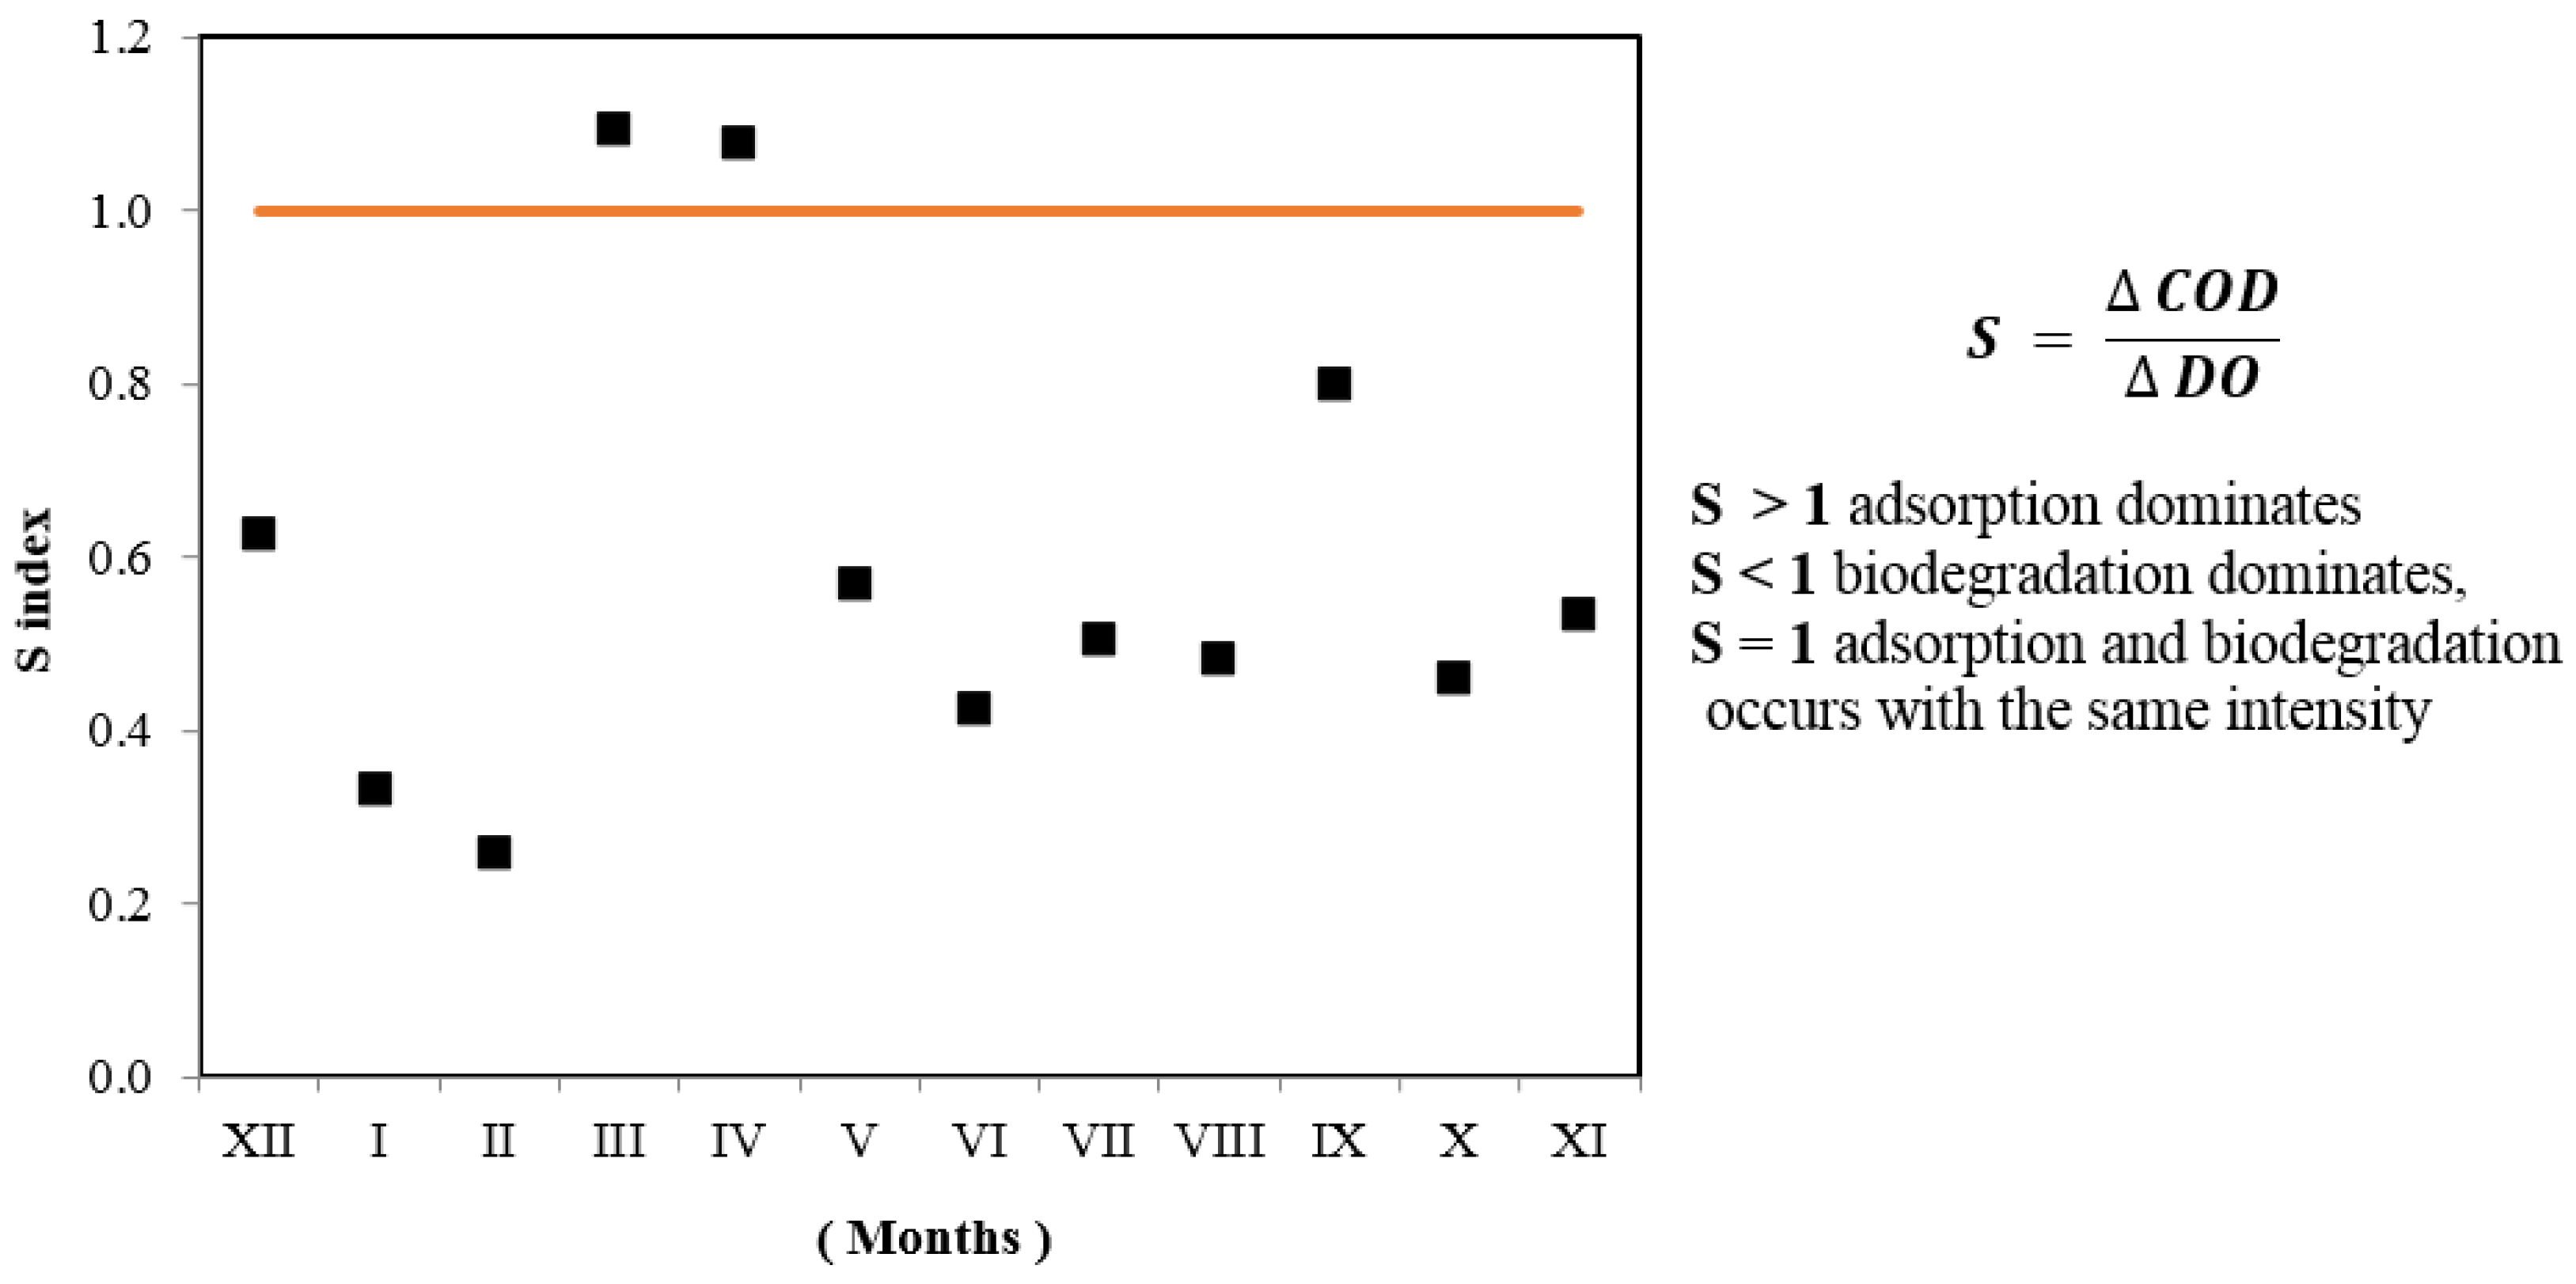
2.4. Evaluation of Work of Model Filter-Test EMS

The development of activity within biosorption beds, and the observations regarding the relationships between sorption and biodecomposition processes, were recorded based on the Eberhardt, Madsen, Sontheimer (EMS) test [19,20,21]. The EMS test is based on the value of the indicator, described by the relation between the change in COD or permanganate index and the loss of dissolved oxygen, taking place during filtration.
S = ΔCOD/ΔO2
where:
  • ΔCOD—loss of COD (with K2Cr2O7 or with KMnO4)
  • ΔO2—loss of dissolved oxygen
When:
  • S = 1 adsorption and biodecomposition happen with identical intensiveness,
  • S > 1 adsorption dominates,
  • S < 1 biodecomposition dominates,
  • S = 0, ΔCOD = 0, ΔO2 > 0 sorption and biodecomposition processes stopped
  • S undetermined, ΔCOD > 0, ΔO2 = 0 sorption present, biodecomposition absent
    ΔCOD = 0, ΔO2 = 0 sorption and biodecomposition absent
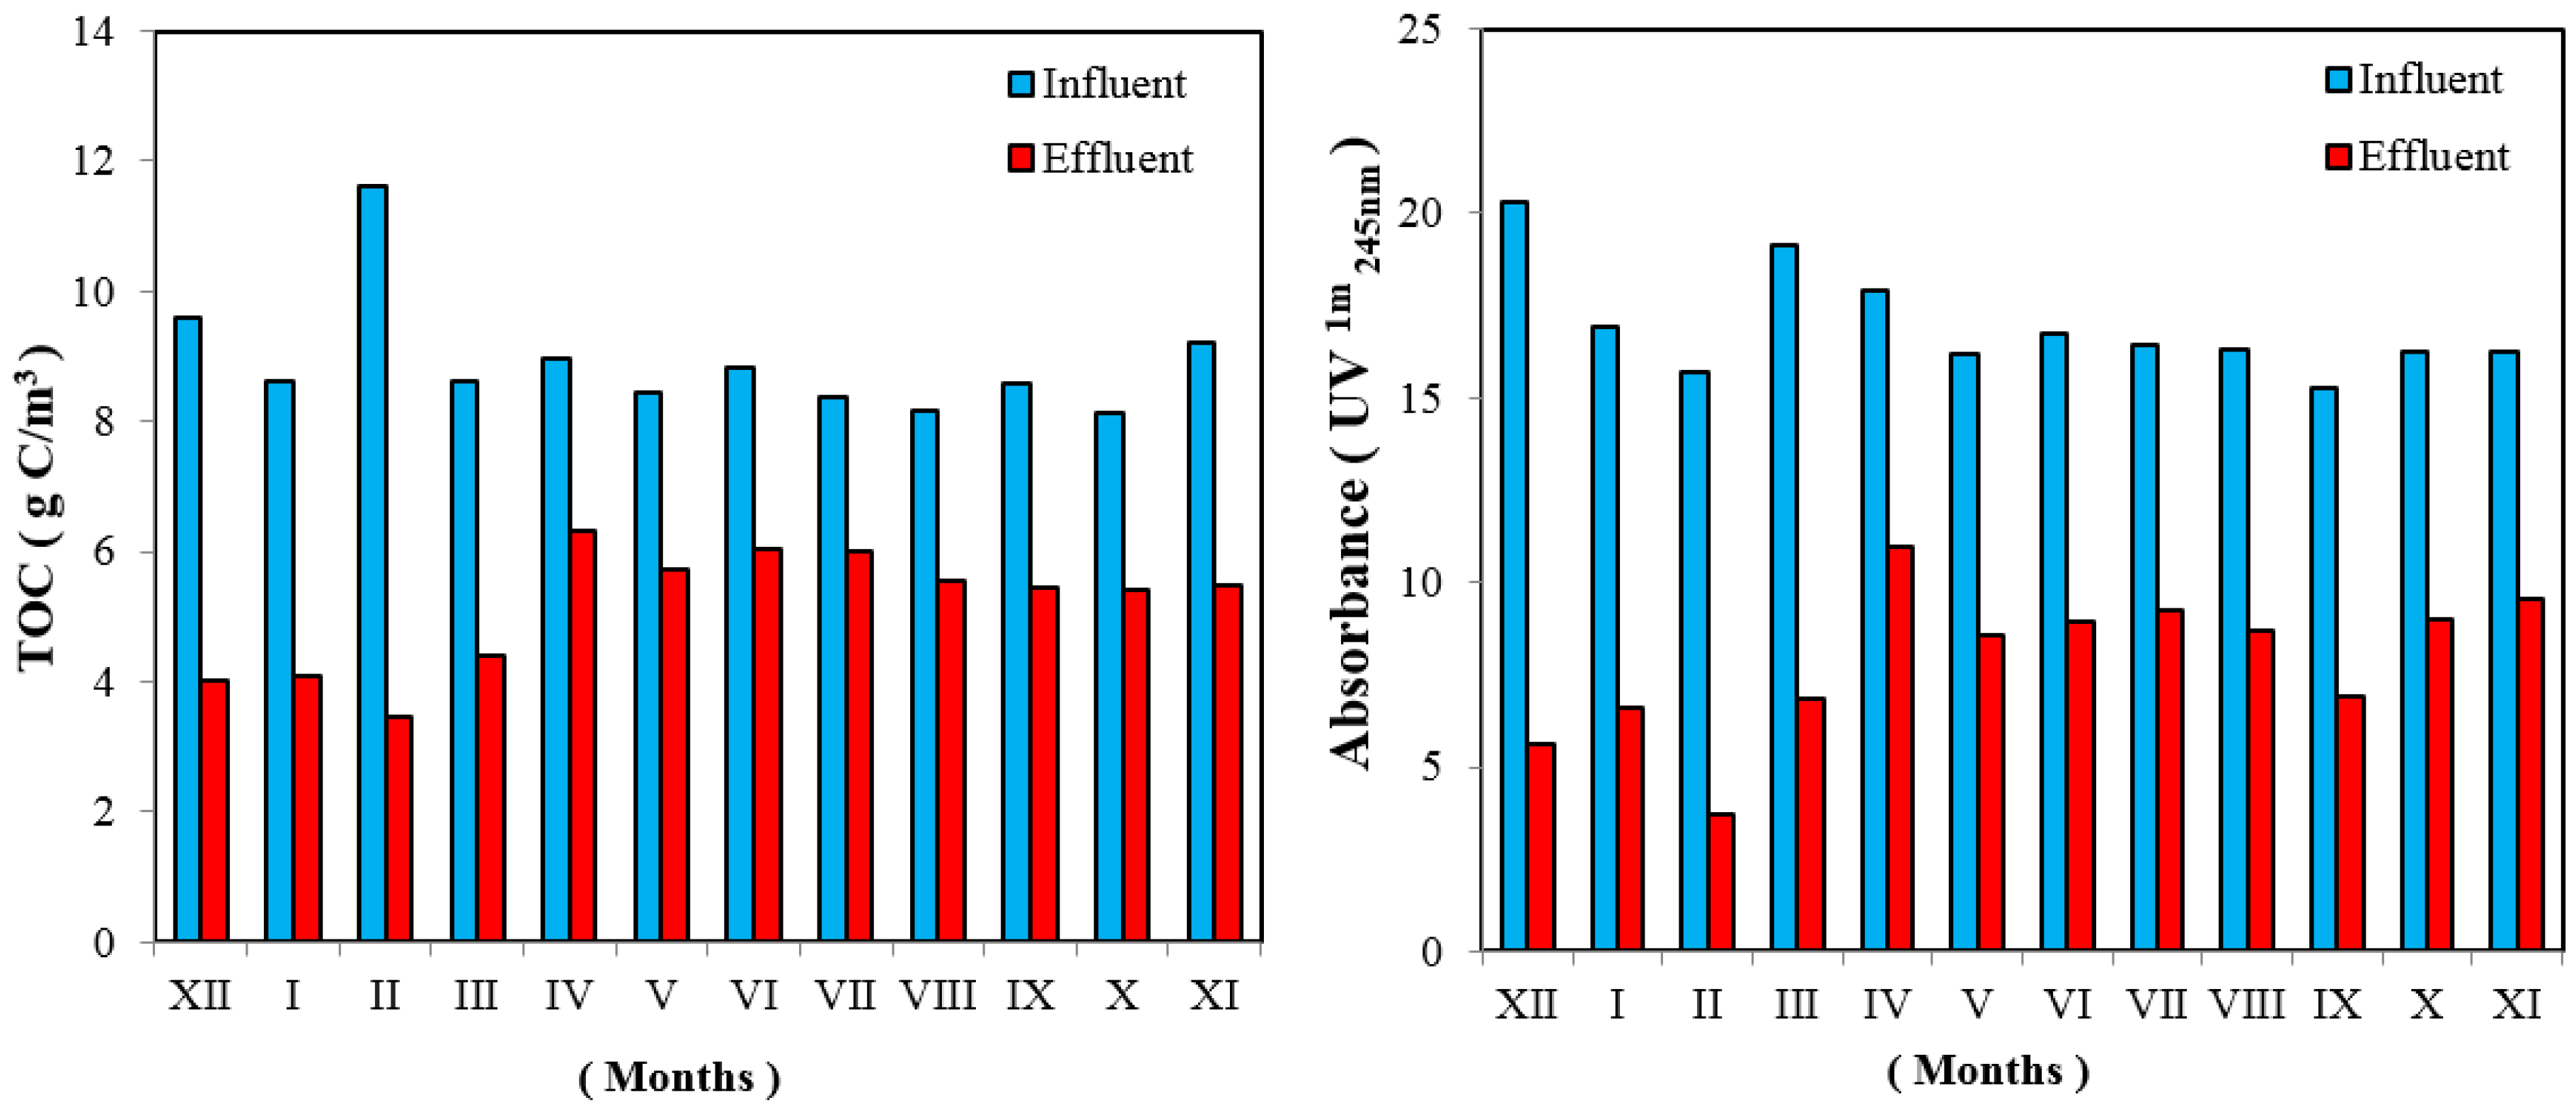
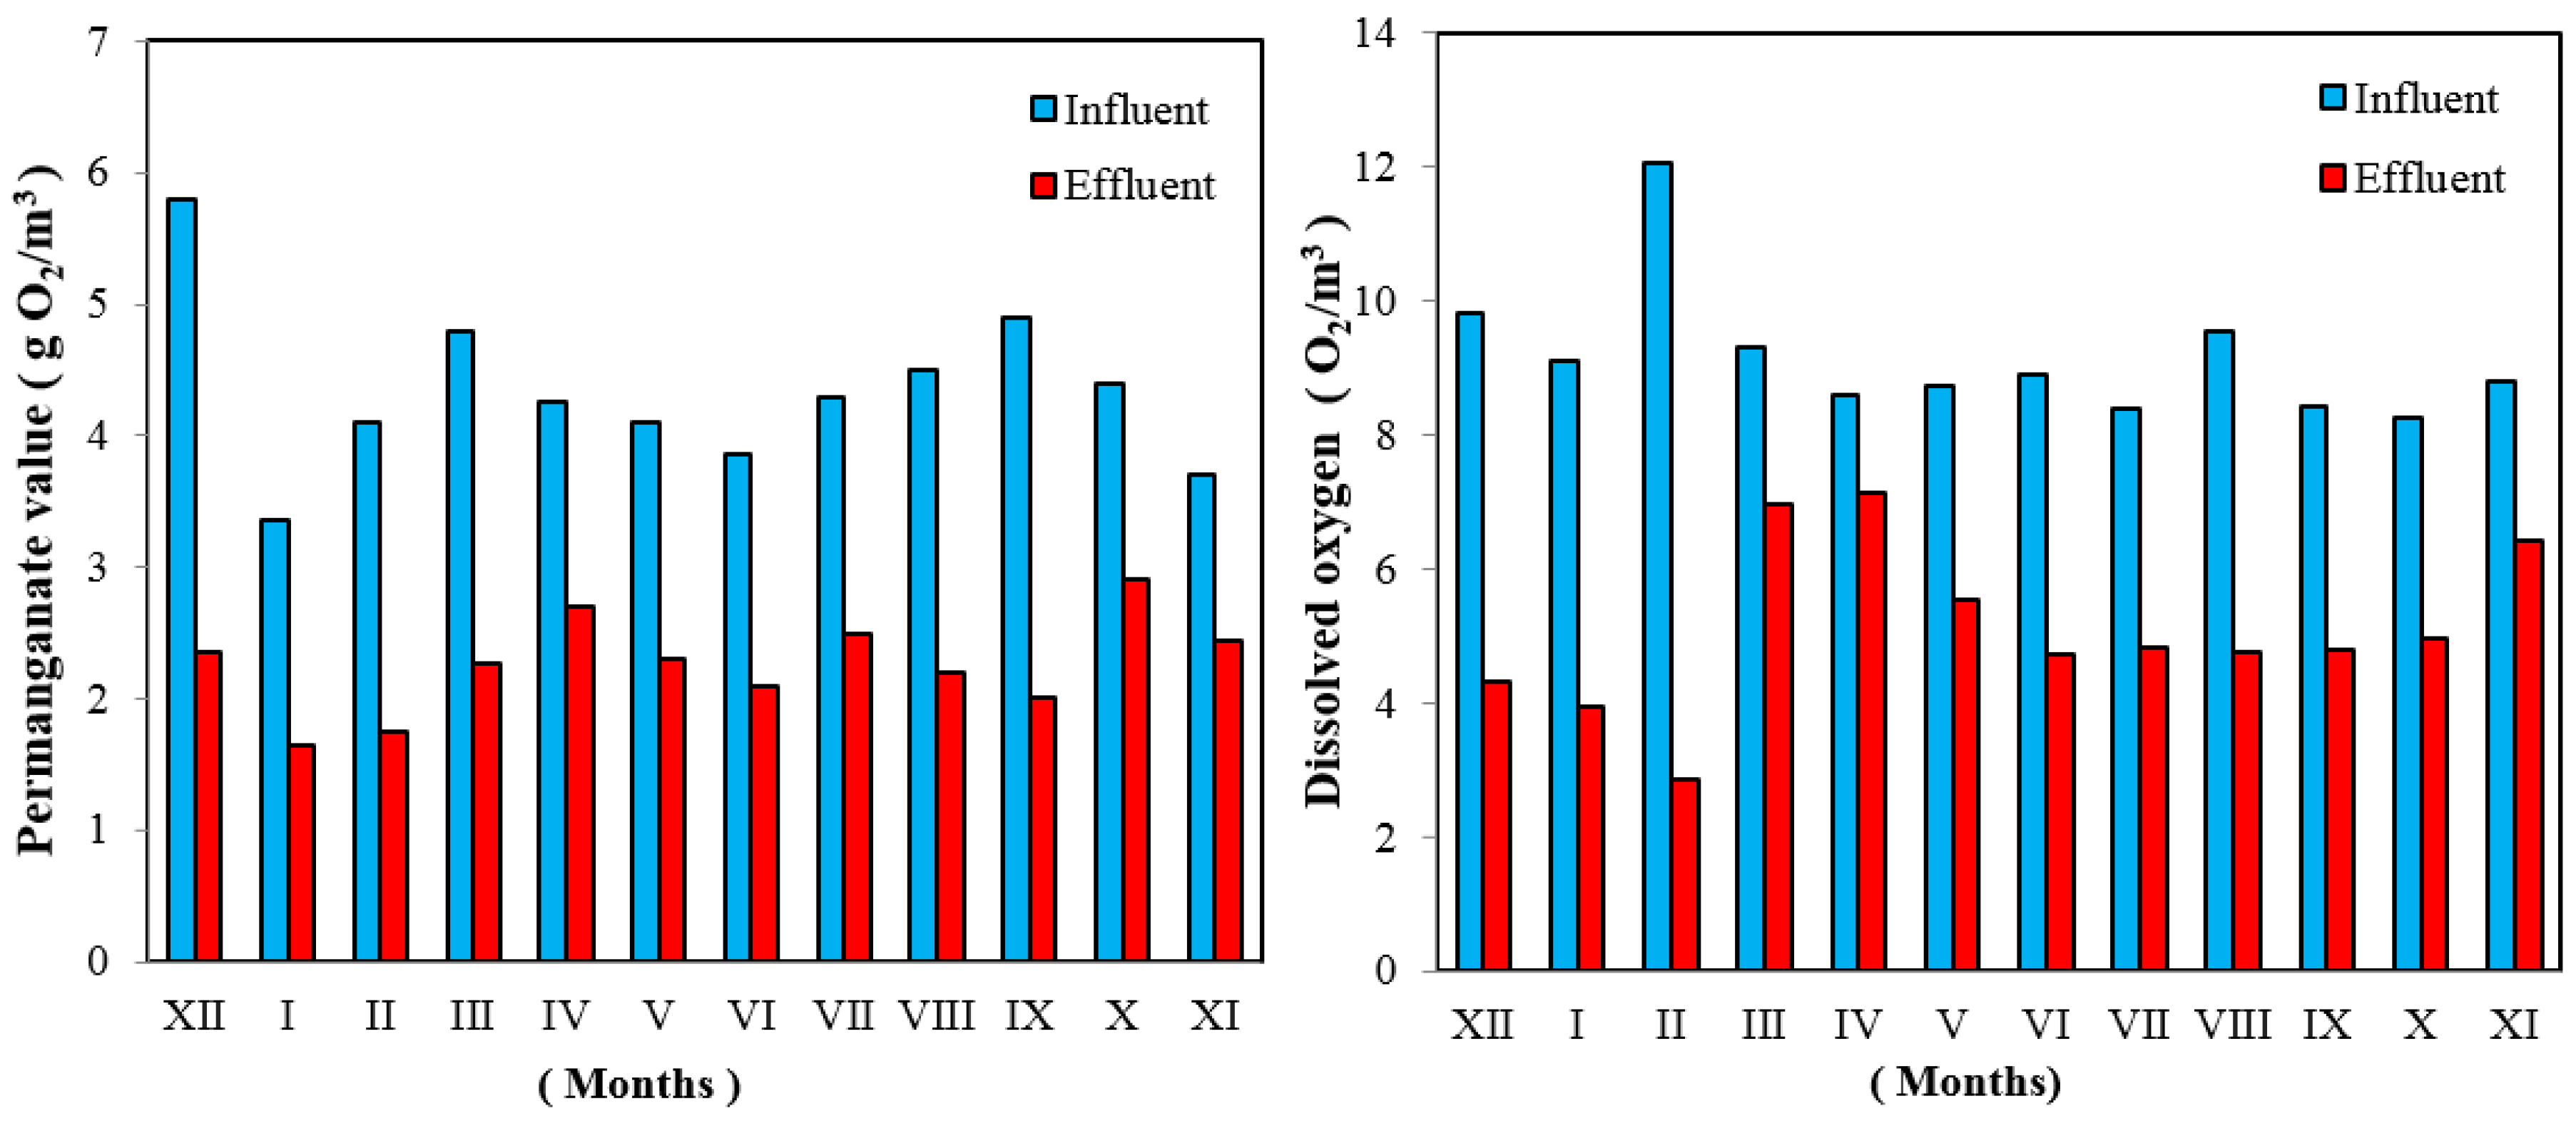
The presence of the biofilm was confirmed by observation, using a light microscope and an electron scanning microscope JOEL SEM 5500 LV (JEOL Ltd., Tokyo, Japan).

3. Results

Expanding a conventional treatment system with a biofiltration process on granulated active carbon resulted in an improvement of physicochemical parameters (Figure 2, Figure 3 and Figure 9) and did not cause the deterioration of the treated water’s microbiological parameters (Figures 7 and 8).
The average monthly values of total organic carbon in the water feeding the carbon filter ranged from 8.13 to 11.61 mg C/dm3, whereas, after the biofiltration process, the values ranged from 3.47 to 6.31 mg C/dm3 (Figure 2). The highest efficiency of removing organic compounds, by 70%, was observed in February. From April to November, the effectiveness of total organic carbon (TOC) removal was relatively stable at 33%.
The average efficiency of absorbance reduction after the biofiltration process ranged from 4% to 72%, and the lowest obtained value was 3.40 m−1 (Figure 2). The analysis of obtained test results showed a strong relationship between the concentration of TOC and UV absorbance, for which the Pearson correlation coefficient reached a value of R = 0.77. The measurement of the total organic carbon content at many water treatment plants is often replaced by the ultraviolet absorbance test.
The concentration of organic matter expressed by oxidation fluctuated around the recommended value (5 mg O2/dm3), while the introduction of a biofiltration process allowed lowering of the average monthly values of this parameter by a factor of two (Figure 3).
The increase in the efficiency of organic matter removal in the filtration process through a bed of activated carbon was mainly caused by the process of biodegradation occurring with the participation of microorganisms developing on the surface of grains [19]. The dominant biosorption process was demonstrated by the reduction of oxidation and oxygen depletion (Figure 3 and Figure 4).
The nature of the carbon bed’s work and its biological activity was determined using the Eberhardta, Madsena, and Sointheimera (EMS test). The average values of the S index obtained for the one-year study are shown in Figure 4.
The EMS test confirmed that the biodegradation process dominates on the surface of the activated carbon. S index values were in the range from 0.26 to 0.8. The exception was in the months of March and April, during which the increase of S index was above 1, indicating the dominance of the sorption process over biodegradation.
The presence of biofilm on the surface of activated carbon is confirmed by images from light (Figure 5) and scanning microscopes (Figure 6).
The average number of mesophilic and psychrophilic bacteria in the water before and after the process was at a comparable level, i.e., 0–18 CFU/mL in the case of mesophilic and 0–23 CFU/mL—psychrophilic (Figure 7). The presence of E. coli was not detected in the water samples after the biofiltration process during the entire test period. The presence of E. coli in an amount of 1–3 CFU/mL constitutes low, 4–6 CFU/mL medium, and 7–9 CFU/mL a high health risk [23]
Introduction of the biofiltration process allowed obtaining of water that meets the microbiological requirements as defined by Council Directive 98/83/EC of 3 November 1998 on the quality of water intended for human consumption. In addition, the quality of treated water corresponded to the requirements for bottled water (bottle sales), as the number of mesophilic and psychrophilic bacteria did not exceed the normative values of 20 and 100 CFU/mL, respectively (Figure 7) [24].
The statistical analysis of the microbiological research results (Figure 8) fully confirms that a properly conducted biofiltration process is safe. The biological material washed out of the filter bed will not affect the sanitary condition of water if the biofilter parameters are optimal for the biodegradation process, i.e., contact time (30 min), filtration speed (1–3 m/h).
Figure 9 compares the physicochemical quality of water before and after the biofiltration process on granulated activated carbon. Reducing the content of nutrients in water limits the risk of loss of biological stability of water entering the distribution system. The threshold values of parameters limiting secondary development of microorganisms in distribution systems should be lower than 0.25 g C/m3 BDOC, 0.2 g Nnorg/m3 and 0.03 g PO43−/m3 [25].
For the whole of the research period, the average content of inorganic nitrogen in water reaching the biofilter was 0.76 g Nnorg/m3, whereas after filtration through the active carbon bed it was 0.62 g Nnorg/m3. The value recommended for maintaining biostability—0.2 g Nnorg/m3—was not obtained (Figure 10). The content of phosphate ions varied in the range of 0–0.0035 g PO43−/m3 and met the requirements necessary to maintain water biostability (0.03 gPO43−/m3) (Figure 10).
Analyzing the three-level scale of risk, i.e., tolerated, controlled, and non-acceptable risk, it was found that in a conventional treatment system, only 4.7% of the samples tested are in the tolerable risk zone, while the biofiltration process increases this value to 28.6%. The remaining samples correspond to the level of safety requiring control and reduction, in which there are reasons to maintain water biostability [14].
The comparison of median of the treated water’s physicochemical parameters in a conventional system and in the system extended by the biofiltration process indicates the justifiability of introducing biofiltration using granulated activated carbon. Reducing the content of nutrients in treated water reduces the risk of microbial growth and thus the emergence of biological growth in the distribution system.

4. Discussion

The effectiveness of removing organic pollutants on active carbon beds has been confirmed by numerous studies [15,19,26,27,28,29]. Conventional water treatment systems eliminate natural organic substances up to 40% [11,21,24], while systems extended by biofiltration, depending on the time of biofilter exploitation, achieve from 24–100% [15,19,30,31,32]. The effectiveness of organic matter removal in metabolic processes is lower (24–42%) than in the adsorption process (70–100%), but the effectiveness of biofilter operation may exceed 10 years [10,33].
The research conducted for the first operational period of the biofilter [19] showed that the combination of sorption processes with biodegradation until exhaustion of the capacity of the carbon bed allowed for 100% removal of organic matter. Creation of biofilm before exhaustion of the sorption capacity of carbon allowed extending of the filtration cycle but the effectiveness of removing TOC decreased to 70% [19].
The results of research presented in this paper indicate that after a year of using a biofilter the efficiency of organic matter removal decreased by 50%. The observed decrease in the effectiveness of the biofilter could be caused by the depletion of the sorption capacity of carbon and the decrease in the activity of microorganisms inhabiting the carbon bed.
The water temperature is an important parameter determining the activity of microorganisms. Moll et al. found that the removal efficiency of dissolved organic carbon at 20 °C was 24%, and at 5 °C the efficiency was reduced to 15% [34]. Emelko et al. observed similar differences in the efficiency of the biodegradation process—92% for 21–25 °C and 58% for 1–3 °C [35]. Selbes et al. found seasonal variability of biofiltration efficiency. The effectiveness of removing dissolved organic carbon was lower in cooler months (~5%) and higher in warmer months (~24%) [36]. Halle et al. also confirm that the supply water temperature affects the efficiency of biofiltration [37]. Low temperature not only reduces the rate of metabolization of the substrate but also affects the structure and diversity of the biological membrane [34,38]. Hallam determined that the microbial activity at 7 °C is 50% lower than at 17 °C [3].
In the analyzed case, the problem concerned removal of organic matter from groundwater, which, unlike surface water, is characterized by low temperature variability throughout the year. The temperature could not constitute the main reason for reducing the activity of microorganisms because the highest efficiency of biofilters was observed in the winter months, i.e., December–March.
Literature indicates that the microbial activity correlates with the availability of nutrients, i.e., the content of carbon, nitrogen, and phosphorus in the water flowing into the biosorption field. The C:N:P ratio should be 100:10:1 and deficiency of any of the constituents limits the growth and development of microorganisms, thus interfering with the course of the biodegradation process [39,40]. Dhawan et al. controlled the effectiveness of three biofilters in which the treated water differed in terms of nutrient content as follows: 546:24:1, 100:10:1, and 25:10:1. The Dissolved Organic Carbon (DOC) removal efficiency was 23.5%, 28.6%, and 33.5% respectively [40]. In the case of waters containing natural organic matter and inorganic nitrogen, phosphate ions are essential [41,42]. Their insufficient content inhibits the growth of microorganisms to a much greater extent than is the case for other biogens [6,43]. Phosphorus concentrations below 0.005 mg/dm3 inhibit the transport of phosphorus to bacterial cells [44].
The water flowing into the biofilter was characterized by a low phosphorus content (0–0.0035 g PO43−/m3) which could have influenced the activity of microorganisms and the efficiency of the biofiltration process. The observed lack of changes in the content of phosphorus in water after biofiltration with the simultaneous removal of nitrogen (18%) and TOC (33%) could suggest the existence of another source of phosphorus. It is likely that the carbon that fills the biofilter has been chemically activated with phosphorus-containing compounds.
It should be noted that despite the unfavorable relationship between the content of biogenic substances (C:N:P, 28500:217:1), there has been a smooth transition of the sorption process into biodegradation. The only explanation for the effective operation of the biofilter in the initial period of exploitation could be a method of coal grains’ chemical activation. Perhaps supplementing the phosphorus content in an amount that would allow the optimal biogen ratio would help to increase the efficiency of natural organic matter removal. The decisive role of phosphorus should be kept in mind when water directed to a biofilter is subjected to coagulation, effectively eliminating phosphorus from the treated water.
The effectiveness of removing impurities in the BAC process also depended on the activity and type of microorganisms forming the biological membrane [33,45]. Studies on the biological activity of carbon bed samples were presented, among others, in the thesis [28,46,47,48]. Literature data show that the biomass concentration demonstrates vertical stratification and decreases with the depth of the bed, however [45,47,49,50,51,52], this is not the rule [53]. Differences in the composition and concentration of biomass depend on the availability of nutrients and the concentration of dissolved oxygen [54]. Less attention has been paid to the microbiological quality of the filtrate. In the works [55,56], small changes were shown between the quality of water directed to biofilters and flowing from the biofilter (the study was conducted for surface water treated with ozonation before biofiltration).
When analyzing the microbiological quality, it was found that the number of mesophiles and psychrophiles in water before and after biofiltration was at a comparable level from 0 to 23 CFU/ mL. The biological material washed out of the filter bed did not cause deterioration of water quality which proved that the operating parameters of the biofilters were properly chosen, i.e., contact time (30 min), filtration speed (up to 3 m/h).

5. Conclusions

The biofiltration process improves the quality and biological stability of treated water, reducing the health risk and risks associated with threats to the technical infrastructure.
The number of mesophilic and psychrophilic bacteria in the water before and after the biofiltration process was comparable (0–23 CFU/mL) and met the requirements for drinking water. No E. coli was detected in the water samples. The biological material washed out of the filter bed did not cause deterioration of the water quality which proved that the operating parameters of the biofilters were properly chosen.
The efficiency of TOC removal in the biofiltration process ranged from 70% to 33%. The reason for the decrease in the effectiveness of the process of organic matter removal in the second year of biofilter exploitation could be depletion of the adsorption capacity of the carbon bed and reduction of the activity of microorganisms colonizing the bed. Too low content of phosphorus in the water entering the biofilter could affect the efficiency of the biodegradation and assimilation process.
The values of the median of treated water’s physicochemical and bacteriological parameters in the system extended by the biofiltration process prove the justifiability of introducing this process into the technological system of water treatment.

Author Contributions

All authors equal contributed to the manuscript.

Funding

This research was funded by Faculty of Civil and Environmental Engineering and Architecture, Rzeszow University of Technology, 35-959 Rzeszow, Poland.

Conflicts of Interest

The authors declare no conflict of interest.

References

  1. Vreeburg, J.H.G.; Boxall, J.B. Discolouration in potable water distribution systems: A review. Water Res. 2007, 41, 519–529. [Google Scholar] [CrossRef] [PubMed]
  2. Srinivasan, S.; Harrington, G.W. Biostability analysis for drinking water distribution systems. Water Res. 2007, 41, 2127–2138. [Google Scholar] [CrossRef] [PubMed]
  3. Hallam, N.; West, J.; Forster, C.; Simms, J. The potential for biofilm growth in water distribution systems. Water Res. 2001, 35, 4063–4071. [Google Scholar] [CrossRef]
  4. Manuel, C.M.; Nunes, O.C.; Melo, L.F. Dynamics of drinking water biofilm in flow/non-flow conditions. Water Res. 2007, 41, 551–562. [Google Scholar] [CrossRef] [PubMed] [Green Version]
  5. Volk, C.J.; LeChevallier, M.W. Assessing biodegradable organic matter. Am. Water Works Assoc. 2000, 92, 64–76. [Google Scholar] [CrossRef]
  6. Chu, C.; Lu, C.; Lee, C. Effects of inorganic nutrients on the regrowth of heterotrophic bacteria in drinking water distribution systems. J. Environ. Manag. 2005, 74, 255–263. [Google Scholar] [CrossRef] [PubMed]
  7. Liu, X.; Wang, J.; Liu, T.; Kong, W.; He, X.; Jin, Y.; Zhang, B. Effects of assimilable organic carbon and free chlorine on bacterial growth in drinking water. PLoS ONE 2015, 10. [Google Scholar] [CrossRef] [PubMed]
  8. Escobar, I.C.; Randall, A.A. Assimilable organic carbon (AOC) and biodegradable dissolved organic carbon (BDOC). Water Res. 2001, 35, 4444–4454. [Google Scholar] [CrossRef]
  9. Van Der Kooij, D. Biological stability: A multidimensional quality aspect of treated water. Water Air. Soil Pollut. 2000, 123, 25–34. [Google Scholar] [CrossRef]
  10. Simpson, D.R. Biofilm processes in biologically active carbon water purification. Water Res. 2008, 42, 2839–2848. [Google Scholar] [CrossRef] [PubMed]
  11. Kaleta, J.; Kida, M.; Koszelnik, P.; Papciak, D.; Puszkarewicz, A.; Tchórzewska-Cieślak, B. The use of activated carbons for removing organic matter from groundwater. Arch. Environ. Prot. 2017, 43, 32–41. [Google Scholar] [CrossRef] [Green Version]
  12. Rattier, M.; Reungoat, J.; Gernjak, W.; Keller, J. Organic Micropollutant Removal by Biological Activated Carbon Filtration: A Review; Urban Water Security Research Alliance-University of Queensland: Brisbane, QLD, Australia, 2012. [Google Scholar]
  13. Korshin, G.V.; Wu, W.W.; Benjamin, M.M.; Hemingway, O. Correlations between differential absorbance and the formation of individual DBPs. Water Res. 2002, 36, 3273–3282. [Google Scholar] [CrossRef]
  14. Tchórzewska-Cieślak, B.; Papciak, D.; Pietrucha-Urbanik, K.; Pietrzyk, A. Safety analysis of tap water biostability. Archit. Civ. Eng. Environ. 2018, 11, 149–154. [Google Scholar] [CrossRef]
  15. Liu, W.; Wu, H.; Wang, Z.; Ong, S.; Hu, J.; Ng, W. Investigation of assimilable organic carbon (AOC) and bacterial regrowth in drinking water distribution system. Water Res. 2002, 36, 891–898. [Google Scholar] [CrossRef]
  16. Camper, A.K.; LeChevallier, M.W.; Broadaway, S.C.; McFeters, G.A. Bacteria associated with granular activated carbon particles in drinking water. Appl Environ. Microbiol. 1986, 52, 434–438. [Google Scholar]
  17. Wang, Q.; You, W.; Li, X.; Yang, Y.; Liu, L. Seasonal changes in the invertebrate community of granular activated carbon filters and control technologies. Water Res. 2014, 51, 216–227. [Google Scholar] [CrossRef] [PubMed]
  18. Pietrzyk, A.; Papciak, D. Removal of organic compounds from natural underground water in sorption and sono-sorption processes on selected activated carbons. E3S Web Conf. 2017, 17. [Google Scholar] [CrossRef]
  19. Papciak, D.; Kaleta, J.; Puszkarewicz, A.; Tchórzewska-Cieślak, B. The use of biofiltration process to remove organic matter from grounwater. J. Ecol. Eng. 2016, 17, 119–124. [Google Scholar] [CrossRef]
  20. Wolborska, A.; Zarzycki, R.; Cyran, J.; Grabowska, H.; Wybór, M. Evaluation of the biological activity of carbon filters in surface water treatment on the example of a water supply “Sulejów-Łódź”. Ochr. Śr. 2003, 25, 27–32. (In Polish) [Google Scholar]
  21. Perchuć, M.; Grabińska-Łoniewska, A. Technology Research the Effect of the Type of Coal Used in the BAF to Remove Humic Acids from Drinking Water; Czestochowa University of Technology: Częstochowa, Poland, 1998; pp. 144–153. (In Polish) [Google Scholar]
  22. Rice, E.W.; Baird, R.B.; Eaton, A.D. Standard Methods for the Examination of Water and Wastewater, 23rd ed.; American Public Health Association, American Water Works Association, Water Environment Federation: Washington, DC, USA, 2017. [Google Scholar]
  23. World Health Organization. Guidelines for Drinking-Water Quality, 4th ed.; World Health Organization: Geneva, Switzerland, 2011. [Google Scholar]
  24. Council Directive 98/83/EC of 3 November 1998 on the Quality of Water Intended for Human Consumption. 1998. EUR-Lex Web site. Available online: https://eur-lex.europa.eu/legal-content/EN/TXT/?uri=CELEX%3A31998L0083 (accessed on 29 November 2018).
  25. Wolska, M. Removal of Biogenic Substances in the Technology of Water Purification Intended for Human Consumption; Oficyna Wydawnicza Politechniki Wrocławskiej: Wrocław, Poland, 2015. (In Polish) [Google Scholar]
  26. Hijnen, W.; Schurer, R.; Martijn, B.; Bahlman, J.A.; Hoogenboezem, W.; van der Wielen, P. Removal of Easily and more Complex Biodegradable NOM by Full-Scale BAC Filters to Produce Biological Stable Drinking Water. In Progressing in Slow Sand and Alternative Biofiltration Processes—Further Developments and Applications; Nakamoto, N., Graham, N., Collins, M.R., Eds.; IWA Publishing: London, UK, 2014; pp. 1–8. [Google Scholar]
  27. Urbanowska, A.; Kabsch-Korbutowicz, M. Characteristics of natural organic matter removed from water along with its treatment. Environ. Prot. Eng. 2016, 42, 183–195. [Google Scholar] [CrossRef]
  28. Seredyńska-Sobecka, B.; Tomaszewska, M.; Janus, M.; Morawski, A.W. Biological activation of carbon filters. Water Res. 2006, 40, 355–363. [Google Scholar] [CrossRef] [PubMed]
  29. Korotta-Gamage, S.M.; Sathasivan, A. A review: Potential and challenges of biologically activated carbon to remove natural organic matter in drinking water purification process. Chemosphere 2017, 167, 120–138. [Google Scholar] [CrossRef] [PubMed]
  30. Pietrzyk, A.; Papciak, D. The effectiveness of organic matter removal in unit processes of the technological groundwater treatment system. E3S Web Conf. 2018, 44. [Google Scholar] [CrossRef]
  31. Lohwacharin, J.; Yang, Y.; Watanabe, N.; Phetrak, A.; Sakai, H.; Murakami, M.; Oguma, K.; Takizawa, S. Characterization of DOM Removal by Full-Scale Biological Activated Carbon (BAC) Filters Having Different Ages. In Proceedings of the IWA Specialty Conference on Natural Organic Matter, Costa Mesa, CA, USA, 27–29 July 2011; pp. 1–15. [Google Scholar]
  32. Rigobello, E.S.; Dantas, A.D.B.; Di Bernardo, L.; Vieira, E.M. Removal of diclofenac by conventional drinking water treatment processes and granular activated carbon filtration. Chemosphere 2013, 92, 184–191. [Google Scholar] [CrossRef] [PubMed]
  33. Liao, X.; Chen, C.; Chang, C.-H.; Wang, Z.; Zhang, X.; Xie, S. Heterogeneity of microbial community structures inside the up-flow biological activated carbon (BAC) filters for the treatment of drinking water. Biotechnol. Bioprocess Eng. 2012, 17, 881–886. [Google Scholar] [CrossRef]
  34. Moll, D.M.; Summers, R.S.; Fonseca, A.C.; Matheis, W. Impact of temperature on drinking water biofilter performance and microbial community structure. Environ. Sci. Technol. 1999, 33, 2377–2382. [Google Scholar] [CrossRef]
  35. Emelko, M.B.; Huck, P.M.; Coffey, B.M.; Smith, E.F. Effects of media, backwash, and temperature on full-scale biological filtration. J. Am. Water Works Assoc. 2006, 98, 61–73. [Google Scholar] [CrossRef]
  36. Selbes, M.; Amburgey, J.; Peeler, C.; Alansari, A.; Karanfil, T. Evaluation of seasonal performance of conventional and phosphate-amended biofilters. J. Am. Water Works Assoc. 2016, 108, 523–532. [Google Scholar] [CrossRef]
  37. Hallé, C.; Huck, P.M.; Peldszus, S. Emerging contaminant removal by biofiltration: Temperature, concentration, and EBCT impacts. J. Am. Water Works Assoc. 2015, 107, 364–379. [Google Scholar] [CrossRef]
  38. Corre, C.; Couriol, C.; Amrane, A.; Dumont, E.; Andrès, Y.; Le Cloirec, P. Efficiency of biological activator formulated material (BAFM) for volatile organic compounds removal—preliminary batch culture tests with activated sludge. Environ. Technol. 2012, 33, 1671–1676. [Google Scholar] [CrossRef] [PubMed]
  39. Lauderdale, C.; Chadik, P.; Kirisits, M.J.; Brown, J. Engineered biofiltration: Enhanced biofilter performance through nutrient and peroxide addition. J. Am. Water Works Assoc. 2012, 104, 298–309. [Google Scholar] [CrossRef]
  40. Dhawan, S.; Basu, O.D.; Banihashemi, B. Influence of nutrient supplementation on DOC removal in drinking water biofilters. Water Sci. Technol. Water Supply 2017, 17, 422–432. [Google Scholar] [CrossRef]
  41. Lehtola, M.J.; Miettinen, I.T.; Lampola, T.; Hirvonen, A.; Vartiainen, T.; Martikainen, P.J. Pipeline materials modify the effectiveness of disinfectants in drinking water distribution systems. Water Res. 2005, 39, 1962–1971. [Google Scholar] [CrossRef] [PubMed]
  42. Lehtola, M.J.; Miettinen, I.T.; Keinänen, M.M.; Kekki, T.K.; Laine, O.; Hirvonen, A.; Vartiainen, T.; Martikainen, P.J. Microbiology, chemistry and biofilm development in a pilot drinking water distribution system with copper and plastic pipes. Water Res. 2004, 38, 3769–3779. [Google Scholar] [CrossRef] [PubMed]
  43. Lehtola, M. Microbially available organic carbon, phosphorus, and microbial growth in ozonated drinking water. Water Res. 2001, 35, 1635–1640. [Google Scholar] [CrossRef]
  44. Rosenberg, H. Phosphate Transport in Prokaryotes. In Ion Transport in Prokaryotes; Rosen, B.P., Ed.; Academic Press: Cambridge, MA, USA, 1987; pp. 205–248. [Google Scholar]
  45. Ko, Y.-S.; Lee, Y.-J.; Nam, S. Evaluation of a pilot scale dual media biological activated carbon process for drinking water. Korean J. Chem. Eng. 2007, 24, 253–260. [Google Scholar] [CrossRef]
  46. Urfer, D.; Huck, P.M. Measurement of biomass activity in drinking water biofilters using a respirometric method. Water Res. 2001, 35, 1469–1477. [Google Scholar] [CrossRef]
  47. Pharand, L.; Van Dyke, M.I.; Anderson, W.B.; Huck, P.M. Assessment of biomass in drinking water biofilters by adenosine triphosphate. J. Am. Water Works Assoc. 2014, 106, 433–444. [Google Scholar] [CrossRef]
  48. Niemi, R.M.; Heiskanen, I.; Heine, R.; Rapala, J. Previously uncultured β-proteobacteria dominate in biologically active granular activated carbon (BAC) filters. Water Res. 2009, 43, 5075–5086. [Google Scholar] [CrossRef] [PubMed]
  49. Persson, F.; Heinicke, G.; Uhl, W.; Hedberg, T.; Hermansson, M. Performance of direct biofiltration of surface water for reduction of biodegradable oganic matter and biofilm formation potential. Environ. Technol. 2006, 27, 1037–1045. [Google Scholar] [CrossRef] [PubMed]
  50. Velten, S.; Boller, M.; Köster, O.; Helbing, J.; Weilenmann, H.-U.; Hammes, F. Development of biomass in a drinking water granular active carbon (GAC) filter. Water Res. 2011, 45, 6347–6354. [Google Scholar] [CrossRef] [PubMed]
  51. Xiang, H.; Lu, X.; Yin, L.; Yang, F.; Zhu, G.; Liu, W. Microbial community characterization, activity analysis and purifying efficiency in a biofilter process. J. Environ. Sci. 2013, 25, 677–687. [Google Scholar] [CrossRef]
  52. Terry, L.G.; Summers, R.S. Biodegradable organic matter and rapid-rate biofilter performance: A review. Water Res. 2018, 128, 234–245. [Google Scholar] [CrossRef] [PubMed]
  53. Boon, N.; Pycke, B.F.G.; Marzorati, M.; Hammes, F. Nutrient gradients in a granular activated carbon biofilter drives bacterial community organization and dynamics. Water Res. 2011, 45, 6355–6361. [Google Scholar] [CrossRef] [PubMed]
  54. Liu, X.; Huck, P.M.; Slawson, R.M. Factors Affecting Drinking Water Biofiltration. J. Am. Water Works Assoc. 2001, 93, 90–101. [Google Scholar] [CrossRef]
  55. Zamorska, J. Biological stability of water after the biofiltration process. J. Ecol. Eng. 2018, 19, 234–239. [Google Scholar] [CrossRef]
  56. Kolaski, P.; Wysocka, A.; Lasocka-Gomuła, I.; Pruss, A.; Michałkiewicz, M.; Cybulski, Z. Removal of organic matter from water during rapid filtration through a biologically active carbon filter beds—A full scale technological investigation. Technol. Wody 2018, 5, 8–15. (In Polish) [Google Scholar]
Figure 1. Technological flowchart for the Water Treatment Plant.
Water 10 01764 g001
Figure 2. Average monthly values of total organic carbon and UV absorbance in water before and after the biofiltration process.
Water 10 01764 g002
Figure 3. Average monthly values of permanganate value and dissolved oxygen in water before and after the biofiltration process.
Water 10 01764 g003
Figure 4. Average monthly changes in S indicator after biofiltration process.
Water 10 01764 g004
Figure 5. Edge of granular activated carbon grain covered with biological membrane (photos from a light microscope).
Water 10 01764 g005
Figure 6. Biological membrane formed on granular activated carbon ((A): before biosorption, (B): after biosorption))—photos from a scanning microscope.
Water 10 01764 g006
Figure 7. Total number of mesophilic and psychrophilic bacteria in water before and after the biofiltration process.
Water 10 01764 g007
Figure 8. Statistical analysis of microbiological results obtained for water before and after biofiltration process on granular activated carbons.
Water 10 01764 g008
Figure 9. Statistical analysis of selected physicochemical results obtained for water before and after the biofiltration process on granular activated carbon deposits. Designations: (1) TOC (g C/m3); (2) UV absorbance (UV1m254); (3) Permanganate value (g O2/m3); (4) Dissolved oxygen (g O2/m3); (5) Total inorganic nitrogen (g Nnorg/m3); (6) Total phosphorus (g PO43−/m3); (N = 44).
Water 10 01764 g009
Figure 10. Average monthly values of total inorganic nitrogen and total phosphorus in water before and after the biofiltration process.
Water 10 01764 g010
Table 1. Physicochemical quality of underground water (data from WTP).
IndicatorUnitRange of Changes
Total Organic carbon (TOC)g O2/m311.0–14.5
Permanganate valueg O2/m311.0–18.1
TurbidityNTU8.0–14.0
Colourg Pt/m340–100
Ammonia nitrogeng NH4⁺/m31.20–1.98
pH-6.4–7.0
Temperature°C10.8–12.1
Hardnessg CaCO3/m3200–470
Sulfateg SO42−/m360–240
ConductivitymS/cm430–1016
Alkalinityval/m32.5–4.5
Table 2. Parameters of the biofilter model [18].
Operating ParametersValueProperties of the Filter MaterialValue
Height of the carbon bed, m1.12Granulation, mm1–4
Diameter, m0.055Specific surface, m2/g950–1050
Filtration velocity, m/h1.5–2.0The iodine value, mg/g998
Contact time, h0.5pH aqueous extract11
Table 3. Summary of analytical methods for laboratory experiments [22].
ParametersAnalytical Method/Standard
Total organic carbon (TOC)TOC analyzer Sievers 5310 C (SUEZ, Boulder, CO, USA)
Permanganate valueThe permanganate method
UV absorbanceSpectrophotometric method
Inorganic nitrogen content
(N-NH4+ + N-NO2 + N-NO3)
N-NH4+: direct nessleryization method using Merck spectrophotometer
N-NO2: colorimetric method by Nitrite Test Merck 1.14408
N-NO3: spectrophotometric method with sodium salicylate
Inorganic phosphorus contentSpectrophotometric method with ammonium molybdate using Merck spectrophotometer
Dissolved oxygen (DO)Electrochemical method using a Hach-Lange oxygen probe
The total number of bacteria at 37 °C after 24 h (mesophilic bacteria)Traditional culture method using A Agar from BTL Ltd.
The total number of bacteria at 22 °C after 72 h (psychrophilic bacteria)
Escherichia coli bacteriaMembrane filtration procedure using Endo agar

