Three-Dimensional Glacier Changes in Geladandong Peak Region in the Central Tibetan Plateau


1
College of Urban and Environmental Sciences, Yancheng Teachers University, Yancheng 224002, China
2
State Key Laboratory of Cryospheric Sciences (SKLCS), Northwest Institute of Eco-Environment and Resources, Chinese Academy of Sciences, Lanzhou 730000, China
*
Author to whom correspondence should be addressed.
Water 2018, 10(12), 1749; https://doi.org/10.3390/w10121749
Submission received: 15 October 2018
/
Revised: 23 November 2018
/
Accepted: 24 November 2018
/
Published: 28 November 2018
(This article belongs to the Special Issue Impacts of Climate Change on Water Resources in Glacierized Regions)
Abstract
:In this study, contour lines from the topographic maps at a 1:100,000 scale (mapped in 1968), Landsat MSS/TM/OLI images, ASTER images and SPOT 6-7 stereo image pairs were used to study changes in glacier length, area and surface elevation. We summarized the results using the following three conclusions: (1) During the period from 1973 to 2013, glaciers retreated by 412 ± 32 m at a mean retraction rate of 10.3 ± 0.8 m·year−1 and the relative retreat was 5.6 ± 0.4%. The glacier area shrank by 7.5 ± 3.4%, which was larger than the glacier length. In the periods of 1968–2000, 2000–2005 and 2000–2013, the glacier surface elevation change rates were −7.7 ± 1.4 m (−0.24 ± 0.04 m·year−1), −1.9 ± 1.5 m (−0.38 ± 0.25 m·year−1) and −5.0 ± 1.4 m (−0.38 ± 0.11 m·year−1), respectively. The changes in the glacier area and thickness exhibited similar trends, both showing a significant increasing reduction after 2000. (2) Eleven glaciers were identified as surging glaciers. Changes of the mass balance in surging glaciers were stronger than in non-surging glaciers between 1968 and 2013. Changes of area in surging glaciers were weaker than in non-surging glaciers. (3) Increasing temperature was the major cause of glacier thickness reduction and area shrinkage. The increase in precipitation, to a certain extent, inhibited glacial ablation but it did not change the status of the shrinkage in the glacial area and the reduction in the glacier thickness.
1. Introduction
The Intergovernmental Panel on Climate Change (IPCC) summarizes the changes in glacial area and mass balance in 19 regions of the world. It was demonstrated that the change rate of the global glacial area was −0.01%·year−1 to −1.8%·year−1 and the mass loss was −50 ± 7 Gt·year−1 to 0 ± 1 Gt·year−1 from 1940–2010. The glacial area in Canada, the western United States, central Europe and low-latitude areas shrunk the fastest, while Alaska, Greenland and areas near the Arctic Circle north of Canada experienced from the fastest mass loss. The variation of the glacial area is not synchronized with that of ice volume [1]. Results from China’s Qilian Mountains indicate greater thinning of parts of glaciers with less area shrinkage, which raises questions about the traditional method that uses changes in glacial area to predict changes in ice reserves [2]. The study showed that in the Tuanjiefeng Peak region of the Qilian Mountains, the ice volume that was calculated using the traditional statistical method was underestimated by 17% [2]. Therefore, a re-evaluation of the methods used to calculate the ice reserves is necessary, which requires exploration of the three-dimensional changes of glacier length, area, surface elevation and the volume as well as the correlations between these characteristics.
There were many researches about glacier changes of area in the western China [1]. However, a few studies have been conducted on China’s ice reserves and surface elevation changes, mainly in the Altai Mountains, Bangong Lake of the Tibetan Plateau, west Kunlun Mountains, Tuanjiefeng Peak of the Qilian Mountains, Gongga Mountains, Mt. Everest and Tuomuer Peak of the Tien Shan Mountains [2,3,4,5,6,7,8]. A digital elevation model (DEM) difference method using a topographic map DEM and optical remote-sensing stereo image pairs was applied to study the regional surface elevation changes of glaciers [2,6,7,8]. In addition, the Global Positioning System (GPS) was used for the field observation of the surface elevation change in the Shuiguan River of the Qilian Mountains, Yanglong River, Laohugou Glacier No. 12 and the Kangwure Glacier of the Himalayas [9,10,11,12]. The studied glaciated area only accounts for 1% of the total glacial area in China. Therefore, little information about simultaneous changes in the glacier length, area and surface elevation was known.
Research has shown that the headwards erosion in the source of the river Yangtze River increased, caused by the runoff increasing over the past few decades [13]. Eighteen percent of the increasing runoff was contributed by the increasing melt of glaciers in the source of the river Yangtze River from 1986 to 2009 [14]. However, some glaciers experienced the expansion in area in Geladandong Peak, the main source of the Yangtze River from 1964 to 2010 [15]. Were the changes in length and surface elevation the same as the changes in area? This makes the necessary studies the three-dimensional changes in glacier length, area surface elevation and volume, as well as the relationships between these characteristics.
Given the above reasons, multi-temporal Landsat Multispectral Scanner (MSS)/Thematic Mapper (TM)/Operational Land Imager (OLI) data, a topographic map digital elevation model (DEM, from 1968), the Advanced Spaceborne Thermal Emission and Reflection Radiometer (ASTER) images (from 2005) and the Satellite Pour l’Observation de la Terre (SPOT) 6-7 stereo image pairs (from 2013/2014) were used to analyze changes in glacier length, area and surface elevation, as well as the relationships between these characteristics. Moreover, the cause underlying the changes was analyzed in the context of meteorological data.
Study Area
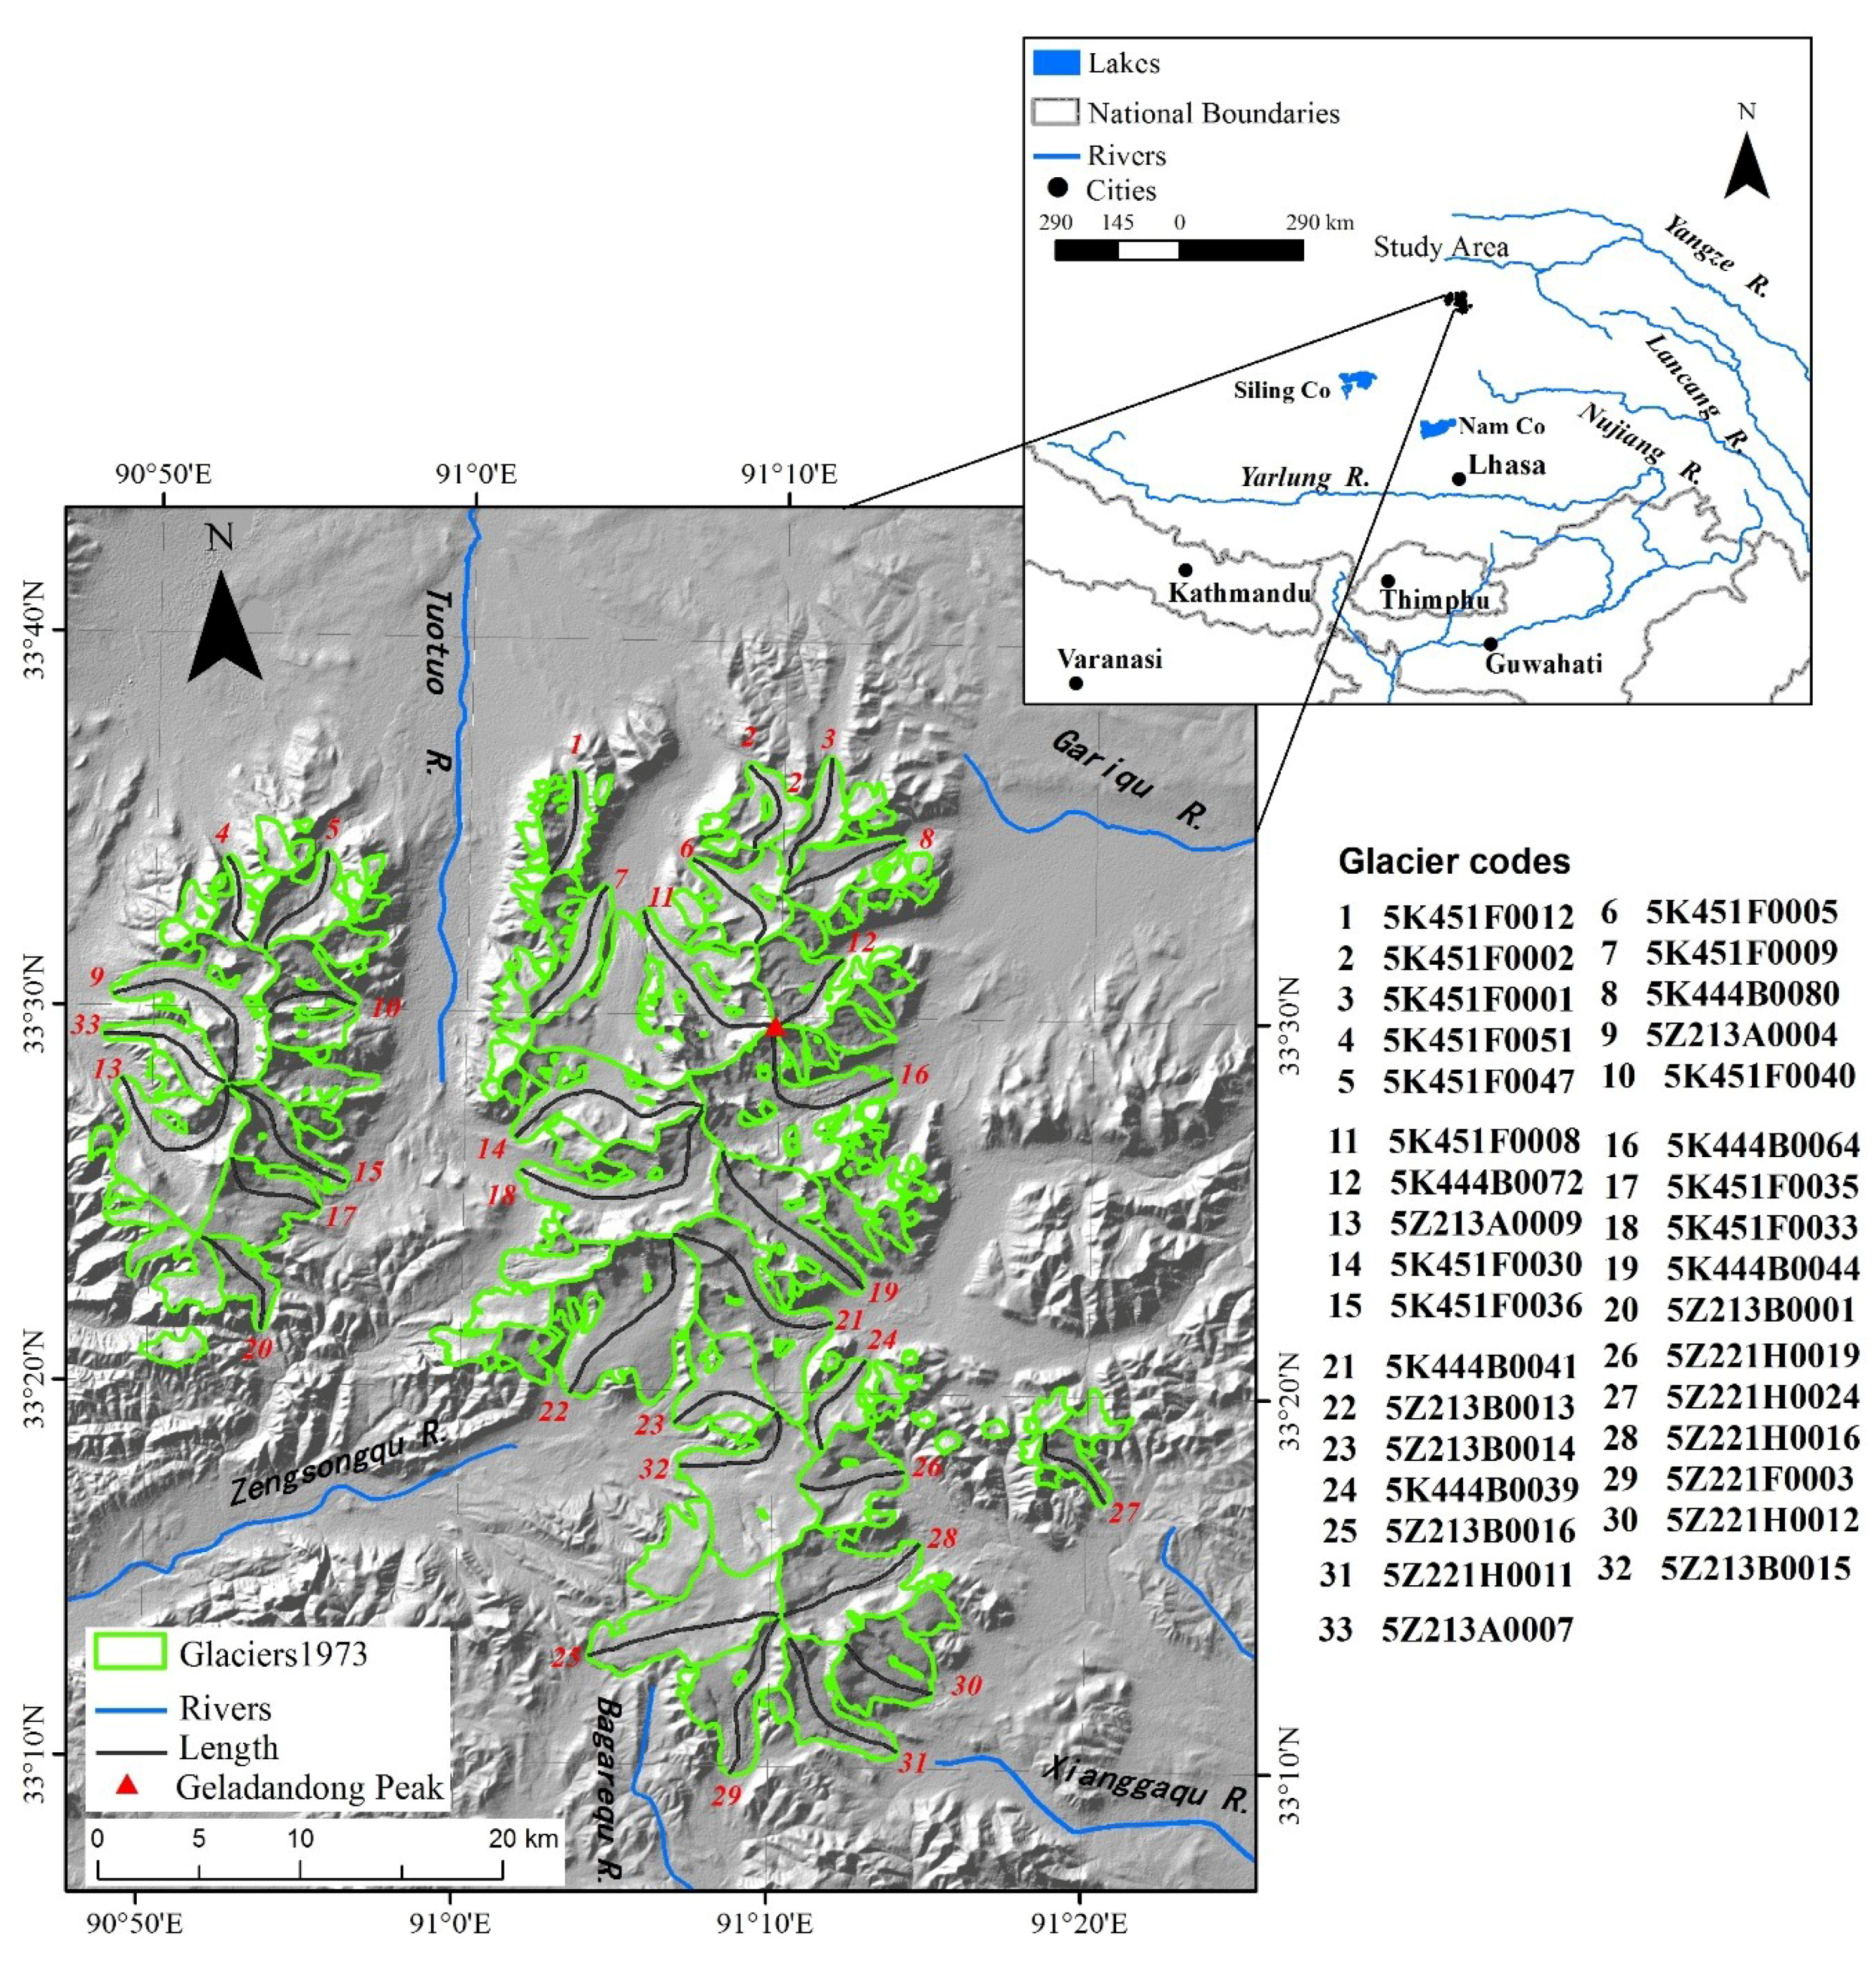
Geladandong Peak, the main peak of the Tanggula Mountains, is the highest mountain in the source region of Yangtze river, with an elevation of 6621 m. The annual mean temperature is −1.9 °C and the annual mean precipitation is approximately 370 mm, suggesting a typically dry and cold climate. Precipitation occurs mainly in summer (accounting for 64% of annual precipitation). Temperatures rise above 0 °C only in summer. Hence, the glacier in this study area is summer ablation and accumulation glacier type [16]. The snow line elevation of this region is 5000–5800 m. Of the several large valley glaciers that are fed, five have an area that is greater than 30 km2 [Qiesumeiqu (5K451F0008), Gangjiaquba Glacier (5K444B0064), south branch glacier of Jianggudiru (5K451F0033), the north branch glacier of Jianggudiru (5K451F0030) and 5K444B0041]. Studies show that the glacial area change of the main peak of Geladandong Peak from 1964–2010 was 0.15%·year−1, which was less than that of the Qilian Mountains, the Tien shan Mountains and the Himalayan region [2,15,17,18]. Also, by analyzing the length of 14 glaciers in this region, it was found that nine had expanded, while some experienced rapid shrinkage status, indicating large differences in the changes of individual glaciers in this region [15].
2. Data and Methods
2.1. Data
2.1.1. Landsat
Eleven Landsat MSS/TM/OLI images (Table 1) obtained in 1973, 1988, 2000, 2006 and 2013 were used for glacier outline extraction. It should be noted that there was a small number of glaciers on the MSS images captured on 16 July 1973 and TM images from 21 August 2000, 6 August 2006 and 9 August 2013, were covered with clouds, so identification was supplemented by images obtained on 10 June 1973, 23 July 2001, 5 May 2007 and 24 May 2014. Although the TM images of 24 November 1988, were acquired in winter, glacier tongues were free from snow. In addition, the TM images of 11 and 20 February 2000 are not for glacier boundary extraction but for checking the distribution of seasonal snow. All these images are provided in Level 1T (orthorectified) by the United States Geological Survey (USGS, http://earthexplorer.usgs.gov/). Landsat MSS/TM/OLI images were resampled to 60 m/28.5 m/15 m resolution, respectively, with a projection of the Universal Transverse Mercator Projection (UTM) zone 46N. The accuracy of ground control points (GCPs) of the two Landsat MSS images were 30.8 m and 33.9 m, while the accuracy of TM/OLI images was approximately 4 m.
2.1.2. SRTM
The Shuttle Radar Topography Mission (SRTM) DEM mission started on 11 February 2000 and ended on 22 February 2000, which include C band and X band. The SRTM C band DEM is provided by the USGS and X band DEM is provided by Deutsches Zentrum für Luft-und Raumfahrt (DLR, https://download.geoservice.dlr.de/SRTM_XSAR/). The SRTM C band DEM includes SRTM 1 arc second and SRTM 3 arc second, with corresponding resolution accuracies of 30 m and 90 m, respectively. SRTM DEM has been widely used in the study of glacial surface elevation and ice volume change. Results showed that the RMSEs of SRTM 1 arc second in the north-eastern flank of the Tien Shan Mountains area was ±10 m compared with the elevation of differential GPS [19]. In addition, there is a 2.8 m difference between the data obtained using SRTM 3 arc second and the Geoscience Laser Altimeter System (GLAS) in the Tuanjiefeng Peak region of the Qilian Mountains [2].
In our study, the SRTM 1 arc second at C band DEMs were used for determining changes in the surface elevation and the ice volume of glaciers in the Geladandong Peak region, while SRTM at the X band was used for the penetration of SRTM at the C band correction because it covered only 1/20 of our study area. Two tiles of C band SRTM 1arc-second Global (SRTM1, n33_e90_1arcv3 and n33_e90_1arc_v3) and 6 tiles of X band SRTM (E0910000N330000, E0910000N331500, E0910000N334500, E0900000N330000, E0900000N331500, E0900000N334500) with void filled were used. It should be noted that all the void holes of the original SRTM were small, with the largest no more than 50 pixels and the void part will be excluded while comparing the other DEMs. The World Geodetic System 1984 (WGS84) coordinate and the 1996 Earth Gravitational Model (EGM96) (https://en.m.wikipedia.org/wiki/EGM96) reference were used for SRTM DEMs.
2.1.3. SPOT 6-7 and ASTER Stereo Image Pair
An ASTER image is one of the important data sources in the study of glacier surface elevation changes and it has been widely applied to China’s Altai Mountains region and the Bangong Lake region of the Tibetan Plateau [6,7]. To extract the DEM of the main Geladandong Peak, the ASTER image, obtained on 8 December 2005, was used. Because of a lot of cloud in the summer images, it was difficult to obtain high-quality ASTER images. Moreover, SPOT 6-7 stereo image pairs obtained on 6 October 2013 and 18 November 2014, were purchased, covering an area of 2000 km2. Seasonal snow was present to a small extent on both ASTER and SPOT images but the flow trajectories and crevasses on glaciers was clearly visible especially on the glacier tongues.
The SPOT 6-7 satellite was launched on 9 September 2012. The spatial resolutions are 1.5 m (panchromatic) and 6 m (multispectral). Three-line-array stereo imageries were included in the panchromatic band. The data format of SPOT 6-7 is DIMAP V2 and the RPC file is a rational function model and a general sensor model that was applied for image ortho-rectification.
2.1.4. Contour Lines of 1968
Contour lines from four topographic maps of 1968 based on aerial photography at a scale of 1:100,000 were provided by the National Geomatics Center of China. It should be noted that the coordinate systems used for these contour data were the Xi’an 1980 and Yellow Sea 1985 elevation systems, which were converted from the Beijing 1954 coordinate system by the National Geomatics Center of China. According to the industry standards of basic geographic information products regulated by the National Administration of Surveying, Mapping and Geoinformation, the precision should be 3–5 m in flat areas and 8–14 m in mountainous areas [20]. DEM data derived from topographic maps have been widely used in the studies of glacial surface elevation and ice reserve changes in western China, such as the Altai Mountains, the Bangong Lake Region of the Tibetan Plateau, the Qilian Mountains and Gongga Mountain [2,6,7,8].
2.1.5. GLAS and Reference Points
The Geoscience Laser Altimeter System (GLAS) is used on the Ice, Cloud, and land Elevation Satellite (ICESat) for monitoring land and water surface topography. The diameter of the spot projected by the laser pulse on the Earth surface is 70 m. The horizonal positioning precision is 20 cm and the elevation precision is 13.8 cm. GLAS data is often used in the study of glacial surface elevation changes, such as the west Kunlun Mountains region [3]. However, due to the lack of repeated observation data of the study area, it was only used to evaluate the accuracy of DEMs. GLAS data were obtained from the National Aeronautics and Space Administration (NASA) and they were divided into several types (https://icesat.gsfc.nasa.gov/icesat/). GLAS/ICEsat Level 2 Global Land Surface Altimetry (GLA14) products acquired on 18 March 2008, were used in this study.
Reference points were measured by the National Geomatics Center of China using GPS. There were 39 points in this study, of which six had both the WGS84 coordinate system and the Xi’an 1980 coordinate system, while others had only the WGS84 coordinate system. These points were mainly used for the evaluation of DEM accuracy, while the six points with both the WGS84 coordinate system and Xi’an 1980 coordinate system were used for coordinate system transformation.
2.2. Methods and Errors
2.2.1. Glacier Boundaries and Lengths Acquisition
There are several well-known methods for the delineation of debris-free glaciers based on Landsat TM/ETM data [21,22,23,24,25,26,27]. The band ratio threshold method has higher precision than other methods [24,27]. There were no debris-covered glaciers in the study area, so that the ratio threshold method was applied to the extraction of bare ice area based on TM and OLI images. Band TM3/TM5 ≥ 2.1 was used as the threshold to extract the bare-ice glacier boundary. This algorithm was implemented using the interactive data language (IDL). As this method can effectively extract glacier boundaries, it has been widely applied [24,25,26,27]. For Landsat MSS data, the glaciers on the 3, 2 and 1 band combination images were white. Visual interpretation and manually digitization were used. To ensure the precision of data, this method was conducted under the guidance of experienced glaciologists. At this point, five stages glacial boundaries were only the outlines, which needed to be split into individual glaciers by ridgelines. The ridgelines provided by China’s second glacier catalog program has been applied to the division of glaciers throughout western China [28,29]. In our study, the ridgeline and glacier polyline files were merged into a new polyline file using ArcGIS software (10.1.0, Environmental Systems Research Institute, Redlands, CA, USA). Then, topology was built to generate glacier polygons based on “clean” command. Thus, a single glacier with a topological structure was formed.
At present, there are two commonly used methods for the assessment of the uncertainty in glacier boundary extraction: (i) a method based on the resolution and the co-registration errors of remote sensing images [30]; and (ii) a method based on the buffer of a specific value [26,31]. A buffer with a width equal to half pixel was applied to expand the extracted glacier boundary using ArcGIS 10.1 software. Then, the original glacier boundary is compared with the glacier boundary of the buffer to obtain the uncertainty percentage of the glacial area. Here, the second method, which is more suitable for this study, was selected. Specifically, the half-pixel buffer calculation was performed on the glacier boundaries of 1973, 1988, 2000, 2006 and 2013. MSS in 1973 was 28.5 m and the others were 15 m. Compared with the original glacier boundary data, the glacier boundary accuracies of the Geladandong Peak region were 3.1%, 1.68%, 1.72%, 1.73% and 1.74% in 1973, 1988, 2000, 2006 and 2013, respectively.
Although there are automatic extraction methods for glacier length, the operation is complicated [32]. In our study, a manual digitization of the middle flowlines was applied for length generation. Here, the glacier length was the maximum length from the maximum elevation point to the terminal point. The elevation referenced as SRTM DEM. Thirty-three lengths of glaciers were digitized in our study, showing in the Figure 1. The accuracy of the changes in glacier lengths depended on the accuracy of the delineation of glacier termini. This was determined, above all, by the accuracy of image co-registration. The accuracy of the co-registration of all pairs of images was less than half pixel. Therefore, the accuracy of glacier length calculation was taken as a half of the pixel. This was 28.5 m for imagery obtained in 1973 and 15 m in all other years.
2.2.2. DEM Extraction
For the typical area of Geladandong Peak, four periods of DEM data were used for the comparative analysis on the changes in glacial surface elevation and ice volume. The topographic map DEM of 1968 (DEM1968), the SRTM DEM of February 2000 and the ASTER DEM of 8 December 2005 (DEM2005), as well as the SPOT DEM of 2013/2014 (DEM2013) were used.
DEM of 1968
DEM1968 with the Xi’an 1980 coordinate system and the Yellow Sea 1985 reference was different to the SRTM DEM with the WGS84 coordinate system, which could cause an error of more than 10% in the study of glacial surface elevation changes [2,33]. Therefore, it was necessary to transform the coordinate system of the topographic map DEM into the same coordinate system as SRTM. The whole transformation process consisted of two parts by using the seven-parameter transformation model, which includes the horizonal coordinate system from the Xi’an 1980 coordinate system (XI’AN80) to the WGS84 coordinate system and the transformation of the geodetic height of WGS84 to the normal height.
The XI’AN80 geodetic coordinate system was transformed to the XI’AN80 rectangular coordinate system, which was then transformed to WGS84 based on the seven-parameter model. This method has been applied to the study of glacial surface elevation change several times [2,8]. Three reference points were applied for the coordinate transformation based on the BursaWolf seven-parameter model. The formula is as follows:
where is the translation parameter in the X, Y and Z directions; is the parameter of three rotation angles and M is the scale parameter; is the coordinate based on Xi’an 1980 Datum and is the coordinate based on WGS 1984 Datum.
DEM2005 and DEM2013 Generation
DEM2005 was generated from the ASTER image of 8 December 2005, using the Environment for Visualizing Images (ENVI) software (5.0 SP3, the Exelis Visual Information Solutions, Boulder, CO, USA) based on stereo image pairs of the visible and near infrared (VNIR) 3N and 3B bands. The reference image used to extract the horizonal coordinates of the ground control points (GCPs) was the panchromatic band of the Landsat OLI image of 15 m resolution taken on 9 August 2013 and height for the GCPs was from SRTM which was the reference DEM. Six GCP points were chosen and 45 tie points were extracted. The resolution of DEM2005 was resampled to 20 m.
DEM2013 was generated from stereo image pairs of SPOT 6-7 images from 2013/2014 based on stereo image pairs of panchromatic bands A and B. The 3N band of the ASTER image after ortho-rectification, taken on 8 December 2005, was used as the reference image for choosing the two-dimensional horizonal coordinates of GCPs. The height for the GCPs was also from SRTM DEM. Six GCPs were chosen and more than 100 tie points were adopted from each image. The resolution of DEM2013 was resampled 20 m, which was the same as the DEM2005.
A thin layer of seasonal snow, present on both SPOT and ASTER images, reduced contrast and affected DEM extraction resulting in data gaps in the areas where contrasts were weak. In addition, a small area of the image was covered by thin clouds, which will also affect DEM extraction. The area under the cloud may have been overestimated, whereas the area in the shadow of clouds might be underestimated. Therefore, post-processing of the extracted DEM was performed to correct the artefacts in the extracted elevations in the areas affected by the snow cover and clouds.
DEM Error Assessment
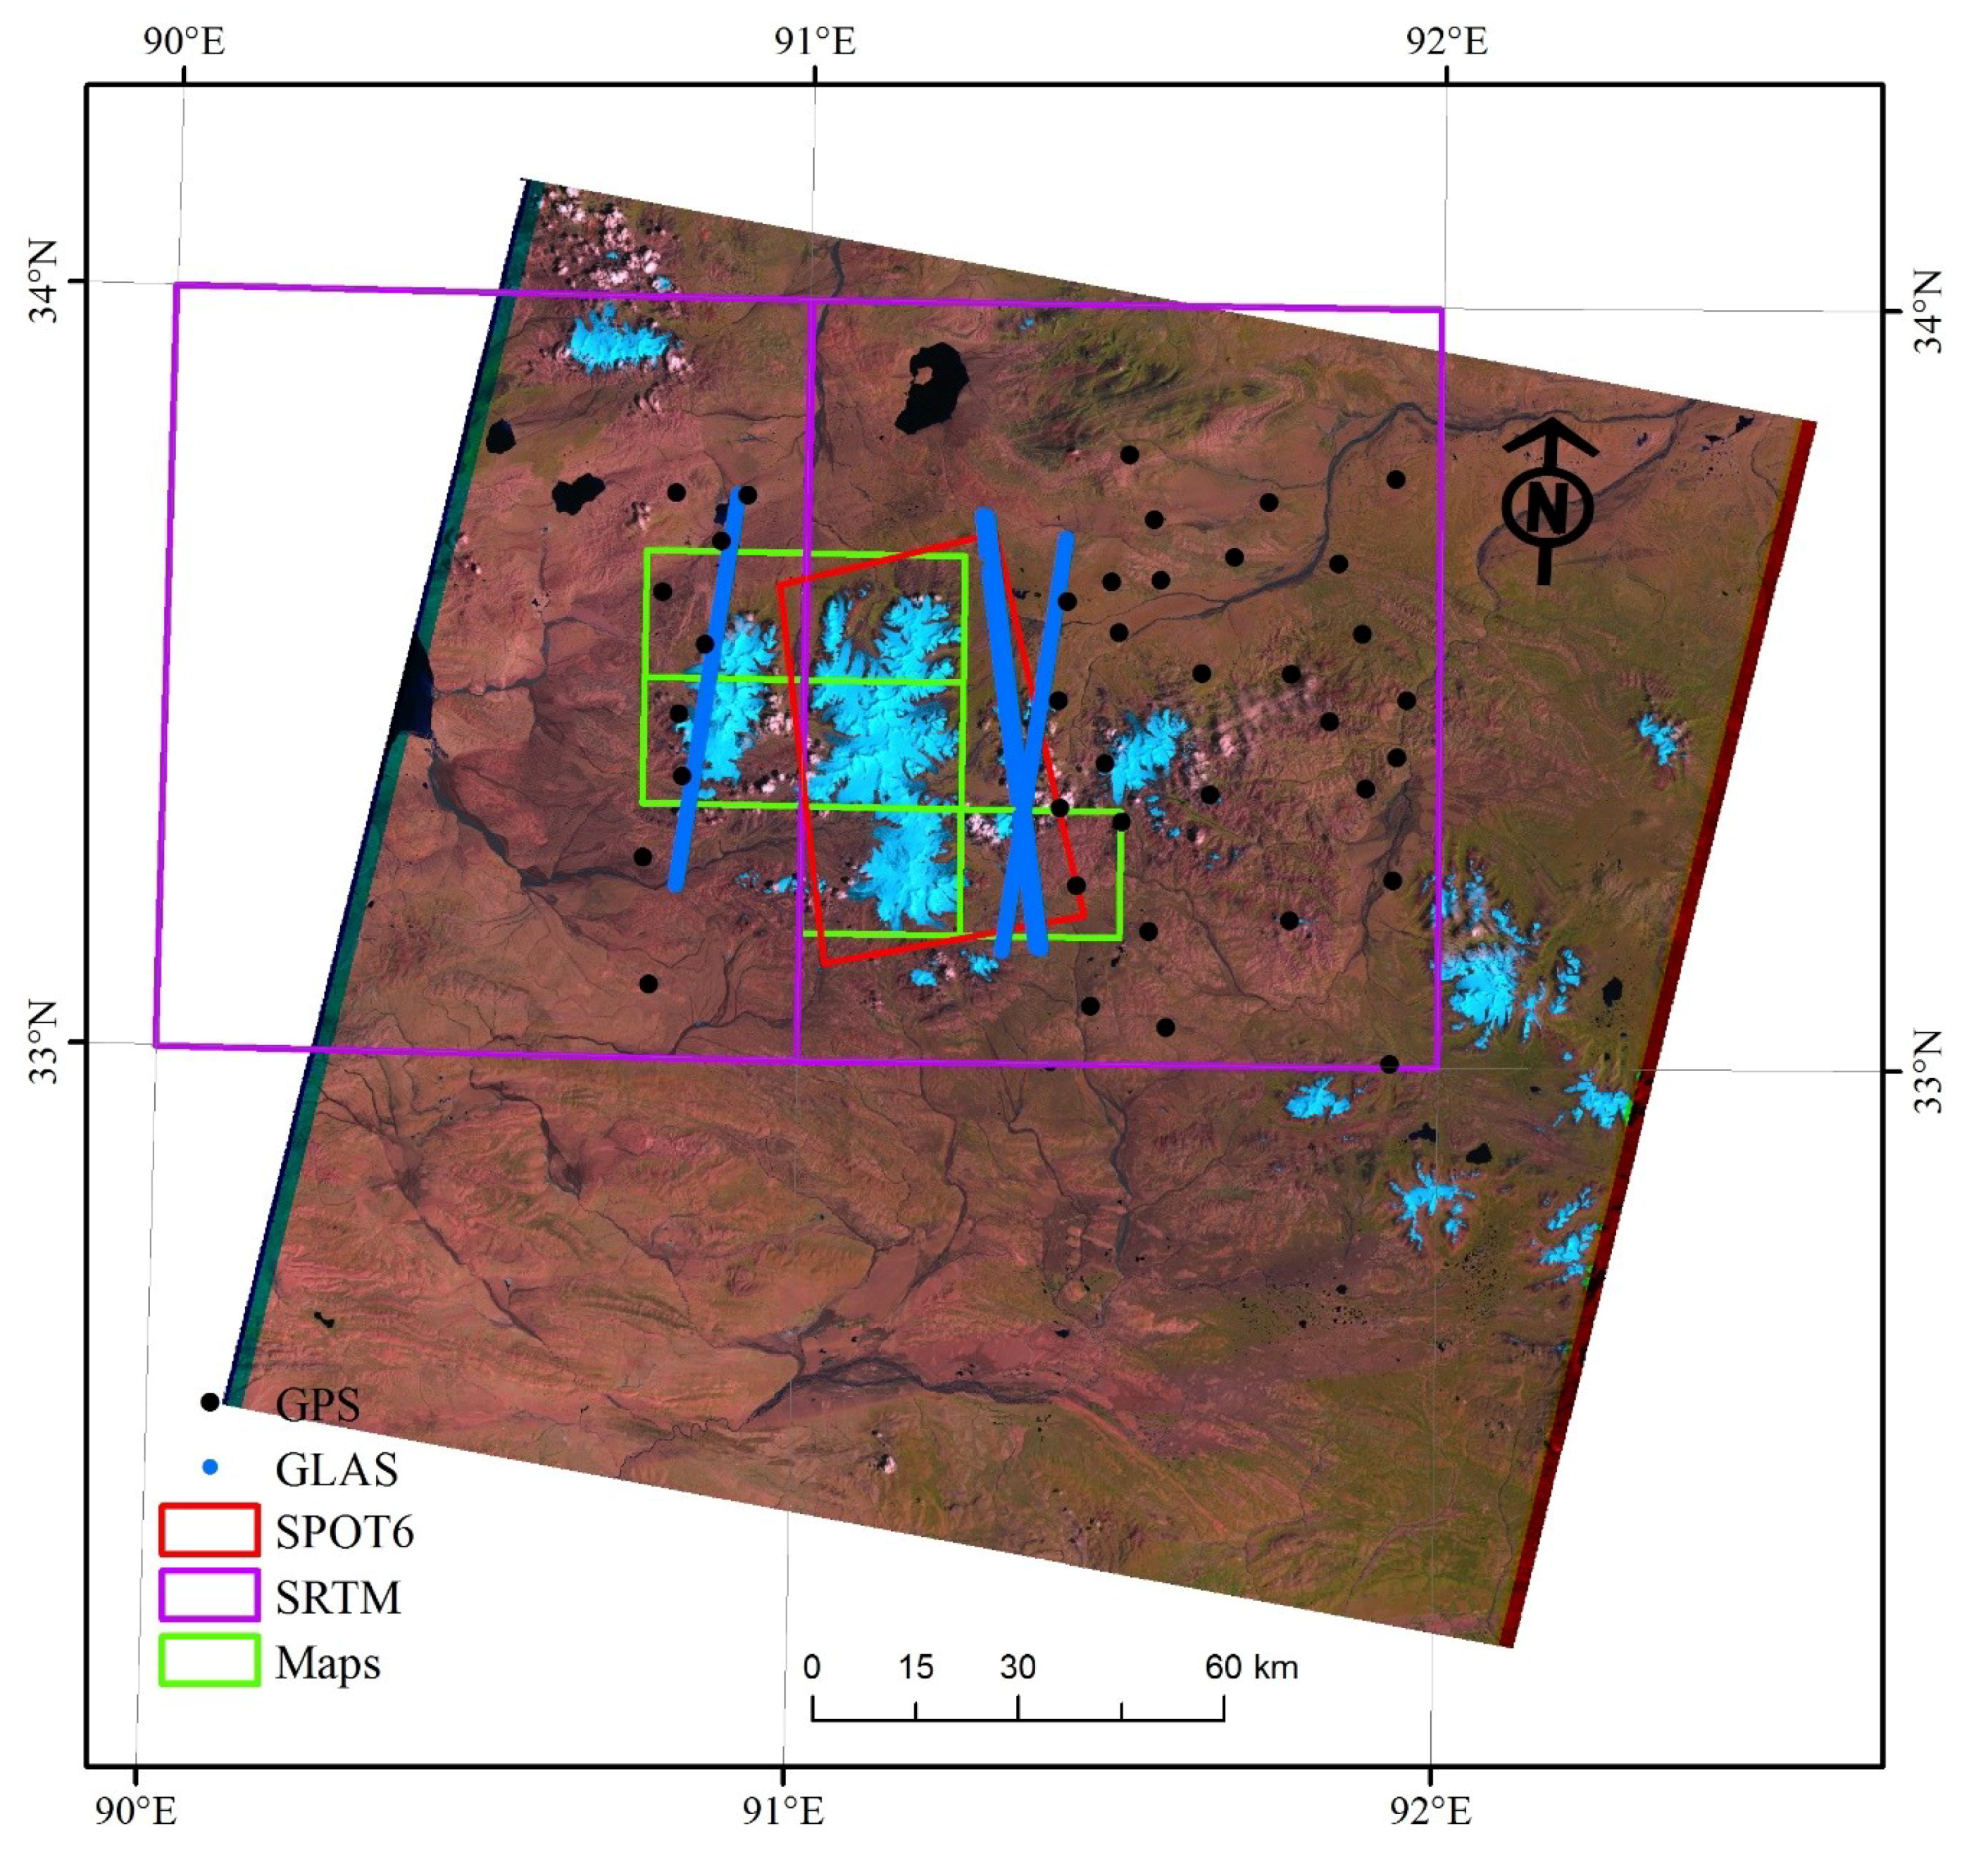
DEM error comes from the source images and the interpolation models. However, it is difficult to quantify the error propagation. In our study, the method of DEMs comparing with the check points was used for error assessment. Thirty-nine GPS points and 2109 GLAS laser points of the WGS84 coordinate system in off-glacier area were employed to evaluate the errors of DEM1968, DEM2005, SRTM and DEM2013 (Figure 2). The distribution of all check points is shown in Figure 2. However, due to the great differences in the coverage range between the DEMs, the GPS points and GLAS points covered by each DEM were not the same. Since only one point in the SPOT data intersected with the GPS points on the boundary, GPS points were not taken to evaluate the error of the SPOT DEM. Instead, GLAS points were used for the assessment of DEM2013.
By comparing the DEM1968, SRTM and DEM2005 with the GPS measuring points, it was found that the difference was −24 ± 10.8 m (mean ± RMSE), −4 ± 4.5 m and −4 ± 6.8 m, respectively (Table 2). As can be seen, the accuracy of the SRTM data was the highest, followed by the DEM2005 and DEM1968. By comparing the value of the DEM1968, SRTM, DEM2005 and DEM2013 with GLAS points, it was found that the differences were 8.7 ± 15.4 m, 0.1 ± 4.7 m, −9.9 ± 18.4 m and 5.0 ± 13.2 m, respectively. It is clear that the accuracy of SRTM and DEM2013 was the higher than that of DEM1968 and DEM2005.
Here, the systematic bias of DEM1968, DEM2005, SRTM and DEM2013 in bare land was significant as comparing with GPS points, which has been mentioned several times in previous studies [34,35,36,37]. It is mainly caused by the co-registration error of DEMs and the resolution [35,37,38]. This bias shows some relations with altitude, slope, aspect, curvature and other terrain factors [34,38,39]. These DEMs should be adjusted to GPS elevations before elevation changes study. Unfortunately, no enough GPS points for the adjustment were covered by DEM1968, DEM2005 and DEM2013. Thus, the adjustment was implemented by two steps. First, elevation of SRTM was adjusted to the elevation of GPS points. Second, DEM1968, DEM2005 and DEM2013 were adjusted to the adjusted SRTM.
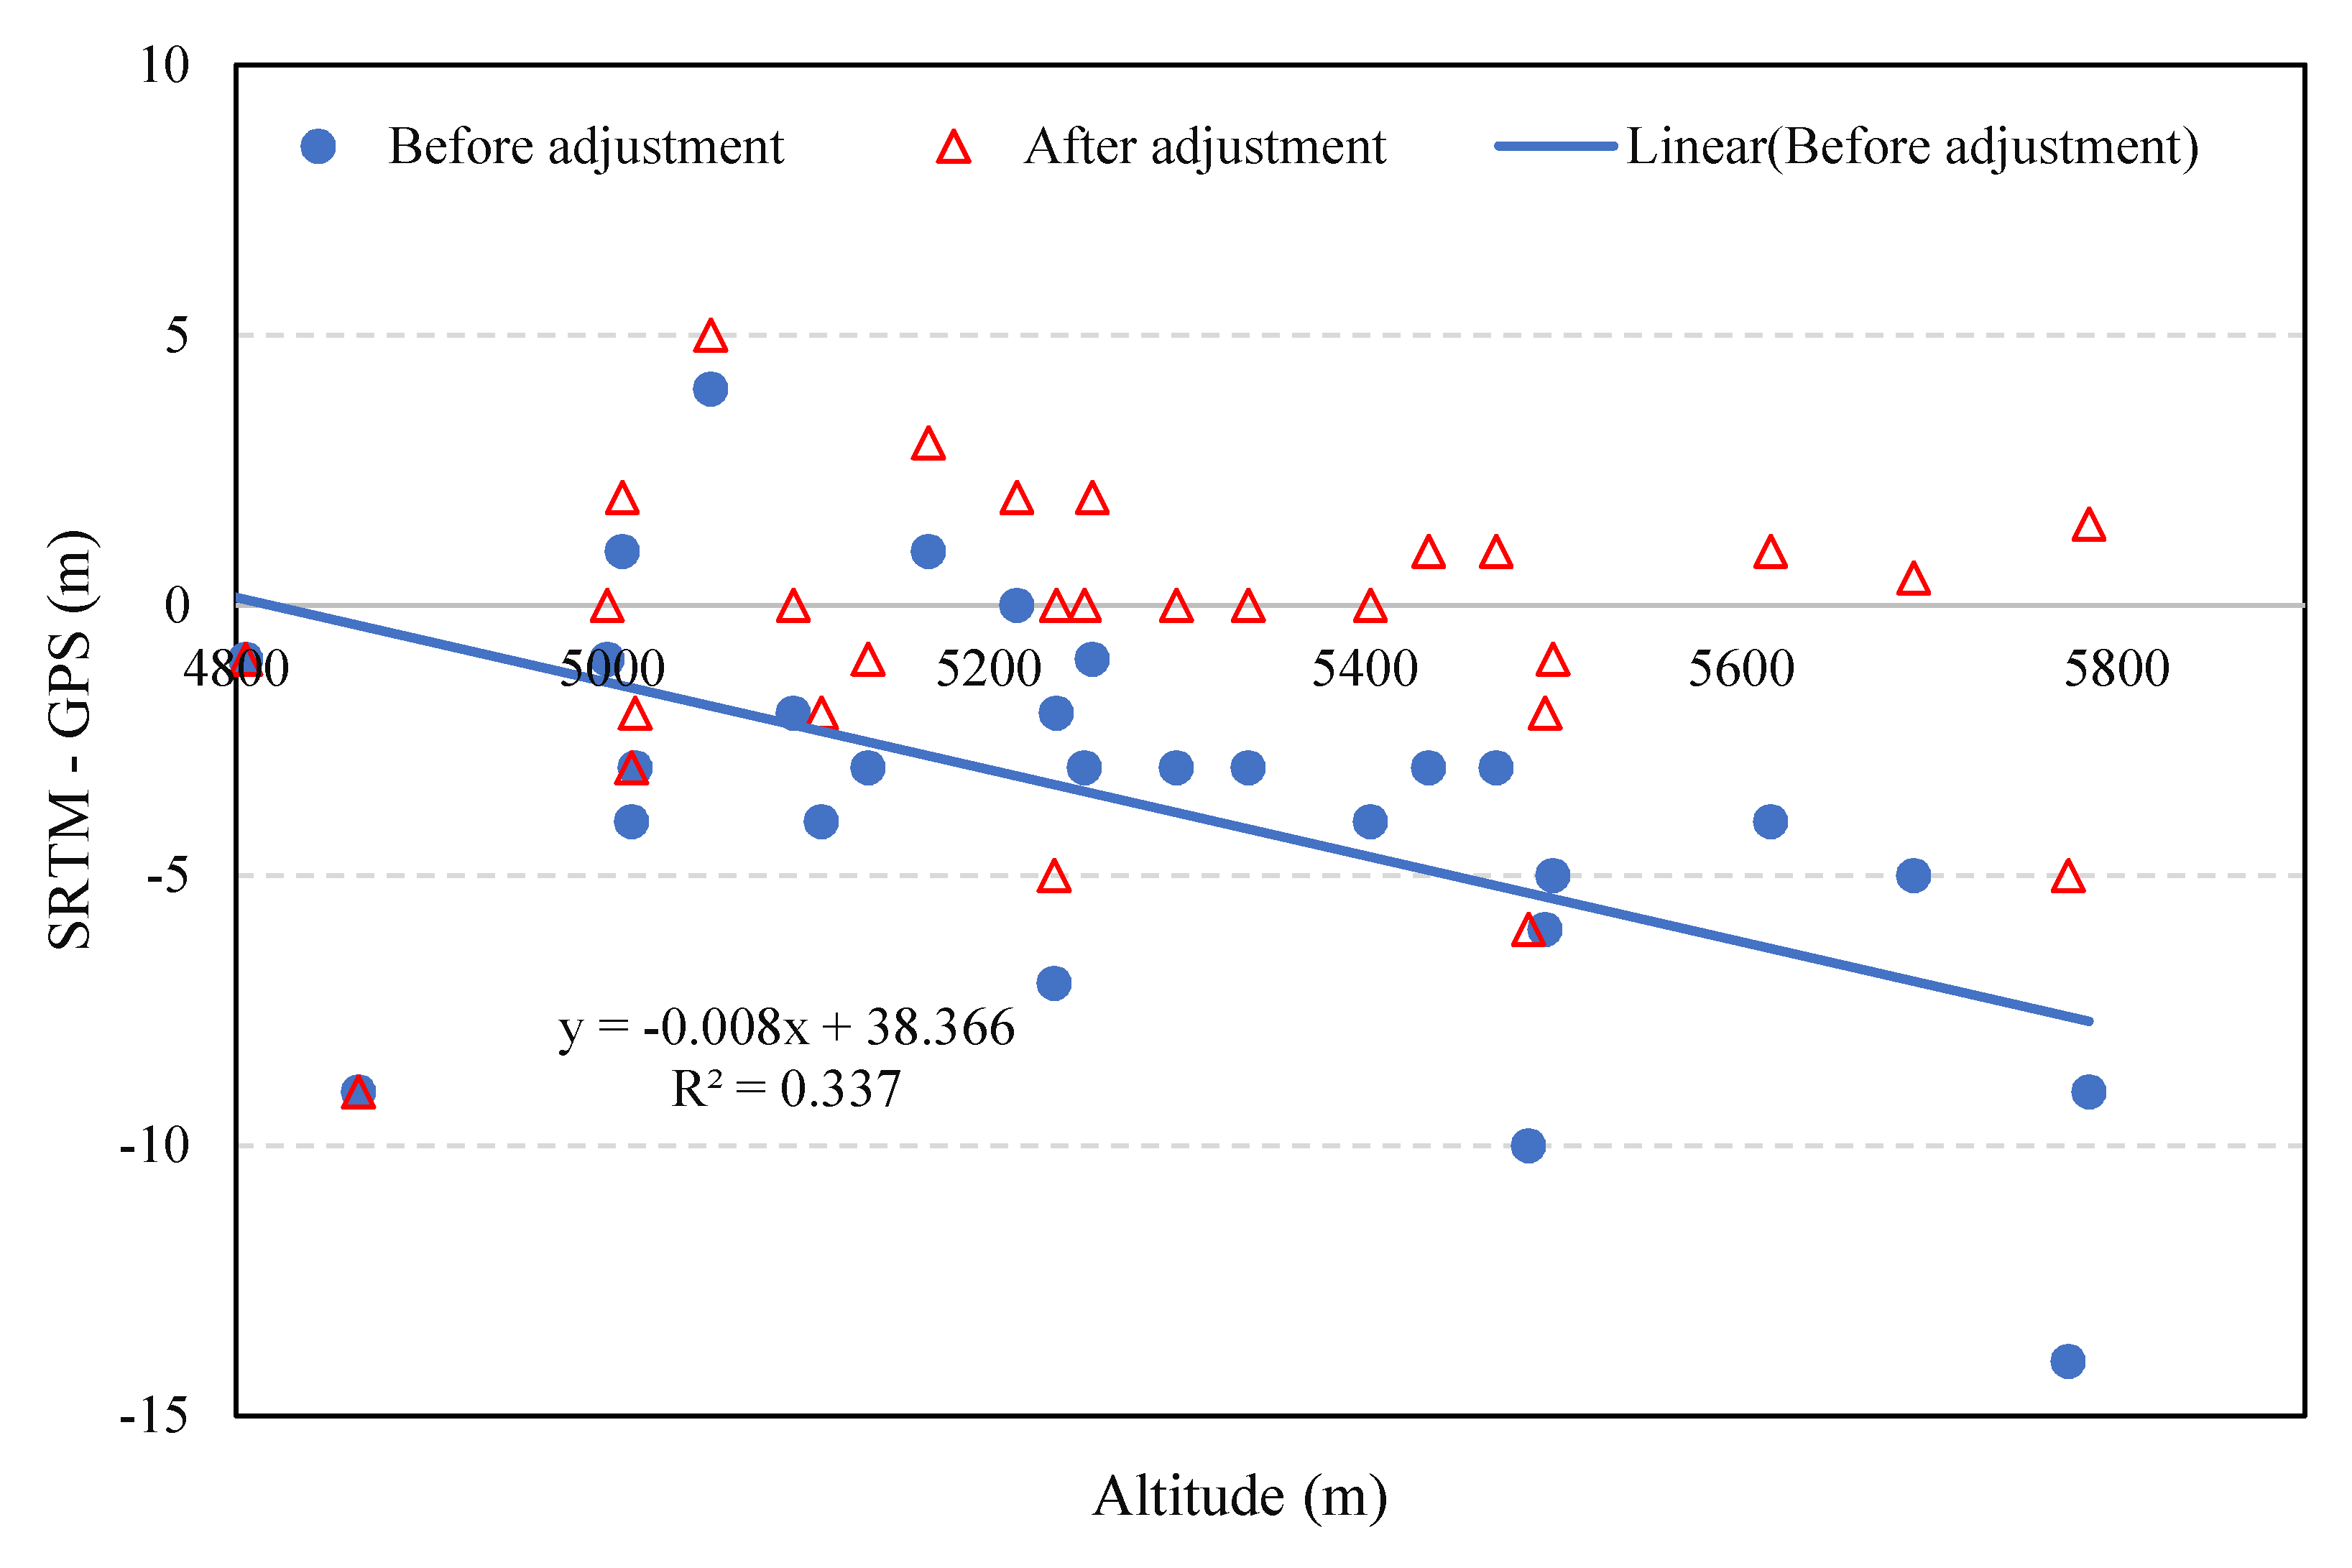
No clearly relations between SRTM–GPS and slope, aspect and curvature was found in this study. But a significant linear trend (α < 0.05) between the SRTM–GPS and the altitude was found in Figure 3. The equation as following was used for SRTM adjustment.
where Y is the adjust value that should be subtracted from SRTM and X is the elevation of SRTM. The elevation difference between SRTM and GPS was −1.0 ± 4.1 m. Although most of the bias was corrected, there was a 1 m bias remaining. This was considered to be the error of SRTM DEM.
Y = −0.008 × X + 38.366
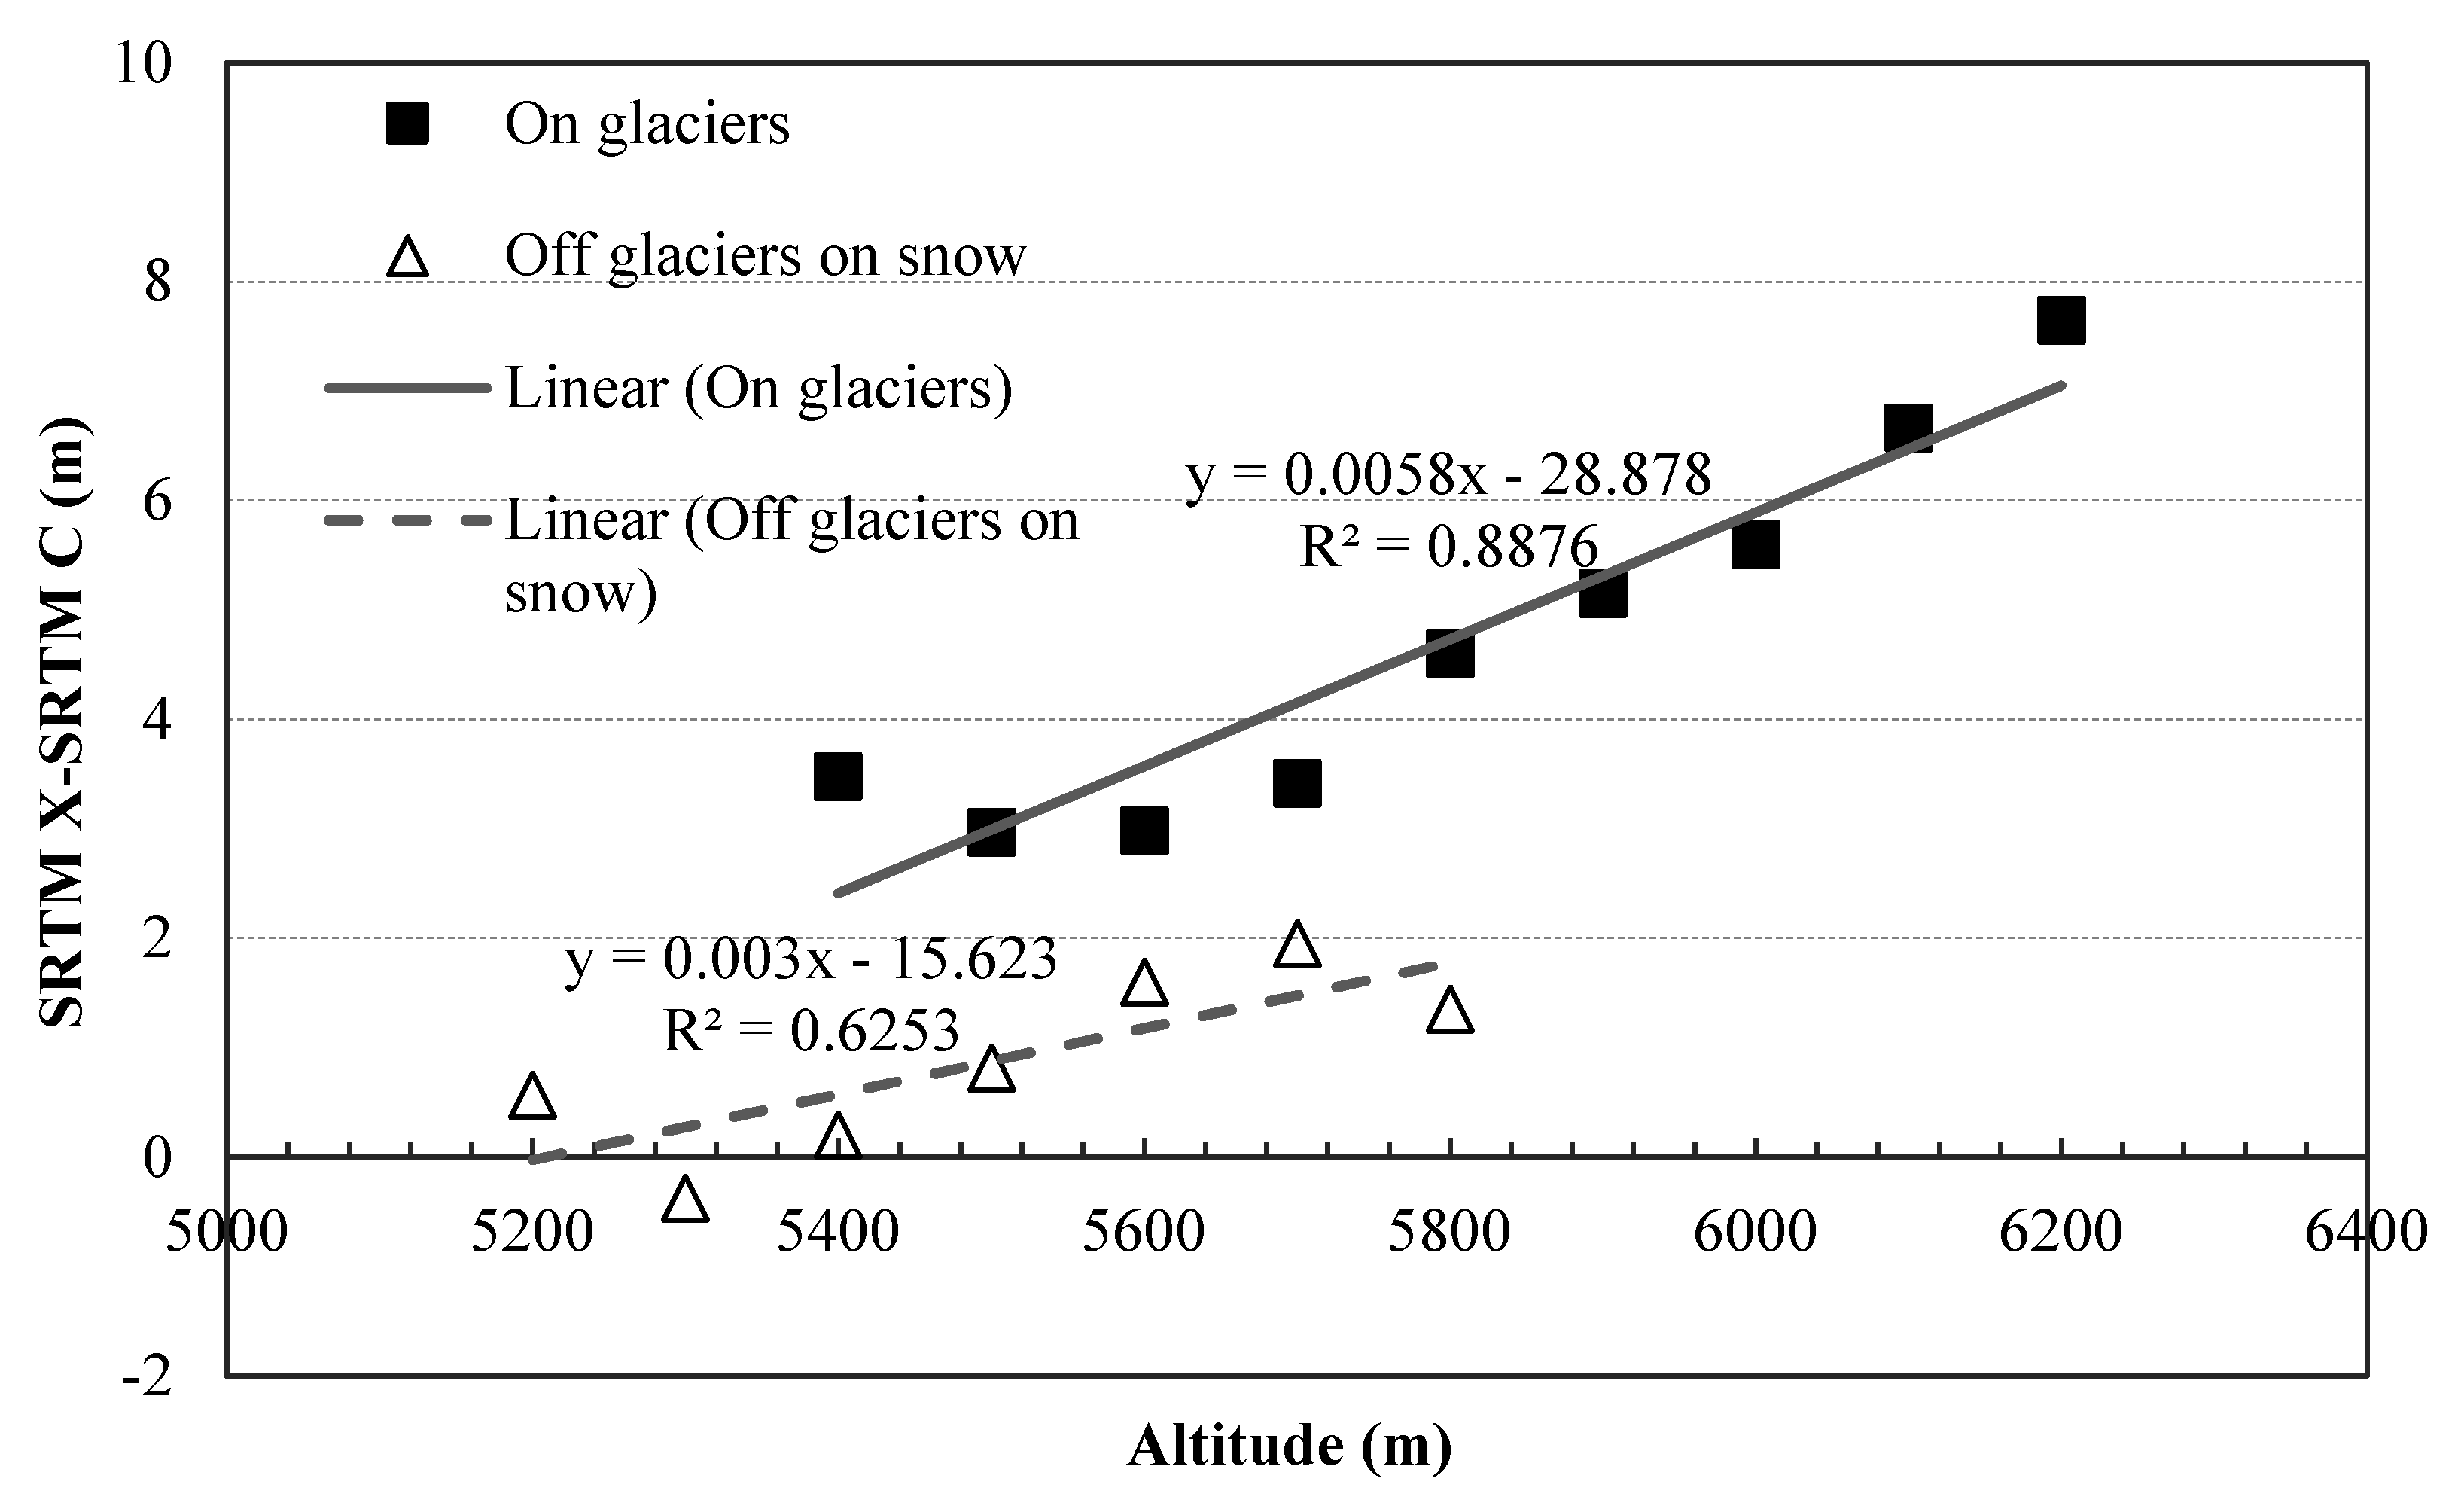
However, the bias of SRTM in glacier area was different from that in off-glacier area due to penetration of the SRTM at C band in snow and ice [38]. The penetration depth on dry and cold firn was up to 10 m, while it was 1~2 m on exposed ice [40]. The best way to correct the penetration is to compare the SRTM at the C band with the X band which almost no penetration [38]. In our study, seasonal snow from 11 and 20 February 2000 (obtained date of SRTM) from Landsat TM images covered the entire glacier area and part of the off-glacier area. This caused a bias of SRTM X and SRTM C in the off-glacier area. The difference between SRTM X and SRTM C showed a significant linear trend (α < 0.05) with altitude both on-glacier and off-glacier (Figure 4) but different change slopes. This means the thickness of seasonal snow increased by 3 m per kilometer. This seasonal snow thickness should be removed before the correction of the penetration depth of SRTM C. Finally, the following equation was used to correct the penetration in snow and ice:
where Y is the value that should be added to SRTM C and X is the elevation of SRTM C. Generally, ~3 m penetration of the SRTM C in glacier area was corrected.
Y = 0.0028 × X − 13.255
When corrected DEM1968, DEM2005 and DEM2013, the co-registration error will result in deviation of the elevation difference as a function of the aspect, the coarse resolution will result in deviation of the elevation difference as a function of the maximum curvature [35,38]. The relationship between dh/tan (slope) (the elevation difference/the tangent of the slope) and the aspect occurs across the entire aspect range is described by a sinusoidal function [35,38]. However, the non-constant co-registration shift between two DEMs result in no a complete sine wave within the whole aspect range (360 degrees). The solution is to divide the DEMs according to the shift value, the boundary of which is difficult to define. The same problem was found in the Qilian Mountains [2]. Thus, it is difficult to correct the bias using the method developed by Nuth and Kääb (2011). Gardelle and others (2012) found that there was a linear bias of elevation difference as a function of maximum curvature and that it could be corrected by the linear function [38]. In view of this, DEM1968, DEM2005 and DEM2013 were corrected in two steps. First, linear equations corrected the deviation of the elevation difference with maximum curvature. Second, the remaining deviation was fitted to aspect using polynomials. This method was also applied in a glacier changes study in the Qilian Mountains [2].
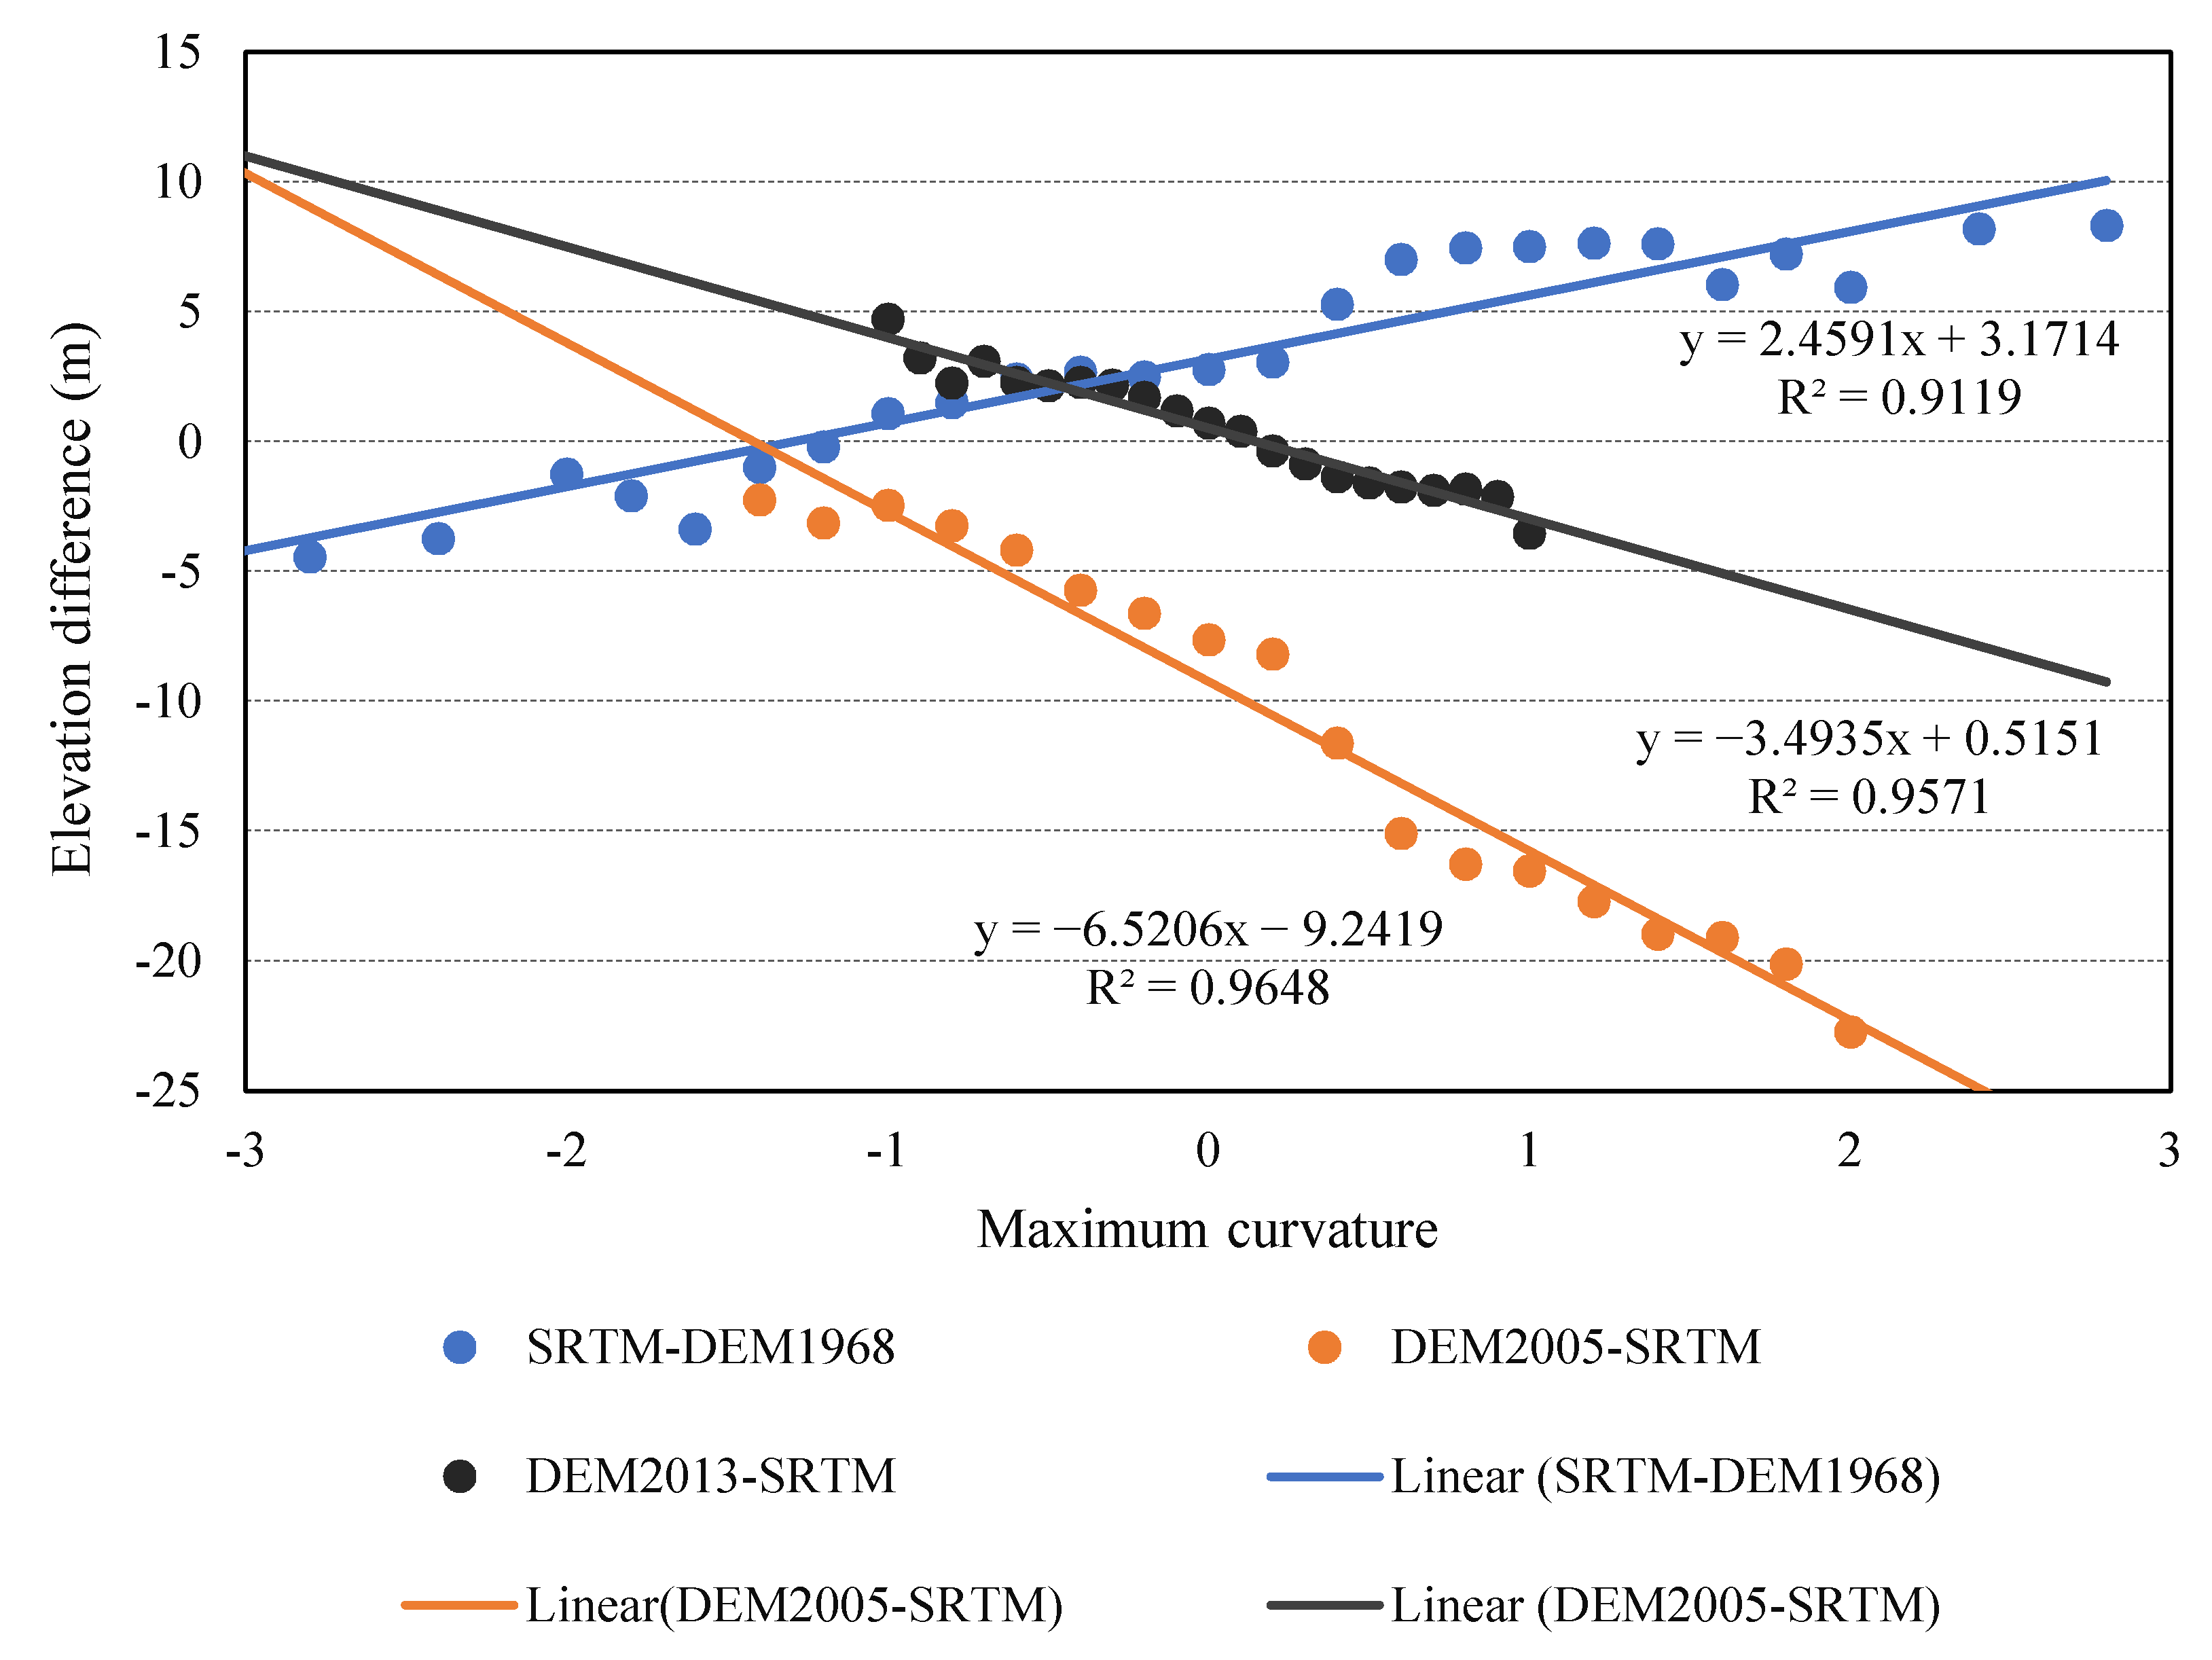
First, three linear equations showing in Figure 5 were employed to correct the deviation of DEM1968, DEM2005 and DEM2013 with SRTM as a function of maximum curvature. All the R-squared was more than 0.9 and significance level (α) was less than 0.01.
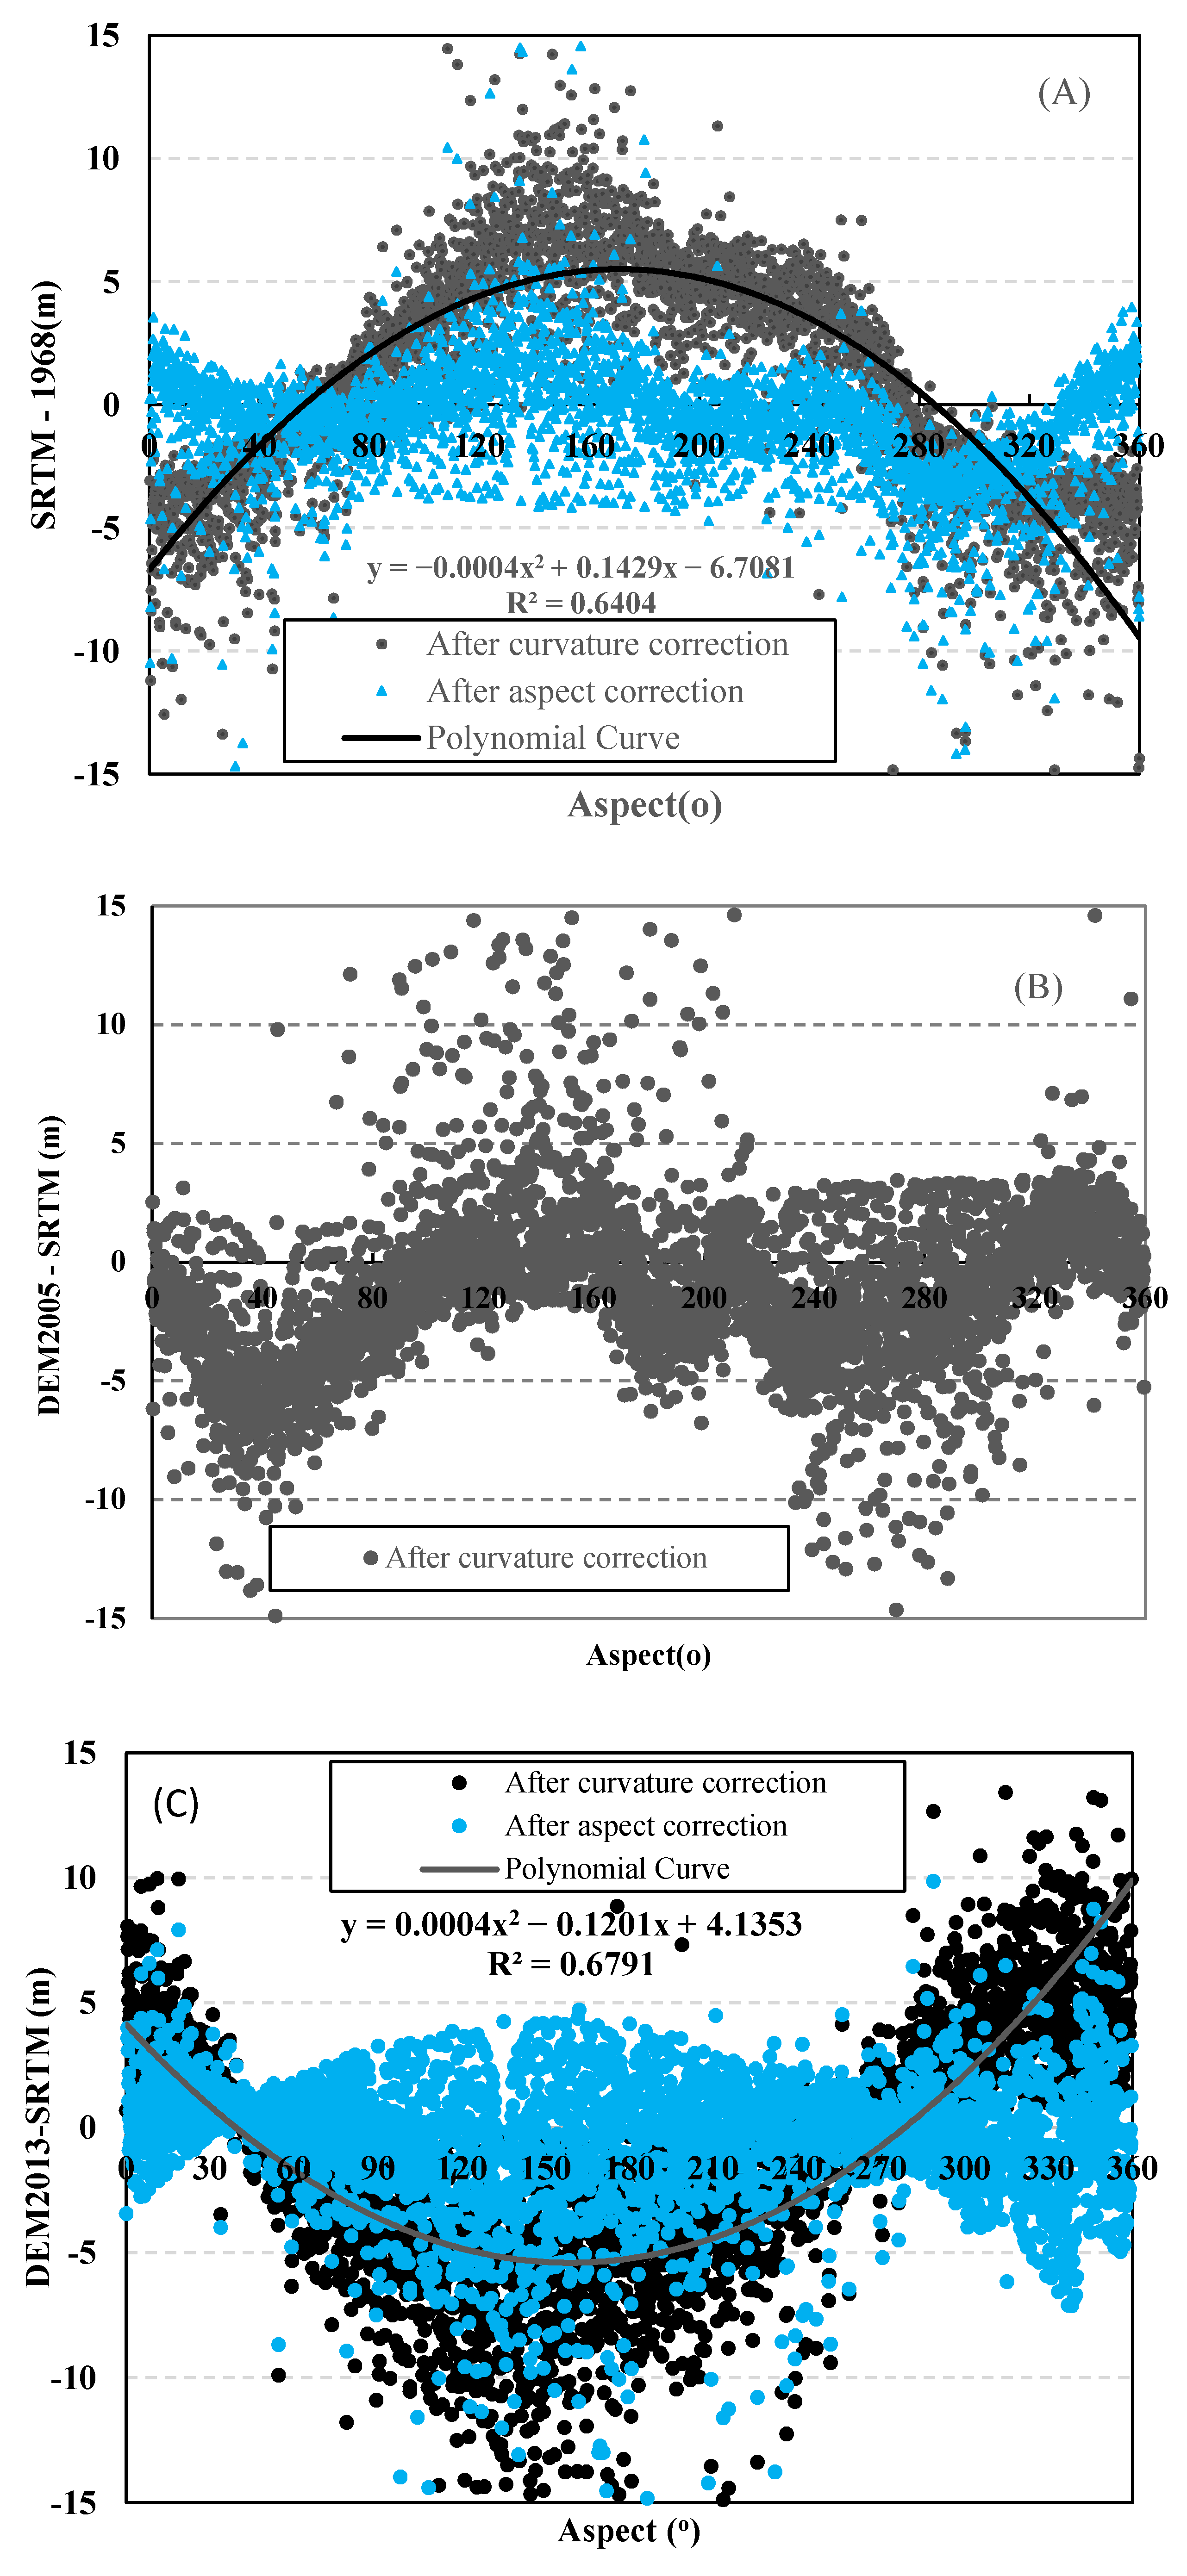
Second, two-order polynomial equation was found on both DEM2005–SRTM and DEM2013–SRTM as a function of aspect. Two similar equations were shown on Figure 6A,C. There was no strong relationship between the DEM2005–SRTM and aspect (Figure 6B) implying that the bias was corrected well by the maximum curvature dependent correction. No aspect dependent correction was implemented. As can be seen, the deviation of DEM1968, DEM2005 and DEM2013 with SRTM was improved significantly after correction (Figure 6). The value of SRTM–DEM1968, DEM2005–SRTM and DEM2013–SRTM was 0.18 ± 12.5 m, 0.86 ± 16.6 m and 0.06 ± 3.7 m, respectively. Follow the law of propagation of error. The total error was calculated as the following equation.
where σ is the error of DEM1968, DEM20015 and DEM2013, σ1 is the error of SRTM, −1 m, σ2 is the value of SRTM–DEM1968, DEM2005–SRTM and DEM2013–SRTM. Thus, the error of DEM1968, DEM2005 and DEM2013 was 1 m, 1.3 m and 1 m, respectively.
Before comparing the DEMs it should be noted that we removed the no-data area in the ASTER DEM and SPOT DEM and excluded the overestimation and underestimation area using the threshold ±150 m. After that, the DEM from ASTER covers 70% of glaciers, while DEMs from SPOT 6-7 covered only 50%.
3. Glacier Changes
3.1. Area Change
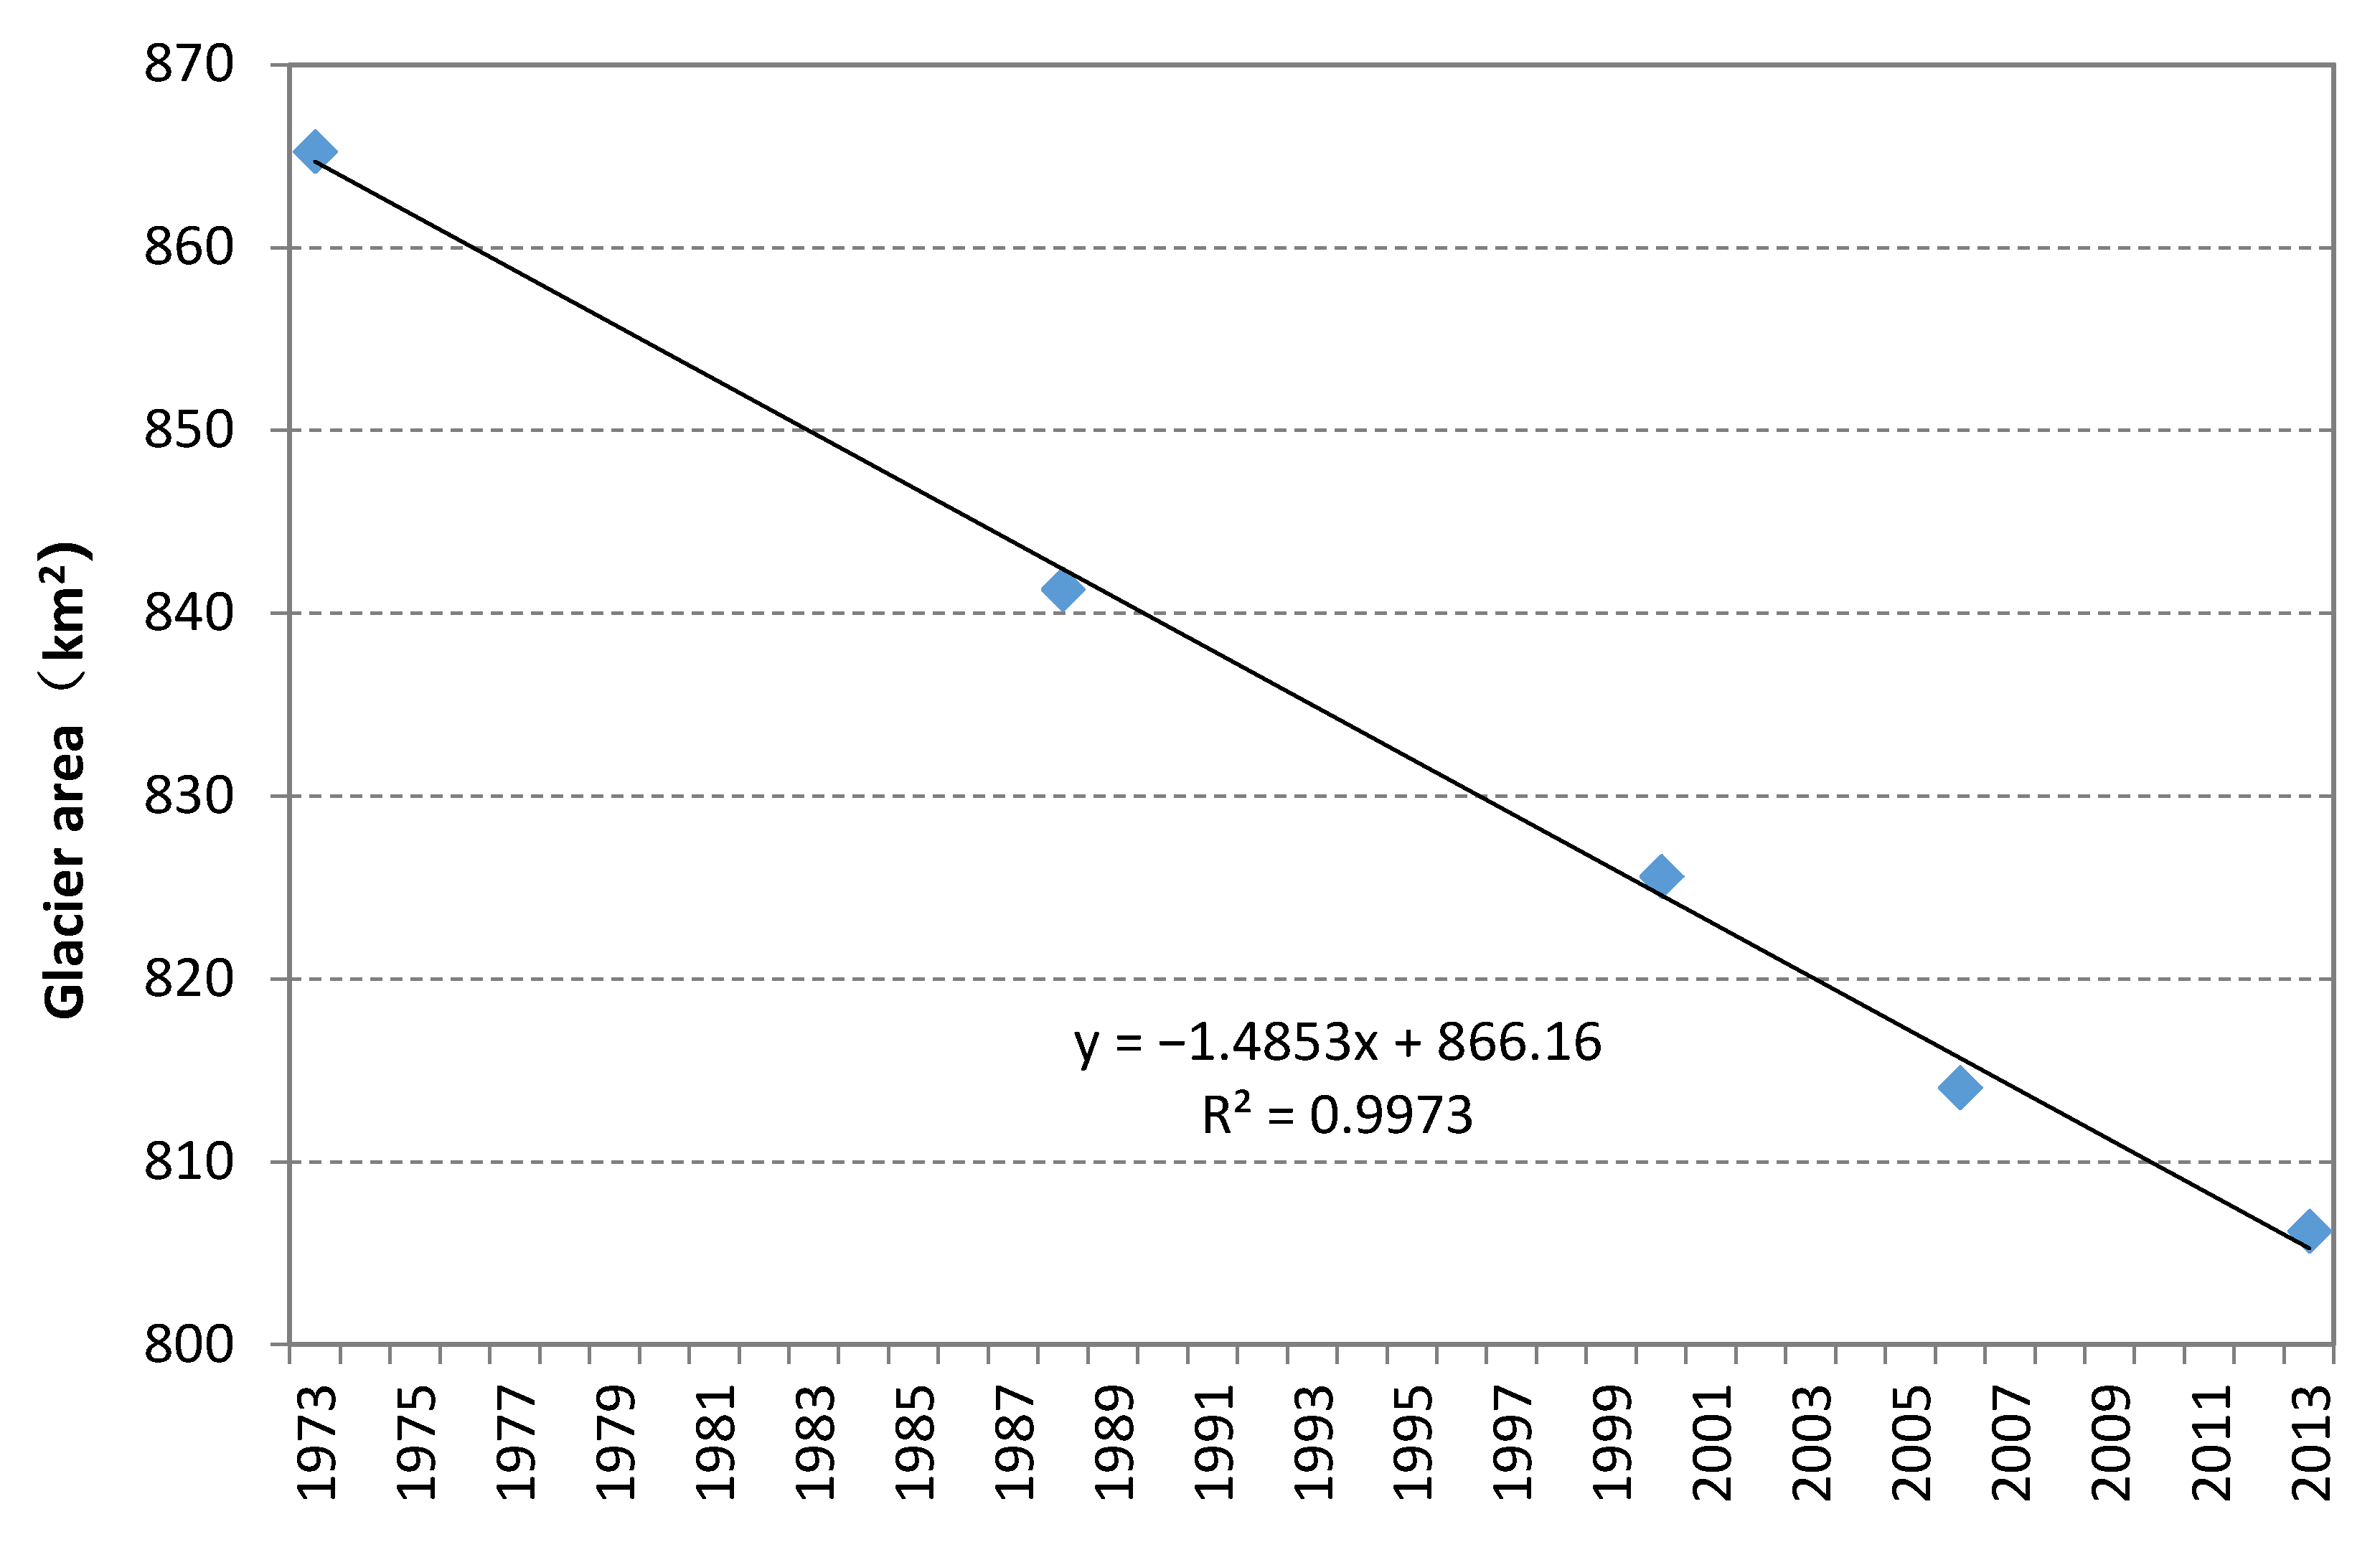
The areas of the 145 glaciers in the Geladandong Peak region in 1973, 1988, 2000, 2006 and 2013 were 865.27 ± 26.82 km2, 841.33 ± 14.3 km2, 825.63 ± 14.04 km2, 814.09 ± 13.84 km2 and 800.68 ± 12.91 km2, respectively (Figure 7). The area of glaciers decreased linearly from 1973–2013 with shrinkage of 7.5 ± 3.4% (with a rate of 0.19%·year−1). The glacial area shrank by 2.8 ± 2.1% (0.18%·year−1), 1.9 ± 1.4% (0.16%·year−1), 1.4 ± 1.4% (0.23%·year−1) and 1.6 ± 1.4% (0.24%·year−1) during the periods 1973–1988, 1988–2000, 2000–2006, 2006–2013, respectively. Overall, the shrinkage speed of the glacial area increased after 2000.
Generally, the annual rates of relative area change were smaller in larger glaciers throughout the assessment period (Table 3). However, the largest glaciers which was more than 10 km2 did not exhibit the slowest shrinkage. This was different from the Nyainqentanglha Range, the Yili river catchment and the Tarim Interior River basin, which had the smallest shrinkage rate of the glaciers larger than 10 km2 [31,41,42]. The reason will be analyzed together with elevation changes and length changes. This observation that area changes depend on glacier size, with larger glaciers shrinking at slower percentage rates, appeared in most mountains in the world [1].
3.2. Length Change
Judging from the length change of 33 glaciers from 1973 to 2013, glaciers retreated by an average of 412 ± 32 m. The mean retreat speed was 10.3 ± 0.8 m·year−1 and the relative retreat rate was 5.6 ± 0.4%, which was lower than the area shrinkage rate. The annual retreat in the periods 1973–1988, 1988–2000, 2000–2006 and 2006–2013, were 5.4 ± 2.1 m·year−1, 9.8 ± 1.8 m·year−1, 17.0 ± 3.5 m·year−1 and 15.8 ± 3.0 m·year−1, respectively, suggesting an accelerated retreating trend. After 2000, the glacier retreat slowed. The trend is the same as that of the glacial area changes.
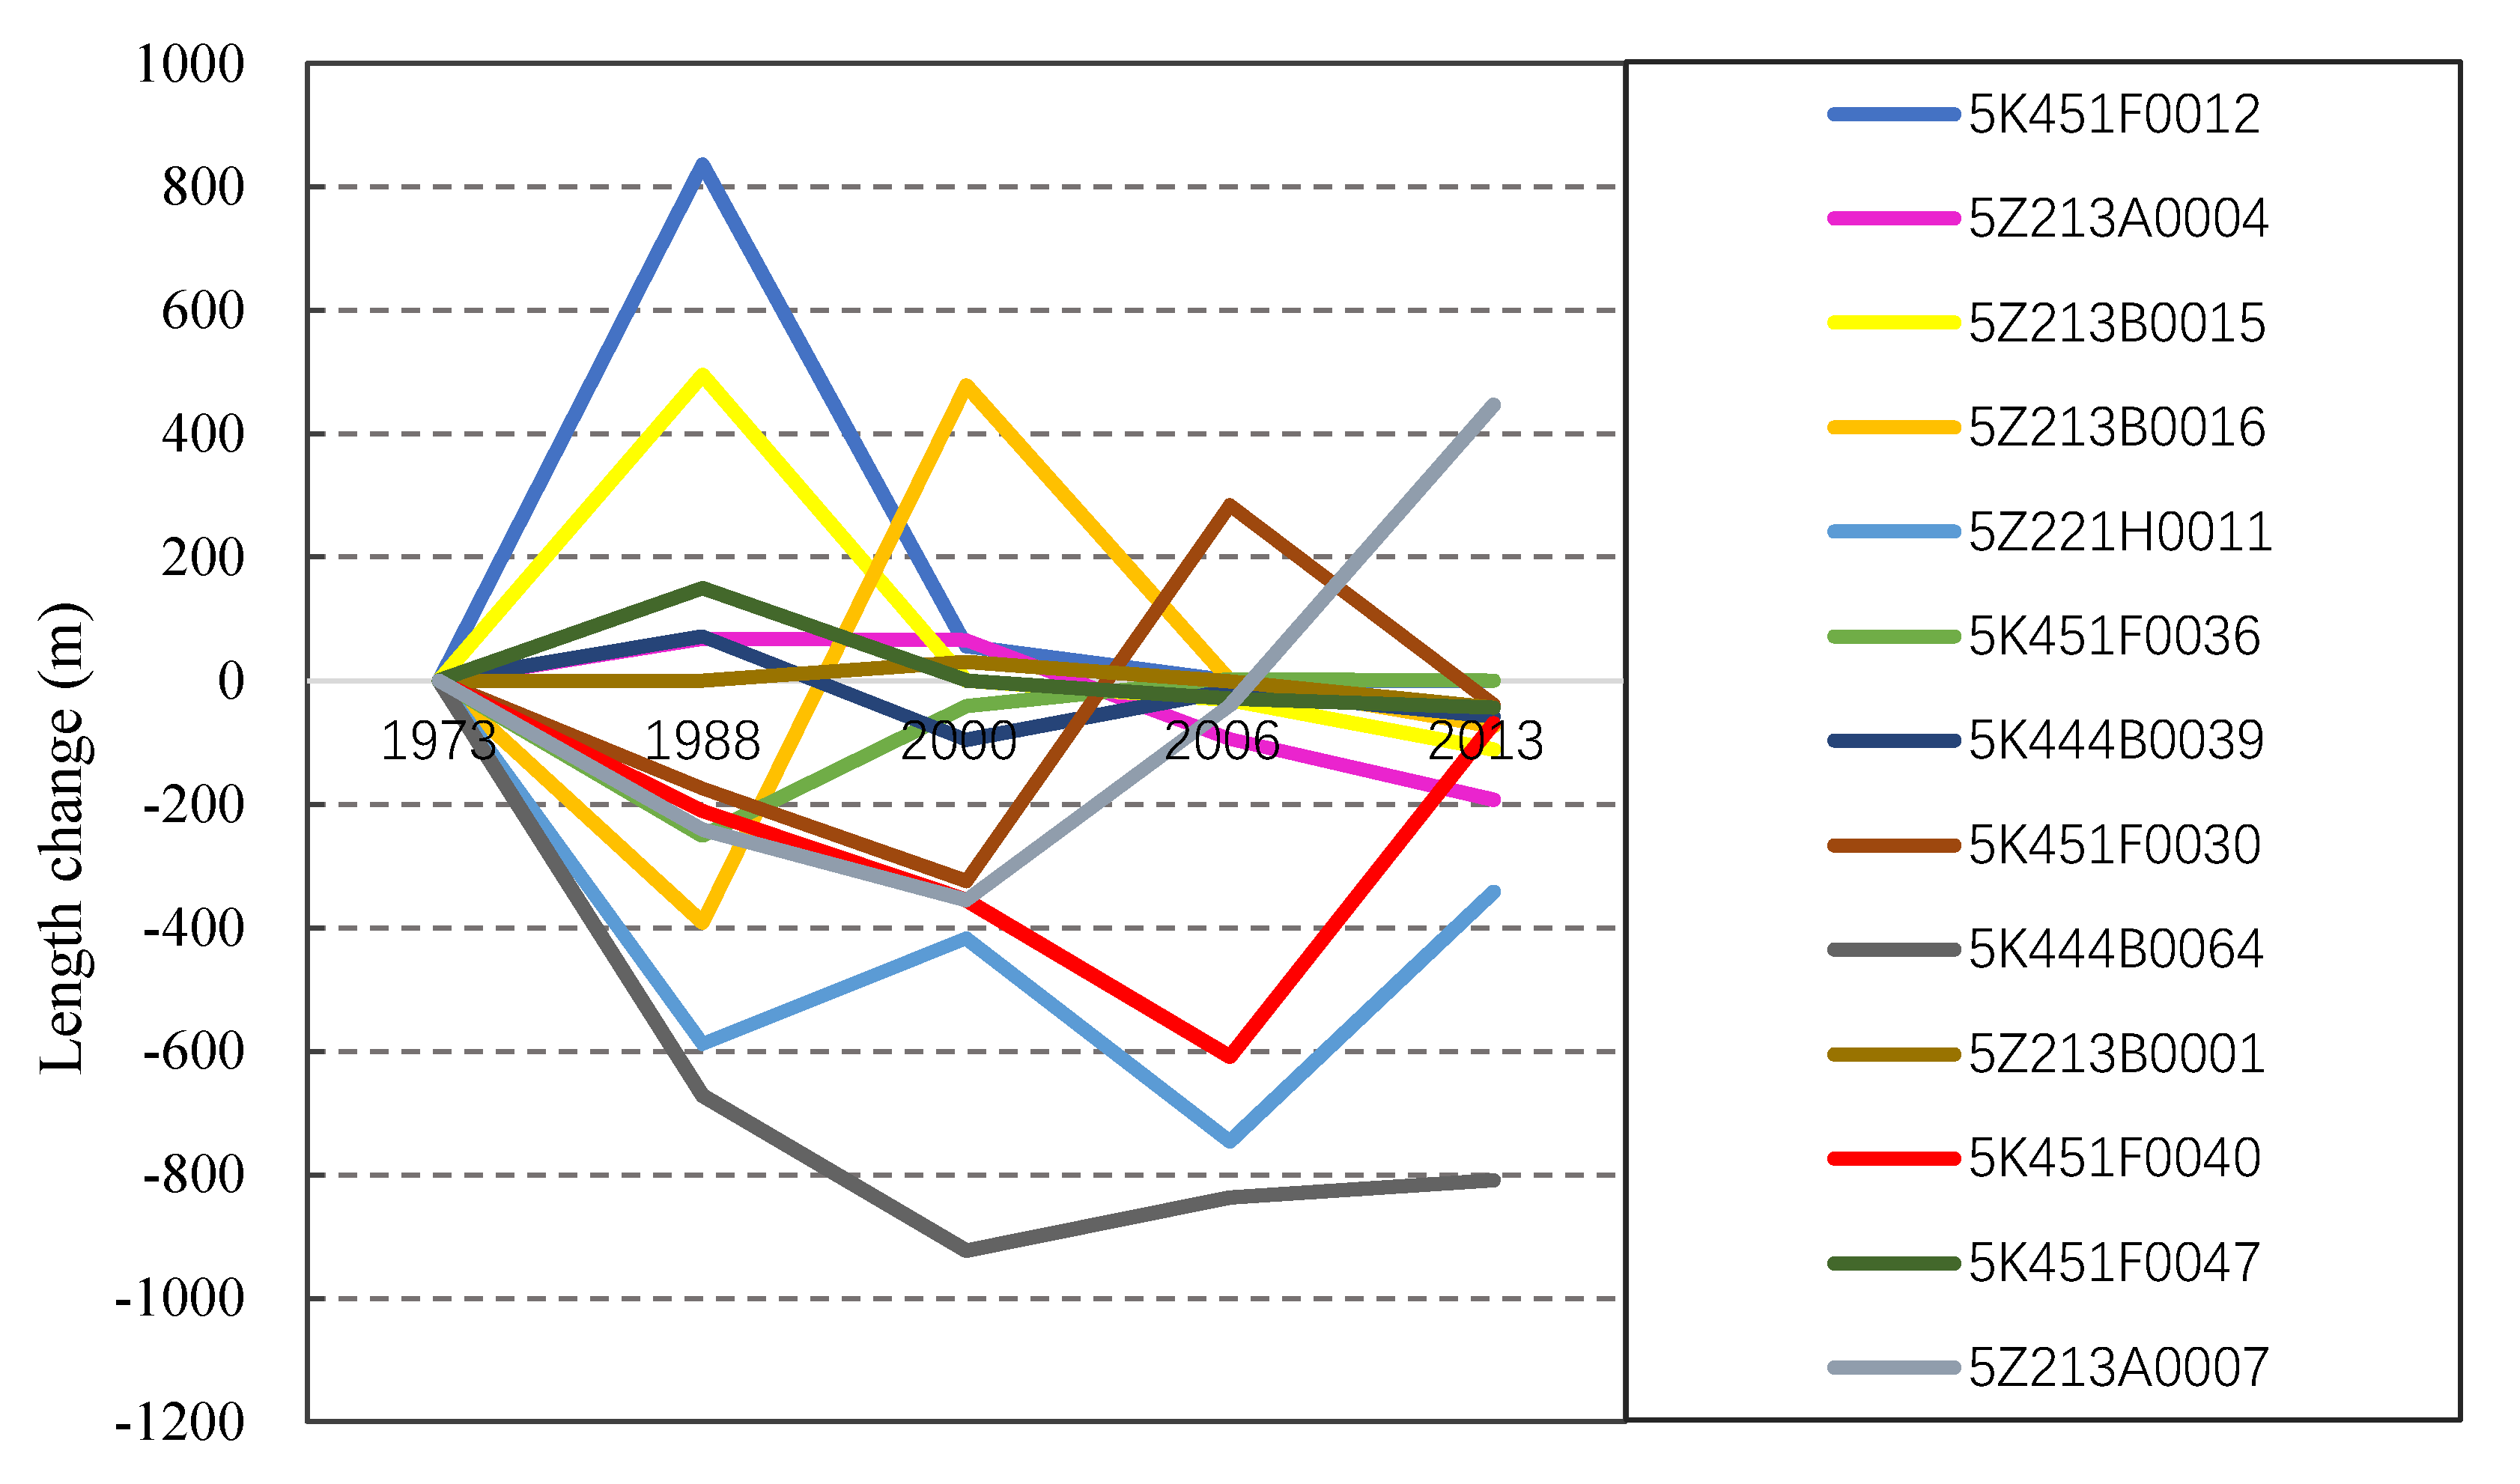
Generally, there were 29 glaciers retreating and 4 glaciers advancing from 1973–2000. The greatest reduction was seen in the glacier Gangjiaquba (5K444B0064) (Figure 1), covering an area of 36.56 ± 1.1 km2, by 3240 ± 32 m (with annual recession of 81 ± 0.8 m·year−1) from 1973 to 2013 (Figure 8). Meanwhile, the area of this glacier changed by −18.3 ± 3.5%, which was much higher than the shrinkage of glaciers in the same area size. The biggest advancing glacier was 5K451F0012, with an area of 9.05 ± 0.28 km2, by 892.3 ± 32.2 m. However, it was found that the change in the length of the glacier was very complicated when comparing the length changes over different periods. Some glaciers retreat and advance alternatingly. There were 10 glaciers (5K444B0039, 5K451F0012, 5K451F0030 (the north branch glacier of Jianggudiru), 5K451F0036, 5K451F0047, 5Z213A0004, 5Z213A0007, 5Z213B0001, 5Z213B0015 (Zengpusong Glacier) and 5Z213B0016 that have advanced. Six glaciers were advancing during 1973 to 2000, while two were advancing during 2000 to 2006 and only one after 2006.
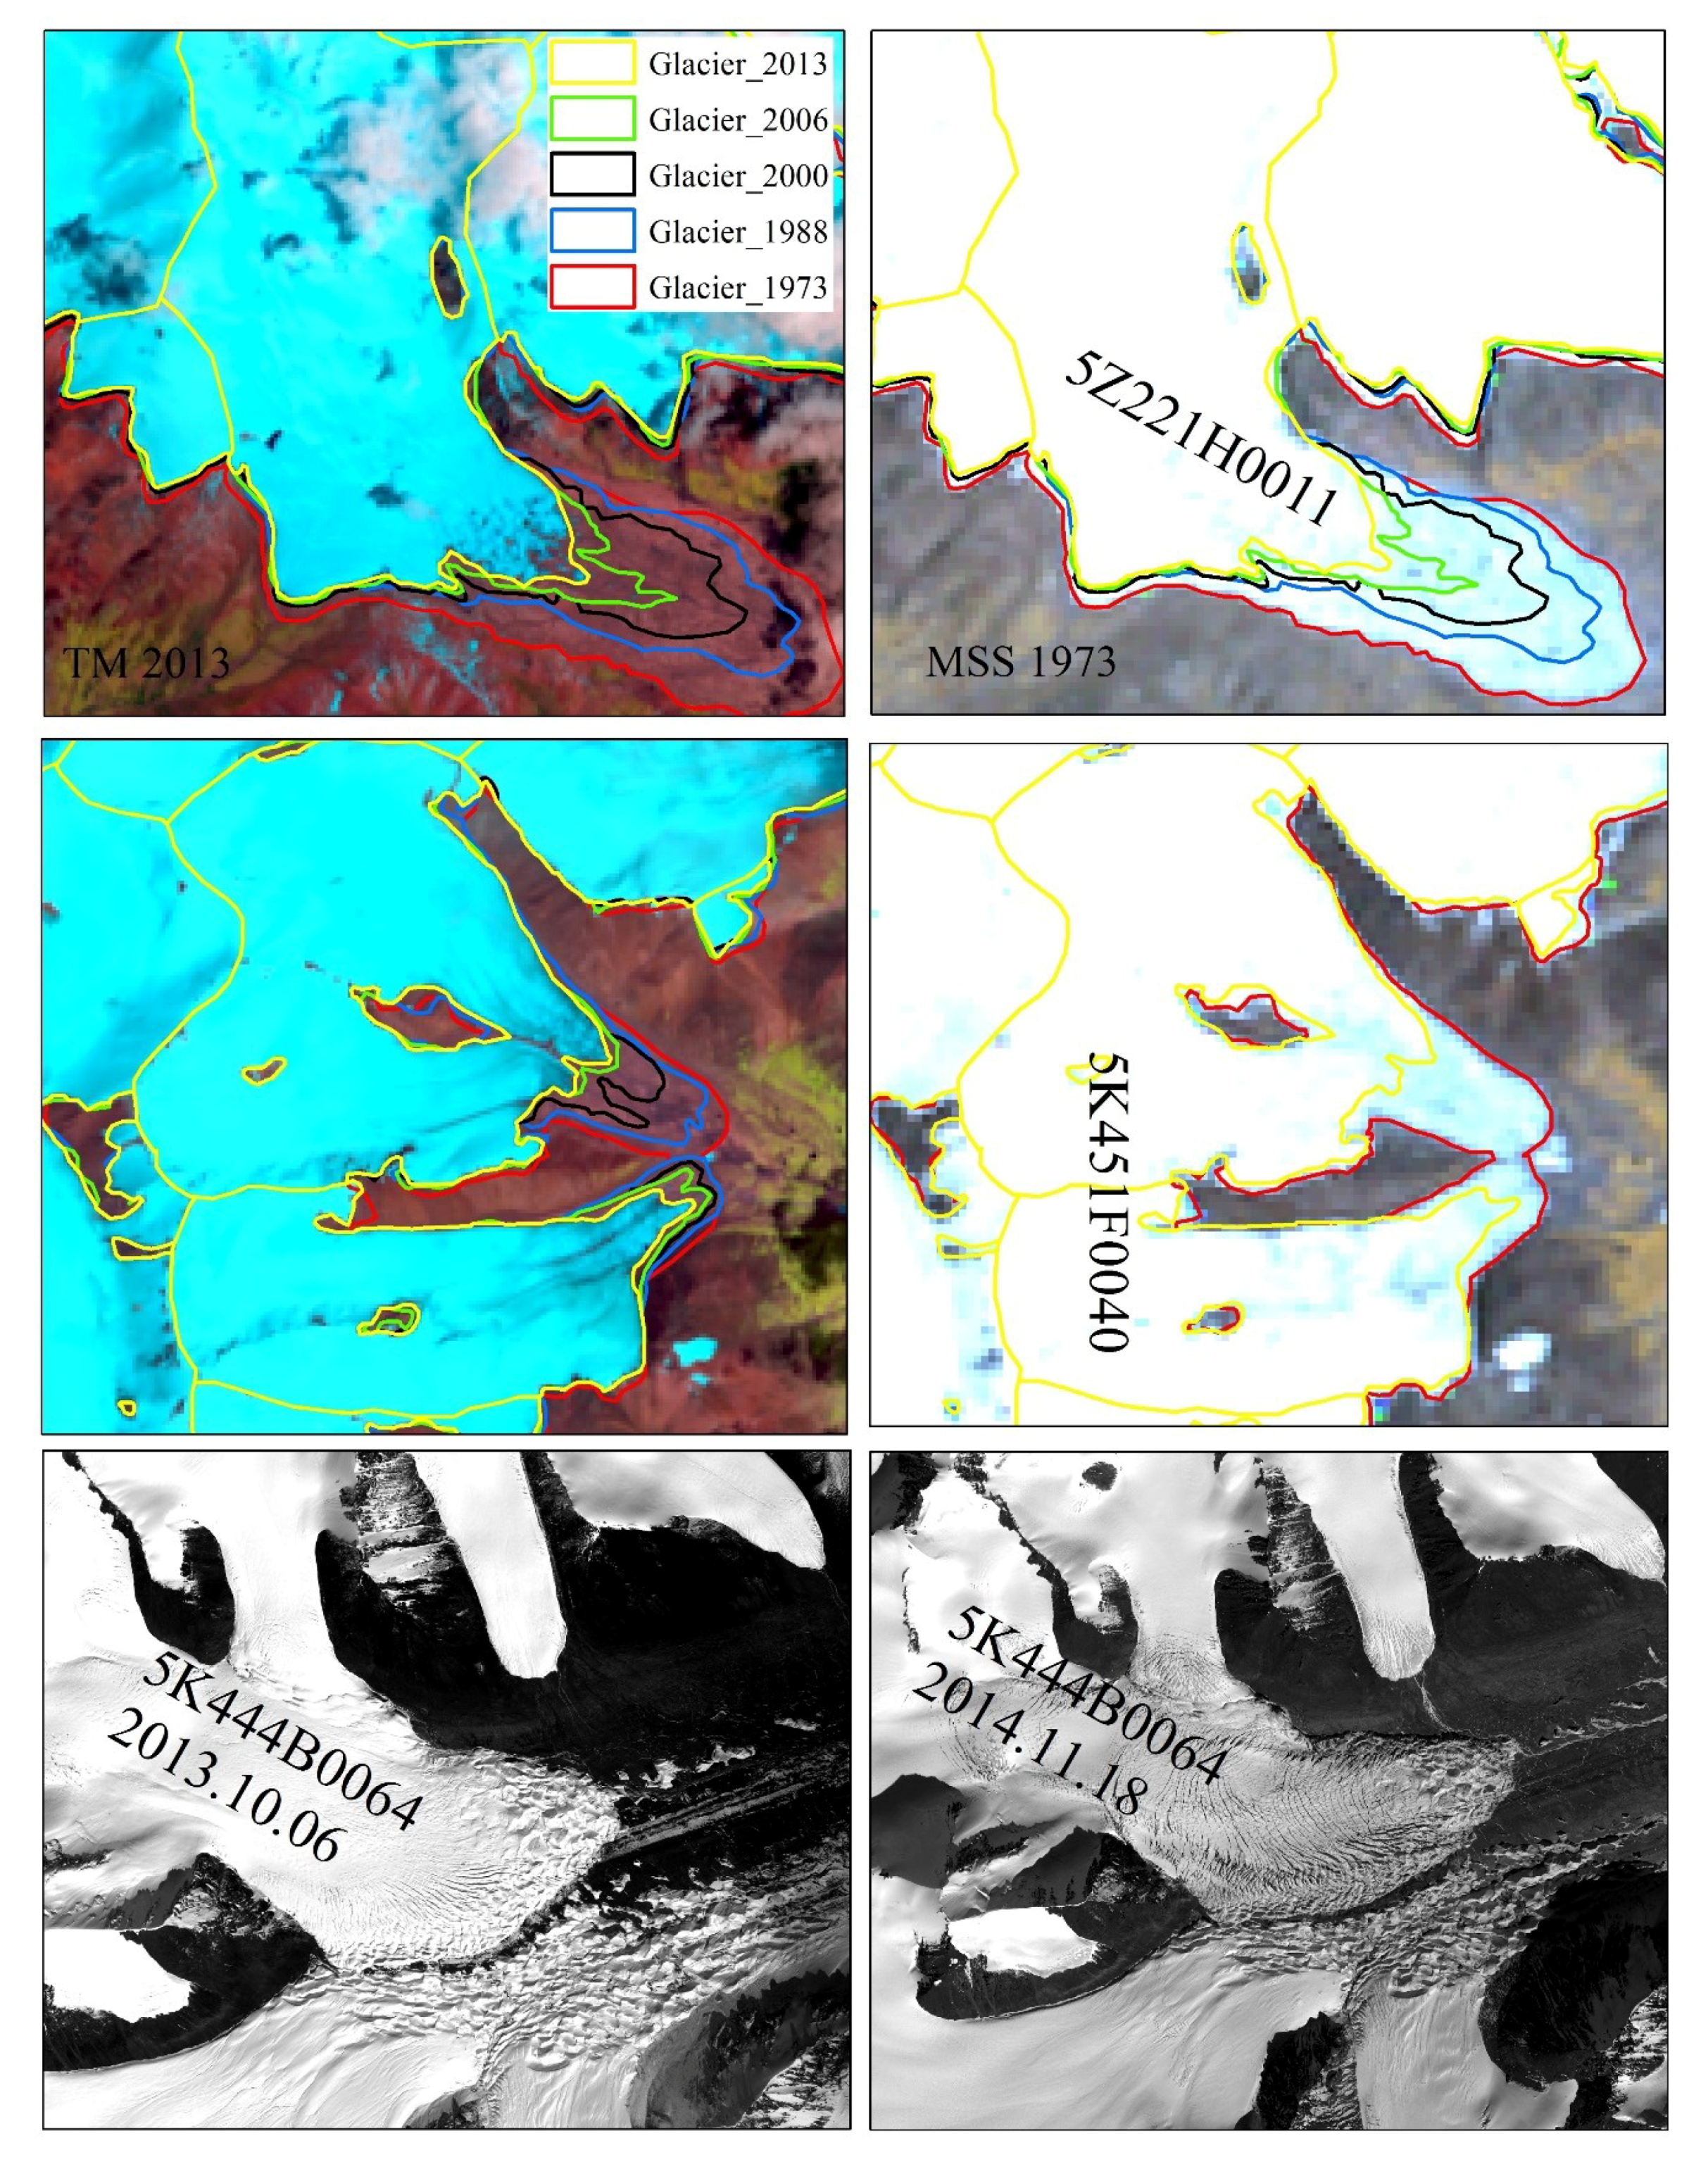
There were another two glaciers (5Z221H0011 and 5K451F0040) that were more than 10 km2 exhibiting particularly strong retreat rates. The glacier 5Z221H0011, covering an area of 16.13 ± 0.5 km2, retreated 2092 ± 32 m (with annual recession of 52.3 ± 0.8 m·year−1) and shrank by 24 ± 3.1% in area from 1973 to 2013. The glacier 5K451F0040, covering an area of 17.35 ± 0.53 km2, retreated 1244 ± 32 m (31 ± 0.8 m·year−1) and shrank by 11 ± 2.4% in area from 1973 to 2013. Both of them changed much larger than glaciers in the same area size. This suggests that the particularly high retreat rates of these three glaciers partly explain large mean changes in glaciers greater than 10 km2. The reason for this rapid retreat and shrinkage is unclear and will require further analysis in the context of glacier geometry and surface velocities.
3.3. Surface Elevation Changes
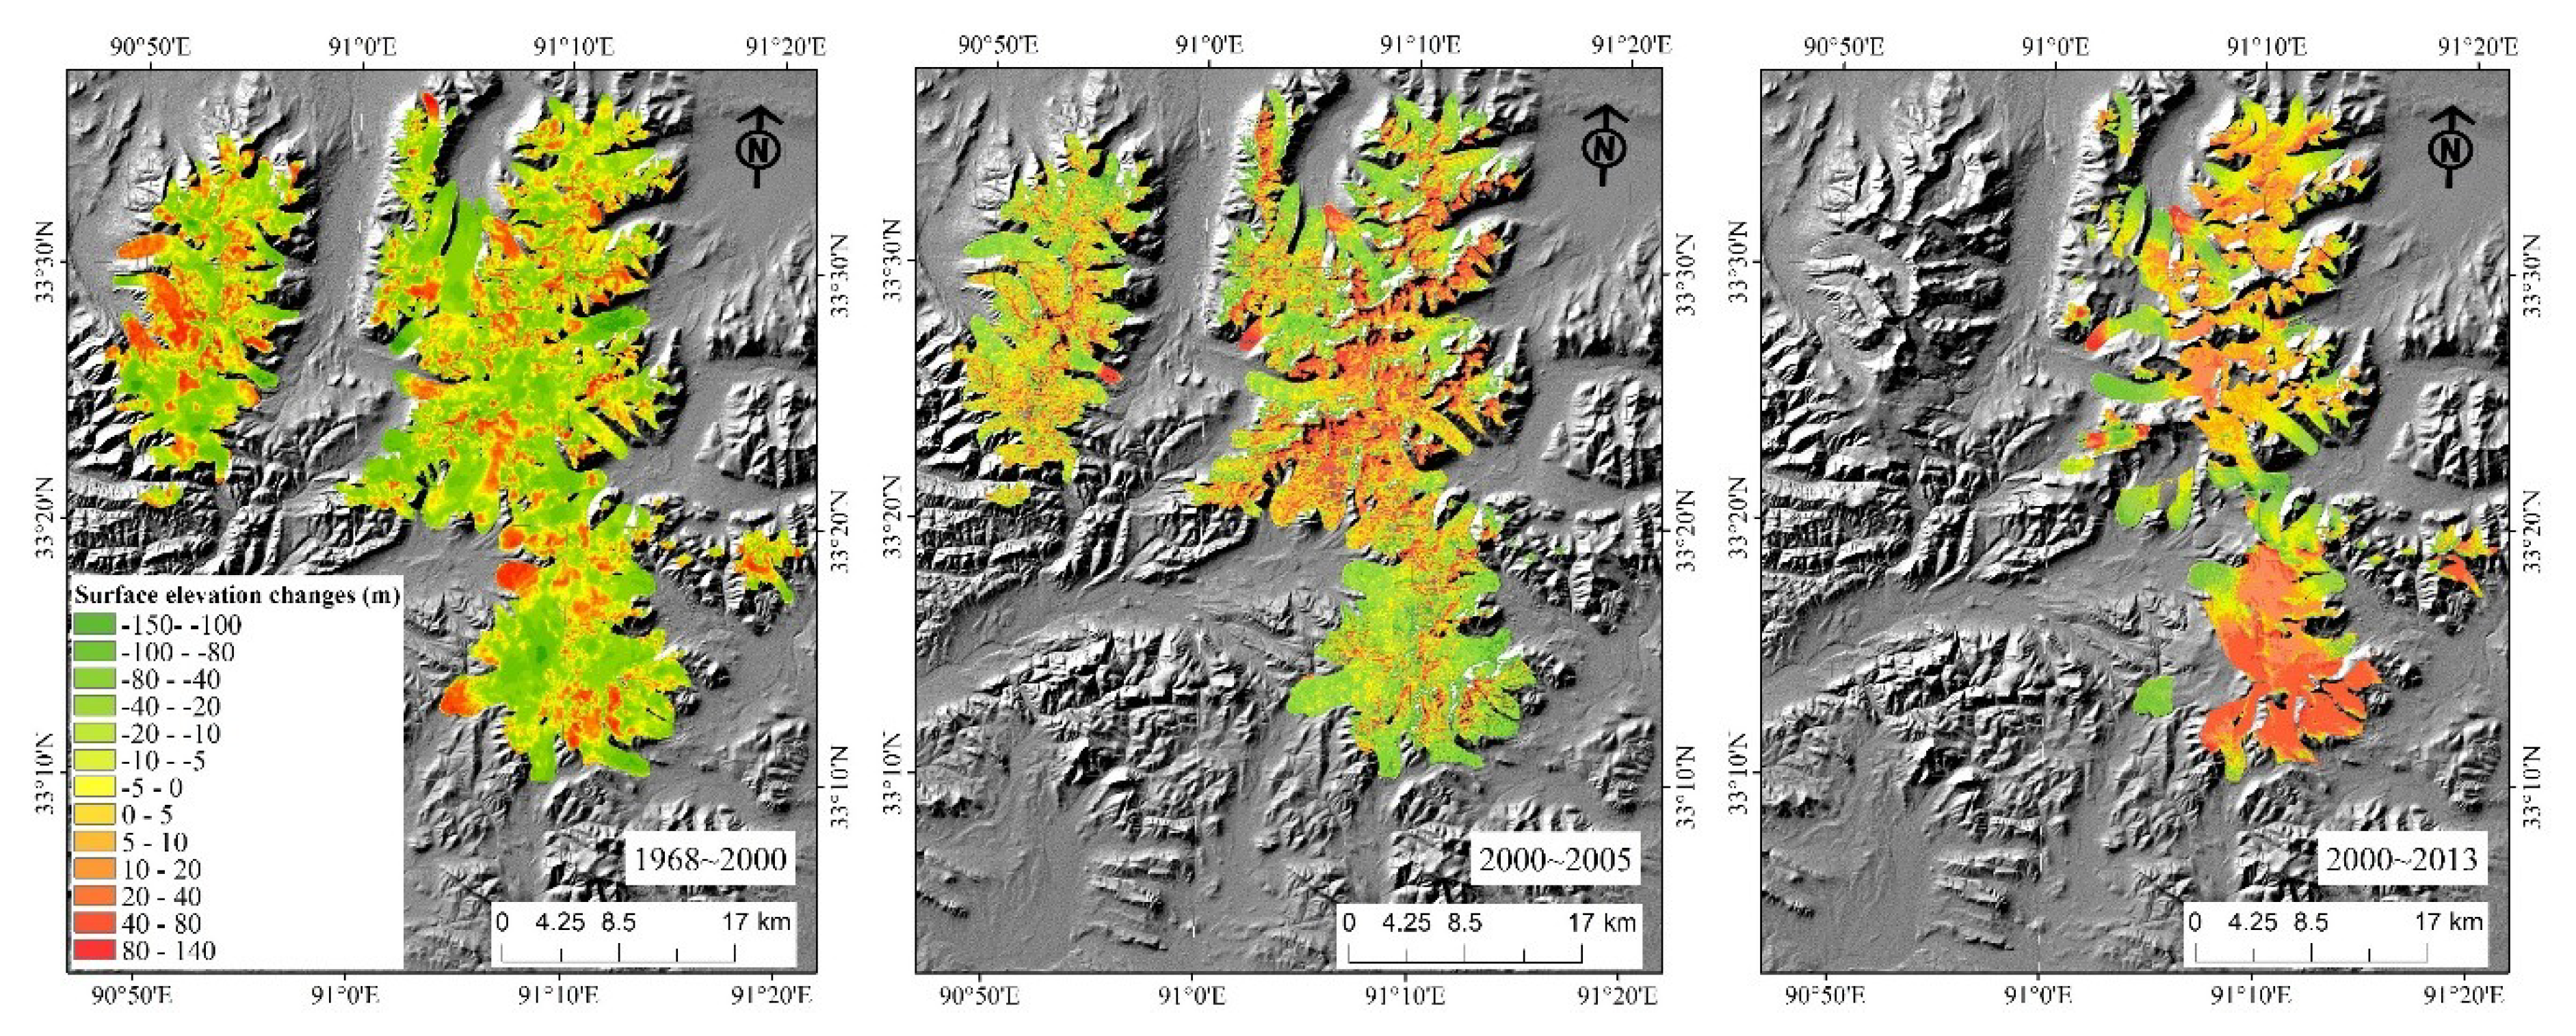
As there was a large non-overlapping invalid data zone in the DEM2005 and DEM2013, the elevation difference between these two DEMs was not shown in this study. Thus, the change characteristics of overall glacial surface elevation in three periods, namely 1968–2000, 2000–2005 and 2000–2013, were analyzed.
Generally, the changes of glacier surface elevation in the Geladandong Peak region was −12.3 ± 1.4 m (with a rate of −0.3 ± 0.12 m·year−1) from 1968 to 2013. The changes in glacial surface elevation from 1968–2000, 2000–2005 and 2000–2013 were −7.7 ± 1.4 m (−0.24 ± 0.04 m·year−1), −1.9 ± 1.5 m (−0.38 ± 0.25 m·year−1) and −5.0 ± 1.4 m (−0.38 ± 0.11 m·year−1), respectively. This shows an accelerated loss of ice after 2000. From 1968 until 2013, the ice volume declined by 1.1 ± 0.6 × 10⁸ m3 (1.1 ± 0.6 billion m3), equivalent to 1.0 billion m3 of water equivalent, using a density of 900 kg·m3.
The details of changes during the periods 1968–2000, 2000–2005 and 2000–2013 was shown in Figure 9. The area of the large Gangjiaquba Glacier changed considerably and the surface elevation of its ice tongue changed significantly. From 1968–2000, glacier tongue thinned by a maximum of 110 m. From 2000–2013, the degree of thinning decreased. However, the terminus of glacier No. 5K451F0012, which advanced greatly, thickened significantly from 1968–2000, with a maximum of 100 m.
In addition, there another 13 glaciers exhibited a large area of thickening occurred in the tongue of glaciers. There are 5K451F0012, 5K451F0030, 5K451F0033, 5K451F0036, 5Z213A0004, 5Z213A0007, 5Z213A0009, 5Z213B0014, 5Z213B0015 and 5Z213B0016. And a continuous ice displacement on glacier 5K451F0008 from 1968 until 2005, on glacier 5Z213B0003 from 2000 until 2013 and on glacier 5K444B0064 from 1968 until 2013 was found. The location of these glaciers was shown in Figure 1. Seven of these glaciers (5K451F0012, 5K451F0030, 5K451F0036, 5Z213A0004, 5Z213A0007, 5Z213B0015 and 5Z213B0016) had advanced from 1968 to 2013.
3.4. Changes of Advancing/Surging Glaciers
Length change and surface elevation change studies have shown that there were 10 advancing and another 6 potential surging glaciers in Geledandong peak region from 1973 to 2013. The mean area of all these glaciers was 22.6 ± 0.7 km2. Ten of these glaciers was more than 10 km2, the other glaciers were close to 10 km2 (Table S1). The area shrinkage rate of the 13 advancing/surging glaciers was much lower than that of the non-advancing glaciers which were more than 10 km2. These advancing/surging glaciers shrank in area with a rate of 0.13%·year−1, while the glaciers with area more than 10 km2 shrank by 0.17%·year−1 (Table 3).
Previous studies showed that the characteristic of ice displacing downward and the heavy crevasses (especially newly developed) on the glacier tongue were the sign to identify the surging glaciers [43,44]. Here, we compared the images before and after advancing and displacement behavior to find the crevasse development. The results showed that 11 glaciers were identified as surging glaciers (Table 4). Much new crevasses developed on all these surging glaciers, see Figures S1–S15. Five glaciers surged after 2000, three glaciers surged during 1988–2000, only one surged during the 1973–1988 period. As a result, areas of several glaciers increased (Table S1).
Glaciers 5K444B0039, 5K451F0047, 5213A0007 and 5213B0001 were the normal advancing glaciers, which was response to the positive glacier mass balance controlled by the climate forcing. This kind of advancing was also found on Franz Josef Glacier in New Zealand and Younger Dryas in north Greenland [45,46]. Although thickness of glacier 5Z213B0014 increased in the tongue area, it did not advance between 1973 and 2013 and there was no heavy crevassing on this glacier suggesting that it is a surging glacier. The assessment of changes in elevation of the glacier surface result showed that the glacier thickness increased in the 2000−2013 period (Table 5). Usually, there was a time lag of the changes in glacier length response to the changes of mass [47]. The glacier 5Z213A0007 has proved this lag, which thickened by 15.7 ± 1.3 m from 1968 to 2000 and advanced after 2006 by 450 ± 15 m. It was a 6-year lag in the length change of the glacier behind the elevation changes.
4. Discussion
In our study, the ASTER and SPOT 6-7 were used to measure changes in surface elevation of glaciers. Seasonal snow was present on parts of images and depth was not known in the absence of field measurements. The field measurement of mass balance of Xiao Donkemadi glacier, which was close to our study region, showed that the cumulative mass balance was −1584 mm w.e. (the water equivalent) (equal to −1.76 m changes of the ice thickness) in the 2008–2012 period. Only 25% of snowfall occurred in the winter [48].The presence of seasonal snow could have resulted in a thickness uncertainty of ±0.11 m. The results covered by shadows has been excluded and the influence of shadow on the surface elevation change results was not discussed.
The results showed that surging or advancing glaciers covered an area of 361.27 ± 11.2 km2, accounting 42% of the total glacier area (Table S1). We acknowledge that a more in depth study is required to establish whether these glaciers were of surging type or their advance was climatically driven. Surging glaciers respond to climate change in different way from non-surging glaciers and should be treated separately from non-surging glaciers in when assessing impacts of climate change [49].
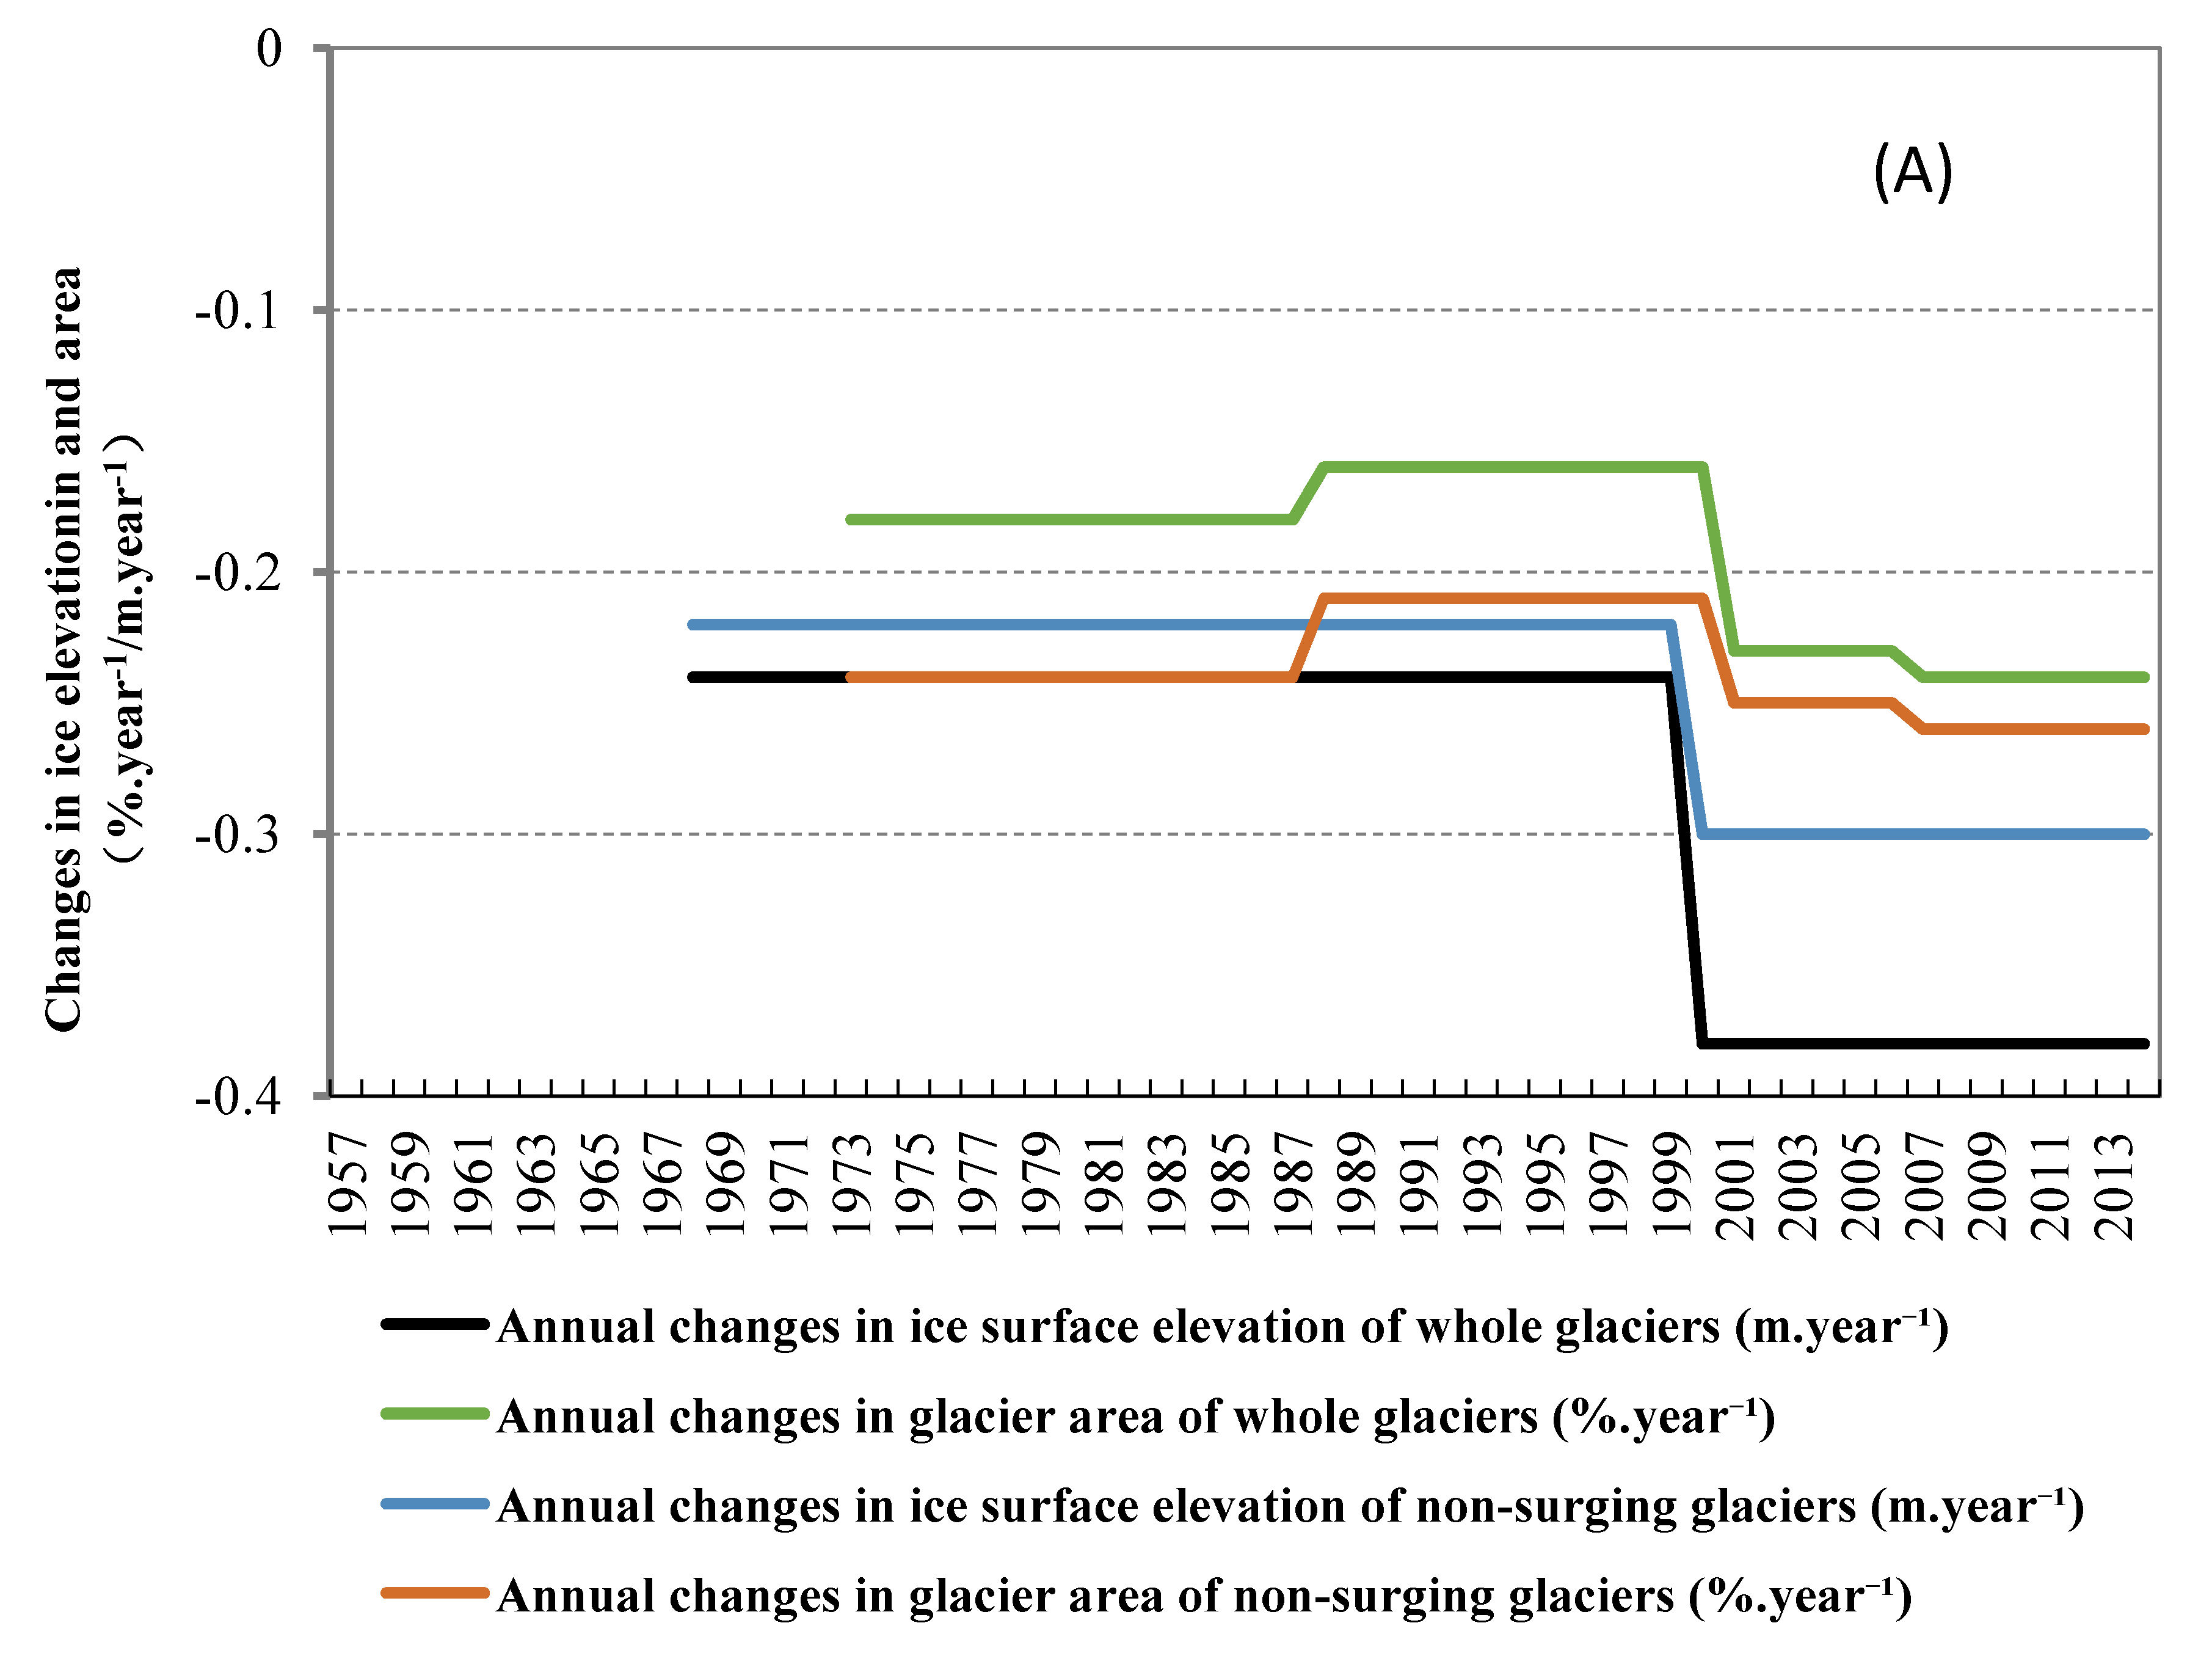
Here, we calculated the changes of non-surging glaciers in length, area and surface elevation separately from the surging/advancing glaciers. The combined area of non-surging glaciers declined by 9.1 ± 2.8% (0.23 ± 0.07%·year−1) from 1973 to 2013. The rate of retreat of non-surging glaciers and surface elevation were 7.0 ± 0.8 m·year−1 from 1973 to 2013 and 0.23 ± 0.12 m·year−1 from 1968 to 2013, respectively.
Areas of several such glaciers increased while their surface elevation declined during the surging periods (Table S1 and Table 5). The changes in length were less pronounced than changes in area and many such glaciers exhibited rapid retreat following surges. Changes in surface elevation of the surging glaciers were stronger than in the non-surging glaciers probably because the ice mass displaced downward glacier at rate of 10–1000 times velocity during the surging period [50,51]. This process pushed more ice towards the lower altitude region with more rapid ablation. The previous studies suggested that changes in surface elevation were the most relevant for assessing glacial responses to climate variability. However, we suggest that in the glacierized regions accommodating surging glaciers, changes in the mass balance of such glaciers were stronger than changes in mass balance of others glaciers [4,49].
The reason for rapid recession of three glaciers (5K444B0064, 5Z221H0011 and 5K451F0040) were different. Glacier 5K451F0040 separated into two almost equally sized glaciers between 1973 and 2013 (Figure 10). The up-branch glacier shrank much faster than the lower-branch glacier although there were no significant differences in aspect, slope and elevation. Glacier 5Z221H0011 was a long valley glacier with a flatter and longer glacier snout than others. This geometry resulted in slower velocity of ice movement towards the glacier terminus [47]. Other researchers reported the similar results. Thus valley glaciers in southern slope of the central Main Caucasus ridge shrank faster than other glaciers [52]. Glacier 5K444B0064 was a surging glacier which advanced in 2014 judging from the SPOT 6–7 images of 2013 and 2014.
Compared with other regions in western of China, the thinning of glaciers in Geladandong Peak is greater than that in the Tuanjiefeng Peak region of the Qilian Mountains, on the north face of Tuomuer Peak of the Tien shan Mountains and in Bangong Lake basin of the Tibetan Plateau, while the area change of glaciers in this region is less than that in these regions [2,6,42,53,54]. It suggests that the response of glacier size to climate change has a certain lag behind the responses of glacier thickness. Studies have shown that the larger the glaciers were, the longer lag of glaciers respond climate change [47]. The mean area of the Geladandong Peak region is 6.0 km2, much larger than that of the Tuanjiefeng Peak region of the Qilian Mountains (1.7 km2). Therefore, the shrinkage of glaciers area in Geladandong Peak region was smaller than that in the Tuanjiefeng Peak region, although the thickness reduction of glaciers in Geladandong Peak is more than those in the Tuanjiefeng Peak region. In addition, this lag was also the cause of the rate of the reduction of glacier areas decreasing with increasing glacier size.
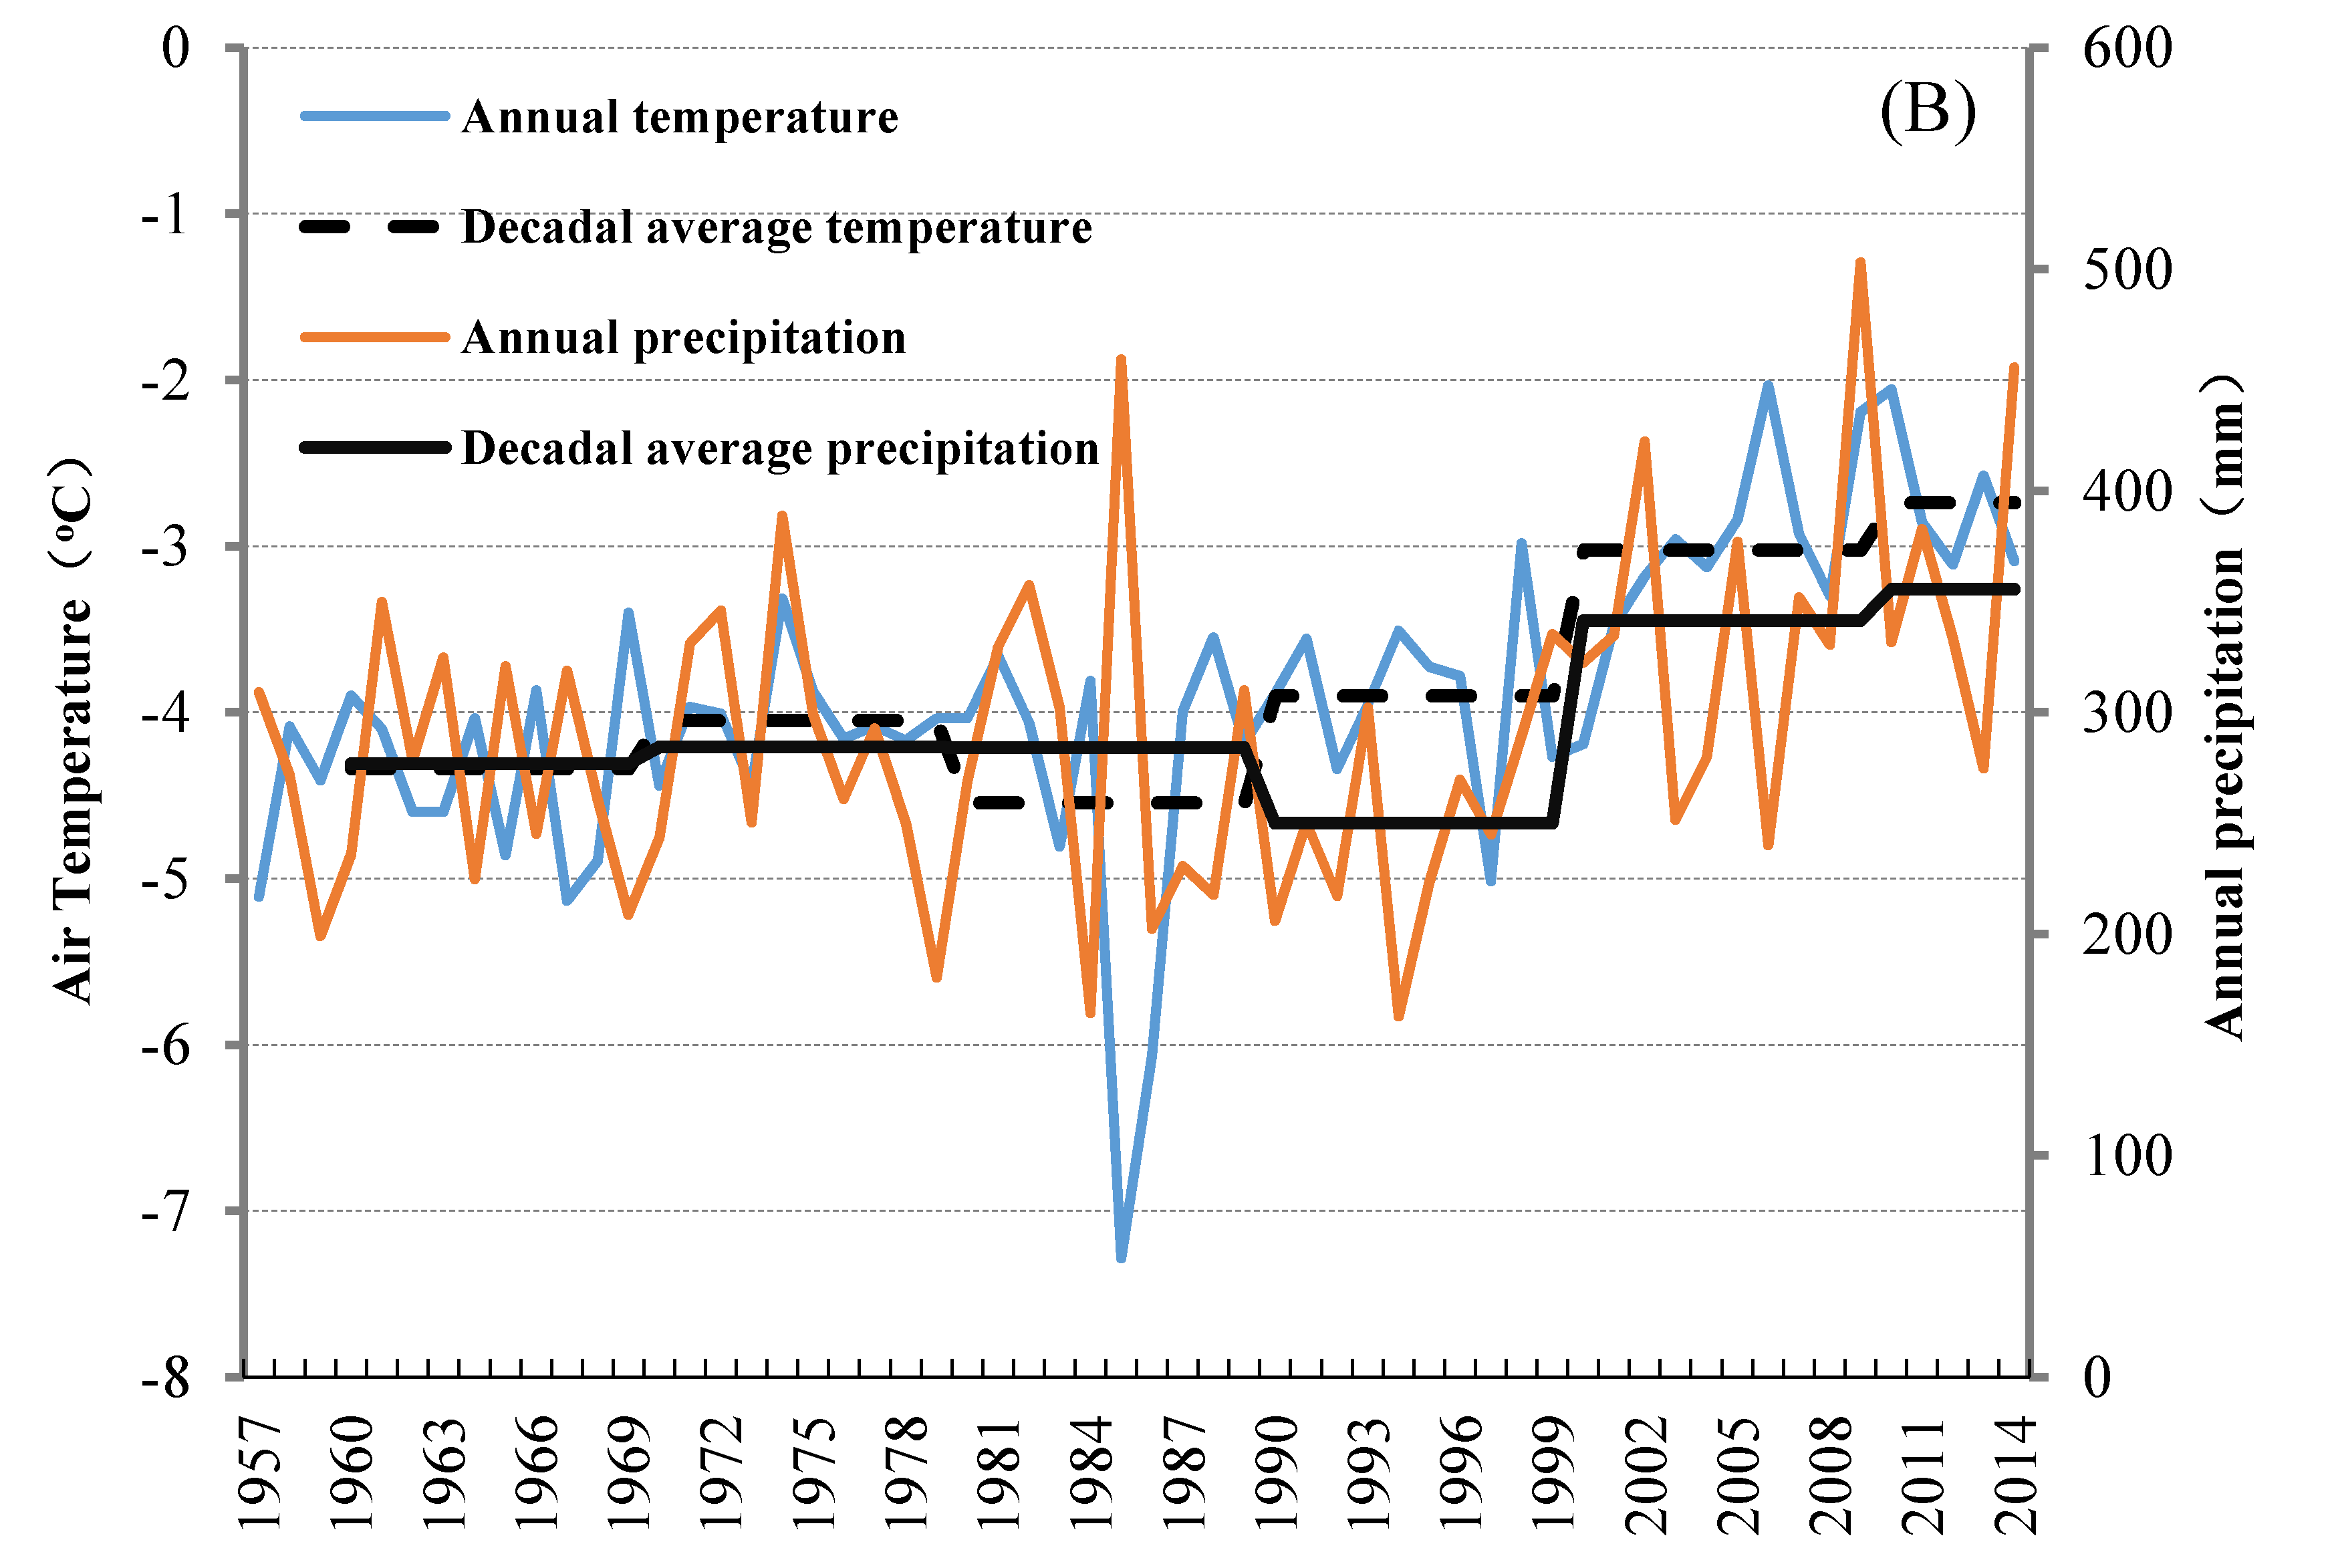
Studies have shown that air temperature and annual precipitation are the major causes of glacier changes, which affect the accumulation and the ablation of glaciers [1]. According to the recent data provided by the Tuotuohe meteorological station in the Geladandong Peak region, both temperature and precipitation increased from 1957–2014 (Figure 11). The temperature increased by 0.3 °C per decade and the precipitation increased by 12.7 mm per decade. In addition, the decadal means of temperature and precipitation showed significant upward trends. After 2000, the increases in temperature and precipitation became more significant.
The surface elevation changes of glaciers exhibited the same trend as the area change over the period 1970s to 2013. This trend is related to the climate change trend. The rising temperature is the major cause of glacier thickness reduction and area shrinkage. In the late 1980s, the temperature increased and the decrease in precipitation intensified glacial ablation and weakened accumulation, which aggravated glacier thickness reduction and area shrinkage after 2000. The increase of precipitation over the past 10 years did not weaken the trend of the shrinkage in the glacial area and the reduction in the glacier thickness.
5. Conclusions
In this study, the response of glaciers in the Geladandong Peak region in the central of the Tibetan Plateau to climate change is revealed based on the multi-temporal variations in glacier length, area and surface elevation. The conclusions are as follows:
- (1).
- From 1973–2013, glaciers retreated 412 ± 32 m on average, with a mean retreat rate of 10.3 ± 0.8 m·year−1 and a relative retreat rate of 5.6 ± 0.4%. The area of glacier decreased. The overall shrinkage was 7.5 ± 3.4%, which was greater than the decrease in length. The glacial area shrank by 2.8 ± 2.1% (0.18%·year−1), 1.9 ± 1.4% (0.16%·year−1), 1.4 ± 1.4% (0.23%·year−1) and 1.6 ± 1.4% (0.24%·year−1) during the periods 1973–1988, 1988–2000, 2000–2006, 2006–2013, respectively. The surface elevation of glaciers changed by −12.3 ± 1.4 m (−0.3 ± 0.04 m·year−1) from 1968 to 2013. From 1968–2000, 2000–2005 and 2000–2013, the mean variations of glacial surface elevation were −7.7 ± 1.4 m (−0.24 ± 0.04 m·year−1), −1.9 ± 1.4 m (−0.38 ± 0.25 m·year−1) and −5.0 ± 1.4 m (−0.38 ± 0.11 m·year−1), respectively. Both the shrinkage in glacier area and the reduction in surface elevation increased after 2000.
- (2).
- Eleven glaciers were identified as surging glaciers. Changes of the mass balance in surging glaciers were stronger than in non-surging glaciers between 1968 and 2013. Changes of area in surging glaciers were weaker than in non-surging glaciers.
- (3).
- Data provided by meteorological stations showed that, the increase in temperature was 0.3 °C per decade and that the precipitation increased by 12.7 mm per decade from 1957–2014. The shrinkage of the glacial area was primarily due to increasing temperature (mainly in summer). It is obvious that increasing temperature was the major cause of glacier thickness reduction and area shrinkage. The increase in precipitation, to a certain extent, inhibited glacial ablation but it did not change the status of the shrinkage in the glacial area and the reduction in the glacier thickness.
Supplementary Materials
The following are available online at https://www.mdpi.com/2073-4441/10/12/1749/s1, Table S1: Area changes of ten advancing glaciers from 1973 to 2013, Figures S1–S15: Surface changes on 15 surging/advancing glaciers.
Author Contributions
Conceptualization, J.X. and D.S.; Methodology, J.X.; Software, D.S.; Validation, J.X., D.S. and J.W.; Formal Analysis, J.X.; Investigation, J.W.; Resources, J.X.; Writing-Original Draft Preparation, J.X.; Writing-Review & Editing, D.S.; Funding Acquisition, D.S.
Funding
This research was funded by the Ministry of Science and Technology of China (MOST; Grant No.2013FY111400), the International Partnership Program of Chinese Academy of Sciences (Grant Nos. 131C11KYSB20160061 and XDA19070501), the China National Natural Science Foundation (Grant Nos. 41401084 and 41471060), and the Natural Science Foundation of Jiangsu Province (Grants No. BK20181059).
Acknowledgments
Our appreciation was extended to NASA for the provision of the Landsat TM data and SRTM data, as well as the China Meteorological Administration for climate data. We thank the editors and the anonymous reviewers for their constructive comments, which helped us to improve the paper.
Conflicts of Interest
The authors declare no conflicts of interest.
References
- IPCC. Climate Change 2013—The Physical Science Basis. Contribution of Working Group I to the Fifth Assessment Report of the Intergovernmental Panel on Climate Change; Stoker, T.F., Ed.; Cambridge University Press: Cambridge, UK, 2013. [Google Scholar]
- Xu, J.L.; Liu, S.Y.; Zhang, S.Q.; Guo, W.Q.; Wang, J. Recent Changes in Glacial Area and Volume on Tuanjiefeng Peak Region of Qilian Mountains, China. PLoS ONE 2013, 8, e70574. [Google Scholar] [CrossRef] [PubMed]
- Bao, W.J.; Liu, S.Y.; Wei, J.F.; Guo, W.Q. Glacier changes during the past 40 years in the Weat Kunlun Shan. J. Mt. Sci. 2015, 12, 344–357. [Google Scholar] [CrossRef]
- Li, G.; Lin, H.; Ye, Q. Heterogeneous decadal glacier downwasting at the Mt. Everest (Qomolangma) from 2000 to ~2012 based on multi-baseline bistatic SAR interferometry. Remote Sens. Environ. 2018, 206, 336–349. [Google Scholar] [CrossRef]
- Pieczonka, T.; Bolch, T.; Wei, J.F.; Liu, S.Y. Heterogeneous mass loss of glaciers in the Aksu-Tarim Catchment (Central Tien Shan) revealed by 1976 KH-9 Hexagon and 2009 SPOT-5 stereo imagery. Remote Sens. Environ. 2013, 130, 233–244. [Google Scholar] [CrossRef] [Green Version]
- Wei, J.F.; Liu, S.Y.; Guo, W.Q.; Xu, J.L.; Bao, W.J.; Shangguan, D. Changes in Glacier Volume in the North Bank of the Bangong Co Basin from 1968 to 2007 Based on Historical Topographic Maps, SRTM, and ASTER Stereo Images. Arct. Antarct. Alp. Res. 2015, 47, 301–311. [Google Scholar] [Green Version]
- Wei, J.F.; Liu, S.Y.; Xu, J.L.; Guo, W.Q.; Bao, W.J.; Shangguan, D.; Jiang, Z.L. Mass loss from glaciers in the Chinese Altai Mountains between 1959 and 2008 revealed based on historical maps, SRTM, and ASTER images. J. Mt. Sci. 2015, 12, 330–343. [Google Scholar] [CrossRef]
- Zhang, Y.; Fujita, K.; Liu, S.; Liu, Q.; Wang, X. Multi-decadal ice-velocity and elevation changes of a monsoonal maritime glacier: Hailuogou glacier, China. J. Glaciol. 2010, 56, 65–74. [Google Scholar] [CrossRef]
- Li, J.; Liu, S.Y.; Shangguan, D.; Zhang, Y.S. Identification of Ice Elevation Change of the Shuiguan River No. 4 Glacier in the Qilian Mountains, China. J. Mt. Sci. 2010, 7, 375–379. [Google Scholar] [CrossRef]
- Ma, L.L.; Tian, L.D.; Pu, J.C.; Wang, P.L. Recent area and ice volume change of Kangwure Glacier in the middle of Himalayas. Chin. Sci. Bull. 2010, 55, 2088–2096. [Google Scholar] [CrossRef]
- Shangguan, D.H.; Liu, S.Y.; Ding, Y.J.; Zhang, Y.S.; Li, X.Y.; Wu, Z. Changes in the elevation and extent of two glaciers along the Yanglonghe river, Qilian Shan, China. J. Glaciol. 2010, 56, 309–317. [Google Scholar] [CrossRef]
- Zhang, Y.S.; Liu, S.Y.; Shangguan, D.; Li, J.; Zhao, J.D. Thinning and Shrinkage of Laohugou No. 12 Glacier in the Western Qilian Mountains, China, from 1957 to 2007. J. Mt. Sci. 2012, 9, 343–350. [Google Scholar] [CrossRef]
- Bu, J.J.; He, W.H.; Zhu, Y.H.; Niu, Z.J.; Zeng, B.F. Main geological factors resulting in vegetation degeneration and soil erosion in the source region of the Yangtze river. Geol. Miner. Resour. South China 2001, 1, 70–74. [Google Scholar]
- Yao, Z.; Liu, Z.; Huang, H.; Liu, G.; Wu, S. Statistical estimation of the impacts of glaciers and climate change on river runoff in the headwaters of the Yangtze River. Quat. Int. 2014, 336, 89–97. [Google Scholar] [CrossRef]
- Wang, Y.; Wu, L.Z.; Xu, J.L.; Liu, S.Y. Variation and uncertainty of the glaciers in the past 50 years in Geladandong of Tibetan Plateau. J. Glaciol. Geocryol. 2013, 35, 255–262. [Google Scholar]
- Shi, Y.F. Concise Glacier Inventory of China; Shanghai Popular Science Press: Shanghai, China, 2008. [Google Scholar]
- Shangguan, D.H.; Liu, S.Y.; Ding, Y.J.; Wu, L.Z.; Deng, W.; Guo, W.Q.; Wang, Y.; Xu, J.L.; Yao, X.J.; Guo, Z.L.; et al. Glacier changes in the Koshi River basin, central Himalaya, from 1976 to 2009, derived from remote-sensing imagery. Ann. Glaciol. 2014, 55, 61–68. [Google Scholar] [CrossRef]
- Xu, J.L. Glacier Changes in Tianshan Mountains Based on Optical Remote Sensing; University of Chinese Academy of Sciences (UCAS): Beijing, China, 2008. [Google Scholar]
- Kapitsa, V.; Shahgedanova, M.; Machguth, H.; Severskiy, I.; Medeu, A. Assessment of evolution and risks of glacier lake outbursts in the Djungarskiy Alatau, Central Asia, using Landsat imagery and glacier bed topography modelling. Natl. Hazards Earth Syst. Sci. 2017, 17, 1837–1856. [Google Scholar] [CrossRef] [Green Version]
- State Bureau of Surveying and Mapping. Technical Rules for Producing Digital Products of 1:10000 1:50000 Fundamental Geographic Information, CH/T 1015.1-2007; State Bureau of Surveying and Mapping: Beijing, China, 2007.
- Aniya, M.; Sato, H.; Naruse, R.; Casassa, G. The use of satellite and airborne imagery to inventory outlet glaciers of the Southern Patagonian Icefield, South America. Photogramm. Eng. Remote Sens. 1996, 62, 1361–1369. [Google Scholar]
- Anul Haq, M.; Jain, K.; Menon, K. Change Monitoring of Gangotri Glacier using Remote Sensing. Int. J. Soft Comput. Eng. 2012, 1, 259–261. [Google Scholar]
- Li, Z.; Sun, W.; Zeng, Z. Measurements of glacier variation in the Tibetan Plateau using Landsat data. Remote Sens. Environ. 1998, 63, 258–264. [Google Scholar] [CrossRef]
- Paul, F. Evaluation of different methods for glacier mapping using Landsat, T.M. In Proceedings of the Workshop on Remote Sensing of Land Ice and Snow, Dresden, Germany, 16–17 June 2000. [Google Scholar]
- Rott, H. Thematic Studies in Alpine Areas by Means of Polarimetric Sar and Optical Imagery. Remote Sens. Earths Surf. Atmos. 1993, 14, 217–226. [Google Scholar] [CrossRef]
- Shangguan, D.H.; Liu, S.Y.; Ding, Y.J.; Ding, L.F. Glacier Changes at the Head of Yurungkax River in the West Kunlun Mountains in the Past 32 Years. Acta Geogr. Sin. 2004, 59, 855–862. [Google Scholar]
- Xu, J.L.; Liu, S.Y.; Zhang, S.Q.; Shangguan, D.H. Glaciers fluctuations in the Karamilan Keriya River Watershed in the past 30 years. J. Glaciol. Geocryol. 2006, 28, 312–318. [Google Scholar]
- Guo, W.Q.; Liu, S.Y.; Xu, J.L.; Wu, L.Z.; Shangguan, D. The second Chinese glacier inventory: Data, methods, and results. J. Glaciol. 2015, 61, 357–372. [Google Scholar] [CrossRef]
- Guo, W.Q.; Liu, S.Y.; Yu, P.C.; Xu, J.L. Automatic extraction of ridgelines using on drainage boundaries and aspect difference. Sci. Surv. Mapp. 2011, 6, 210–212. [Google Scholar]
- Hall, D.K.; Bayr, K.J.; Schöner, W.; Bindschadler, R.A.; Chien, J.Y. Consideration of the errors inherent in mapping historical glacier positions in Austria from the ground and space (1893–2001). Remote Sens. Environ. 2003, 86, 566–577. [Google Scholar] [CrossRef]
- Bolch, T.; Yao, T.; Kang, S.; Buchroithner, M.F.; Scherer, D.; Maussion, F.; Huintjes, E.; Schneider, C. A glacier inventory for the western Nyainqentanglha Range and the Nam Co Basin, Tibet, and glacier changes 1976–2009. Cryosphere 2010, 4, 419–433. [Google Scholar] [CrossRef] [Green Version]
- Le Bris, R.; Paul, F. An automatic method to create flow lines for determination of glacier length: A pilot study with Alaskan glaciers. Comput. Geosci. 2013, 52, 234–245. [Google Scholar] [Green Version]
- Gao, Y.J.; Zang, D.F. The conversion method and accuracy analysis between WGS-84 coordinate system and Xi’an 80 coordinate system. Eng. Surv. Mapp. 2009, 18, 55–57. [Google Scholar]
- Berthier, E.; Arnaud, Y.; Vincent, C.; Rémy, F. Biases of SRTM in high-mountain areas: Implications for the monitoring of glacier volume changes. Geophys. Res. Lett. 2006, 33, 153–172. [Google Scholar] [CrossRef]
- Nuth, C.; Kääb, A. Co-registration and bias corrections of satellite elevation data sets for quantifying glacier thickness change. Cryosphere 2011, 5, 271–290. [Google Scholar] [CrossRef] [Green Version]
- Schiefer, E.; Menounos, B.; Wheate, R. Recent volume loss of British Columbian glaciers, Canada. Geophys. Res. Lett. 2007, 34. [Google Scholar] [CrossRef] [Green Version]
- Van Niel, T.G.; McVicar, T.R.; Li, L.T.; Gallant, J.C.; Yang, Q.K. The impact of misregistration on SRTM and DEM image differences. Remote Sens. Environ. 2008, 112, 2430–2442. [Google Scholar] [CrossRef]
- Gardelle, J.; Berthier, E.; Arnaud, Y. Impact of resolution and radar penetration on glacier elevation changes computed from DEM differencing. J. Glaciol. 2012, 58, 419–422. [Google Scholar] [CrossRef] [Green Version]
- Paul, F. Calculation of glacier elevation changes with SRTM: Is there an elevation-dependent bias? J. Glaciol. 2008, 54, 945–946. [Google Scholar] [CrossRef] [Green Version]
- Rignot, E.; Echelmeyer, K.; Krabill, W. Penetration depth of interferometric synthetic-aperture radar signals in snow and ice. Geophys. Res. Lett. 2001, 28, 3501–3504. [Google Scholar] [CrossRef] [Green Version]
- Shangguan, D.; Liu, S.Y.; Ding, Y.J.; Ding, L.F.; Xu, J.L.; Jing, L. Glacier changes during the last forty years in the Tarim Interior River basin, northwest China. Prog. Natl. Sci. 2009, 19, 727–732. [Google Scholar] [CrossRef]
- Xu, J.L.; Liu, S.Y.; Guo, W.Q.; Zhang, Z.; Wei, J.F.; Feng, T. Glacial Area Changes in the Ili River Catchment (Northeastern Tian Shan) in Xinjiang, China, from the 1960s to 2009. Adv. Meteorol. 2015, 2015. [Google Scholar] [CrossRef]
- Grant, K.L.; Stokes, C.R.; Evans, I.S. Identification and characteristics of surge-type glaciers on Novaya Zemlya, Russian Arctic. J. Glaciol. 2009, 55, 960–972. [Google Scholar] [CrossRef] [Green Version]
- Sund, M.; Eiken, T.; Hagen, J.O.; Kaab, A. Svalbard surge dynamics derived from geometric changes. Ann. Glaciol. 2009, 50, 50–60. [Google Scholar] [CrossRef]
- Hooker, B.L.; Fitzharris, B.B. The correlation between climatic parameters and the retreat and advance of Franz Josef Glacier, New Zealand. Glob. Planet. Chang. 1999, 22, 39–48. [Google Scholar] [CrossRef]
- Larsen, N.K.; Funder, S.; Linge, H.; Möller, P.; Schomacker, A.; Fabel, D.; Xu, S.; Kjær, K.H. A Younger Dryas re-advance of local glaciers in north Greenland. Quat. Sci. Rev. 2016, 147, 47–58. [Google Scholar] [CrossRef] [Green Version]
- Cuffey, K.M.; Paterson, W.S.B. The Physics of Glaciers, 4th ed.; Pergamon Press: Pergamon, Turkey, 2010; pp. 453–510. [Google Scholar]
- Zhang, J.; He, X.; Ye, B.; Wu, J. Recent variation of mass balance of the Xiao Dongkemadi Glacier in the Tanggula range and its influenceing factors. J. Glaciol. Geocryol. 2013, 35, 263–271. [Google Scholar]
- Gardelle, J.; Berthier, E.; Arnaud, Y.; Kääb, A. Region-wide glacier mass balances over the Pamir-Karakoram-Himalaya during 1999–2011. Cryosphere 2013, 7, 1263–1286. [Google Scholar] [CrossRef] [Green Version]
- Shangguan, D.; Liu, S.; Ding, Y.; Guo, W.; Xu, B.; Xu, J.; Jiang, Z. Characterizing the May 2015 Karayaylak Glacier surge in the eastern Pamir Plateau using remote sensing. J. Glaciol. 2016, 62, 944–953. [Google Scholar] [CrossRef]
- Sund, M.; Lauknes, T.R.; Eiken, T. Surge dynamics in the Nathorstbreen glacier system, Svalbard. Cryosphere 2014, 8, 623–638. [Google Scholar] [CrossRef] [Green Version]
- Shahgedanova, M.; Nosenko, G.; Kutuzov, S.; Rototaeva, O.; Khromova, T. Deglaciation of the Caucasus Mountains, Russia/Georgia, in the 21st century observed with ASTER satellite imagery and aerial photography. Cryosphere 2014, 8, 2367–2379. [Google Scholar] [CrossRef] [Green Version]
- Shangguan, D.H.; Bolch, T.; Ding, Y.J.; Kröhnert, M.; Pieczonka, T.; Wetzel, H.U.; Liu, S.Y. Mass changes of Southern and Northern Inylchek Glacier, Central Tian Shan, Kyrgyzstan, during ∼1975 and 2007 derived from remote sensing data. Cryosphere 2015, 9, 703–717. [Google Scholar] [CrossRef]
- Wei, J.F.; Liu, S.Y.; Guo, W.Q.; Yao, X.J.; Xu, J.L.; Bao, W.J.; Jiang, Z.L. Surface-area changes of glaciers in the Tibetan Plateau interior area since the 1970s using recent Landsat images and historical maps. Ann. Glaciol. 2014, 55, 213–222. [Google Scholar] [Green Version]
Figure 1.
The location map of the study area and the main glacier codes.

Figure 2.
Digital elevation models (DEMs) data range in four phases and the distribution of Geoscience Laser Altimeter System (GLAS) and Global Positioning System (GPS) measuring points.
Figure 2.
Digital elevation models (DEMs) data range in four phases and the distribution of Geoscience Laser Altimeter System (GLAS) and Global Positioning System (GPS) measuring points.

Figure 3.
Elevation differences between SRTM band and GPS as a function of altitude before and after adjustment.
Figure 3.
Elevation differences between SRTM band and GPS as a function of altitude before and after adjustment.

Figure 4.
Elevation differences between SRTM X band and C band as a function of altitude.

Figure 5.
Elevation differences between SRTM band and DEM1968, DEM2005 and DEM2013 as a function of maximum curvature.
Figure 5.
Elevation differences between SRTM band and DEM1968, DEM2005 and DEM2013 as a function of maximum curvature.

Figure 6.
The elevation differences between DEM1968, DEM2005 and DEM2013 and SRTM as a function of aspect over the ice-free area. (A) SRTM–DEM1968, (B) DEM2005–SRTM and (C) DEM2013–SRTM.
Figure 6.
The elevation differences between DEM1968, DEM2005 and DEM2013 and SRTM as a function of aspect over the ice-free area. (A) SRTM–DEM1968, (B) DEM2005–SRTM and (C) DEM2013–SRTM.

Figure 7.
Changes of the glacial area in the Geladandong Peak region from 1973–2013.

Figure 8.
Changes in the length of 3 glaciers with strong retreat and 10 advancing glaciers in the Geladandong Peak region from 1973–2013.
Figure 8.
Changes in the length of 3 glaciers with strong retreat and 10 advancing glaciers in the Geladandong Peak region from 1973–2013.

Figure 9.
Changes in glacial surface elevation from 1968–2013.

Figure 10.
Changes of glaciers 5Z221H0011, 5K451F0040 and 5K444B0064 from 1973 to 2013.

Figure 11.
Relationship between glacier change and temperature and precipitation. (A) Glacier changes in area from 1973 to 2013 and glacier elevation surface changes from 1968 to 2013; (B) Air temperature and annual precipitation changes from 1957 to 2014.
Figure 11.
Relationship between glacier change and temperature and precipitation. (A) Glacier changes in area from 1973 to 2013 and glacier elevation surface changes from 1968 to 2013; (B) Air temperature and annual precipitation changes from 1957 to 2014.


Table 1.
Multi-temporal remote sensing images of glaciers on Geladandong Peak.
| Satellite/Sensor | Path | Raw | Acquisition Time (year-month-day) | GCPs Accuracy (m) | Note |
|---|---|---|---|---|---|
| Landsat MSS | 149 | 37 | 1973-6-10 | 33.9 | Auxiliary |
| 149 | 37 | 1973-7-16 | 30.8 | Chief | |
| Landsat 5 TM | 138 | 37 | 1988-11-24 | 4.3 | Chief |
| 138 | 37 | 2000-02-11 | 5.6 | Snow check | |
| 138 | 37 | 2000-02-20 | 6.1 | Snow check | |
| 138 | 37 | 2000-8-21 | 4.8 | Chief | |
| 138 | 37 | 2001-7-23 | 4.0 | Auxiliary | |
| 138 | 37 | 2006-8-6 | 3.8 | Chief | |
| 138 | 37 | 2007-5-5 | 3.8 | Auxiliary | |
| Landsat 8 OLI | 138 | 37 | 2013-8-9 | 4.5 | Chief |
| 138 | 37 | 2014-5-24 | 4.1 | Auxiliary |
Table 2.
Comparison of DEM1968, SRTM, DEM2005 and DEM2013 with GPS and GLAS.
| DEMs | GPS Points | GLAS Points | ||||
|---|---|---|---|---|---|---|
| Quantity | Difference/m | RMSE/m | Quantity | Difference/m | RMSE/m | |
| DEM1968 | 5 | −24 | 10.8 | 768 | 8.7 | 15.4 |
| SRTM | 39 | −4 | 4.5 | 2109 | 0.1 | 4.7 |
| DEM2005 | 8 | −4 | 6.8 | 1321 | −9.9 | 18.4 |
| DEM2013 | 1 | / | / | 1128 | −5 | 13.2 |
Table 3.
Changes in glaciers of different area grades in the Geladandong Peak region from 1973–2013.
Table 3.
Changes in glaciers of different area grades in the Geladandong Peak region from 1973–2013.
| Area (km2) | Annual Change (%·year−1) | ||||
|---|---|---|---|---|---|
| 1973–1988 | 1988–2000 | 2000–2006 | 2006–2013 | 1973–2013 | |
| <0.5 | −0.85 | −0.74 | −0.48 | −1.02 | −0.71 |
| 0.5–1 | −0.34 | −0.36 | −0.35 | −0.60 | −0.37 |
| 1–5 | −0.25 | −0.20 | −0.30 | −0.27 | −0.24 |
| 5–10 | −0.13 | −0.21 | −0.25 | −0.10 | −0.16 |
| >10 | −0.17 | −0.13 | −0.21 | −0.23 | −0.17 |
| Mean | −0.18 | −0.16 | −0.23 | −0.24 | −0.19 |
Table 4.
Surging glaciers in Geladandong Peak region.
| Glacier ID | Surging Time | Increased Glacier Length (m) |
|---|---|---|
| 5K444B0064 | 2013–2014 | Not calculated |
| 5K451F0008 | 2000–2006 | 0 ± 21.2 |
| 5K451F0012 | 1973–2000 | 892 ± 32.2 |
| 5K451F0030 | 2000–2006 | 284 ± 21.2 |
| 5K451F0033 | 1988–2000 | 0 ± 21.2 |
| 5K451F0036 | 2000–2006 | 3 ± 21.2 |
| 5Z213A0004 | 1973–2000 | 135 ± 32.2 |
| 5Z213A0009 | 1988–2000 | 0 ± 21.2 |
| 5Z213B0003 | 2000–2013 | 0 ± 21.2 |
| 5Z213B0015 | 1973–1988 | 495 ± 32.2 |
| 5Z213B0016 | 1988–2000 | 479 ± 21.2 |
Table 5.
Glacier surface elevation changes of ten advancing glaciers from 1968 to 2013.
| Glaciers ID | Elevation Changes (m) | |||||
|---|---|---|---|---|---|---|
| 1968–2000 | 2000–2005 | 2000–2013 | ||||
| Total (m) | Annual (m) | Total (m) | Annual (m·year−1) | Total (m) | Annual (m·year−1) | |
| 5K444B0039 | −12.42.36 | −0.39 ± 0.07 | −1.9 ± 1.41 | −0.38 ± 0.28 | −6.6 ± 1.85 | −0.51 ± 0.14 |
| 5K444B0064 | −19.2 ± 3.46 | −0.6 ± 0.11 | 1.2 ± 0.95 | 0.24 ± 0.2 | 0.9 ± 0.25 | 0.07 ± 0.02 |
| 5K451F0008 | −11.28 ± 2.03 | −0.35 ± 0.06 | −1.48 ± 1.17 | −0.3 ± 0.25 | −4.1 ± 1.15 | −0.32 ± 0.09 |
| 5K451F0012 | −7.7 ± 1.46 | −0.24 ± 0.05 | −2.3 ± 1.7 | −0.46 ± 0.34 | −6.2 ± 1.74 | −0.48 ± 0.13 |
| 5K451F0030 | −11.4 ± 2.17 | −0.36 ± 0.07 | −0.1 ± 0.07 | −0.02 ± 0.01 | −3.4 ± 0.95 | −0.26 ± 0.07 |
| 5K451F0033 | −12.6 ± 2.27 | −0.39 ± 0.07 | 0.8 ± 0.63 | 0.16 ± 0.13 | / | / |
| 5K451F0036 | −10 ± 1.9 | −0.31 ± 0.06 | 5 ± 3.7 | 1 ± 0.74 | / | / |
| 5K451F0047 | −9.5 ± 1.81 | −0.3 ± 0.06 | −7 ± 5.18 | −1.4 ± 1.04 | / | / |
| 5Z213A0004 | −8.2 ± 1.56 | −0.26 ± 0.05 | −5 ± 3.7 | −1 ± 0.74 | / | / |
| 5Z213A0007 | 15.7 ± 2.98 | 0.49 ± 0.09 | −1.1 ± 0.81 | −0.22 ± 0.16 | / | / |
| 5Z213A0009 | −2.3 ± 0.41 | −0.07 ± 0.01 | 0.72 ± 0.57 | 0.14 ± 0.12 | / | / |
| 5Z213B0001 | −10.6 ± 2.01 | −0.33 ± 0.06 | 3.1 ± 2.29 | 0.62 ± 0.46 | / | / |
| 5Z213B0003 | −20.1 ± 3.62 | −0.63 ± 0.11 | 0.87 ± 0.69 | 0.17 ± 0.15 | 2.6 ± 0.73 | 0.2 ± 0.06 |
| 5Z213B0014 | −1.4 ± 0.25 | −0.04 ± 0.01 | 0.5 ± 0.4 | 0.10 ± 0.08 | / | / |
| 5Z213B0015 | −4.7 ± 0.89 | −0.15 ± 0.03 | −2.1 ± 1.55 | −0.42 ± 0.31 | 2.1 ± 0.59 | 0.16 ± 0.05 |
| 5Z213B0016 | −14.2 ± 2.7 | −0.44 ± 0.08 | −4.2 ± 3.11 | −0.84 ± 0.62 | −5.3 ± 1.48 | −0.41 ± 0.11 |
© 2018 by the authors. Licensee MDPI, Basel, Switzerland. This article is an open access article distributed under the terms and conditions of the Creative Commons Attribution (CC BY) license (http://creativecommons.org/licenses/by/4.0/).
Share and Cite
MDPI and ACS Style
Xu, J.; Shangguan, D.; Wang, J. Three-Dimensional Glacier Changes in Geladandong Peak Region in the Central Tibetan Plateau. Water 2018, 10, 1749. https://doi.org/10.3390/w10121749
AMA Style
Xu J, Shangguan D, Wang J. Three-Dimensional Glacier Changes in Geladandong Peak Region in the Central Tibetan Plateau. Water. 2018; 10(12):1749. https://doi.org/10.3390/w10121749
Chicago/Turabian StyleXu, Junli, Donghui Shangguan, and Jian Wang. 2018. "Three-Dimensional Glacier Changes in Geladandong Peak Region in the Central Tibetan Plateau" Water 10, no. 12: 1749. https://doi.org/10.3390/w10121749
Note that from the first issue of 2016, this journal uses article numbers instead of page numbers. See further details here.