How do Soil Moisture and Vegetation Covers Influence Soil Temperature in Drylands of Mediterranean Regions?


1
Instituto de Geografía, Pontificia Universidad Católica de Chile, Avda. Vicuña Mackenna 4860, Santiago de Chile 7820436, Chile
2
Research Institute for Sustainable Land Development, University of Extremadura, Avda. Universidad s/n. 10071 Cáceres, Spain
3
Department of Chemistry, Life Sciences and Environmental Sustainability, University of Parma, Viale delle Scienze 11/A, 43124 Parma, Italy
*
Author to whom correspondence should be addressed.
Water 2018, 10(12), 1747; https://doi.org/10.3390/w10121747
Submission received: 27 October 2018
/
Revised: 24 November 2018
/
Accepted: 25 November 2018
/
Published: 28 November 2018
(This article belongs to the Special Issue Soil Hydrology for a Sustainable Land Management: Theory and Practice)
Abstract
:Interactions between land and atmosphere directly influence hydrometeorological processes and, therefore, the local climate. However, because of heterogeneity of vegetation covers these feedbacks can change over small areas, becoming more complex. This study aims to define how the interactions between soil moisture and vegetation covers influence soil temperatures in very water-limited environments. In order to do that, soil water content and soil temperature were continuously monitored with a frequency of 30 min over two and half hydrological years, using capacitance and temperature sensors that were located in open grasslands and below tree canopies. The study was carried out on three study areas located in drylands of Mediterranean climate. Results highlighted the importance of soil moisture and vegetation cover in modifying soil temperatures. During daytime and with low soil moisture conditions, daily maximum soil temperatures were, on average, 7.1 °C lower below tree canopies than in the air, whereas they were 4.2 °C higher in grasslands than in the air. As soil wetness decreased, soil temperature increased, although this effect was significantly weaker below tree canopies than in grasslands. Both high soil water content and the effect of shading were reflected in a decrease of maximum soil temperatures and of their daily amplitudes. Statistical analysis emphasized the influence of soil temperature on soil water reduction, regardless of vegetation cover. If soil moisture deficits become more frequent due to climate change, variations in soil temperature could increase, affecting hydrometeorological processes and local climate.
1. Introduction
Soil temperature is a key factor in determining energy and mass exchange with the atmosphere. It strongly affects the water balance and ecohydrological processes, such as evapotranspiration ratios and water uptake by plants. Conversely, soil water influences the energy balance and hydrometeorological processes by determining the partition of available solar energy between latent and sensible heat, both manifested as evaporated water and as heat of air and land, respectively [1]. Soil wetness and vegetation will determine the gradient of these energy fluxes. For example, soil moisture deficits could lead to more frequent and severe hot summer temperatures [2]. Similarly, variations in vegetation cover or changes in vegetation growth and renewal could modify feedbacks between the surface and the atmosphere and, therefore, the local climate [3]. Therefore, an appropriate understanding of the relationships between hydrometeorological processes and vegetation covers would enable better decision-making and could contribute to provide a more resilient environment.
The role of hydrometeorological processes could be particularly important in drylands of Mediterranean regions, where the upcoming climate is expected to be warmer and drier [4]. Some environments included in these lands are the silvopastoral systems of California, Australia, Chile or the Iberian Peninsula. They occupy important extensions of a human-made landscape which is the consequence of long-term management, and result in an open woodland where scattered evergreen trees play a critical role, both economically and environmentally [5]. Trees usually present a canopy cover up to 40% [6], meaning that a large land surface is below their canopies. Because of this vegetation distribution, hydrometeorological processes could present heterogeneous behavior since they may change over small areas, i.e., between open grasslands and tree canopies [7]. For example, spaces below tree canopies can show different microclimate and plant phenology than those from open grasslands [8]. The ability to assess hydrometeorological processes across scales constitutes a challenge due to the heterogeneity of the land surface and the complexity of the processes involved [9].
Vegetation covers influence the distribution of several variables above and below ground. A consensus is that tree canopies modify water and energy balances below them by intercepting rainfall and solar radiation. Thus, temperatures have usually been considered to be lower below tree canopies than in grasslands in summer, and the opposite in winter [8,10,11,12]. Conversely, the influence of vegetation cover on soil water content has been a more controversial issue since it has been found to be lower under tree crowns than in grasslands in drylands and humid lands, although opposite results have also been observed [13,14,15,16]. However, interactions between soil moisture and soil temperature have been a less frequent topic, and existing studies have usually been carried out under controlled laboratory conditions or without using continuous readings of the target variables. For example, some studies have found inverse relationships between soil water content and daily surface soil temperatures [17,18,19,20]. Despite this, few field studies have compared patterns of soil and air temperatures using continuous and high-frequency measurements, and considering the combined effect of soil moisture and vegetation covers [12].
The interactions between vegetation covers and hydrometeorological processes have been receiving increased interest, nevertheless most of the studies come mainly from the climate modelling community and have usually been focused at continental or global scale [7,21,22]. Likewise, techniques based on spacecraft sensors constitute a very powerful approach to analyze these processes, although the current coarse resolution could increase the uncertainty of measurements when the spatial variability of environmental processes is large. For example, it has been observed that soil wetness could reduce the daily temperature range (DTR) in semiarid regions by increasing the nighttime soil temperature, so soil moisture would reduce the impact of daily evaporative cooling by reducing nocturnal cooling [23]. However, it has also been hypothesized that the reduction of soil moisture and vegetation cover would decrease the diurnal temperature range during episodes of drought and human mismanagement by increasing nighttime surface air temperature [24]. These conflicting results provide evidence that the combined effect of soil moisture and vegetation covers on soil temperatures is not completely understood, and emphasize the necessity to develop studies using more accurate measurements in order to capture the spatial variability occurring between vegetation covers, i.e., in grasslands and under tree crowns.
The focus of this work was, therefore, to define the combined effect of soil moisture and vegetation covers on soil temperatures in dryland ecosystems, in order to understand the complexity of involved feedbacks and overcome the scarcity of field observations for characterizing the relevant processes in these water-sensitive areas. Thus, the following questions were addressed: (I) How does the interaction between soil moisture and different vegetation covers affect the relationships between soil temperature and air temperature? (II) What are the main factors affecting soil drying under different vegetation covers? An understanding of the relationships between these variables could help to explain the feedback between soil water and temperature.
2. Study Areas
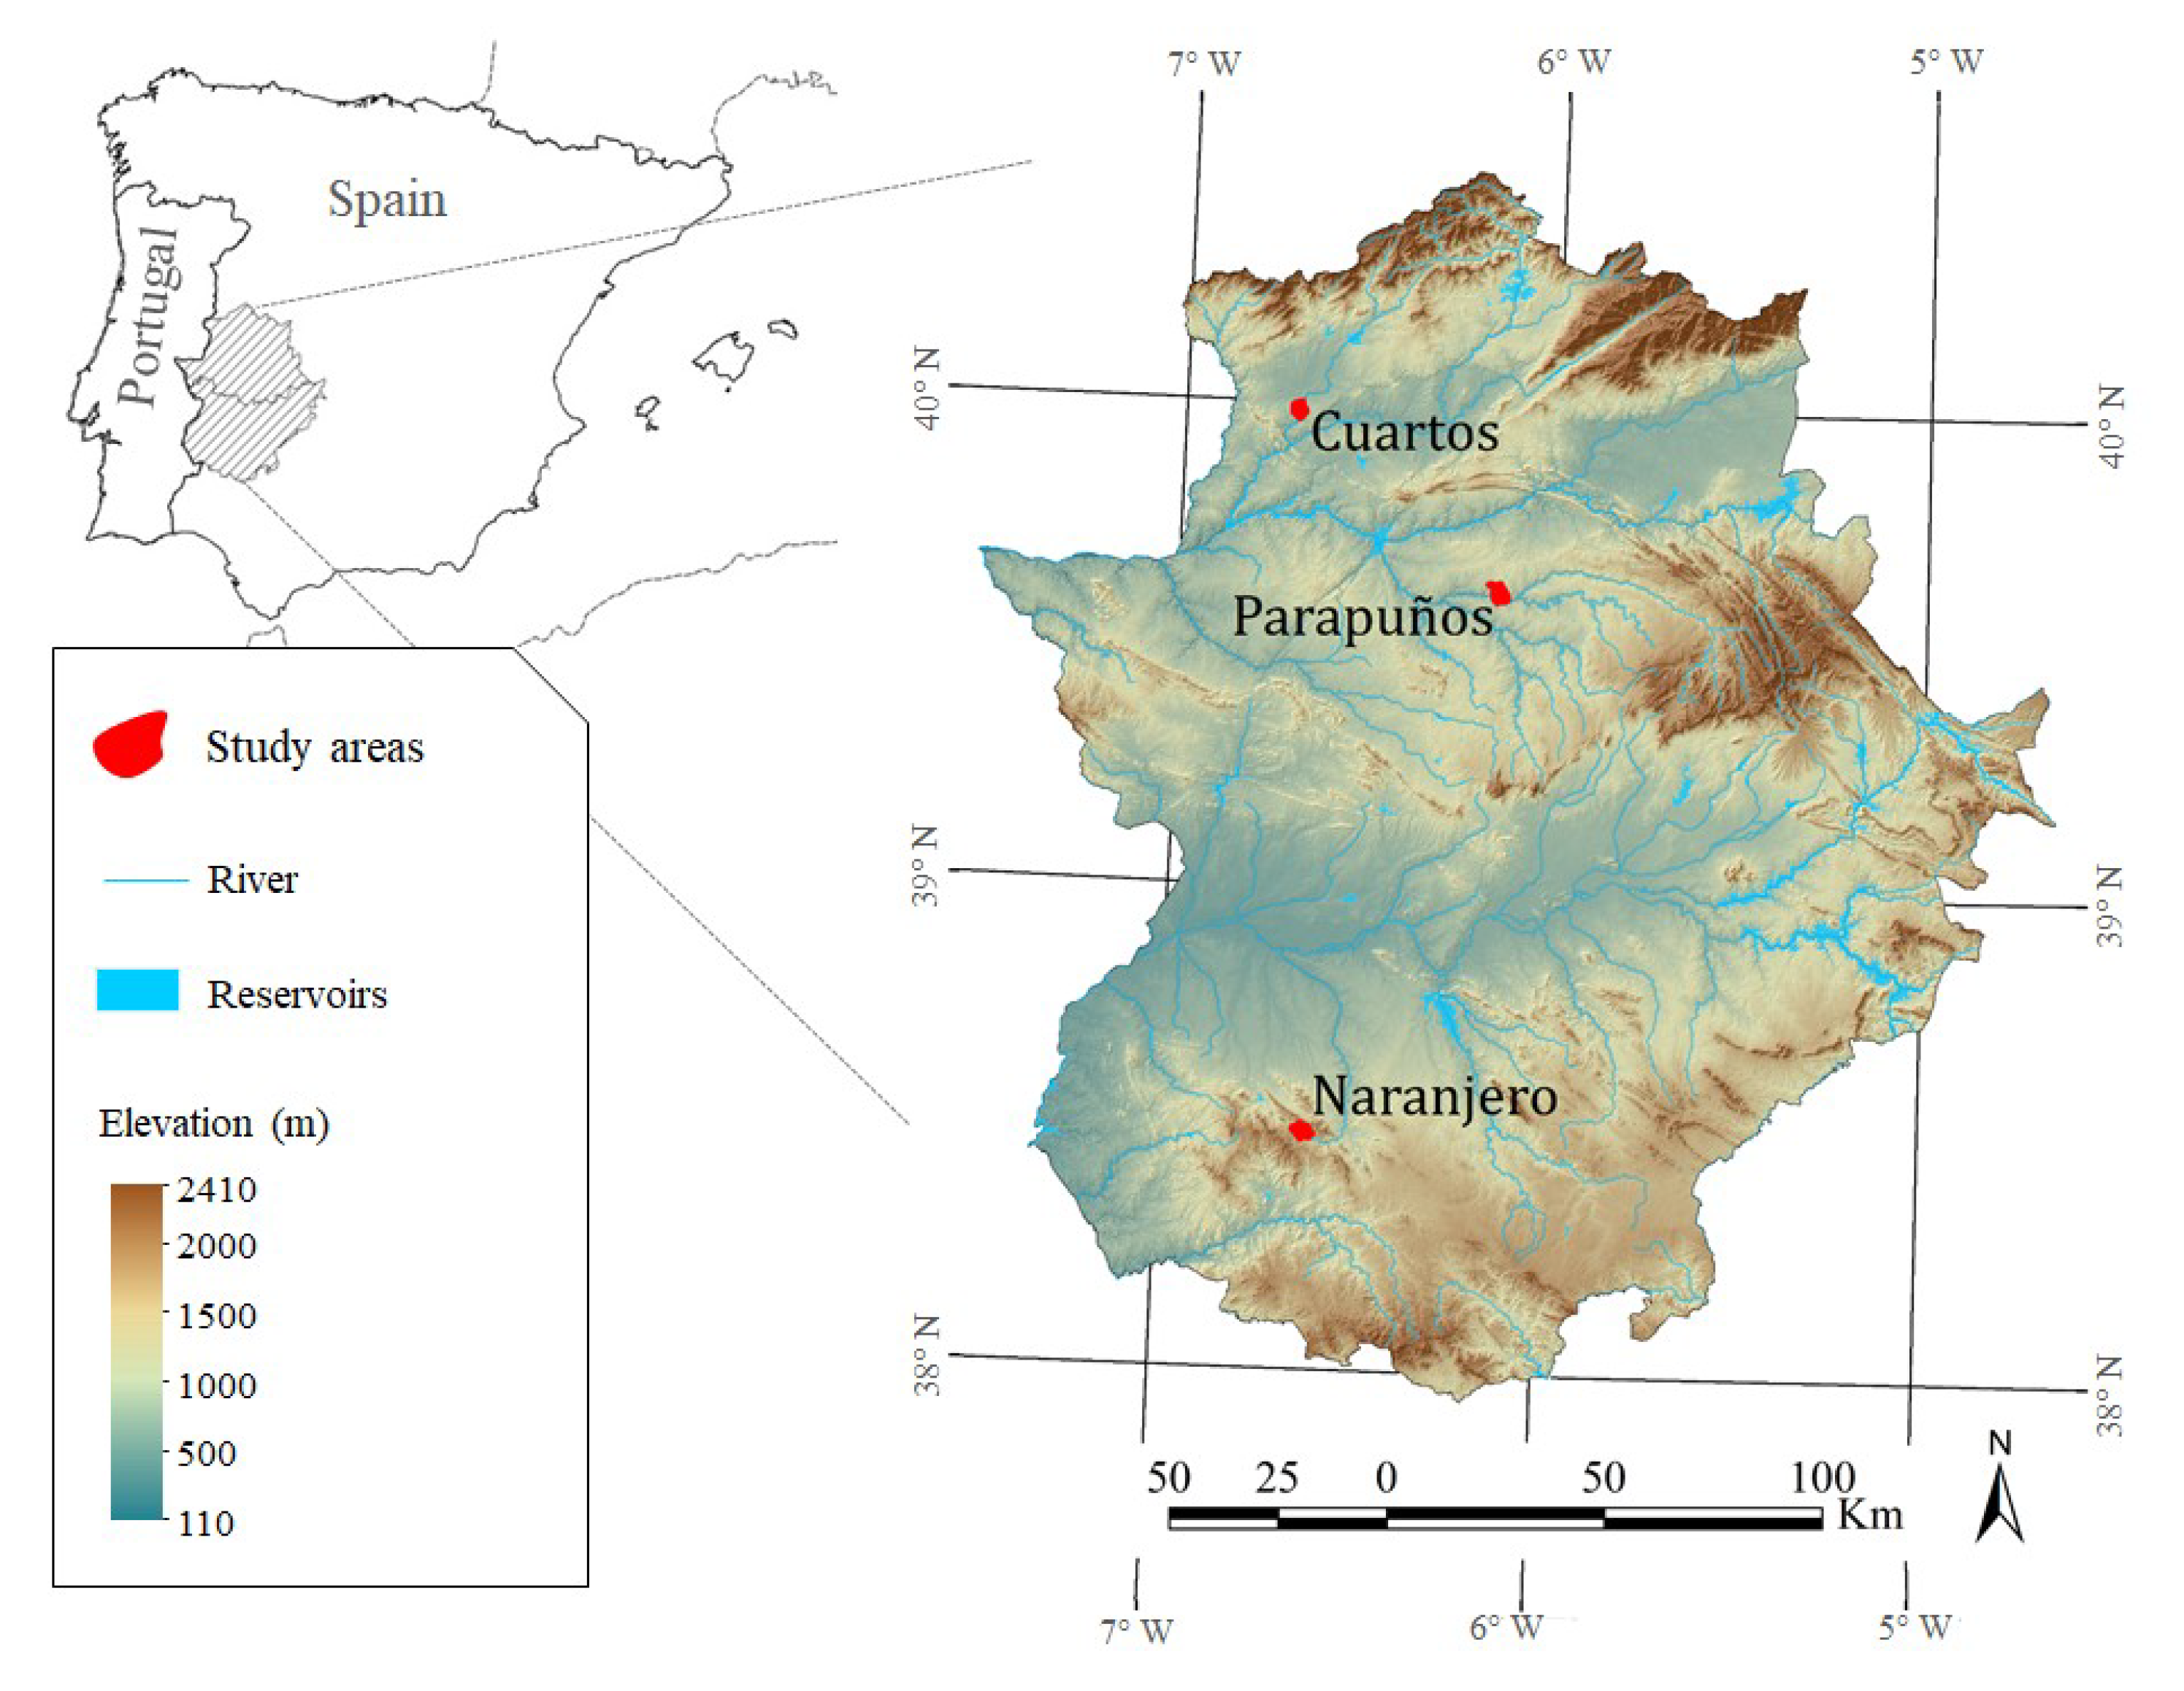
The study was conducted in three study areas of the SW of the Iberian Peninsula: Cuartos, Naranjero, and Parapuños (Figure 1). They are representative of a human-made agrosilvopastoral system called dehesa and constitute semi-natural ecosystems composed of scattered evergreen trees and grasslands regularly grazed by livestock. These ecosystems have important sustainability issues, particularly related to tree decline and renewal [25].
The study areas have a gently undulated landscape, with an average elevation between 350 and 650 m. Annual mean precipitations were 594, 518, and 631 mm in Cuartos, Parapuños, and Naranjero, respectively, for a 35 year period (1977–2012) [13]. Although rainfall can vary strongly, both seasonally and inter-annually, rainy periods usually span from mid-autumn to mid-spring, whereas the period from late spring to early autumn is characterized by its almost total absence of rain. The mean annual air temperature is 16 °C, with an average daily minimum and maximum close to 3 °C in January and 32 °C in July, respectively. Climate can be considered as Mediterranean with oceanic and continental influences, comprising semiarid to dry sub-humid conditions.
There are three different vegetation layers (tree, shrub, and grassland) that present different densities and combinations. Predominant trees are mainly holm oaks (Quercus ilex L.), which present a density of 19, 34, and 68 trees/ha and a canopy cover of 13%, 16%, and 38% in Cuartos, Parapuños, and Naranjero, respectively [13]. The observed leaf area index in these ecosystems was 3.25 [26]. Ranchers frequently take out the shrub layer to promote herbaceous growth as resource for livestock. The grassland layer is composed of natural pastures of annual and perennial herbaceous plants, abounding annual grasses (such as Vulpia bromoides L. Gray, Bromus sp. or Aira caryophyllea L.) and annual legumes (Ornithopus compressus L., Lathyrus angulatus L., and several species of Trifolium). The growth period follows an approximately sigmoidal curve, starting in autumn and decaying in late spring [27], while summer constitutes a non-vegetative period.
Soils are shallow (≈40 cm), poor in nutrients and have variable organic matter content (±3%), except in the uppermost soil layer below tree covers. They show a high bulk density (≈1.5 g/cm3) although topsoil can present higher porosity (≈45%) because of concentration of roots of herbaceous plants [28]. They are classified as Cambisols, Luvisols, and Leptosols.
3. Material and Methods
3.1. Soil Water and Soil Temperature Measurements
Soil moisture (m3/m3) and soil temperature (°C) were measured by means of capacitive sensors and temperature sensors, respectively (Decagon Devices, Inc., Washington, DC, USA, models EC-5 and EC-T). They were continuously registered with a frequency of 30 min. Soil temperature was always measured at 5 cm depth, whereas soil moisture was monitored at 5, 10, and 15 cm, and a fourth measurement was taken at 5 cm above the bedrock depending on soil thickness. The sensors were gathered in Soil Moisture Stations (SMS) in two contrasting situations characterized by their vegetation covers: open spaces (Grassland) and below tree canopies (Tree). In order to avoid soil ponding, SMS in grasslands were positioned between hilltops and valley bottoms. Besides, below tree canopies, SMS were also installed with a southwest orientation and midway between the tree trunk and the limit of the crown. The terrain slopes in both situations were always lower than 4.4° [13]. Sensors were calibrated in the laboratory in order to improve their accuracy from ±4% to ±2% [29]. For this, a soil wetting processes was applied using soil samples from each study area and following the method proposed by Cobos and Chambers [29] for standard mineral soils. Soil temperature and moisture were measured over more than two complete hydrological years, from 1 April 2010 to 31 August 2012 (a hydrological year spanning from 1 September to 31 August). The SMS were distributed among the three study areas as shown in Table 1.
3.2. Determining Soil Properties and Meteorological Variables
The experimental catchment of Parapuños is equipped with a meteorological station which has continuously registered precipitation, air temperature, relative humidity, wind velocity, as well as global and net radiation with a frequency of 5 min from the year 2000. Precipitation and air temperature were also continuously monitored in Naranjero and Cuartos every 5 min during the study period (by means of HOBO Data Logging Rain Gauge, models RG3). Relative humidity, wind velocity and global radiation were monitored in both study areas by meteorological stations close to them (<10 km). They belong to a regional network of meteorological stations (Redarex) which continuously register with a resolution of 30 min.
Soil properties were determined for each sensor depth in all soil moisture stations (Table 2). Total porosity was calculated using bulk density values, which were determined using three replicates of undisturbed samples of ≈100 cm3. Soil organic matter was determined by standard methods [30] and grain size distribution following the USDA classification [31]. Soil properties values between 5 and 15 cm depth were calculated as an average between the three sampled depths corresponding to the soil surface (Table 2).
3.3. Determining the Influence of Vegetation Covers and Soil Moisture on Soil Temperature
To determine the influence of soil water content on soil temperature, four different soil moisture states were defined: wet, medium wet (MW), medium dry (MD), and dry. For this, daily averages of soil moisture between the two upper sensors of each SMS were calculated and then, the average plus-minus one standard deviation method was used for each SMS, such as already applied in previous studies [13].
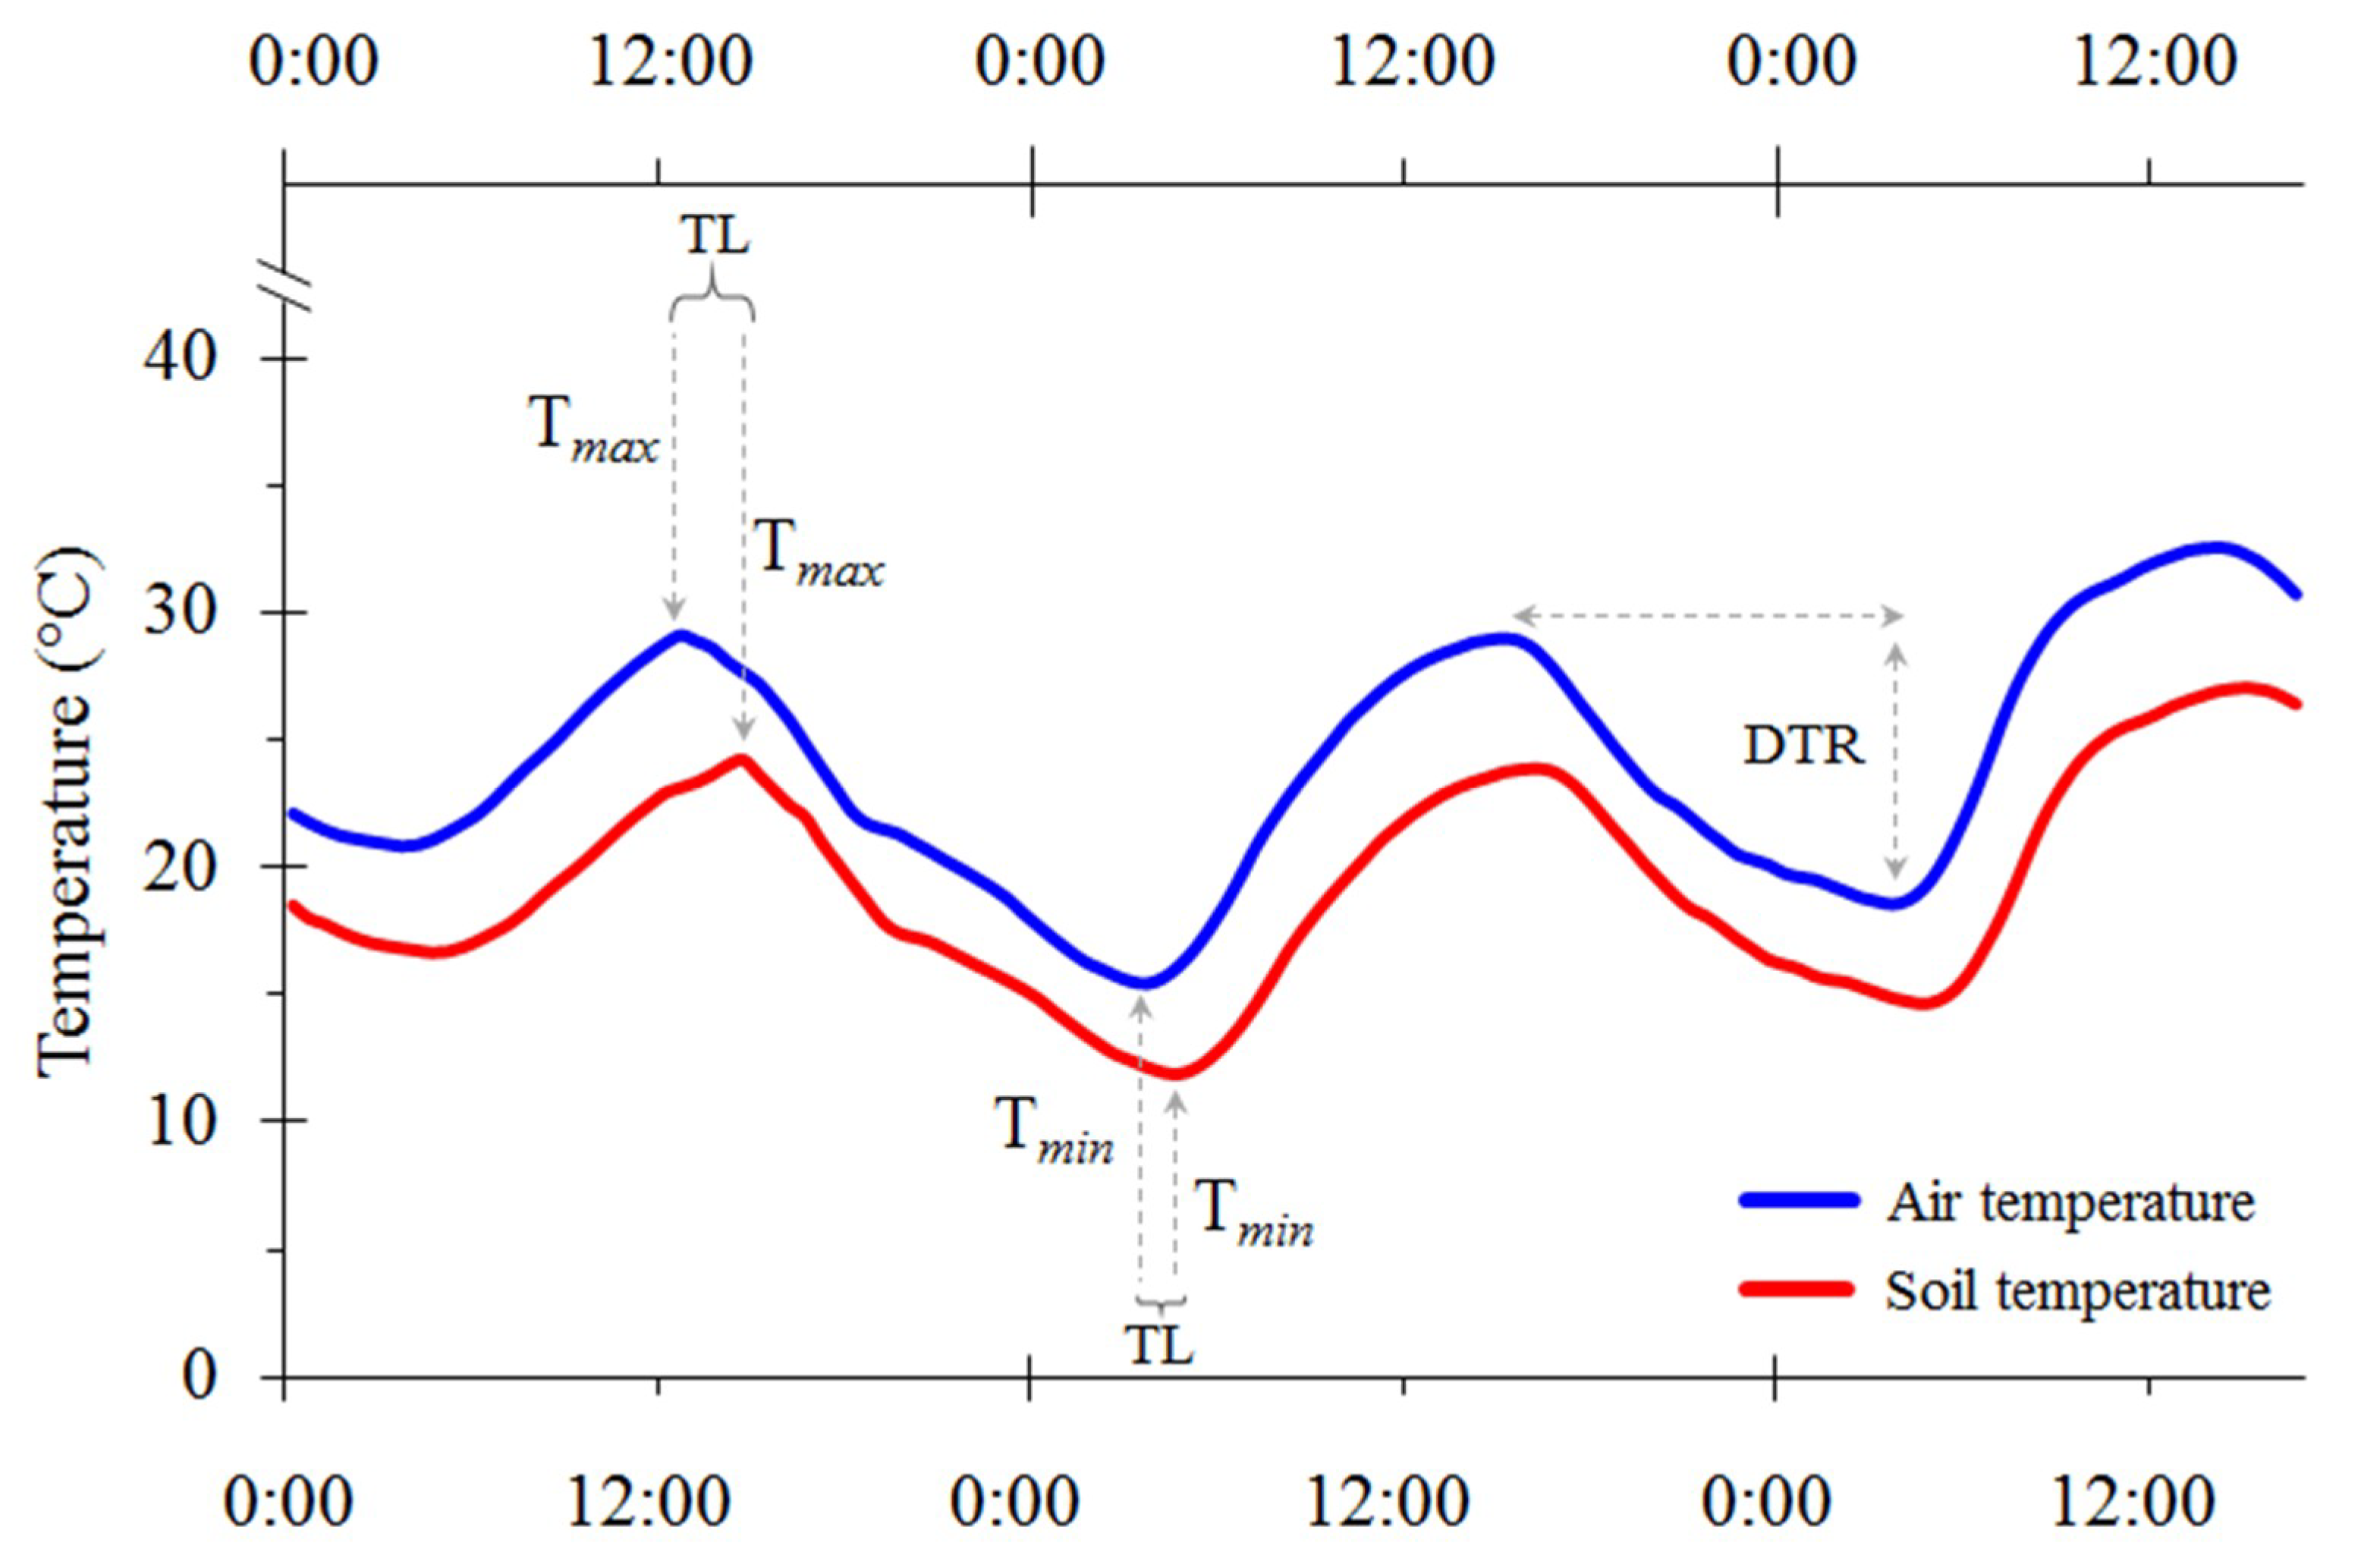
The combined effect of vegetation covers and soil moisture on temperatures was analyzed by daily variations of the temperature wave at 30 min intervals in soils and air. Because variations of mean temperatures can be due to changes in either maximum or minimum temperature, or relative changes in both, these latter could provide more information than the mean alone [33]. For this reason, several properties of the daily temperature wave were individually defined for each SMS and for the air: daily peaks of maximum and minimum temperatures, time of peaks, daily temperature range (i.e., amplitude between daily peaks), and time lag to reach the temperature peaks between air and soil (Figure 2).
Finally, to determine if significant differences in soil temperatures were found between vegetation covers and soil moisture states, the t-test statistical test was applied for each soil moisture state grouped by vegetation cover. Before, a normal distribution test was applied by the Shapiro–Wilk statistical test. Analyses were carried out by Statistica 8.0 software.
3.4. Determining the Importance of Factors Involved in Soil Water Decrease
3.4.1. Database Processing
To determine the importance of factors implied in the decreases of soil water in different vegetation covers, daily variations of soil moisture were calculated for each SMS by:
where Δθ is the daily variation of soil moisture, θn and θn−1 are soil moisture at day n and soil moisture the day before, respectively. Soil moisture on a daily scale was calculated using the daily mean of the two upper sensors of each SMS. Finally, soil water increases were removed from the database.
Additionally, as soil moisture can also decrease by vertical drainage or evapotranspiration processes, two procedures were considered. On the one hand, soil water retention curves were determined for each SMS by a drying process based on sand and kaolin boxes and the Richards plate. For this, 70 undisturbed soil samples that were taken at the depth at which the sensors were placed were used. When some points of the curves were not able to be calculated because of the difficulty in taking out soil samples, they were estimated by hierarchical pedotransfer functions. These latter used soil texture, organic matter, bulk density, and potential suction data, such as has already been described in previous studies [34]. Then, both measured and estimated points were adjusted by the van Genuchten model [35], commonly used to determine unsaturated soil hydraulic properties. Finally, only soil moisture values for suctions from −33 kPa to the lowest potentials were selected. This is justified because water at suctions from 0 kPa to −33 kPa is supposed to be freely drained by gravity as larger pores cannot hold it [36]. On the other hand, the variables used to estimate the reference evapotranspiration by the FAO–Penman–Monteith method [37] were separately used on a daily scale and for every site.
3.4.2. Modelling Factors that Influence Soil Water Decrease
To determine the importance of factors implied in soil water decrease under different vegetation covers, the Multivariate Adaptive Regression Splines (MARS) modeling technique [38] was used to generate two models, one for grasslands and another for below tree canopies. Thus, soil moisture was used as a target variable, whereas five variables related to the energy balance and hydrometeorological factors were used as independent continuous predictors. These latter were: air temperature, solar radiation, relative humidity, wind velocity, and soil temperature.
In order to test the models, the original databases of soil water decrease, one for grasslands (n = 2798) and the other for below tree canopies (n = 1202), were separated into two aleatory independent databases, respectively. For running the models the first databases were used (75% of data) and for validating them the second ones (25% of data). Irrespective of the size of these latter, independent databases, they showed similar statistical properties to those used for training the models (Table 3). The importance of the independent variables was evaluated as has already been described in previous studies [39]. The resulting equations obtained by this data mining method were not applied in other environments, but they were used with the explicit aim of determining the importance of the factors involved in soil water decreases in both vegetation covers of these ecosystems.
4. Results
4.1. Effects of Vegetation Covers and Soil Moisture on Soil Temperatures
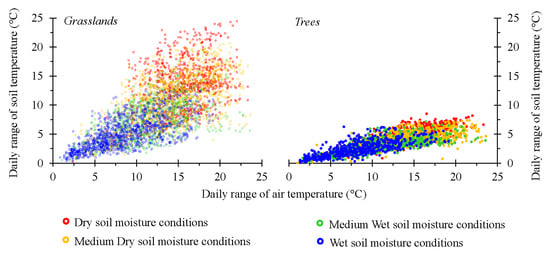
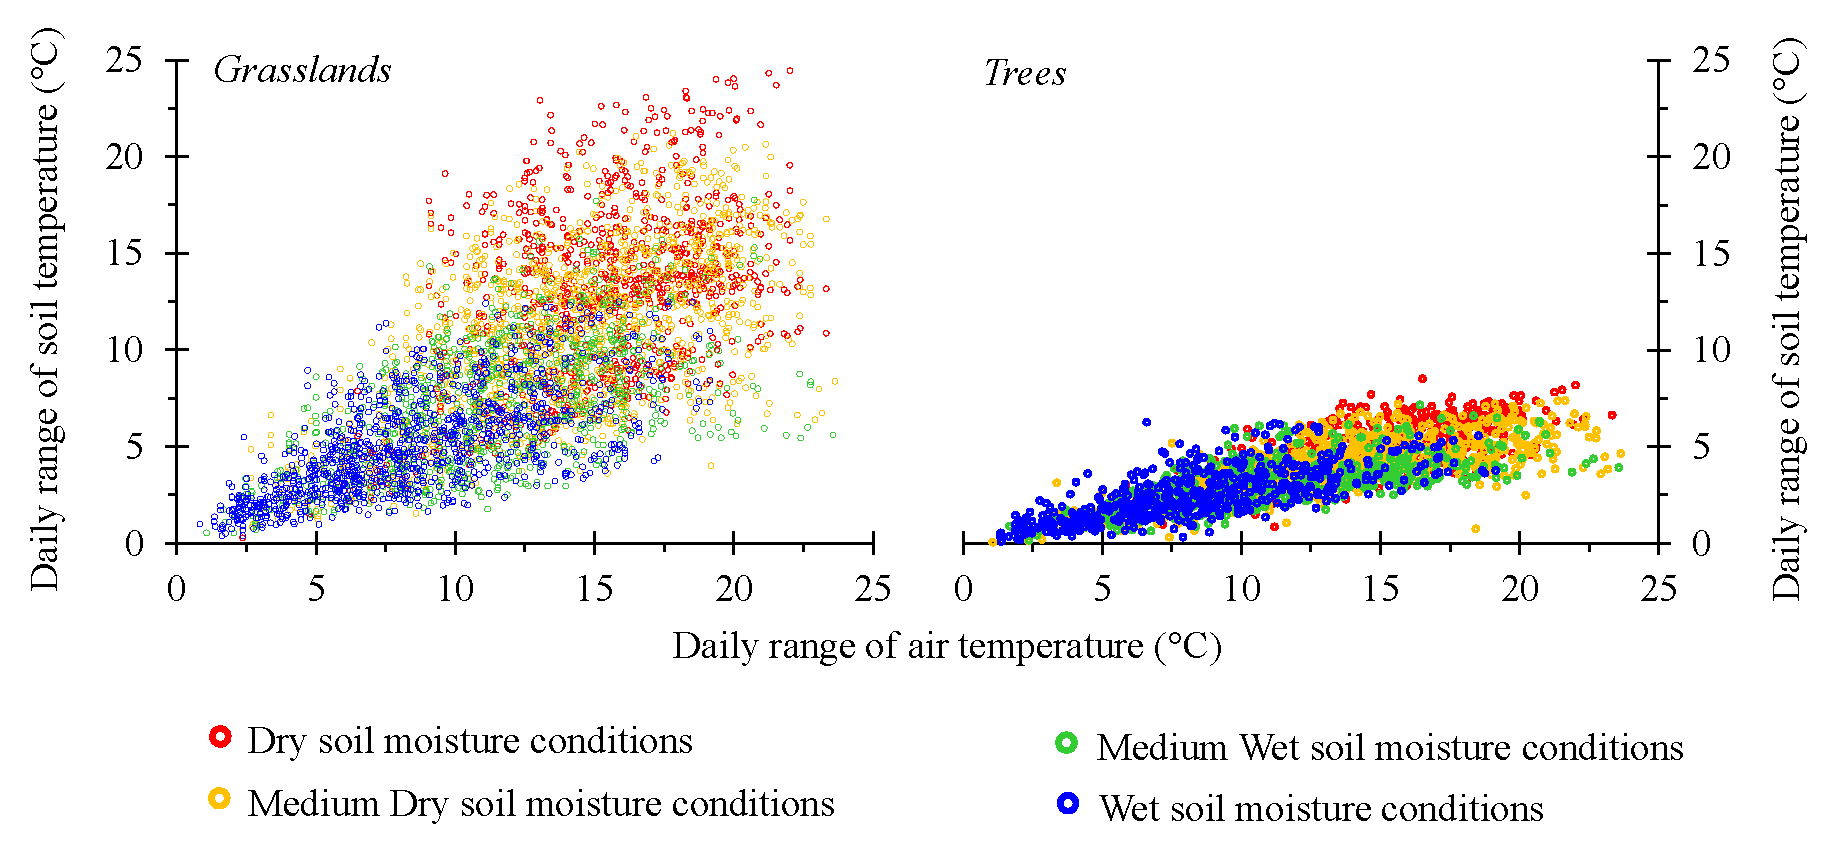
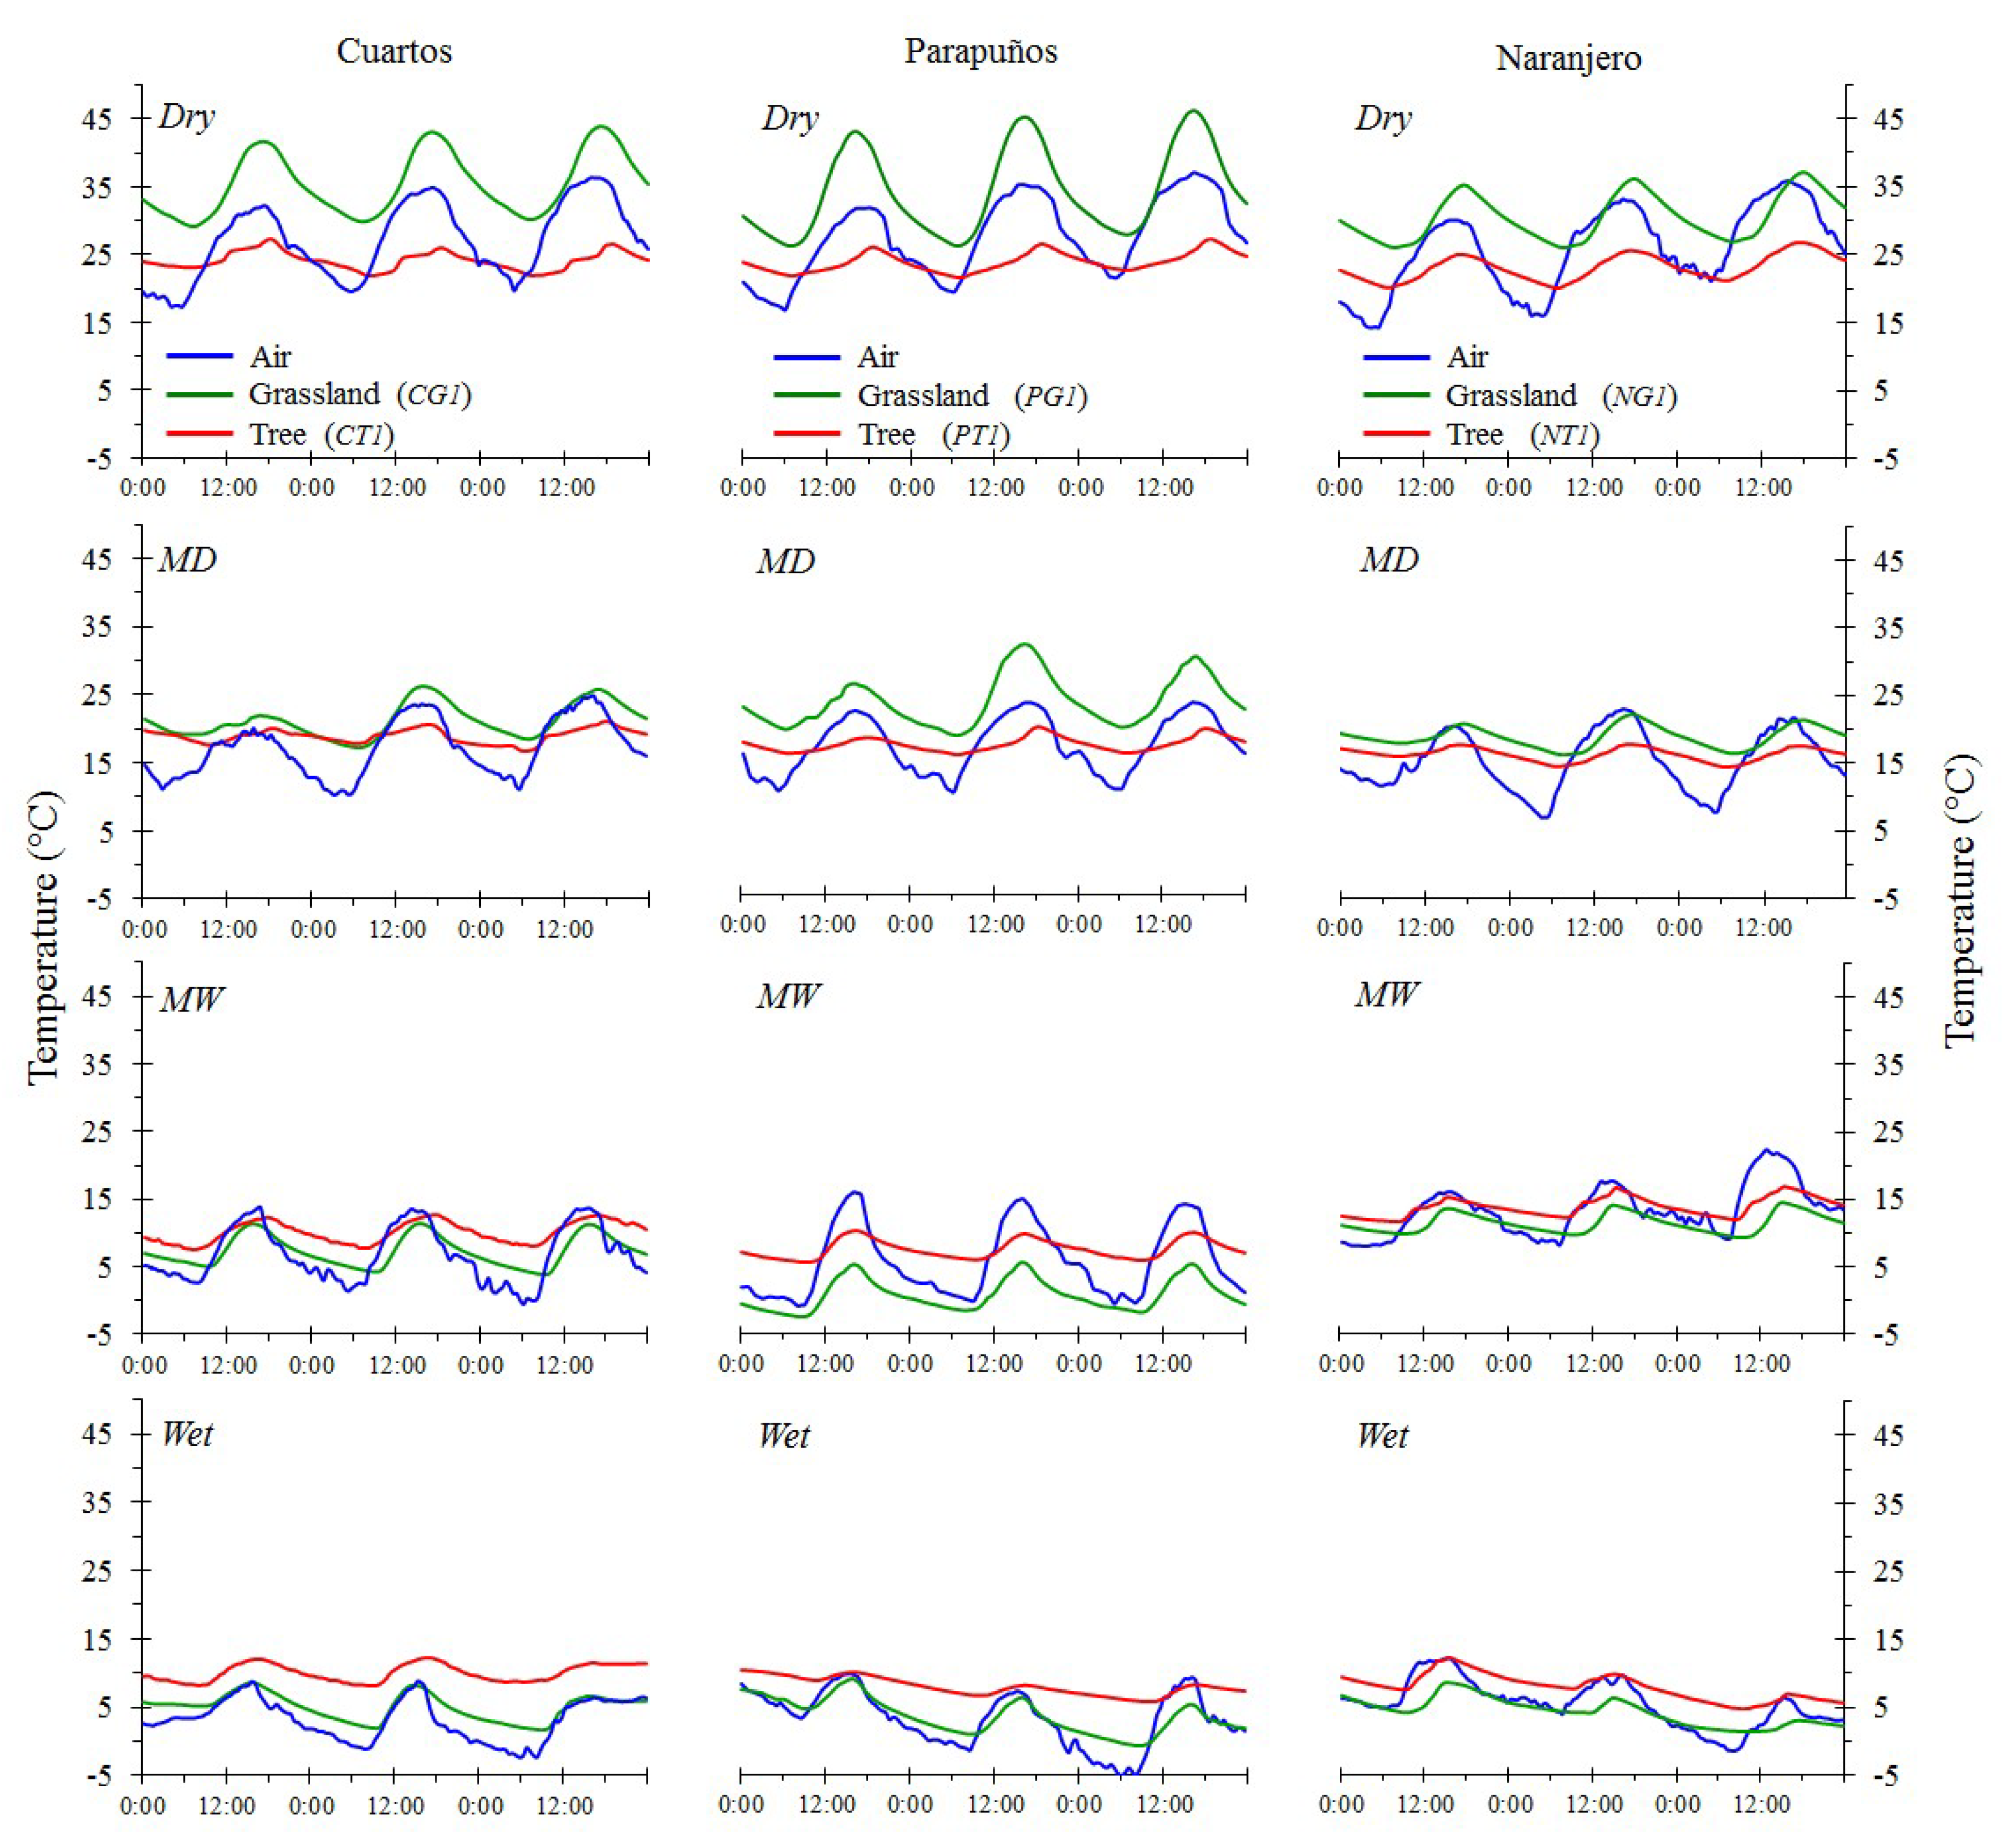
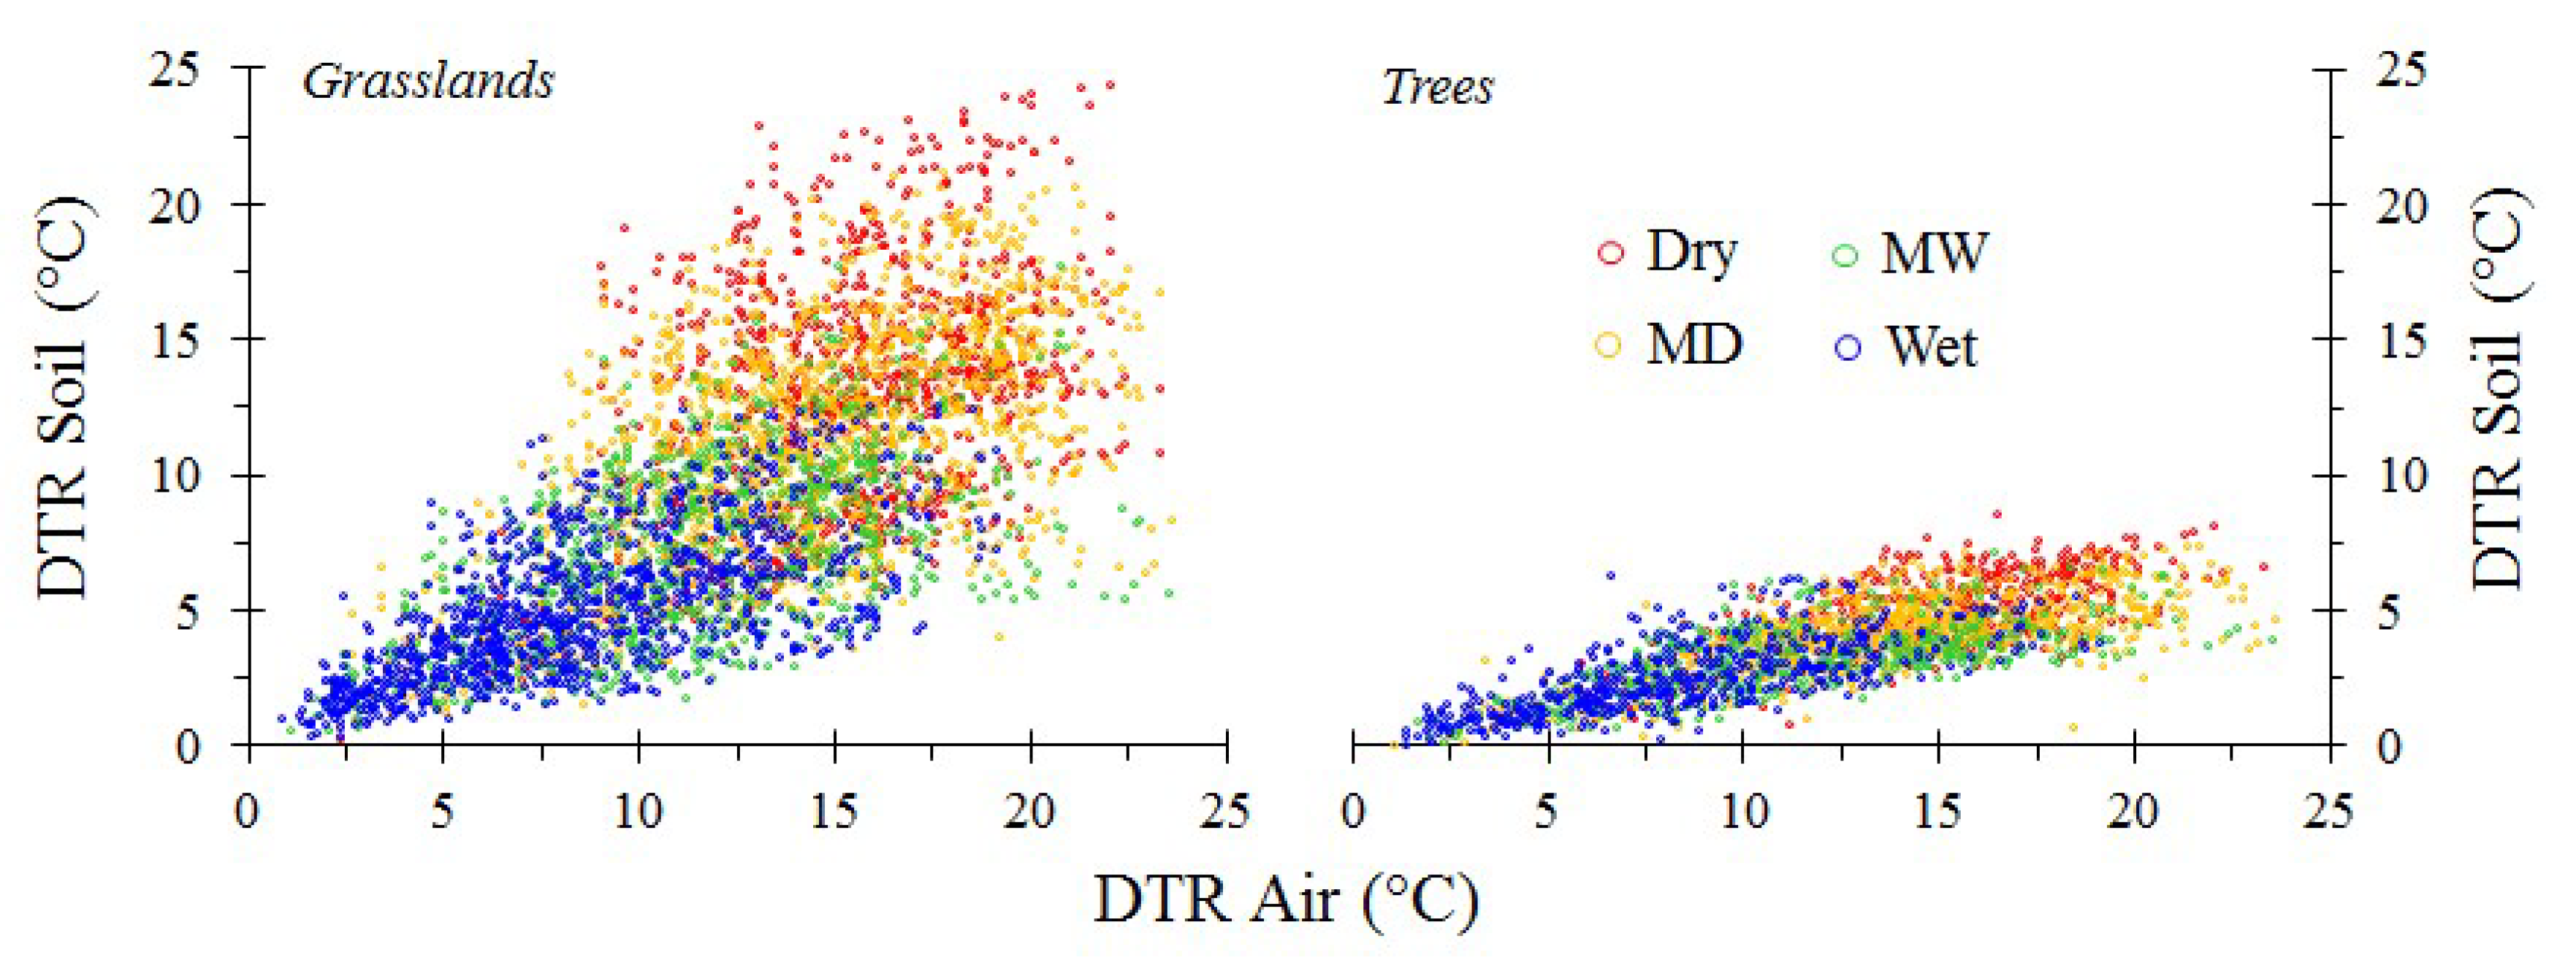
The daily cycle of soil temperatures was mainly explained by heating and cooling during the day and night, respectively (Figure 3). However, factors such as soil moisture and vegetation cover strongly affected the daily temperature cycle. Soil temperature decreased as soil wetness increased, although this effect was weaker and significantly different in soils below tree canopies than those in grasslands, regardless of soil moisture conditions becoming wetter or drier (Table 4). Additionally, the daily amplitude of soil temperatures increased from wetter to drier soil moisture conditions, and this range was usually more reduced below tree canopies than in grasslands (Figure 4). Thus, both low soil water content and the absence of shading were reflected in an increase of the daily amplitude (Figure 4).
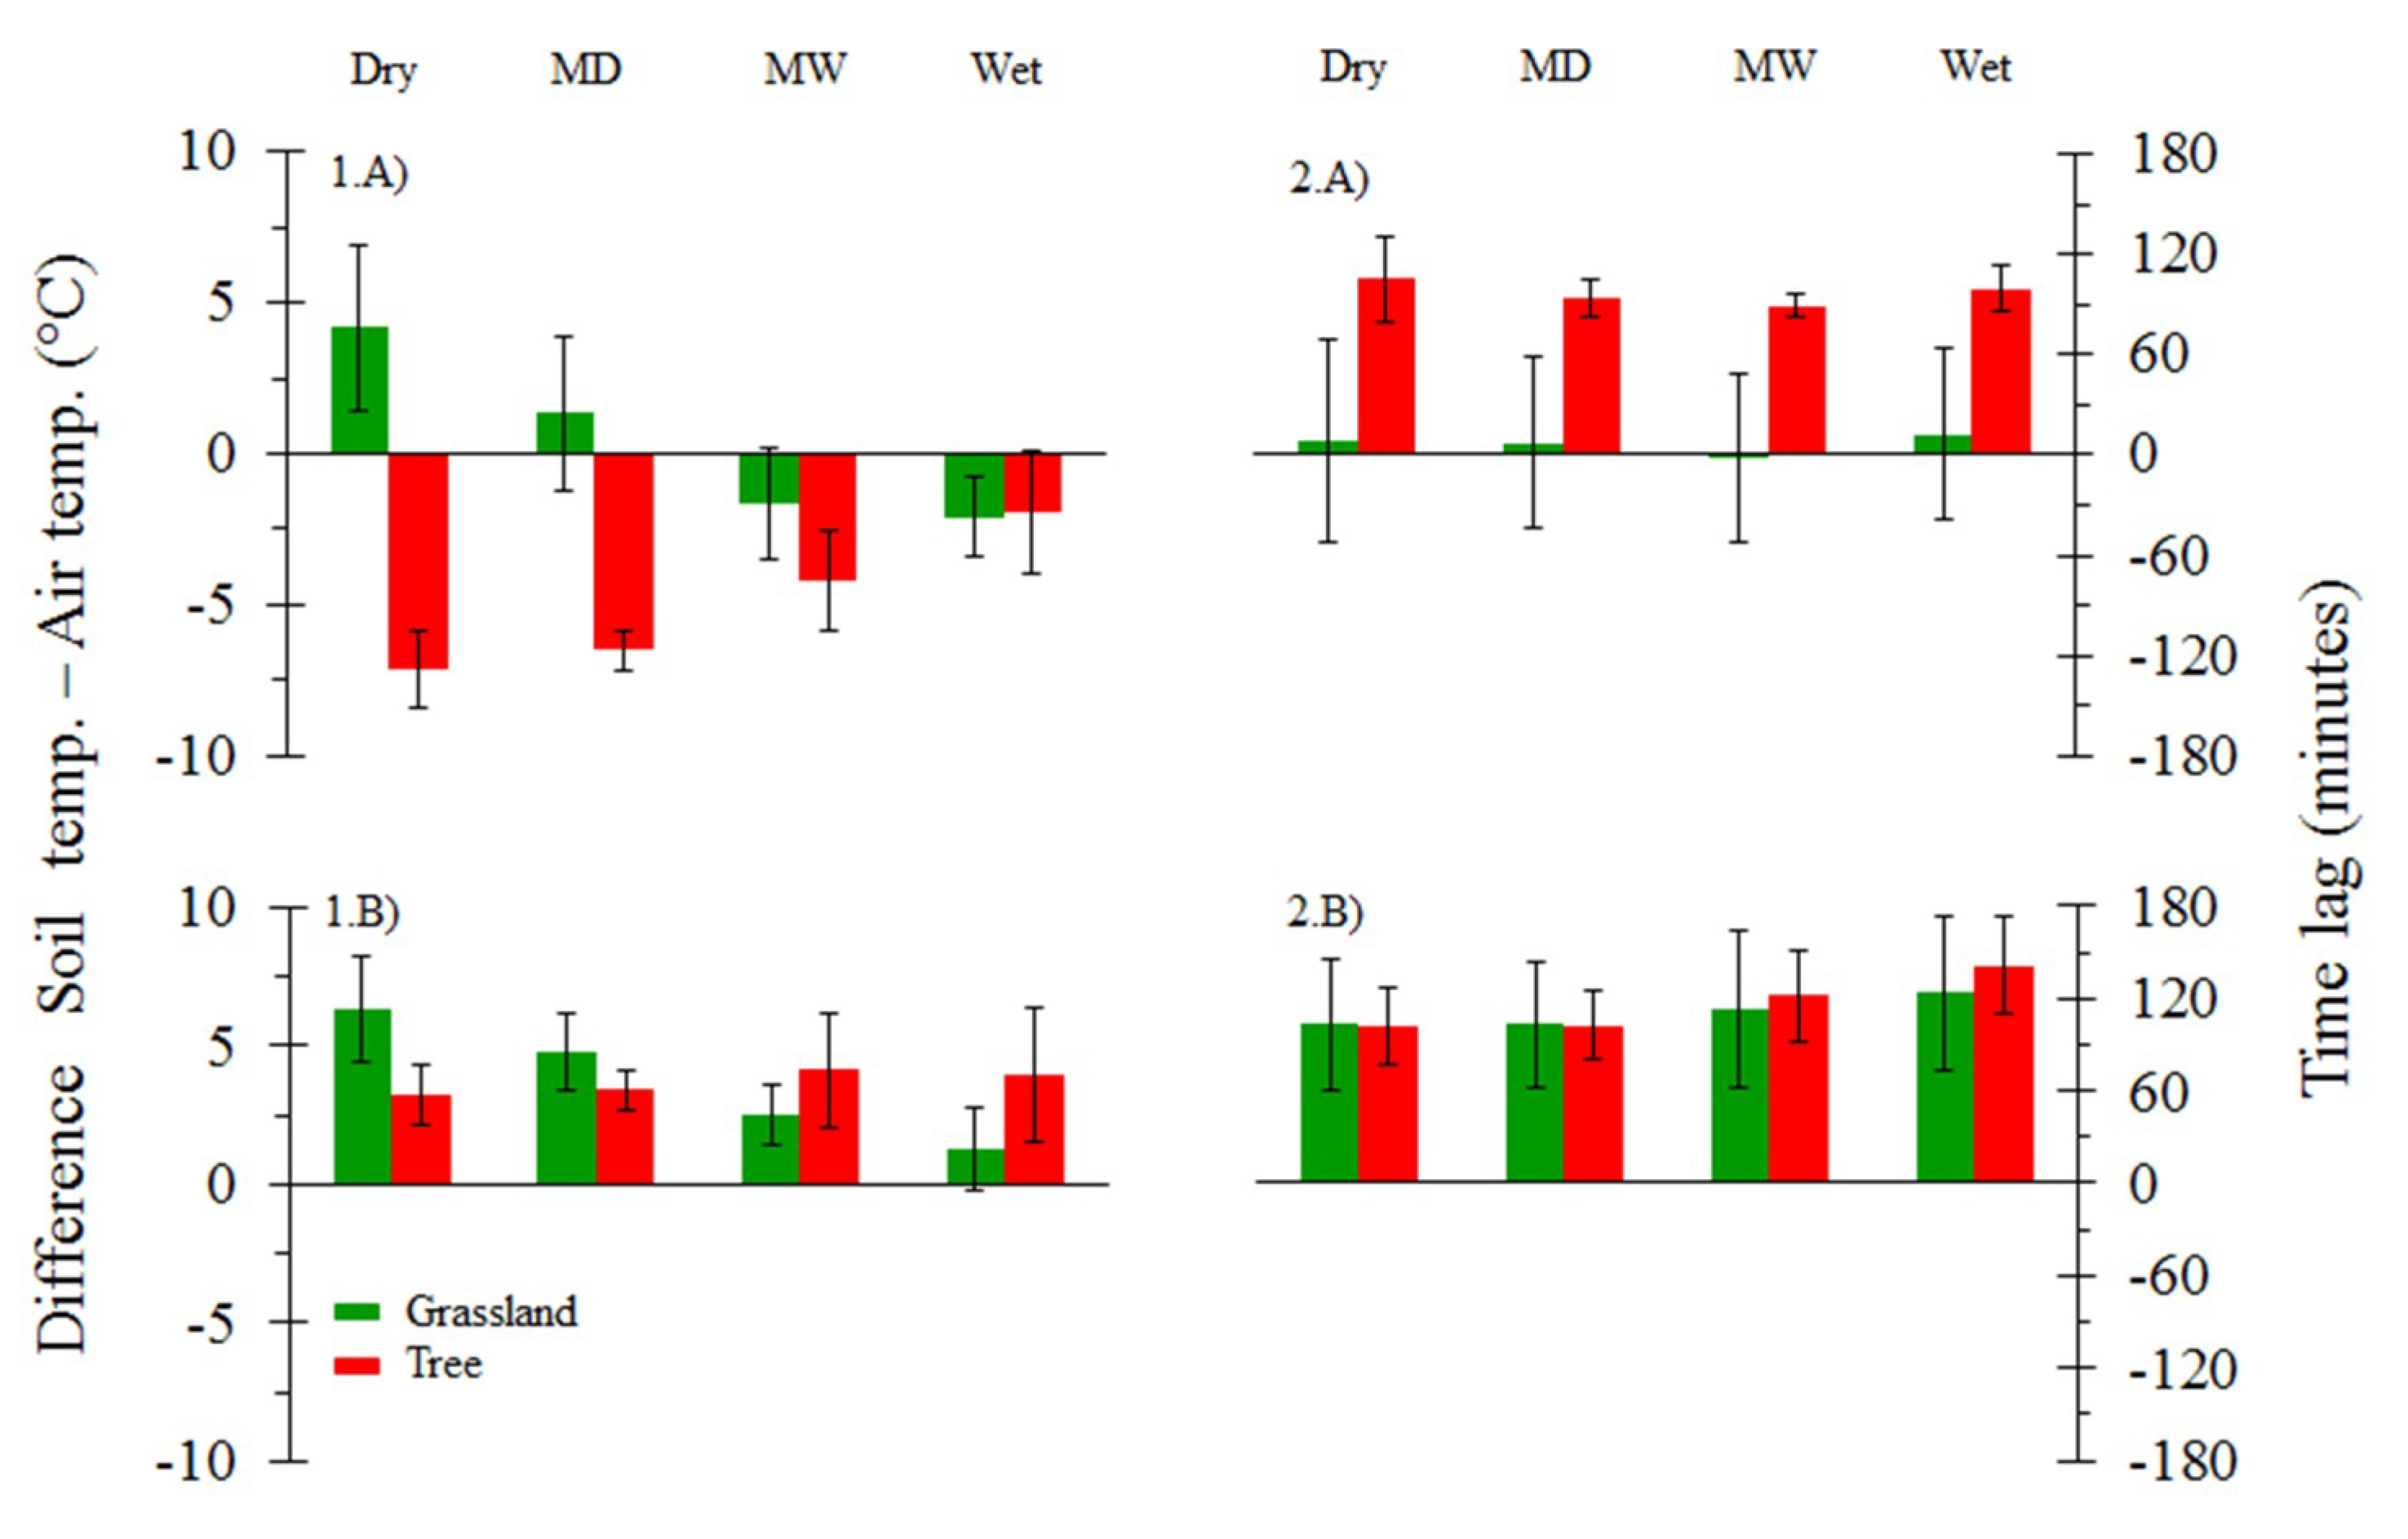
The influence of vegetation covers and soil moisture on soil temperatures was also reflected in the daily peaks of soil temperature and on the time lag between soils and air to reach these peaks (Figure 5). During daytime, daily peaks of maximum soil temperature under dry soil moisture conditions were, on average, 7.1 °C lower below tree canopies than in the air, whereas they were 4.2 °C higher in soils of grasslands than in the air (Figure 5 (1.A)). Nevertheless, soil wetness decreased these differences in both vegetation covers. Daily peaks of maximum soil temperatures were reached, on average, 90 min later below tree canopies than in the air, whereas these peaks were reached approximately at the same time in soils of grasslands than in the air (Figure 5 (2.A)). On the other hand, during night-time and under dry soil moisture conditions, daily peaks of minimum soil temperature were always higher in grasslands (6.3 °C) and below tree canopies (3.2 °C) than in the air (Figure 5 (1.B)). However, in this case soil wetness only decreased these differences in grasslands. Finally, daily peaks of minimum soil temperature were reached, on average, more than 100 min later in both vegetation covers than in the air, and the time lag between soils and air increased with soil wetness (Figure 5 (2.B)).
4.2. Factors Influencing the Decrease of Soil Water
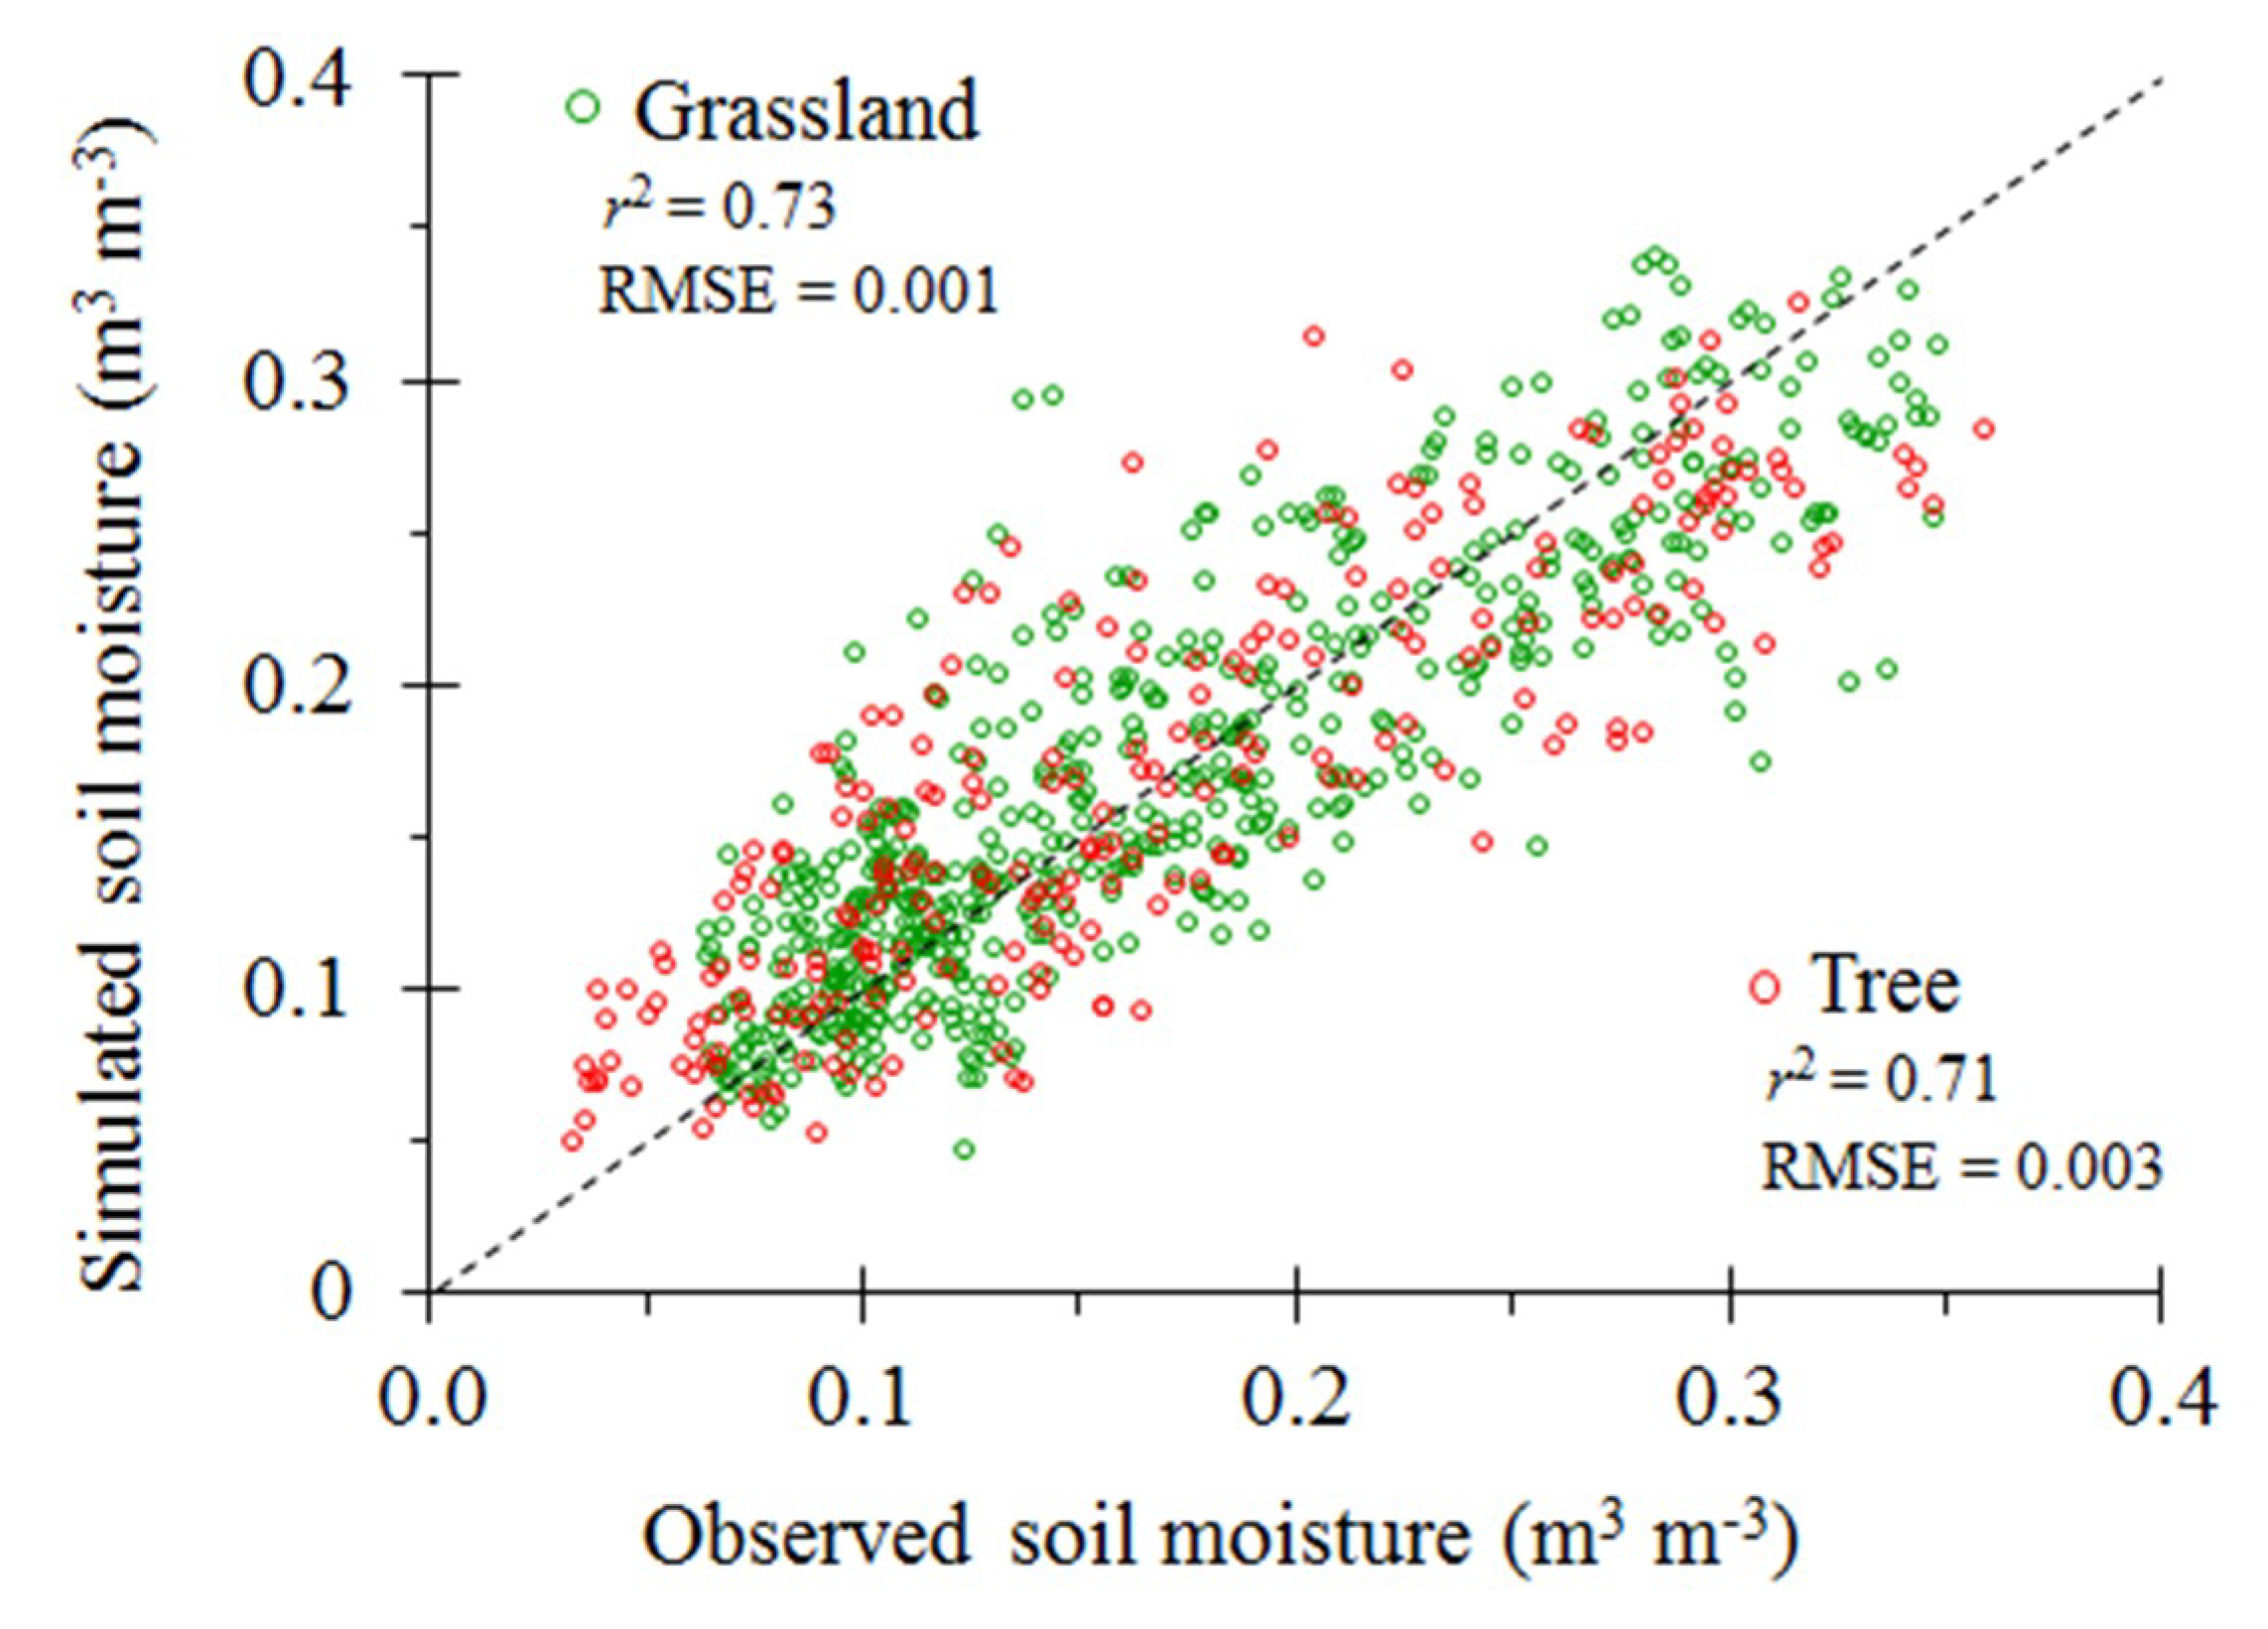
The quality fit presented by the two models obtained to explain the variables influencing soil water decreases was good. Coefficients of determinations were 0.73 and 0.71 in both cases (Figure 6). Models showed a good performance with low error for grasslands and tree, respectively (0.001 and 0.003), confirming the ability of this modelling technique to discriminate the most important variables to explain soil water decreases in soils of two vegetation covers.
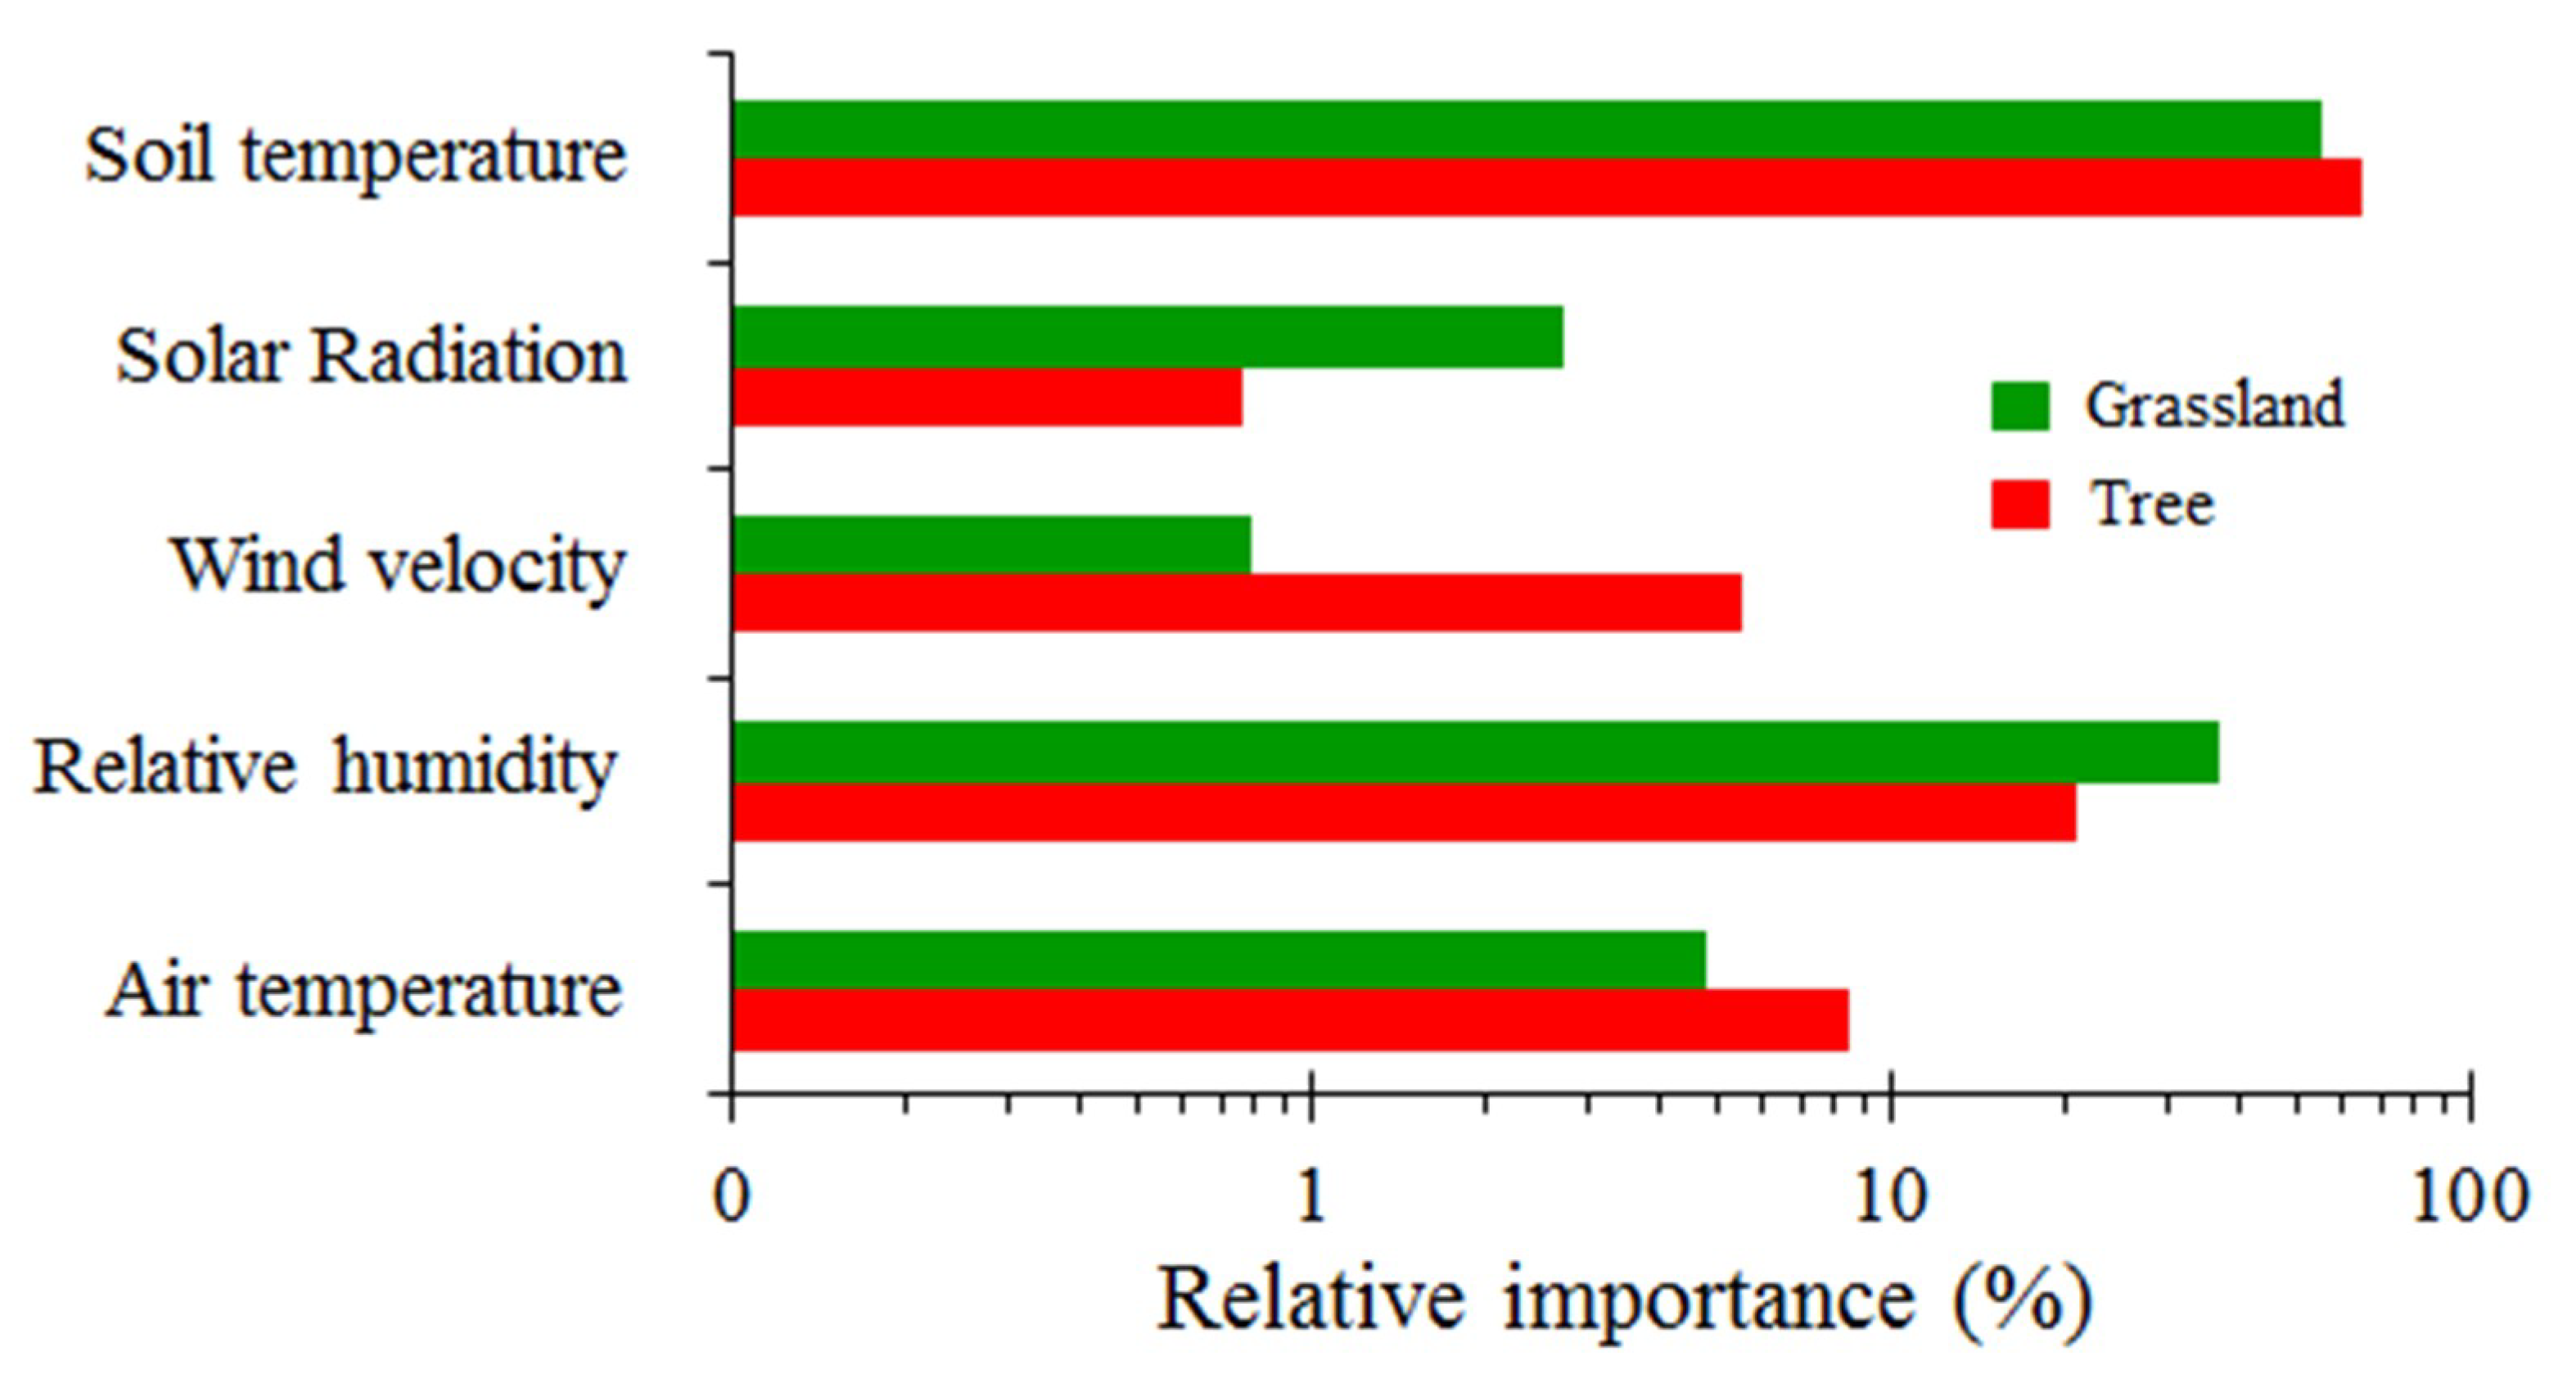
MARS selected all variables to build the two models and explain soil water decrease in both grasslands and below tree crowns (Figure 7). The most important individual variable in both cases was soil temperature, with an importance of 64.5% over 100% for trees, and 55.2% for grasslands. Relative humidity was also important in both cases (36.5% in grasslands and 20.8% in tree), whereas solar radiation and wind velocity showed lower importance in the two models.
5. Discussion
The daily cycle of air and soil temperatures (both in grasslands and below tree canopies) was mainly due to heating and cooling during the day and night, respectively. However, factors such as soil moisture and vegetation cover produced significant variations on the daily temperature cycle (Figure 5).
Soil water showed a very strong effect on soil temperatures, given that wet soils were prone to be colder than dry soils (Table 4). Likewise, daily amplitude of soil temperatures was also smaller under wet soil conditions than under drier ones (Figure 4), regardless of vegetation covers. Connections between soil moisture and soil temperature have also been observed in several studies [18,19,20], which asserted that during soil drying the surface temperature shows an increase that corresponds to a decrease in soil moisture, which coincides with our results. Indeed, soil temperatures played a key role on soil water decrease in both vegetation covers (Figure 7). When solar energy reaches the surface, it can be returned to the atmosphere or be partitioned into latent and sensible heat fluxes, both manifested as evaporated water and as heat of air and land, respectively. Consequently, an increase of soil temperature could be reflected in an increase of potential evapotranspiration and the subsequent decrease of soil water content (Table 4).
The moderation of soil temperatures by soil wetness has been explained by water properties, such as its high specific heat capacity and its high thermal conductivity. Thus, when soil moisture increases, more heat energy input for raising the soil temperature is required, since water has a higher specific heat capacity than soil materials [40]. Similarly, soils close to saturation can transport heat downward through water more quickly and, therefore, without significantly warming the upper soil layers [41]. Additionally, evapotranspiration processes from wet soils use energy that might otherwise be used to heat the soil surface [2]. With progressive drying, the air increasingly occupies the porous system and the soil warms up faster than a wet soil (Table 4), since less energy is required to change the soil temperature when it is dry [17,41].
The interactions between soil temperature and soil moisture could become more critical in dryland regions as compared to wetter ones, since low soil moisture limits the total energy used for cooling by latent heat fluxes, so more energy is available for increasing the soil and air temperature by sensible heating [2,42]. This could explain the observed influence of relative humidity on soil water decrease (Figure 7). Because of the soil-atmosphere water exchange is mainly controlled by atmospheric demand for water vapor, the influence of relative humidity on soil water decrease reduces as atmospheric water increases. Similar observations have mainly been found in modelling studies. For example, in areas with high soil moisture, latent heat fluxes by evapotranspiration dominate over sensible heat fluxes, enhancing the formation of clouds and the tendency to atmospheric cooling [23]. By contrast, if a long soil moisture deficit occurs, the atmospheric pressure deficit will increase and the sensible heat fluxes will be dominant, resulting in a warmer atmosphere that could inhibit the formation of clouds by convection and create a positive feedback loop [3,43]. This fact could be reflected in an intensification or lengthening of extreme climate events, as has been described in some studies [2,44], which have observed that feedbacks between land-atmosphere played a key role in the development of heatwaves in some regions of Europe. The importance of the results found here become more relevant because it has been observed that in the studied ecosystems dry periods can be independent of seasonality, i.e., they can arise in any climatic season [13], so if soil moisture deficits become more frequent, local climate could be affected.
Despite this, the type of vegetation cover also affected the energy reaching soils, incrementing the complexity of the aforementioned processes. For example, the protective effect of vegetation cover against direct solar radiation was not only reflected in lower soil temperature amplitudes below tree canopies than beyond them, but also because soils below canopies reached the daily peak of maximum temperature later than those in grasslands (Figure 5). The effect of tree canopies on temperatures below them has also been highlighted in several studies. For example, some of them have observed that the mean temperature ranges were smaller below tree canopies than in the air beyond them, whereas other studies have found similar results but only for mid and low latitudes [12,45]. Nevertheless, most of the studies addressing this topic emphasize the critical role of trees to modify water and energy balances and their influence on ecological processes. For example, many of them have suggested that phenological patterns could respond to microclimate modifications below tree canopies, which could partially explain the spatio-temporal variations on biomass yield and tree-grassland differences on ecohydrological processes [27,46,47]. Therefore, our results could become more significant because the studied environments present a great land surface below their tree crowns, since they can present a canopy cover up to 40%.
The feedbacks between vegetation covers, soil water content, and soil temperatures can strongly influence the hydrometeorological processes and, therefore, ecosystem functioning. Longer soil moisture deficits could increase the daily peaks of maximum soil temperatures and their amplitudes, although this effect slightly differs between vegetation covers. This could result in a warmer atmosphere, which could affect local climate conditions. If dry episodes become recurrent due to a likely climate change, ecosystem functioning, as well as their economic resources could be compromised.
6. Conclusions
Interactions between soil water and vegetation covers directly affected hydrometeorological processes, given that wet soils were prone to be colder than dry soils. Under this latter soil state, maximum soil temperatures were both lower below tree canopies and higher in grasslands than in the air. Nevertheless, these differences decreased in both vegetation covers as soil wetness increased. Conversely, minimum soil temperatures were higher in both vegetation covers than in the air, regardless of soil moisture conditions. Thus, both low soil water content and absence of shading were reflected in an increase of maximum soil temperatures and of their daily variability.
Modelling analysis proved that soil temperatures played a key role on soil moisture decrease of both vegetation covers, since an increase of soil temperature was reflected in a decrease of soil water content. The influence of relative humidity on soil water decrease was reduced as atmospheric water increased. This could presumably occur because soil-atmosphere water exchange is mainly controlled by atmospheric demand for water vapor.
Relationships between soil moisture and vegetation covers can modify hydrometeorological processes, which could affect ecosystem function. If soil moisture deficits become longer and more frequent due to climate change, daily temperature variations of soil temperature could increase, which could impact on local climate. These results suggest that more research should be carried out to quantify the feedbacks between land and atmosphere, in order to contribute to the standard of long-term weather forecasts, including a likely increase of droughts.
Author Contributions
J.L.-P. conceived the idea and wrote the original draft. M.P., C.L.-F., and S.S. reviewed and edited the draft in the same way.
Funding
This research was funded by the Fondo Nacional de Desarrollo Científico y Tecnológico [CONICYT/FONDECYT 11161097] and by the Programa de Cooperación Internacional para la Formación de Redes Internacionales de Investigación [REDI170640], both granted by the Government of Chile. Likewise, it was also funded by the former Spanish Ministry of Education and Science [CGL2008-01215].
Acknowledgments
Authors would like to thank the anonymous referees for their suggestions.
Conflicts of Interest
The authors declare no conflict of interest. The funders had no role in the design of the study; in the collection, analyses, or interpretation of data; in the writing of the manuscript, or in the decision to publish the results.
References
- Collier, C.G. Hydrometeorology; Wiley Blackwell: Hoboken, NJ, USA; University of Leeds: Leeds, UK, 2016. [Google Scholar]
- Alexander, L. Climate science: Extreme heat rooted in dry soils. Nat. Geosci. 2011, 4, 12–13. [Google Scholar] [CrossRef]
- Zemp, D.C.; Schleussner, C.-F.; Barbosa, H.; Hirota, M.; Montade, V.; Sampaio, G.; Staal, A.; Wang-Erlandsson, L.; Rammig, A. Self-amplified amazon forest loss due to vegetation-atmosphere feedbacks. Nat. Commun. 2017, 8, 1–10. [Google Scholar] [CrossRef] [PubMed]
- IPCC. Climate Change 2014: Synthesis Report. Contribution of Working Groups I, II and III to the Fifth assessment Report of the Intergovernmental Panel on Climate Change; IPCC: Geneva, Switzerland, 2014; p. 151. [Google Scholar]
- Campos, P.; Huntsinger, L.; Oviedo, J.L.; Starrs, P.F.; Diaz, M.; Standiford, R.B.; Montero, G. Mediterranean Oak Woodland Working Landscapes. Dehesas of Spain and Ranchlands of California; Springer Netherlands: Dordrecht, The Netherlands, 2013; p. 508. [Google Scholar]
- Joffre, R.; Rambal, S.; Ratte, J.P. The dehesa system of southern spain and portugal as a natural ecosystem mimic. Agrofor. Syst. 1999, 45, 57–79. [Google Scholar] [CrossRef]
- Seneviratne, S.; Corti, T.; Davin, E.; Hirschi, M.; Jaeger, E.; Lehner, I.; Orlowsky, B.; Teuling, A. Investigating soil moisture–climate interactions in a changing climate: A review. Earth-Sci. Rev. 2010, 99, 125–161. [Google Scholar] [CrossRef]
- Callaway, R.M. Positive Interactions and Interdependence in Plant Communities; Springer: Dordrecht, The Netherlands, 2007; p. 418. [Google Scholar]
- Asbjornsen, H.; Goldsmith, G.R.; Alvarado-Barrientos, M.S.; Rebel, K.; Osch, F.P.V.; Rietkerk, M.; Chen, J.; Gotsch, S.; Tobón, C.; Geissert, D.R.; et al. Ecohydrological advances and applications in plant–water relations research: A review. J. Plant Ecol. 2011, 4, 3–22. [Google Scholar] [CrossRef]
- Eviner, V.; Chapin, S. Functional matrix: A conceptual framework for predicting multiple plant effects on ecosystem processes. Annu. Rev. Ecol. Evol. Syst. 2003, 34, 455–485. [Google Scholar] [CrossRef]
- Jose, S.; Gillespie, A.R.; Pallardy, S.G. Interspecific interactions in temperate agroforestry. Agrofor. Syst. 2004, 61–62, 237–255. [Google Scholar] [CrossRef]
- Song, Y.; Zhou, D.; Zhang, H.; Li, G.; Jin, Y.; Li, Q. Effects of vegetation height and density on soil temperature variations. Chin. Sci. Bull. 2013, 58, 907–912. [Google Scholar] [CrossRef] [Green Version]
- Lozano-Parra, J.; Schnabel, S.; Ceballos-Barbancho, A. The role of vegetation covers on soil wetting processes at rainfall event scale in scattered tree woodland of mediterranean climate. J. Hydrol. 2015, 529, 951–961. [Google Scholar] [CrossRef]
- Joffre, R.; Rambal, S. How tree cover influences the water balance of mediterranean rangelands. Ecology 1993, 74, 570–582. [Google Scholar] [CrossRef]
- Calder, I.; Rosier, P.; Prasanna, K.; Parameswarappa, S. Eucalyptus water use greater than rainfall input-a possible explanation from southern india. Hydrol. Earth Syst. Sci. 1997, 1, 249–256. [Google Scholar] [CrossRef]
- García-Estringana, P.; Latron, J.; Llorens, P.; Gallart, F. Spatial and temporal dynamics of soil moisture in a Mediterranean mountain area (Vallcebre, NE Spain). Ecohydrology 2013, 6, 741–753. [Google Scholar] [CrossRef]
- Idso, S.; Schmugge, T.; Jackson, R.; Reginato, R. The utility of surface temperature measurements for the remote sensing of surface soil water status. J. Geophys. Res. 1975, 80, 3044–3049. [Google Scholar] [CrossRef]
- Reginato, R.; Idso, S.; Vedder, J.; Jackson, R.; Blanchard, M.; Goettelman, R. Soil water content and evaporation determined by thermal parameters obtained from ground-based and remote measurements. J. Geophys. Res. 1976, 81, 1617–1620. [Google Scholar] [CrossRef] [Green Version]
- Al-Kayssi, A.; Al-Karaghouli, A.; Hasson, A.; Beker, S. Influence of soil moisture content on soil temperature and heat storage under greenhouse conditions. J. Agric. Eng. Res. 1990, 45, 241–252. [Google Scholar] [CrossRef]
- Lakshmi, V.; Jackson, T.; Zehrfuhs, D. Soil moisture–temperature relationships: Results from two field experiments. Hydrol. Process. 2003, 17, 3041–3057. [Google Scholar] [CrossRef]
- Collatz, J.; Bounoua, L.; Los, S.; Randall, D.; Fung, I.; Sellers, P. A mechanism for the influence of vegetation on the response of the diurnal temperature range to changing climate. Geophys. Res. Lett. 2000, 27, 3381–3384. [Google Scholar] [CrossRef] [Green Version]
- Lim, Y.-K.; Cai, M.; Kalnay, E.; Zhou, L. Impact of vegetation types on surface temperature change. J. Appl. Meteorol. Clim. 2008, 47, 411–424. [Google Scholar] [CrossRef]
- Cheruy, F.; Dufresne, J.; Aït Mesbah, S.; Grandpeix, J.; Wang, F. Role of soil thermal inertia in surface temperature and soil moisture-temperature feedback. J. Adv. Model. Earth Syst. 2017, 9, 2906–9019. [Google Scholar] [CrossRef]
- Zhou, L.; Dickinson, R.; Tian, Y.; Vose, R.; Dai, Y. Impact of vegetation removal and soil aridation on diurnal temperature range in a semiarid region: Application to the sahel. PNAS 2007, 104, 17937–17942. [Google Scholar] [CrossRef] [PubMed]
- Herguido, E.; Lavado-Contador, J.F.; Pulido, M.; Schnabel, S. Spatial patterns of lost and remaining trees in the Iberian wooded rangelands. Appl. Geogr. 2017, 87, 170–183. [Google Scholar] [CrossRef]
- Hoff, C.; Rambal, S. An examination of the interaction between climate, soil and leaf area index in a quercus ilex ecosystem. Ann. For. Sci. 2003, 60, 153–161. [Google Scholar] [CrossRef]
- Lozano-Parra, J.; Schnabel, S.; Pulido, M.; Gómez-Gutiérrez, Á.; Lavado-Contador, F. Effects of soil moisture and vegetation cover on biomass growth in water-limited environments. Land Degrad. Dev. 2018. [Google Scholar] [CrossRef]
- Pulido-Fernández, M.; Schnabel, S.; Lavado-Contador, J.F.; Miralles-Mellado, I.; Ortega-Pérez, R. Soil organic matter of Iberian open woodland rangelands as influenced by vegetation cover and land management. Catena 2013, 109, 13–24. [Google Scholar] [CrossRef]
- Cobos, D.R.; Chambers, C. Calibrating ECH2O Soil Moisture Sensors. Decagon Device Application Note. , 2010. Available online: www.decagon.com (accessed on 15 October 2011).
- Walkley, A.; Black, L.A. An examination of degtjareff method for determining soil organic matter and a proposed modification of the chromic acid titration method. Soil Sci. 1934, 37, 29–38. [Google Scholar] [CrossRef]
- USDA. Soil survey laboratory methods manual. In Soil Survey Investigations; Report No. 42, Version 4.0; USDA-NCRS: Lincoln, OR, USA, 2004. [Google Scholar]
- FAO. World Reference Base for Soil Resources 2014. International Soil Classification System for Naming Soils and Creating Legends for Soil Maps; FAO: Rome, Italy, 2014; Volume 106, p. 191. [Google Scholar]
- Braganza, K.; Karoly, D.; Arblaster, J. Diurnal temperature range as an index of global climate change during the twentieth century. Geophys. Res. Lett. 2004, 31, 1–4. [Google Scholar] [CrossRef]
- Schaap, M.G.; Leij, F.J.; Van Genuchten, M.T. Rosetta: A computer program for estimating soil hydraulic parameters with hierarchical pedotransfer functions. J. Hydrol. 2001, 251, 163–176. [Google Scholar] [CrossRef]
- van Genuchten, M.T.; Leij, F.J.; Yates, S.R. The Retc Code for Quantifying the Hydraulic Functions of Unsaturated Soils; Version 6.02; EPA Report 600/2-91/065; U.S. Department of Agriculture, Agricultural Research Service: Riverside, CA, USA, 1991; p. 93.
- Cassel, D.; Nielsen, D. Field capacity and available water capacity. In Methods of Soil Analysis, Part 1. Physical and Mineralogical Method; Klute, A., Ed.; American Society of Agronomy-Soil Science Society of America: Madison, WI, USA, 1986; Volume 9, pp. 901–924. [Google Scholar]
- Allen, R.G.; Pereira, L.S.; Raes, D.; Smith, M. Crop Evapotranspiration—Guidelines for Computing Crop Water Requirements- Fao Irrigation and Drainage Paper 56; FAO—Food and Agriculture Organization of the United Nations: Rome, Italy, 1998; Volume 56, p. 322. [Google Scholar]
- Friedman, J.H. Multivariate adaptive regression splines. Ann. Stat. 1991, 19, 1–67. [Google Scholar] [CrossRef]
- Lozano-Parra, J.; Van Schaik, L.; Schnabel, S.; Gómez-Gutiérrez, Á. Soil moisture dynamics at high temporal resolution in a mediterranean watershed with scattered tree cover. Hydrol. Process. 2016, 30, 1155–1170. [Google Scholar] [CrossRef]
- Abu-Hamdeh, N. Thermal properties of soils as affected by density and water content. Biosyst. Eng. 2003, 86, 97–102. [Google Scholar] [CrossRef]
- Nassar, I.; Globus, A.; Horton, R. Simultaneous soil heat and water transfer. Soil Sci. 1992, 154, 465–472. [Google Scholar] [CrossRef]
- Gu, L.; Meyers, T.; Pallardy, S.; Hanson, P.; Yang, B.; Heuer, M.; Hosman, K.; Riggs, J.; Sluss, D.; Wullschleger, S. Direct and indirect effects of atmospheric conditions and soil moisture on surface energy partitioning revealed by a prolonged drought at a temperate forest site. J. Geophys. Res. 2006, 111, 1–13. [Google Scholar] [CrossRef]
- Scheffer, M.; Carpenter, S.; Foley, J.A.; Folke, C.; Walker, B. Catastrophic shifts in ecosystems. Nature 2001, 413, 591–596. [Google Scholar] [CrossRef] [PubMed]
- Hirschi, M.; Seneviratne, S.I.; Alexandrov, V.; Boberg, F.; Boroneant, C.; Christensen, O.B.; Formayer, H.; Orlowsky, B.; Stepanek, P. Observational evidence for soil-moisture impact on hot extremes in southeastern Europe. Nat. Geosci. 2011, 4, 17–21. [Google Scholar] [CrossRef]
- Longobardi, P.; Montenegro, A.; Beltrami, H.; Eby, M. Deforestation induced climate change: Effects of spatial scale. PLoS ONE 2016, 11, e0153357. [Google Scholar] [CrossRef] [PubMed]
- Lozano-Parra, J.; Maneta, M.; Schnabel, S. Climate and topographic controls on simulated pasture production in a semiarid Mediterranean watershed with scattered tree cover. Hydrol. Earth Syst. Sci. 2014, 18, 1439–1456. [Google Scholar] [CrossRef] [Green Version]
- Breshears, D.; Nyhan, J.; Heil, C.; Wilcox, B. Effects of woody plants on microclimate in a semiarid woodland: Soil temperature and evaporation in canopy and intercanopy patches. Int. J. Plant Sci. 1998, 159, 1010–1017. [Google Scholar] [CrossRef]
Figure 1.
Study areas located in Extremadura (Spain).

Figure 2.
Methodology used to determine the daily cycle of the soil temperature wave. Tmax and Tmin = maximum and minimum temperature, respectively; TL = Time lag between Tmax in air and Tmax in soil, and Tmin in air and Tmin in soil, respectively; DTR = daily temperature range, i.e., Tmax minus the next Tmin.

Figure 3.
Air temperature and soil temperature at 30-min intervals in grasslands and below tree canopies, and under different soil moisture states. MD and MW = medium dry and medium wet soil conditions, respectively.
Figure 3.
Air temperature and soil temperature at 30-min intervals in grasslands and below tree canopies, and under different soil moisture states. MD and MW = medium dry and medium wet soil conditions, respectively.

Figure 4.
Daily air temperature range (DTR) and its relationship with soil DTR under different vegetation covers and different soil moisture states. MD, MW = Medium dry and medium wet soil moisture conditions, respectively.
Figure 4.
Daily air temperature range (DTR) and its relationship with soil DTR under different vegetation covers and different soil moisture states. MD, MW = Medium dry and medium wet soil moisture conditions, respectively.

Figure 5.
Differences between daily peaks of maximum temperatures of soil and air (1.A) and the minimum ones (1.B), under different vegetation covers and different soil moisture states. Differences between time lag of soil and air to reach daily peaks of maximum temperature (2.A) and the minimum ones (2.B). MD, MW = medium dry and medium wet soil moisture conditions, respectively. Bar errors depicts one standard deviation.

Figure 6.
Observed and predicted soil moisture decrease in both grasslands and below tree canopies. RMSE = Root mean square error.
Figure 6.
Observed and predicted soil moisture decrease in both grasslands and below tree canopies. RMSE = Root mean square error.

Figure 7.
Independent factors chosen by the two models and their relative weight to explain soil moisture decrease in soils of both grasslands and below tree crowns.
Figure 7.
Independent factors chosen by the two models and their relative weight to explain soil moisture decrease in soils of both grasslands and below tree crowns.


Table 1.
Soil Moisture Stations (SMS) with the location and the symbols used to identify them.
| Study Area | Vegetation Cover | SMS | Symbol |
|---|---|---|---|
| Cuartos (C) | Grassland (G) | 1 | CG1 |
| Tree (T) | 1 | CT1 | |
| Parapuños (P) | Grassland (G) | 1, 2, 3 | PG1, PG2, PG3 |
| Tree (T) | 1 | PT1 | |
| Naranjero (N) | Grassland (G) | 1 | NG1 |
| Tree (T) | 1 | NT1 |
Table 2.
Soil properties in each soil moisture station (SMS).
| SMS | Soil | Depth (cm) | Clay (%) | Silt (%) | Sand (%) | OM (%) | Porosity (%) | BD (g/cm3) |
|---|---|---|---|---|---|---|---|---|
| CG1 | Epileptic Cambisol | 5–15 | 9.3 | 49.6 | 41.2 | 2.3 | 43.2 | 1.50 |
| 30 | 14.1 | 50.0 | 35.9 | 1.3 | 39.0 | 1.62 | ||
| CT1 | Epileptic Cambisol | 5–15 | 10.3 | 53.4 | 36.2 | 1.3 | 41.6 | 1.55 |
| 30 | 13.9 | 54.9 | 31.2 | 0.2 | 42.9 | 1.51 | ||
| PG1 | Chromic Luvisol | 5–15 | 10.1 | 42.1 | 47.9 | 0.8 | 38.5 | 1.63 |
| 45 | 64.0 | 24.2 | 11.9 | 0.0 | 41.5 | 1.55 | ||
| PG2 | Chromic Luvisol | 5–15 | 6.6 | 46.5 | 46.8 | 1.5 | 38.3 | 1.64 |
| 40 | n.a | n.a | n.a | n.a | 50.5 | 1.31 | ||
| PG3 | Epileptic Cambisol | 5–15 | 9.5 | 56.0 | 34.5 | 2.2 | 46.5 | 1.42 |
| 30 | 13.1 | 59.2 | 27.7 | 1.0 | 39.1 | 1.61 | ||
| PT1 * | Distric Leptosol | 5–15 | 7.1 | 51.3 | 40.5 | 3.8 | 45.2 | 1.50 |
| NG1 | Distric Cambisol | 5–15 | 6.2 | 51.6 | 42.3 | 3.7 | 42.0 | 1.54 |
| 35 | 14.3 | 50.6 | 35.1 | 0.9 | 32.1 | 1.80 | ||
| NT1 | Distric Leptosol | 5–15 | 4.8 | 47.5 | 47.8 | 3.2 | 52.4 | 1.26 |
| 20 | 8.4 | 47.4 | 44.2 | 1.5 | 45.2 | 1.45 |
OM = Organic Matter; BD = Bulk Density; n.a = not available. * SMS with the fourth soil moisture sensor installed at 15 cm due to the shallowness of the soil profile. Soil type was described by FAO method [32].
Table 3.
Statistical summary of training and test databases for soil water decrease (m3/m3).
| Cover | Database | n | Mean | Median | SD | Max | Min |
|---|---|---|---|---|---|---|---|
| Grassland | Training | 2239 | 0.178 | 0.156 | 0.082 | 0.350 | 0.060 |
| Test | 559 | 0.167 | 0.146 | 0.075 | 0.349 | 0.064 | |
| Tree | Training | 962 | 0.167 | 0.155 | 0.076 | 0.351 | 0.032 |
| Test | 240 | 0.165 | 0.149 | 0.084 | 0.358 | 0.033 |
n = sample size; SD = Standard deviation; Max and Min = maximum and minimum, respectively.
Table 4.
Soil temperature (°C) in different vegetation covers and under different soil water states.
Table 4.
Soil temperature (°C) in different vegetation covers and under different soil water states.
| Cover | Dry | MD | MW | Wet | ||||
|---|---|---|---|---|---|---|---|---|
| Mean | SD | Mean | SD | Mean | SD | Mean | SD | |
| Grasslands | 29.4 * | 4.5 * | 21.7 * | 3.6 * | 13.7 * | 2.4 * | 9.5 * | 1.7 * |
| Trees | 22.5 * | 1.6 * | 17.6 * | 1.3 * | 14.7 * | 1.0 * | 12.3 * | 0.9 * |
MD and MW = medium dry and medium wet soil moisture conditions, respectively. SD = daily standard deviation of soil temperature. Statistical differences between vegetation cover have been tested by t-test statistical test (* = p < 0.00).
© 2018 by the authors. Licensee MDPI, Basel, Switzerland. This article is an open access article distributed under the terms and conditions of the Creative Commons Attribution (CC BY) license (http://creativecommons.org/licenses/by/4.0/).
Share and Cite
MDPI and ACS Style
Lozano-Parra, J.; Pulido, M.; Lozano-Fondón, C.; Schnabel, S. How do Soil Moisture and Vegetation Covers Influence Soil Temperature in Drylands of Mediterranean Regions? Water 2018, 10, 1747. https://doi.org/10.3390/w10121747
AMA Style
Lozano-Parra J, Pulido M, Lozano-Fondón C, Schnabel S. How do Soil Moisture and Vegetation Covers Influence Soil Temperature in Drylands of Mediterranean Regions? Water. 2018; 10(12):1747. https://doi.org/10.3390/w10121747
Chicago/Turabian StyleLozano-Parra, Javier, Manuel Pulido, Carlos Lozano-Fondón, and Susanne Schnabel. 2018. "How do Soil Moisture and Vegetation Covers Influence Soil Temperature in Drylands of Mediterranean Regions?" Water 10, no. 12: 1747. https://doi.org/10.3390/w10121747
Note that from the first issue of 2016, this journal uses article numbers instead of page numbers. See further details here.