Water–Energy Nexus for Multi-Criteria Decision Making in Water Resource Management: A Case Study of Choshui River Basin in Taiwan


1
Department of Safety, Health and Environmental Engineering, National Kaohsiung University of Technology, Kaohsiung 824, Taiwan
2
Safety, Health & Environmental Center, Group Administration, Formosa Plastics Group, Taipei 105, Taiwan
3
Graduate Institute of Environmental Engineering, National Taiwan University, Taipei 106, Taiwan
*
Authors to whom correspondence should be addressed.
Water 2018, 10(12), 1740; https://doi.org/10.3390/w10121740
Submission received: 2 October 2018
/
Revised: 8 November 2018
/
Accepted: 24 November 2018
/
Published: 27 November 2018
(This article belongs to the Section Water Resources Management, Policy and Governance)
Abstract
:The Choshui river basin, the mother river in Taiwan, suffers from severe water shortage from extensive water use in irrigation as well as land subsidence from over-pumping of groundwater. To address these challenges, several water-related strategies and actions, including enhancement of water-use efficiency, development of alternative water sources, and improvement in effective water management, were proposed in this study to support sustainable water resource management in the watershed. Management of water resources in Taiwan is expected to confront not only freshwater resource but also energy source constraints. Multi-criteria decision analysis (MCDA), an approach for ranking overall performances of decision options, was then used to prioritize the water resource management strategies. The analysis considered economic (economic feasibility) and environmental (stability from the influence of climate change) criteria in the context of water–energy nexus (water supply/conservation potential and systemic energy efficiency). Our results indicated that, while economic feasibility was considered as the most important factor in implementation of the practices, improvement in groundwater pumping control and management was ranked as a high-priority water resource management action, followed by initiating water conservation programs for residential sector and reducing leakage rate for agricultural irrigation canals. The results from this study are expected to provide direction for future decision making in water resource management.
1. Introduction
Water scarcity and energy security are well-recognized worldwide challenges; thus, they are addressed as key components in the United Nations Sustainable Development Goals (SDG 6 and 7). Water and energy are particularly vulnerable to the impacts of global climate change [1], and, the development of urban, industrial, or agricultural activities strongly rely on the use of both of the two resources. In particular, the processes of abstracting, treatment and distribution of water all require energy; and, generation of energy needs water. Thus, the term of water–energy nexus is used to represent the interactions and interdependences between water and energy, implying that water constraints can translate into energy constraints or vice versa [2]. It is also worth mentioning that the interdependences between water and energy is an important issue for future sustainability planning and strategic policy considerations [3]. Lack of understanding of the interdependences between water and energy (or even among other key natural resource sectors) may lead to overuse and mismanagement of the resources [4]. Therefore, future strategies or practices for water resource management are suggested to consider the concept of water–energy nexus for sustainability planning and development [5,6,7].
Taiwan, an island located in East Asia, suffers from water shortage as well as an energy crisis. The majority of the Central and Southern Taiwan has experienced drought events during dry seasons (winter time from November to April) due to little precipitation but heavy water uses for agricultural and industrial activities [8]. A severe drought in 2015 caused conflicts of access to water and resulted in alternating-furrow irrigation to approximately 43 thousand acres of paddy fields, 10% supply reduction on large industries and water use restriction for domestic sectors [9]. On the other hand, Taiwan has nearly more than 94 percent dependence on energy imports (petroleum, natural gas, and coal) and is currently making efforts to invest in renewable energy resources such as solar and wind farms [10]. These implied that future management of water resources in Taiwan is expected to face not only freshwater resource but also energy source constraints.
System approaches are widely applied and have improved significantly to support decision making in water management and engineering. Multi-criteria decision making (MCDA) is of particular interest in resolving conflicts related to the decision making process [11]. MCDA allows exploration of alternatives regarding their performance objectives (criteria or goals) and aims to select the best alternative [12]. This approach has been applied for natural resource management researches. Alvarado et al. presented the use of MCDA in facilitating the protection prioritization of drinking water wells considering natural, anthropic, and technical aspects [13]. Jaiswal et al. identified the priority sub-watersheds that were vulnerable to catchment development using MCDA [14]. Song and Chung have applied the analysis for prioritizing sites and types of low impact development practices [15]. Zheng et al. proposed the use of MCDA for wastewater infrastructure management and reported that combining scenario planning and MCDA was beneficial for the decision process [16].
This study aimed to prioritize various water management practices regarding their technical, environmental, and economic aspects using the MCDA approach combining scenario planning. In this study, three classification goals of the water management practices were considered, including enhancing water-use efficiency, development of alternative water sources and improvement in effective water management, which provided 12 conventional and unconventional water management solutions for the analysis. Recommendations for enhancing the water management in the case study area and beyond were also addressed. This research did not intend to support an ongoing decision process, but was of informative interest to the stakeholders in the case study.
2. Materials and Methods
2.1. Study Area
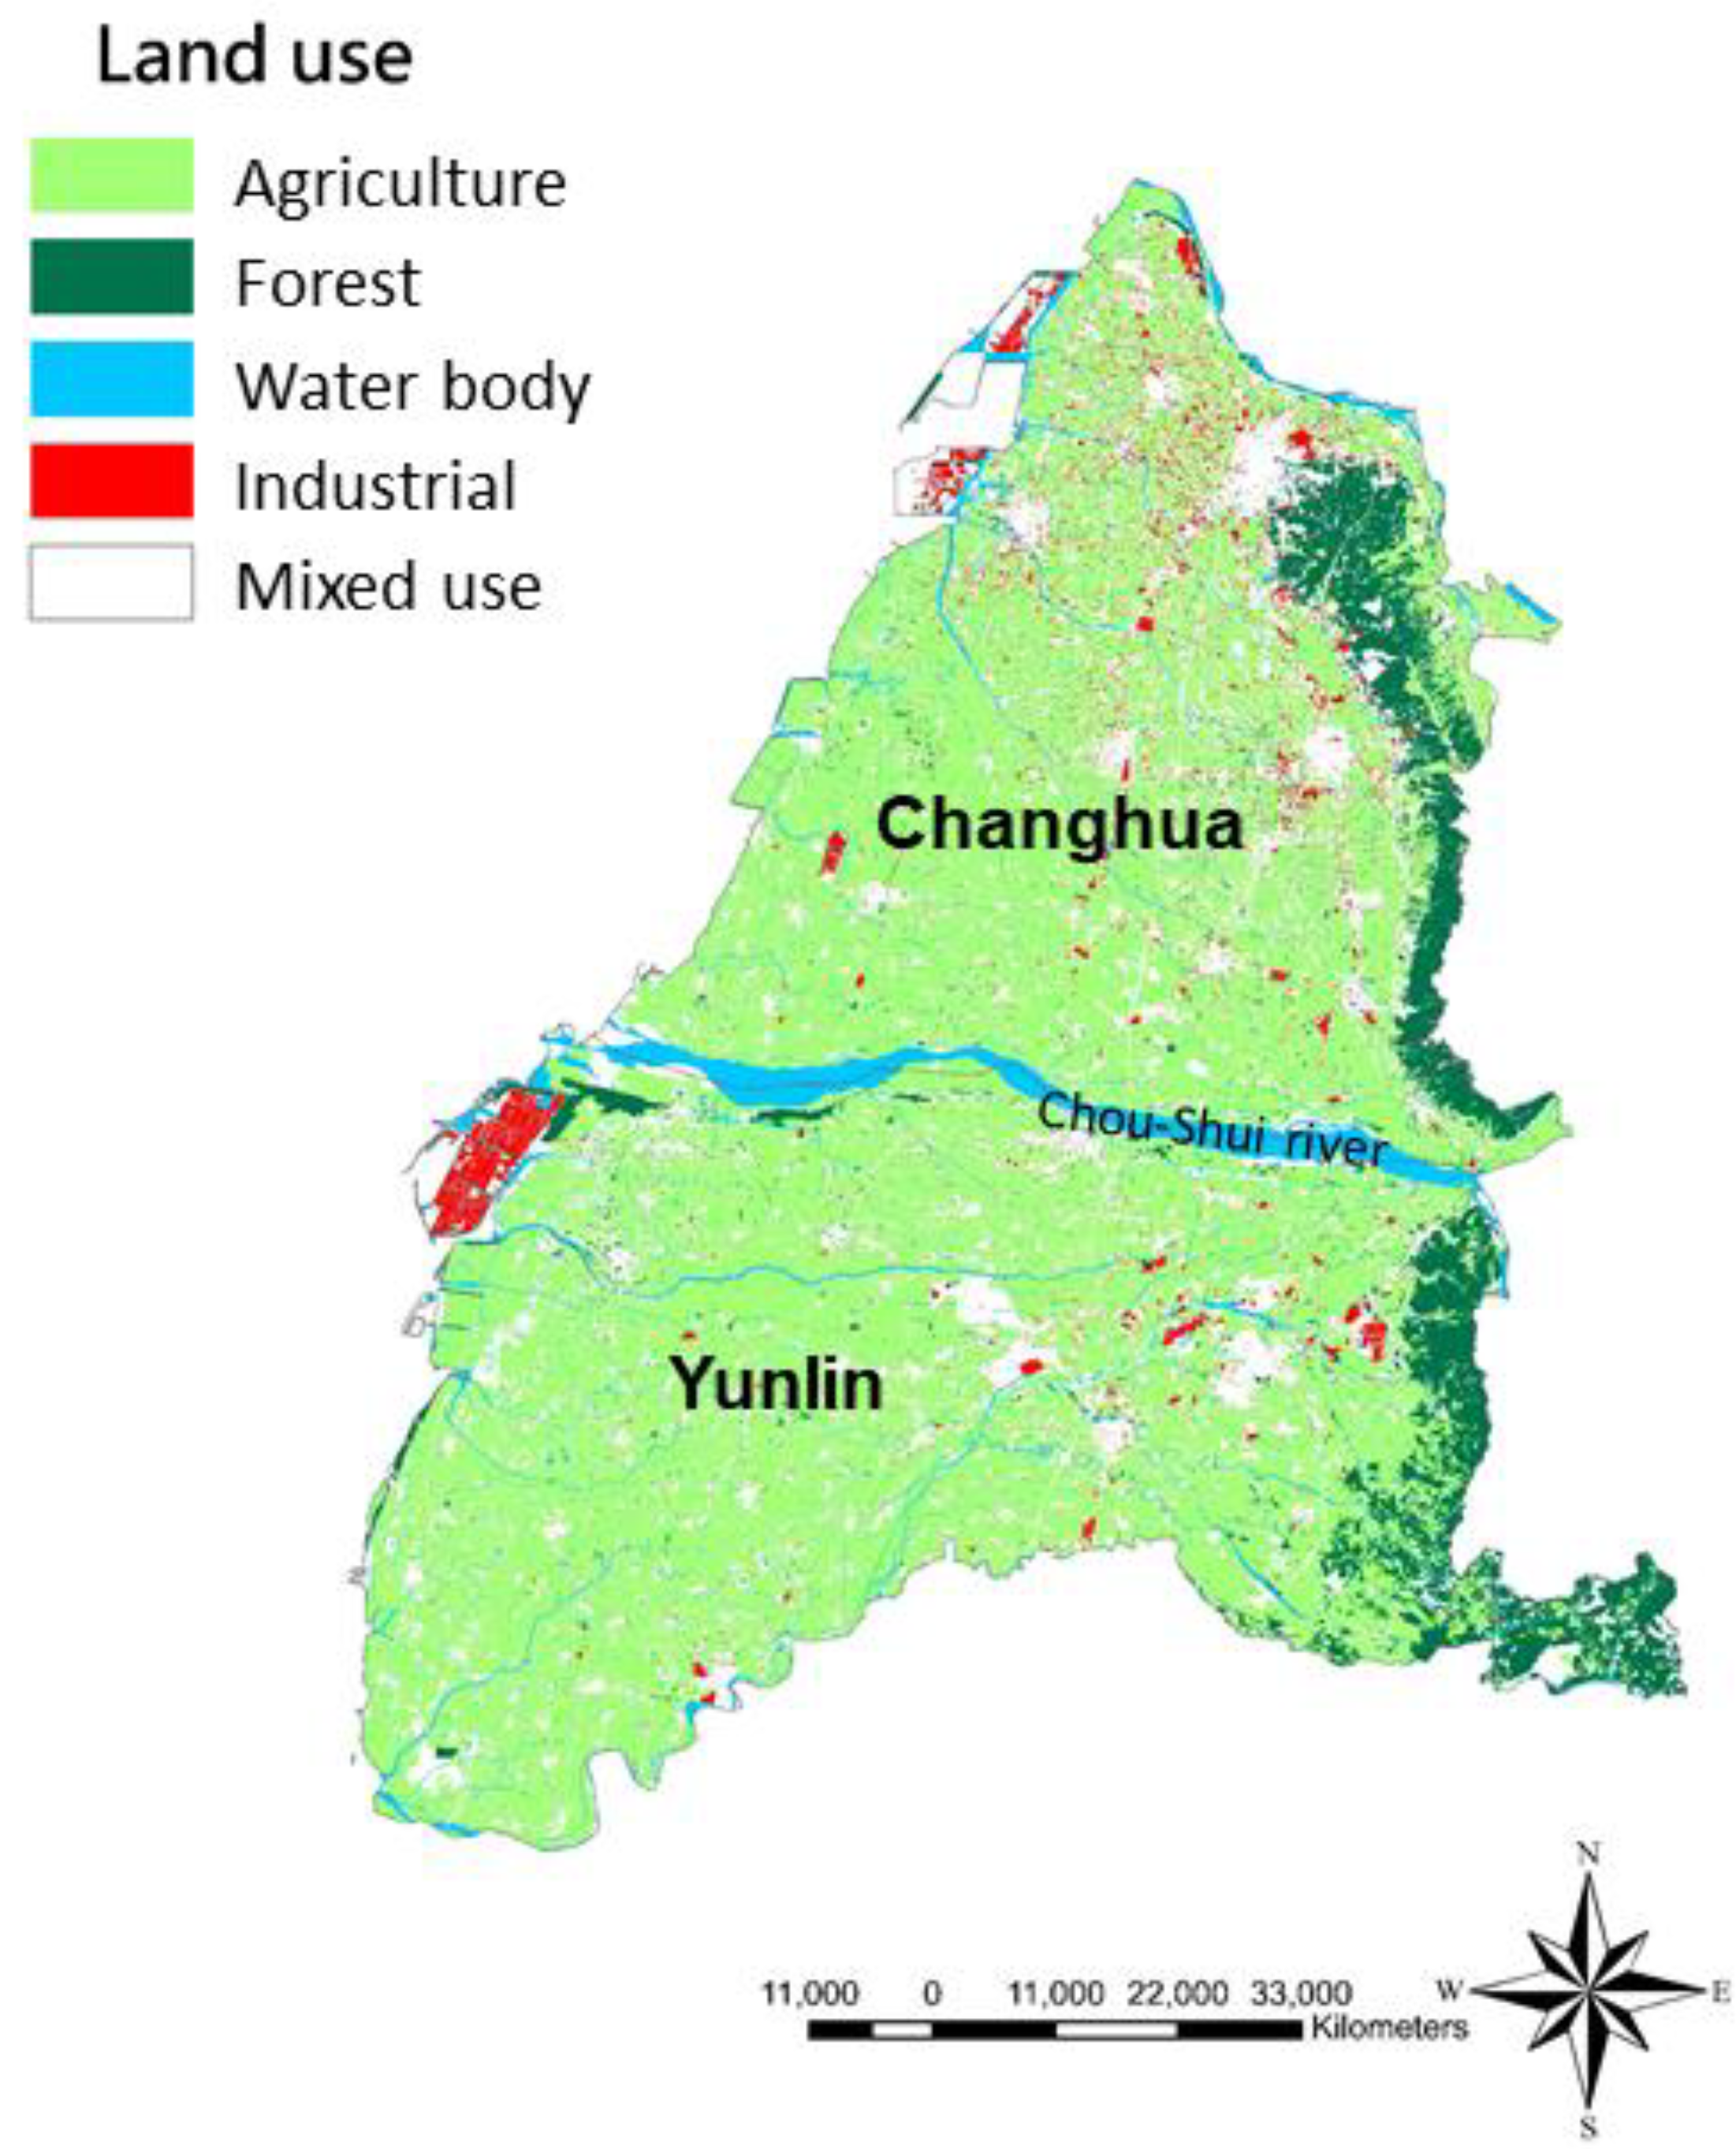
The Chou-Shui river basin in Central Taiwan is chosen as the study area for this research. The Chou-Shui river is 186.6 km in length and covered a basin area of 3155 km2 with 11 sub-watersheds (Figure 1). The basin falls in the boundaries of Changhua and Yunlin counties, which mainly provides source freshwater for their water supply systems. Freshwater resources in the basin area fluctuate with extreme periods of shortage and abundance. Groundwater is another source of water in this area. The water use in this area is approximately 240,000 tons per day, in which majority of the water is used in agriculture (e.g., paddy rice), with 1.8 and 1.5 billion cubic meters per year on average for Changhua County and Yunlin County, respectively. The high water demand in this area resulted in water-related difficulties such as water shortage and land subsidence from improper use of groundwater. Lee et al. examined personal water footprint in Yunlin County and revealed that the footprint was the highest in coastal areas, mainly due to the location quotients of industries (primary, secondary, or tertiary industry) [17]. In fact, the industries also suffered from serious water shortage, especially in the dry seasons when the water rights of public and agricultural uses were prioritized over industrial uses [9]. The retail price for tap water in Taiwan is at about 0.352 USD per m3 of water, while the cost for abstraction, treatment, and distribution of freshwater is at about 0.365 USD per m3 of water. The energy consumption for potable water treatment plants and water supply stations (pumping and distribution) in Taipei were reported in a range of 0.16 to 0.25 kWh/m3 and at 0.17 kWh/m3 in average, respectively [18]. Lower energy consumption may be expected for the case study area of Changhua and Yunlin Counties, as they are close to the source water and have relatively lower elevation.
2.2. Design of the MCDA
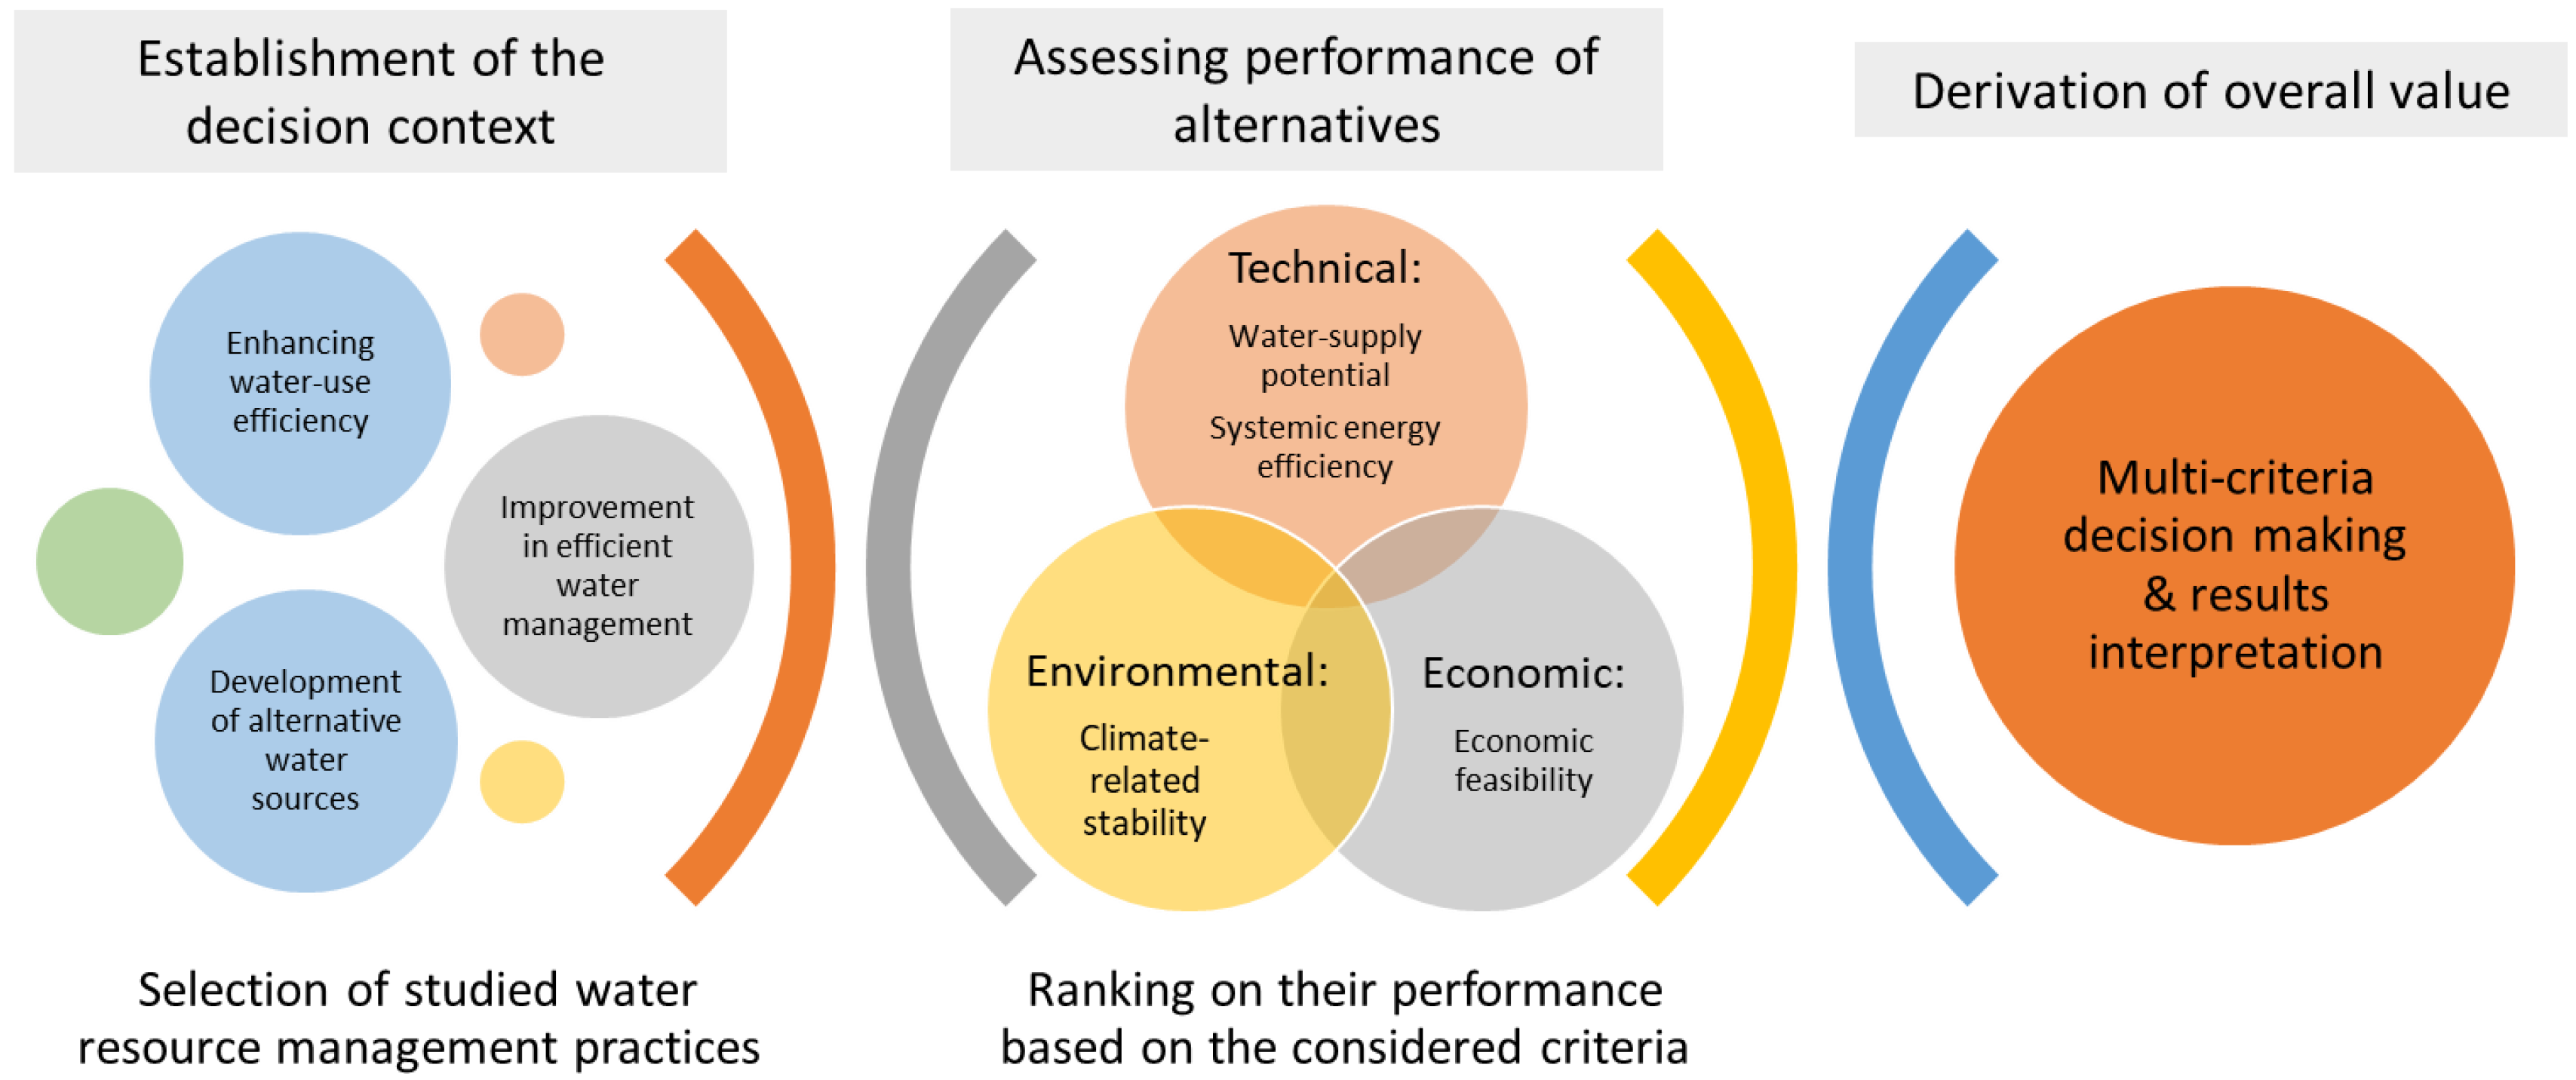
This study adopts a structured MCDA process that includes four major interdependent steps: establishment of the decision context, assessing performance of alternatives, determination of the preferences of the decision makers of stakeholders (e.g., assigning weights for each criterion to reflect their relative importance to the decision), and derivation of overall value for evaluate and compare alternatives [19,20]. Figure 2 shows the flow of this study in adopting MCDA procedures for prioritizing the water resource management practices.
At first, the decision context with specific problem statement is structured, including framing, setting system boundaries, and identifying objectives and alternatives. Hereby, the alternatives were assessed in pairwise comparison regarding their performances to achieve the main criteria (attributes) for decision making. Scales of 1–12 (lowest to highest) were used for ranking the performance of the studied alternatives. Among the considered attributes, economic feasibility was the most important for a water management practice to be considered successful and sustainable, followed by water-supply potential, energy efficiency, and climate-related stability, based on the experiences from the authors. Simple multi-attribute rating technique (SMART) was then applied to assign weights for the studied attributes, and the rank order centroid weighting method (a linear additive model) was adopted in this study [21]. The total value of overall performance was calculated by
where Vj is the overall performance value for a selected water resource management practice j; wk is the weight of the importance of the performance criteria; and pjk is the performance ranking of practice j on criterion k. A decision matrix was then set up for evaluation of different alternatives, according to the criteria. The weight of importance (wk) for the performance criteria are 0.5208, 0.2708, 0.1458, and 0.0625 for economic feasibility, water-supply potential, systemic energy efficiency and climate-related stability, respectively, while using the surrogate weights from the SMART technique proposed in Roberts and Goodwin [21]. The technique was used to simplify the process in elicitation of the weights, as determination of the weights was based on number of attributes and the corresponding ranking. Summation of the weights equals 1.
2.3. Current Practices for Water Resource Management
In this study, three classification goals of the water management practices were considered, including enhancement of water-use efficiency, development of alternative water sources and improvement in effective water management. In total, 12 practices that were available and applicable in the study area were defined, as shown in Table 1. Selection of the practices was adopted from existing measures and government reports [22,23,24,25].
These selected practices corresponded to the three water management goals. For instance, water conservation techniques for agriculture, such as drip irrigation or wireless sensor irrigation, were proposed to reduce inputs of water resource and enhance water-use efficiency [26]. Water conservation programs were also shown effective in reducing water demand in residential sectors, providing up to 14% of reduction in household water demand [27]. Development of alternative water sources—such as reclamation of domestic and industrial wastewater [7,28], desalination of seawater [29], green infrastructure of rainwater catchment [5], and reuse of irrigation return water [30]—were considered to increase the water-supply potential. However, these water sources might consequently increase the overall energy demand in the water supply system [3,6]. Additionally, replacement of aged pipelines (to lower the possibility of leakage), reducing the leakage rate of agricultural irrigation channels and improvement in monitoring and management of groundwater pumping were proposed to support effective water management [23].
2.4. Determination of Overall Performance
Decisions on recommending the best water resource management practice remained difficult due to the variety of options, complexation in cost-effective evaluations, and potential trade-offs in sustainability. Therefore, four quantifiable attributes (performance criteria) were identified to measure attainment of the practices, including technical, economic, and environmental criteria. The selected attributes were water-supply potential, energy efficiency, economic feasibility, and climate stability, as described in Table 2. These attributes were selected from the influential attributes reported by Scholten et al. [20]. Selection of the attributes was done by the authors of this study based on their experiences in transdisciplinary sustainability science for water resource management and environmental engineering. These attributes were also intended to be used in MCDA analysis specifically adapted for water resource management. The functional unit for estimation of the potentials is set to be provision quantity in a unit-period of one year (e.g., provision of water for one year). This is intended to minimize the uncertainty between estimations (average out the uncertainties).
2.4.1. Water-Supply Potential
Water-supply potential is a direct attribute to determine the performance of water resource management practices. It measures the potential for increasing water supply or reducing water demand that consequently reduce the pressure on water supply systems. For example, alternative water sources such as rainwater harvesting, desalination of seawater, or reuse of reclaimed wastewater can be considered as viable water-supply alternatives [32]. In addition, promotion of water conservation programs or water-use efficiency practices were technically available for the industrial and residential sectors, and efforts have been made to improve the management of the water resources [33,34]. These practices offered to increase the water supply by reducing water demand.
The potential from reclamation of wastewater (Wreclaimed) was calculated by actual wastewater effluent (Weff) and water recovery potential (RW), as depicted as
The potential from rainwater harvesting (Wrainwater) can be estimated by multiplying the average daily precipitation (Rp), available area for rainwater catchment (Ar) and probability of precipitation (Pr), as expressed as
The average daily precipitation and probability of precipitation in Central Taiwan are 4.45 mm and 0.312, respectively. The use of probability of precipitation for rainwater estimation is intended to account for the seasonal effects on the precipitation, therefore, specific value for the study region is recommended. The potential area for rainwater catchment was calculated from the total area of public use in both Changhua and Yunlin Counties (Table 3), with assumption of a building coverage ratio of 60%. The water recovery potential for domestic wastewater effluent was assumed to be 80%. Water saving potential for the residential water conservation program in Yunlin County was expected to be 20 L per capita per day, whereas Changhua County has shown effective use in their water and no future water saving could be obtained [22].
2.4.2. Systemic Energy Efficiency
The use of systemic energy efficiency as one of the attribute was due to the fact that water systems are one of the major users of energy resources [35]. Implementation of water conservation practices or improvement in effective water management may contribute to decrease in energy demand within the water system, whereas development of alternative water sources may require additional energy demand for the system. The level of energy requirement per unit of water (e.g., energy intensity) strongly depends on the processes involved and the water quality level before end-use [36].
Commissioning of alternative water sources such as desalination and wastewater recycling are expected to increase the total energy requirement of water systems [37]. The overall energy demand for modern seawater RO plant ranges from 3.0 to 4.0 kWh/m3 [38]. Rainwater catchment, on the other hand, may only require minimal energy for pumping (approximately at 1 kWh/m3) [39].
2.4.3. Economic Feasibility and Climate-Related Stability
Table 4 lists performance values assigned for the attributes of economic feasibility and climate-related stability. The economic feasibility was classified into five major ranking intervals, while only three ranking intervals were considered for climate-related stability. The attribute of economic feasibility considers the practices’ costs and revenues as well as if the practices are logical and possible to be completed. It could be simply determined by the practice project’s scale, as costly development on a national or regional scale may not be economically feasible for practical implementation [31]. For instance, installation of water-saving appliances in households is more economic feasible than implementation of smart irrigation system. Building wastewater reclamation plants or seawater desalination plants are the least economic feasible practices, as they all require significant amount of monetary investment and land use. The attribute of climate-related stability describes the experiences of irregular rainfalls due to global climate change, and thus significantly influence the amount of rainwater harvesting. In the studied practices, man-made infrastructures such as wastewater reclamation plants and seawater desalination plants showed no impact from the climate-related uncertainty [3], whereas green infrastructures of rainwater catchment revealed strong impacts [40,41]. Practices for the agriculture sector, either for water conservation program or leakage rate reduction for irrigation canals were assumed to be indirectly affected by the climate change, as the variation in precipitation could consequently result in change in water use efficiency [42].
3. Results and Discussion
3.1. Performance of the Practices
Table 5 and Table 6 summarize the performance and unweighted performance ranking values of the 12 studied water resource management practices. Determination of the performance rankings was assumed to be proportional to water-supply potential or overall systemic energy efficiency. However, the calculation and assumptions on the water-supply potential or overall systemic energy efficiency might be site specific and can be only applied to the case study. For instance, the water-supply potential for residential water conservation program may be greater in populated urban area than that in sub-urban area. Other the other hand, the calculations for wastewater reclamation potential (Equation (2)) and rainwater harvesting (Equation (3)) are for general uses. One thing to note is that the functional unit for water-supply potential and systemic energy efficiency was based on a unit-period of one year (e.g., annual provision of water supply).
Water-supply potential for the studied practices ranged from 1050 to 655,000 thousand m3 per year for domestic wastewater reclamation and reduction of leakage rate on irrigation canals, respectively. The lowest potential for domestic wastewater reclamation (1050 thousand m3 per year) was due to limited source of wastewater for reclamation, as the total population in these two counties only accounted for about 8.5% of total population in Taiwan. Similarly, the potential for a water conservation program in residential sector (5026 thousand m3 per year) was estimated at the lower end among the studied practices, assuming a water saving of 20 L per capita per day. Water savings for water use efficiency measures of showerhead, toilet and clothes washers were reported at approximately 106, 131, 150 L per household per day, respectively [27].
Water-supply potential for industrial wastewater reclamation (6300 thousand m3 per year) was confined by their specification of existing measures. Manufactures that located in government-organized industrial area were mandated to improve their water use efficiency, by detecting of abnormal water usages, increasing water reuse in process system or reusing of reclaimed water for secondary use [33,34]. The expected water-supply potential was calculated using existing measures or implementation of additional on-site measures by the Formosa Plastics Corporation (FPC) [9]. A seawater desalination plant at 100,000 m3 per day was also proposed by the FPC to top-up their water demand and consequently to reduce the industrial withdrawal of potable water.
The water-supply potential for rainwater harvesting was highly depended by weather condition (precipitation) and available area for rainwater catchment, as described in Equation (3). The potential for rainwater harvesting ranged from 3900 to 8058 thousand m3 per year, considering the availability of suitable area or site for implementation of the system. A study on using harvested rainwater for buildings revealed fair to moderate level of reliability from satisfying about 37% of non-potable water demand by harvested rainwater. The amount of harvested rainwater was estimated based on annual rainfall of around 1000 mm and effective roof area of 1600 m2 [39].
The water-supply potential for agriculture-related practices ranked the highest among other practices. This is due to the fact that the major economic activity in Choshui river basin is agriculture, and it shares the highest water demands among other economic sectors, accounting for about 74% of freshwater withdrawals. The highest potential of 655 billion m3 per year from reducing leakage rate in irrigation canals could be attributed to the long length of irrigation canals (9,355,730 m). The expected water savings from reducing leakage is at 70 m3 per meter of canal per year [24]. Likewise, the potential of 225 billion m3 per year was obtained from promoting drip irrigation or other smart irrigation measures, based on a water saving rate of 2000 m3 per hectare, compared to conventional irrigation methods [9,24]. Reuse of agricultural return water was proportional to agricultural water demand, resulting a water saving estimation of approximately 200 billion m3 per year at an ultimate recovery rate of 50% [43].
The performance of systemic energy efficiency for studied water management practices was assumed to be proportional to the water-supply potential. For practices that provide water savings or reduced water demand were expected to have less systemic energy demand as compared to baseline (i.e., less energy requirement for abstraction and treatment of source water), thus, contributed to relatively higher performance ranking (Table 6). The ranking of water conservation program for agricultural sector was greater than that for residential sector. On the contrary, practices that require additional treatments were expected to have higher systemic energy demand than those in baseline, resulting in relatively lower performance ranking.
The energy requirements for water sectors at a global level are 0.0002–1.74 kWh/m3 for surface water supply, 0.37–1.44 kWh/m3 for groundwater pumping and 2.4–8.5 kWh/m3 for desalination (using membrane-based technology) [44]. The energy demand for state of the art seawater reverse osmosis (RO) with energy recovery devices (ERD) was assumed to be 3.1 kWh/m3 [37], which is within the range of a modern seawater RO plant at overall energy demand of 3.0 to 4.0 kWh/m3 [38]. Fane reviewed developed strategies and technologies for desalination to achieve lower energy demand and reduced carbon footprint [29]. The study proposed the use of improved membranes for potentially reducing energy demand by 15% to 20%. Rainwater catchment, on the other hand, may only require energy for pumping from its simple design, with median energy intensity from 0.2 to 1.4 kWh/m3 [4]. An evaluation study of alternative water sources by Cook et al. reported an energy demand for rainwater system at 0.44 kWh/m3, which was mainly from pumping from storage tank [39]. A mean value of 1.0 kWh/m3 was used as energy demand for rainwater harvesting system in this study.
Wastewater reclamation, either from domestic or industrial, requires a remarkable amount of energy for treatment. Energy demand for wastewater reclamation in this study was 2.14, 1.5, and 1.1 kWh/m3 for domestic, industrial, and agriculture, respectively. The highest energy demand for domestic wastewater reclamation was due to the use of tertiary treatment for better product water quality for industrial end-uses [3], while reusing of irrigation return water might only require relatively lower energy for pumping and simple treatment such as filtration. In particular, salinity levels from sodium and chloride salts are undesirable in irrigation water [45]. The energy demand for industrial wastewater reclamation fell in between the demand for domestic and agriculture, as a result of application of advanced treatment (activated carbon filtration and RO) from cascaded wastewater [33].
3.2. MCDA Results
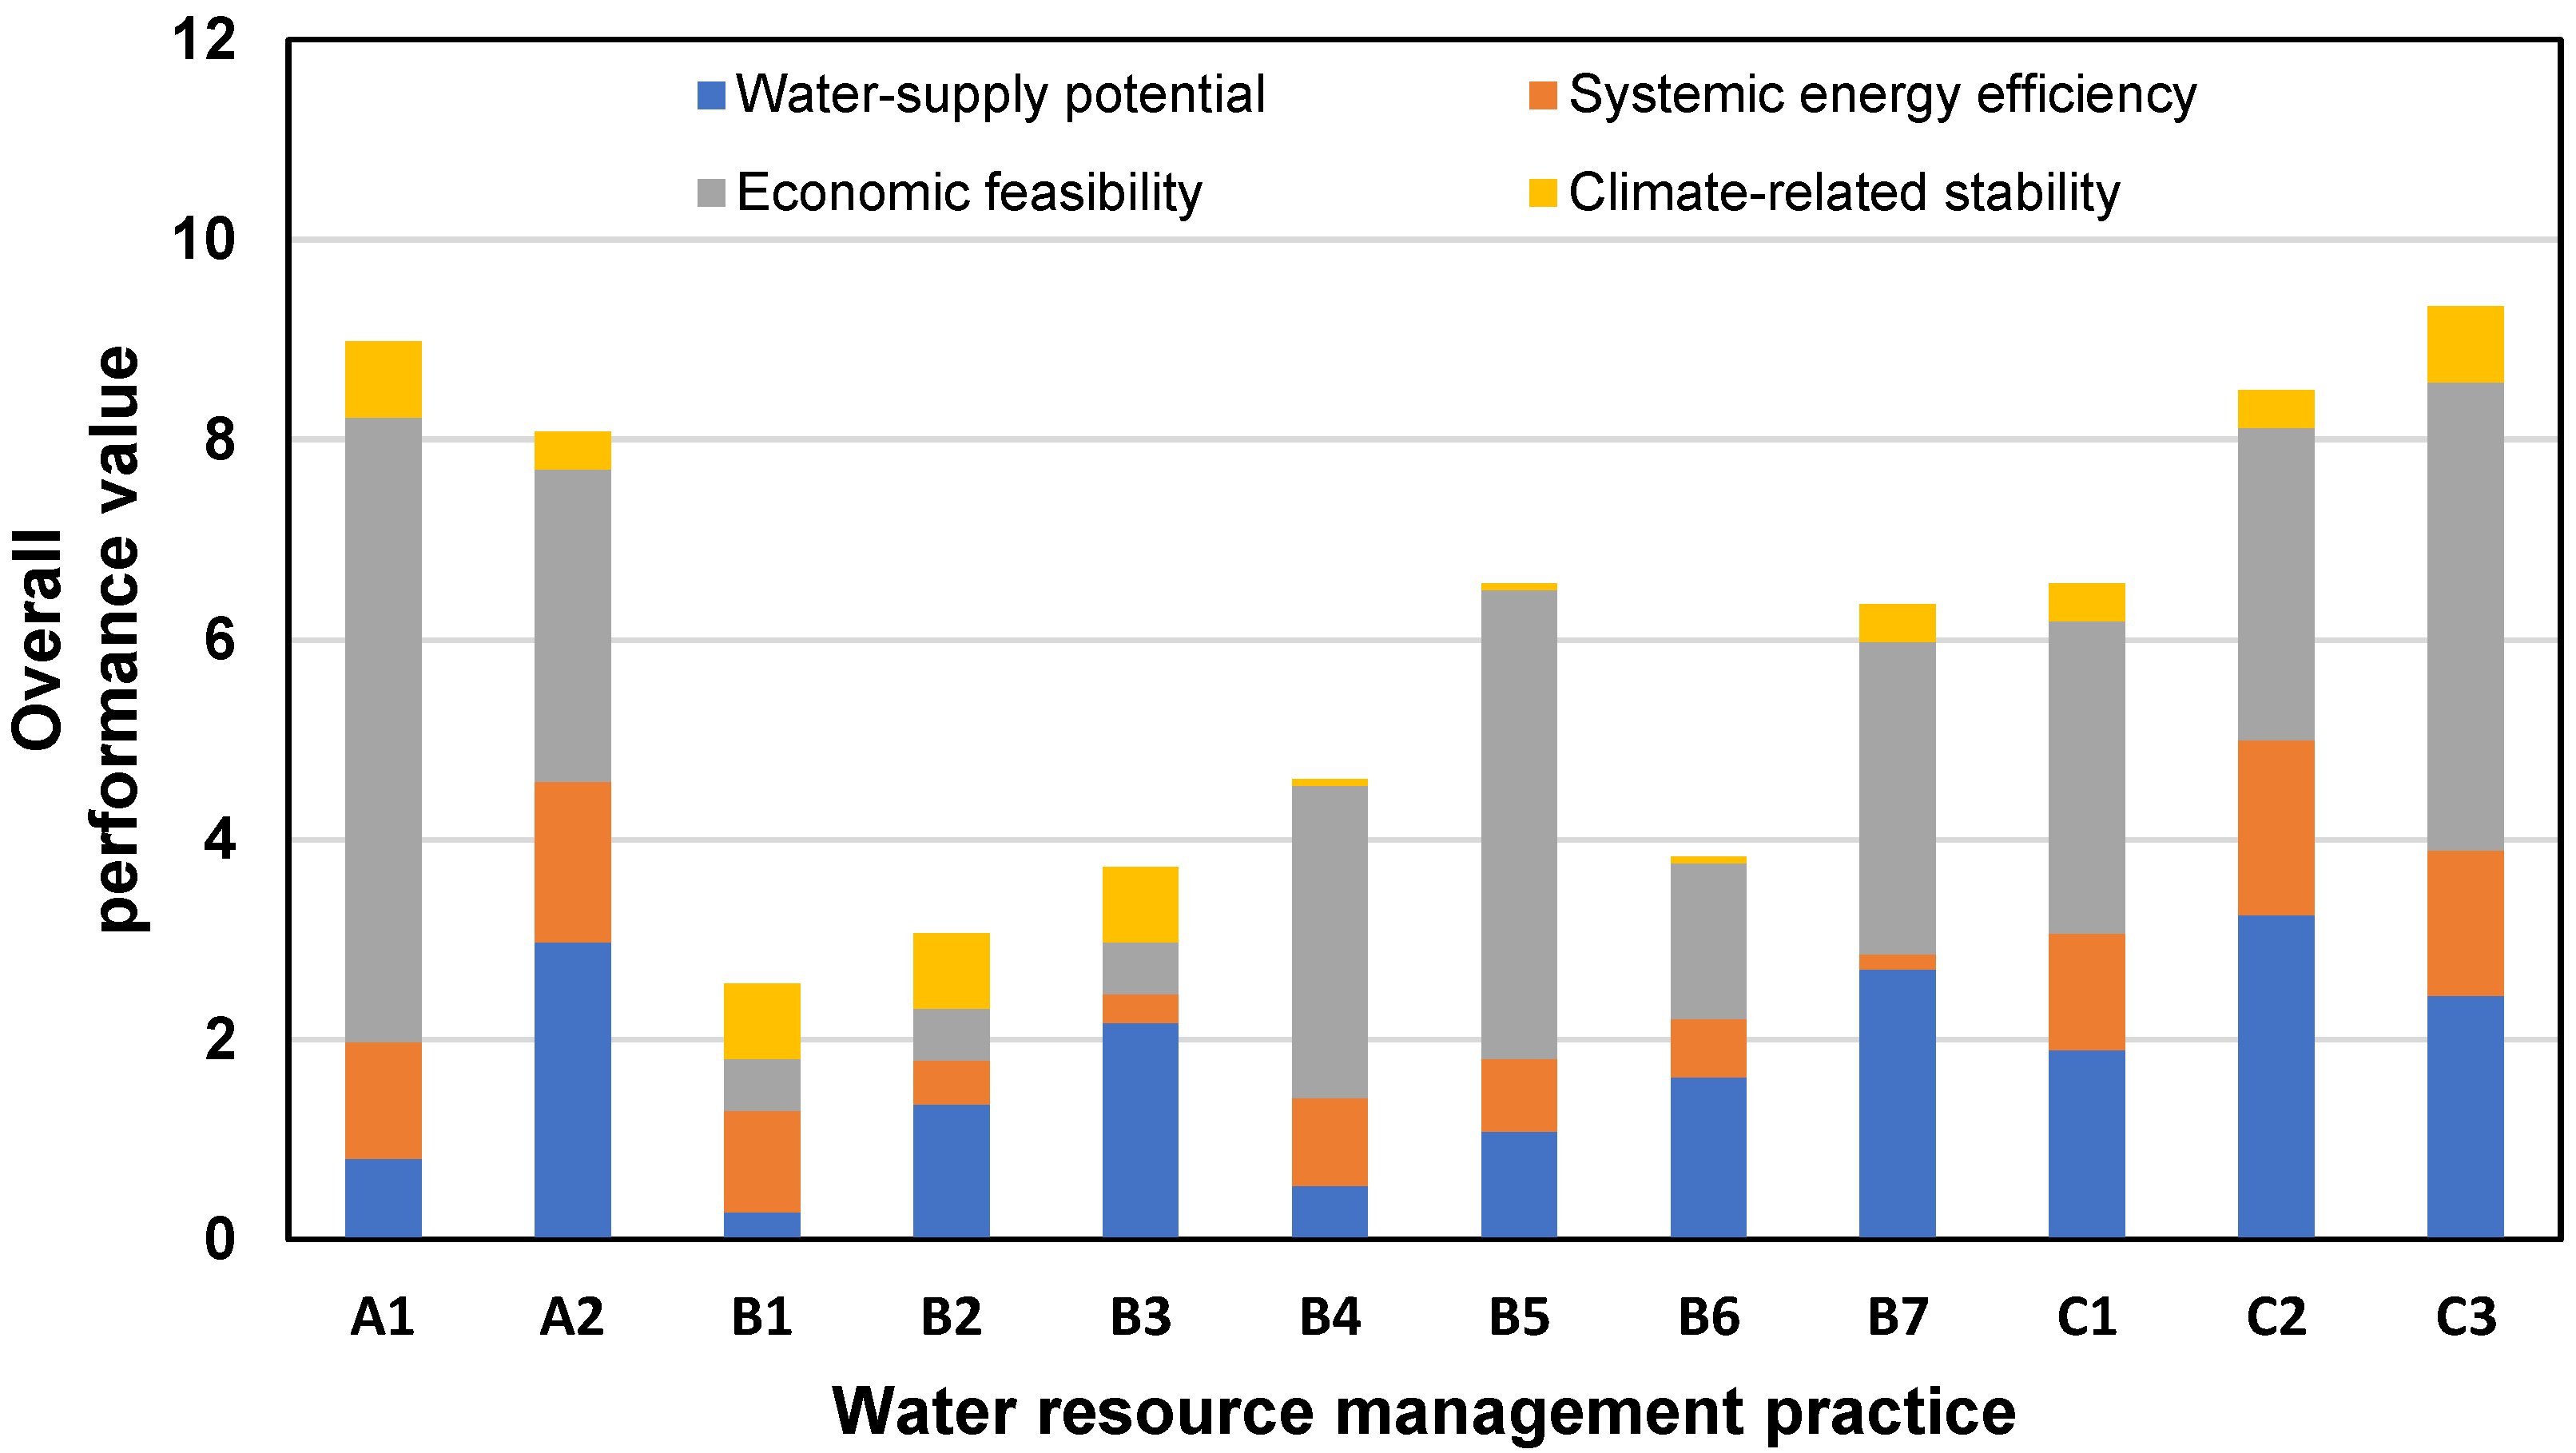
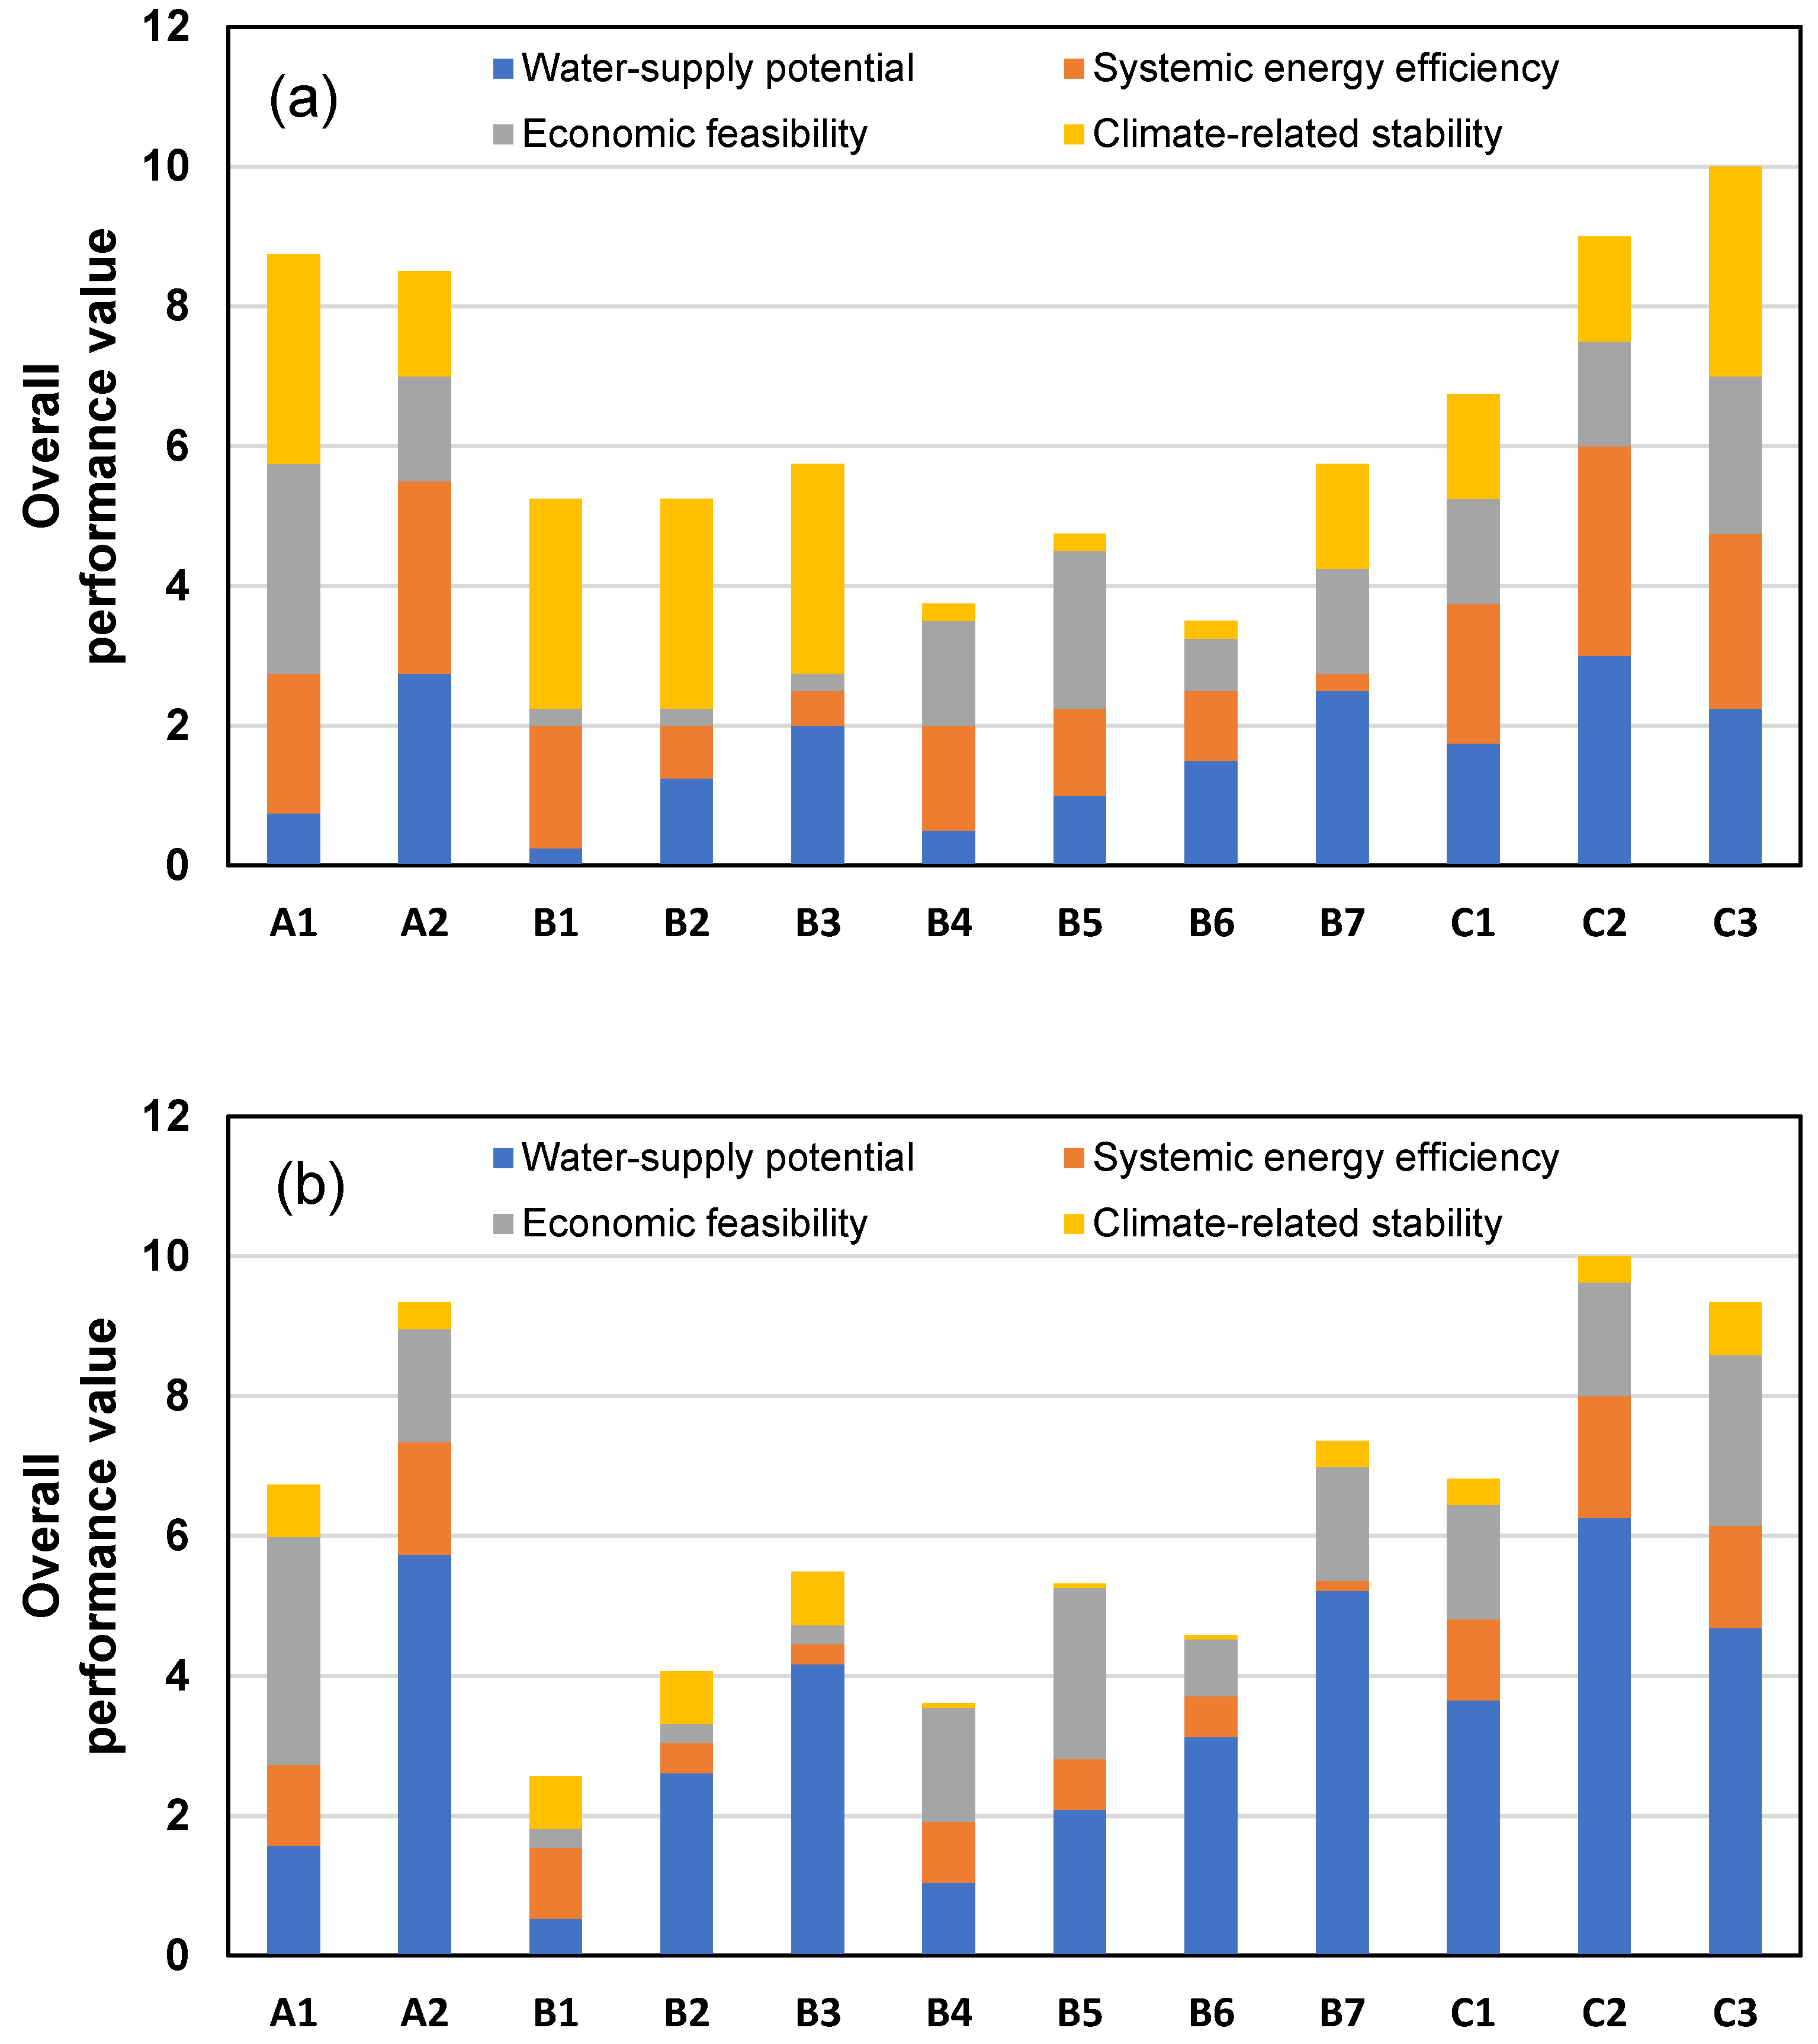
The MCDA results showed differentiated ranking for the 12 studied water resource management practices (Figure 3). A sensitivity analysis was also conducted to evaluate the influence of criteria weights on the MCDA results (Figure 4). Figure 4a shows the results from making all the criteria are equally important, while Figure 4b,c depict the results of ranking water-supply potential and systemic energy efficiency the most important criteria, respectively, considering those two criteria may be prioritized before economic feasibility. These scenarios were set for maintaining the stability in both water and energy systems, which could be attributed to the minimization of time delay associated with the constructions of new infrastructures (e.g., desalination or wastewater reclamation plants) [46].
Practices for improvement in effective water management such as monitoring and management of groundwater pumping (C3) scored the highest, followed by leakage rate reduction for agricultural irrigation canals (C2). This could be attributed to their relatively higher economic feasibility and water-supply potential. Their high water-supply potential also led to moderate to high systemic energy efficiency, as a result of providing both water and energy savings. Groundwater depletion is an inevitable global challenge from over-withdrawing water from aquifers, which also raised the issues of decreased well yields, increased pumping costs, deteriorated water quality, damaged aquatic ecosystem, and increased land subsidence [47]. The action of scientific monitoring and assessment of groundwater therefore was applied to ensure a sustainable source of groundwater and to prevent saltwater intrusion in coastal aquifers [48].
Water conservation programs for residential (A1) and agricultural (A2) sectors were also ranked as high priority in the studied water resource management practices, as a result of their relatively high economic feasibility, especially for the residential sector. Studies on residential water end-uses have found that implementation of water conservation programs showed positive influence on overall water demand and led to significant water savings [27,49], but offsetting behavior or rebound effect might occur after a period of time [50]. The water savings also contributed to significant energy savings during water uses [27]. The study on determinants of residential water demand in Italy claimed that application of tariff had a negative impact on residential water consumption, which cloud be seen as a relevant driver of domestic water consumption [49]. Yunlin County, the case study, has a variety of water use patterns. Several residential areas in the county were reported to have the highest water footprints, whereas manufacturing-dominated area such as Mailiao Township showed relative smaller water footprint than in other townships. Industrial development in the township had little influence on the individual use of water. Therefore, attention on water conservation in the region was suggested to be paid to the reuse and recycling of industrial wastewater [17].
Water conservation program or irrigation return water reuse (B7) in the agriculture sector, on the contrary, were expected to provide a great potential in water savings, as the agriculture accounted for approximately 60–90% of consumptive water use worldwide. It was also directly linked to the sustainability goals in agriculture water use. Efforts have been made to initiate programs that focused on agriculture water conservation or withdrawal restrictions. Clean technologies in agriculture aiming at reducing resource inputs (water, energy, and other constitutes), producing renewable energy or protecting the environment were studied and prioritized for decision making [26]. Field implementation of improved automated irrigation system based on crop and site characteristics along with fuzzy decision support approach was used with remarkable water savings [51]. An investigation on options and difficulties to improve water-efficient practices in irrigation showed that the farmers may lack adequate knowledge or requires strong incentives to make extra efforts to improve water efficiency level [52]. An optimization study of land and water resource allocation for irrigation revealed that, although net irrigation return was high for higher deviations in existing cropping pattern, 20% of deviation was suggested to be the best alternative for satisfying the socio-economic requirements [53].
Several studies have reported on the implementation of alternative water sources, such as rainwater or desalinated seawater, for regional or local use. Notable examples included harvesting runoff from roofs for toilet flushing and landscape irrigation [39]. In a study of public acceptance of alternative water sources from nine locations, desalinated seawater was preferred for most of the water uses, while harvested rainwater was second preferred for cleaning, toilet flushing and garden watering [53]. Rainwater harvesting (B4, B5, and B6) is an easy-to-adopt water management measure and has shown great potential to improve water security during extreme weather events. Therefore, it was recommended in this study to collect local available rainwater as an alternative water source. Yet, studies are still discussing the challenges of its practical use, including contamination, general lack of design criteria [41] as well as on instability relative to climate change. The performance of rainwater harvesting systems was expected to be reduced by 2–14% under the influence of climate change, and the system was more affected in the dry season than in the wet season [40].
The least preferable water resource management practices fall into the category of wastewater reclamation, either from domestic (B1) or industrial (B2) sources, mainly due to their relatively lower systemic energy efficiency. Wastewater reclamation processes and desalination all required intensive use of energy, particularly for the ones with pressure pumps or advanced treatments [2]. Water uses and reuses in industries varied greatly and could be industry-specific. This implied the necessity of proper management and selection of water recycling schemes, in order to fully satisfy the water quality standards at user ends [34]. Studies also showed that adoption of water resource management practices in industries might not be a pure concern for environmental sustainability or business strategy development, economic opportunity turned out to be a key challenge for promoting the practices [33]. All of these indicated that manufacturers reside in this study region might be obligated to invest adaptation measures by their own, as the water rights of the public and agricultural use were prioritized over industrial use during dry seasons [9].
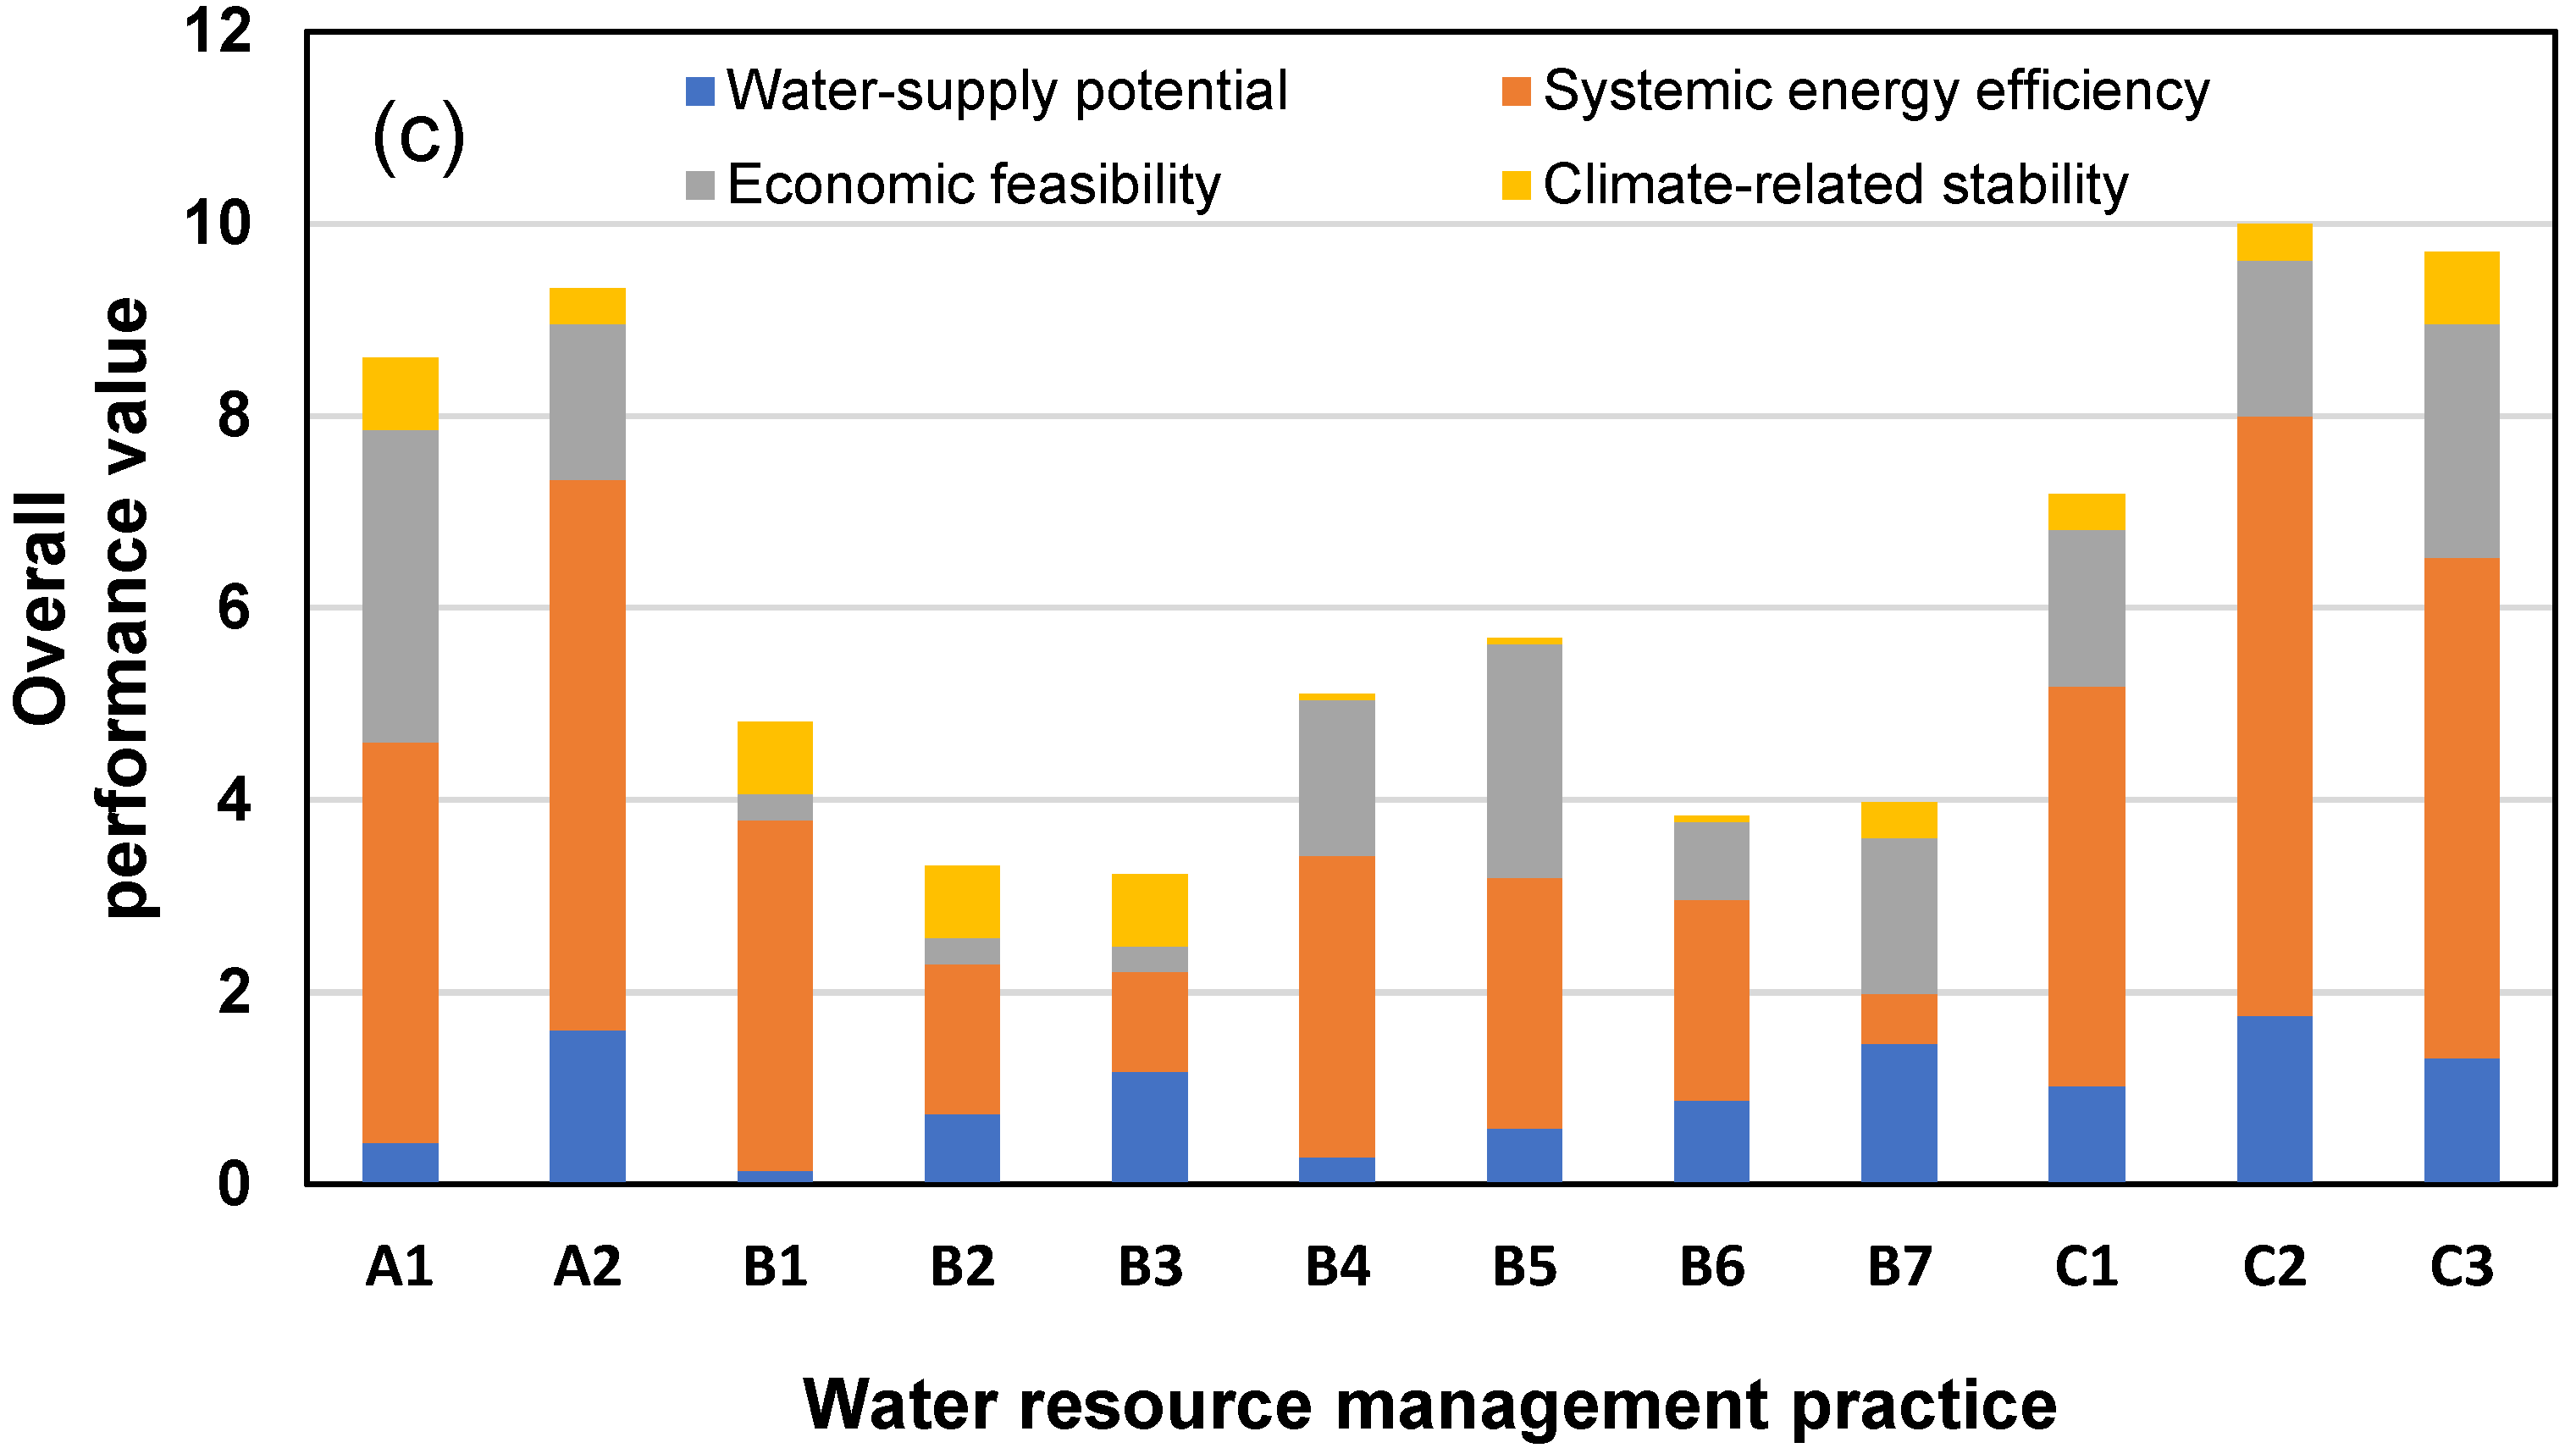
Our results demonstrated the importance of considering water–energy nexus in decision making. The results from sensitivity analysis showed completely different trends for practices with relatively high water-supply potential but required additional energy use (e.g., B1, B2, B3, and B7), as shown in Figure 4b,c. Additionally, those practices may become less favorable considering their potentially large costs than the conventional water sources, human health risk, and public perception [54]. These findings are similar to the arguments in Ghisi et al. that selection of water management strategies should be based on indicators other than only the potential for water savings [55]. This is also the reason that the MCDA played an important role in this study to aggregate various criteria with different units of measurement for better decision making. The results from this study further support the observations made by Chen et al. [9], in which future studies on planning and implementing of water-related adaptation pathways require dynamic monitoring and modification in responding to future climate and social-economic changes.
4. Conclusions
Water management practices of enhancing water-use efficiency, development of alternative water sources, and improvement of effective water management were reviewed and evaluated in this study from a water–energy nexus perspective. The thinking of water–energy nexus was particularly important in this study as water resource management in Taiwan may confront not only freshwater resource but also energy resource constraints. Multi-criteria decision-making considering water supply potential, economic feasibility, systemic energy efficiency, and climate-related stability were applied for recommending the best option or set of good alternatives for sustainable water resource management. Ranking on the studied attributes were based on their relative performance, while simple multi attribute rating technique (SMART) was applied to assign weights for the studied attributes. While economic feasibility was ranked as the highest weight of importance, the practices with high feasibility such as monitoring of groundwater pumping and residential water conservation program were scored as the highest priorities. Practices with relatively higher water-supply potential or higher systemic energy efficiency also contributed to the prioritization of water management practices. Our findings confirmed that selection of water management practices should be based on multiple performance indicators to better understand the tradeoff and overall benefits. This study can be of interest to future decision-making researches in sustainable water resource management.
Author Contributions
M.L. and P.-C.C. conceived the MCDA study; M.L. and C.-Y.Y. primarily collected the data on current practices and conducted the analysis; M.L. and C.-H.H. wrote the paper. C.-H.H. and P.-C.C. supervised the entire research.
Funding
This research was funded by Formosa Plastics Corporation, Taiwan.
Acknowledgments
The authors would like to thank for the support from the Formosa Plastics Corporation (FPC) through the project of “Plan of Water Resources Management and Subsidence Prevention and Control”. This publication is a result of the project.
Conflicts of Interest
The authors declare no conflict of interest. The founding sponsor has no role in the design of the study; in the interpretation of results; and in the decision to publish the results.
References
- Rothausen, S.G.S.A.; Conway, D. Greenhouse-gas emissions from energy use in the water sector. Nat. Clim. Chang. 2011, 1, 210–219. [Google Scholar] [CrossRef]
- DeNooyer, T.A.; Peschel, J.M.; Zhang, Z.; Stillwell, A.S. Integrating water resources and power generation: The energy-water nexus in Illinois. Appl. Energy 2016, 162, 363–371. [Google Scholar] [CrossRef]
- Lee, M.; Keller, A.A.; Chiang, P.C.; Den, W.; Wang, H.; Hou, C.H.; Wu, J.; Wang, X.; Yan, J. Water-energy nexus for urban water systems: A comparative review on energy intensity and environmental impacts in relation to global water risks. Appl. Energy 2017, 205, 589–601. [Google Scholar] [CrossRef] [Green Version]
- Ringler, C.; Bhaduri, A.; Lawford, R. The nexus across water, energy, land and food (WELF): Potential for improved resource use efficiency? Curr. Opin. Environ. Sustain. 2013, 5, 617–624. [Google Scholar] [CrossRef]
- Vieira, A.S.; Beal, C.D.; Ghisi, E.; Stewart, R.A. Energy intensity of rainwater harvesting systems: A review. Renew. Sustain. Energy Rev. 2014, 34, 225–242. [Google Scholar] [CrossRef] [Green Version]
- Plappally, A.K.; Lienhard, V.J.H. Energy requirements for water production, treatment, end use, reclamation, and disposal. Renew. Sustain. Energy Rev. 2012, 16, 4818–4848. [Google Scholar] [CrossRef]
- Kajenthira, A.; Siddiqi, A.; Anadon, L.D. A new case for promoting wastewater reuse in Saudi Arabia: Bringing energy into the water equation. J. Environ. Manag. 2012, 102, 184–192. [Google Scholar] [CrossRef] [PubMed]
- Lin, C.C.; Lin, J.Y.; Lee, M.; Chiueh, P.T. Sector-wise midpoint characterization factors for impact assessment of regional consumptive and degradative water use. Sci. Total Environ. 2017, 607–608, 786–794. [Google Scholar] [CrossRef] [PubMed]
- Chen, P.Y.; Huang, S.J.; Yu, C.Y.; Chiang, P.C.; Liu, T.M.; Tung, C.P. Study on the Climate Adaption Planning for an Industrial Company with Regional Risk of the Water Supply System—A Case in Taiwan. Water 2017, 9, 682. [Google Scholar] [CrossRef]
- Wang, H.F.; Sung, M.P.; Hsu, H.W. Complementarity and substitution of renewable energy in target year energy supply-mix planning—In the case of Taiwan. Energy Policy 2016, 90, 172–182. [Google Scholar] [CrossRef]
- Javanbarg, M.B.; Scawthorn, C.; Kiyono, J.; Shahbodaghkhan, B. Fuzzy AHP-based multicriteria decision making systems using particle swarm optimization. Expert Syst. Appl. 2012, 39, 960–966. [Google Scholar] [CrossRef]
- Scholten, L.; Scheidegger, A.; Reichert, P.; Mauer, M.; Lienert, J. Strategic rehabilitation planning of piped water networks using multi-criteria decision analysis. Water Res. 2014, 49, 124–143. [Google Scholar] [CrossRef] [PubMed]
- Alvarado, A.; Esteller, M.V.; Quentin, E.; Expósito, J.L. Multi-criteria decision analysis and GIS approach for prioritization of drinking water utilities protection based on their vulnerability to contamination. Water Resour. Manag. 2016, 30, 1549–1566. [Google Scholar] [CrossRef]
- Jaiswal, R.K.; Ghosh, N.C.; Galkate, R.V.; Thomas, T. Multi criteria decision analysis (MCDA) for watershed prioritization. Aquat. Procedia 2015, 4, 1553–1560. [Google Scholar] [CrossRef]
- Song, J.; Chung, E.S. A multi-criteria decision analysis system for prioritizing sites and types of low impact development practices: Case of Korea. Water 2017, 9, 291. [Google Scholar] [CrossRef]
- Zheng, J.; Egger, C.; Lienert, J. A scenario-based MCDA framework for wastewater infrastructure planning under uncertainty. J. Environ. Manag. 2016, 183, 895–908. [Google Scholar] [CrossRef] [PubMed]
- Lee, Y.J.; Tung, C.M.; Lee, P.R.; Lin, S.C. Personal Water Footprint in Taiwan: A Case Study of Yunlin County. Sustainability 2016, 8, 1112. [Google Scholar] [CrossRef]
- Cheng, C.L. Study of the inter-relationship between water use and energy conservation for a building. Energy Build. 2002, 34, 261–266. [Google Scholar] [CrossRef]
- Keeney, R.L.; Raiffa, H. Decisions with Multiple Objectives: Preferences and Value Tradeoffs; John Wiley: New York, NY, USA, 1976. [Google Scholar]
- Scholten, L.; Maurer, M.; Lienert, J. Comparing multi-criteria decision analysis and integrated assessment to support long-term water supply planning. PLoS ONE 2017, 14, e0176663. [Google Scholar] [CrossRef] [PubMed]
- Roberts, R.; Goodwin, P. Weight approximations in multi-attribute decision models. J. Multi-Criteria Decis. Anal. 2002, 11, 291–303. [Google Scholar] [CrossRef]
- WRA. Strengthening Water Supply System Adaptive Capacity to Climate Change in Central Region; Water Resources Planning Institute, Ed.; Water Resources Agency: Taichung, Taiwan, 2012. (In Chinese) [Google Scholar]
- WRA. Solution and Action Plan for Prevention of Land Subsidence in Changhua and Yunlin Counties; Water Resources Agency: Taichung, Taiwan, 2011. (In Chinese) [Google Scholar]
- Council of Agriculture. Golden Corridor Agricultural New Plan and Action Plan; Council of Agriculture: Taipei, Taiwan, 2013. (In Chinese) [Google Scholar]
- WRA. Regional Water Resource Planning for Central Taiwan; Water Resources Agency: Taichung, Taiwan, 2016. (In Chinese) [Google Scholar]
- Scharfy, D.; Boccali, N.; Stucki, M. Clean technologies in agriculture—How to prioritise measures? Sustainability 2017, 9, 1303. [Google Scholar] [CrossRef]
- Lee, M.; Tansel, B.; Balbin, M. Influence of residential water use efficiency measures on household water demand: A four year longitudinal study. Resour. Conserv. Recycl. 2011, 56, 1–6. [Google Scholar] [CrossRef]
- Jalilov, S.M.; Kefi, M.; Kumar, P.; Masago, Y.; Mishra, B. Sustainable urban water management: Application for integrated assessment in Southeast Asia. Sustainability 2018, 10, 122. [Google Scholar] [CrossRef]
- Fane, A.G. A grand challenge for membrane desalination: More water, less carbon. Desalination 2018, 426, 155–163. [Google Scholar] [CrossRef]
- Pereira, L.S.; Oweis, T.; Zairi, A. Irrigation management under water scarcity. Agric. Water Manag. 2002, 57, 175–206. [Google Scholar] [CrossRef]
- Mankad, A.; Tapsuwan, S. Review of socio-economic drivers of community acceptance and adoption of decentralized water systems. J. Environ. Manag. 2011, 92, 380–391. [Google Scholar] [CrossRef] [PubMed]
- Fielding, K.S.; Gardner, J.; Leviston, Z.; Price, J. Comparing public perceptions of alternative water sources for potable use: The case of rainwater, stormwater, desalinated water, and recycled water. Water Resour. Manag. 2015, 29, 4501–4518. [Google Scholar] [CrossRef]
- Lin, W.S.; Lee, M.; Huang, Y.C.; Den, W. Identifying water recycling strategy using multivariate statistical analysis for high-tech industries in Taiwan. Resour. Conserv. Recycl. 2015, 94, 35–42. [Google Scholar] [CrossRef]
- Lu, B.S.; Lee, M.; Chen, S.T.; Chen, C.H.; Luo, Y.C.; Den, W. Strategic optimization of water reuse in wafer fabs via multi-constraint linear programming technique. Water-Energy Nexus 2018, 1, 86–96. [Google Scholar] [CrossRef]
- Kenney, D.S.; Wilkinson, R. The Water-Energy Nexus in the American West; Edward Elgar Publishing: Cheltenham, UK, 2011. [Google Scholar]
- Hardy, L.; Garrido, A.; Juana, L. Evaluation of Spain’s water-energy nexus. Int. J. Water Resour. Dev. 2012, 28, 151–170. [Google Scholar] [CrossRef] [Green Version]
- Kenway, S.J.; Priestley, A.; Cook, S.; Seo, S.; Inman, M.; Gregory, A.; Hall, M. Energy Use in the Provision and Consumption of Urban Water in Australia and New Zealand; CSIRO—Water for a Healthy Country Flagship: Canberra, Australia, 2008. [Google Scholar]
- Elimelech, M.; Phillip, W.A. The future of seawater desalination: Energy, technology, and the environment. Science 2011, 333, 712–717. [Google Scholar] [PubMed]
- Cook, S.; Sharma, A.K.; Gurung, T.R. Evaluation of alternative water sources for commercial buildings: A case study in Brisbane, Australia. Resour. Conserv. Recycl. 2014, 89, 86–93. [Google Scholar] [CrossRef]
- Haque, M.M.; Rahman, A.; Samali, B. Evaluation of climate change impacts on rainwater harvesting. J. Clean. Prod. 2016, 137, 60–69. [Google Scholar] [CrossRef]
- Ferrand, E.A. Rainwater Harvesting as an Effective Climate Change Adaptation Strategy in Rural and Urban Settings. In Managing Water Resources under Climate Uncertainty: Examples from Asia, Europe, Latin America, and Australia; Shrestha, S., Anal, A.K., Salam, P.A., van der Valk, M., Eds.; Springer International Publishing: Cham, Switzerland, 2015; pp. 405–420. [Google Scholar]
- Fallon, P.; Betts, R. Climate impacts on European agriculture and water management in the context of adaptation and mitigation The importance of an integrated approach. Sci. Total Environ. 2010, 408, 5667–5687. [Google Scholar] [CrossRef] [PubMed]
- Singh, A.; Panda, S.N. Development and application of an optimization model for the maximization of net agricultural return. Agric. Water Manag. 2012, 115, 267–275. [Google Scholar] [CrossRef]
- Wakeel, M.; Chen, B.; Hayat, T.; Alsaedi, A.; Ahmad, B. Energy consumption for water use cycles in different countries: A review. Appl. Energy 2016, 178, 868–885. [Google Scholar] [CrossRef]
- Quist-Jensen, C.A.; Macedonio, F.; Drioli, E. Membrane technology for water production in agriculture: Desalination and wastewater reuse. Desalination 2015, 364, 17–32. [Google Scholar] [CrossRef]
- Xi, X.; Poh, K.L. Using system dynamics for sustainable water resources management in Singapore. Procedia Comput. Sci. 2013, 16, 157–166. [Google Scholar] [CrossRef]
- Konikow, L.F.; Kendy, E. Groundwater depletion: A global problem. Hydrol. J. 2005, 13, 317–320. [Google Scholar] [CrossRef]
- Barlow, P.M.; Reichard, E.G. Saltwater intrusion in coastal regions of North America. Hydrol. J. 2010, 18, 247–260. [Google Scholar] [CrossRef]
- Romano, G.; Salvati, N.; Guerrini, A. Estimating the determinants of residential water demand in Italy. Water 2014, 6, 2929. [Google Scholar] [CrossRef]
- Lee, M.; Tansel, B. Water conservation quantities vs customer opinion and satisfaction with water efficient appliances in Miami, Florida. J. Environ. Manag. 2013, 128, 683–689. [Google Scholar] [CrossRef] [PubMed]
- Giusti, E.; Marsili-Libelli, S. A fuzzy decision support system for irrigation and water conservation in agriculture. Environ. Model. Softw. 2015, 63, 73–86. [Google Scholar] [CrossRef]
- Levidow, L.; Zaccaria, D.; Maia, R.; Vivas, E.; Todorovic, M.; Scardigno, A. Improving water-efficient irrigation: Prospects and difficulties of innovative practices. Agric. Water Manag. 2014, 146, 84–94. [Google Scholar] [CrossRef]
- Das, B.; Singh, A.; Panda, S.N.; Yasuda, H. Optimal land and water resources allocation policies for sustainable irrigated agriculture. Land Use Policy 2015, 42, 527–537. [Google Scholar] [CrossRef]
- Chhipi-Shrestha, G.; Rodriguez, M.; Sadiq, R. Selection of sustainable municipal water reuse applications by multi-stakeholders using game theory. Sci. Total Environ. 2019, 650, 2512–2526. [Google Scholar] [CrossRef] [PubMed]
- Ghisi, E.; Rupp, R.F.; Triska, Y. Comparing indicators to rank strategies to save potable water in buildings. Resour. Conserv. Recycl. 2014, 87, 137–144. [Google Scholar] [CrossRef]
Figure 1.
Inventory of land use in Changhua (upper area) and Yunlin (lower area) Counties. Chou-Shui river flows through and therefore forms a border for the two counties.
Figure 1.
Inventory of land use in Changhua (upper area) and Yunlin (lower area) Counties. Chou-Shui river flows through and therefore forms a border for the two counties.

Figure 2.
Overview of the design of the MCDA processes in this study.

Figure 3.
Overall performance value for studied water resource management practices. Ranking of importance: economic feasibility, water-supply potential, systemic energy efficiency, and climate-related stability. Weights of importance for the abovementioned attributes are 0.5208, 0.2708, 0.1458, and 0.0625, respectively, as determined by the SMART technique.

Figure 4.
Results of sensitivity analysis: (a) equally weighted; (b) water-supply potential ranked first; (c) systemic energy efficiency ranked first. Results in (a) can also be easily transferred to original ranking score of its corresponding criteria by multiplying a factor of 4.
Figure 4.
Results of sensitivity analysis: (a) equally weighted; (b) water-supply potential ranked first; (c) systemic energy efficiency ranked first. Results in (a) can also be easily transferred to original ranking score of its corresponding criteria by multiplying a factor of 4.


Table 1.
Overview of current practices for water resource management.
| Classification | Water Resource Management Practices | Abbreviation | Properties |
|---|---|---|---|
| Enhancing water-use efficiency | Water conservation program for residential sector (Yunlin County) | A1 | Improvement in water use efficiency in residential sector, to meet the 2030 Agenda for Sustainable Development Goals of United Nations. The average per capita water consumption in Yunlin County is 242 L per capita per day. It is expected that the water conservation program can provide 20L per capita per day of water saving. The Changhua County has shown effective water use and no further saving could be obtained [23]. |
| Water conservation program for agriculture sector | A2 | Agricultural production is the major economic activity in the study region, which accounts for a great portion of the overall water demand. Improvement in water use efficiency in agriculture sector, to meet the 2030 Agenda for Sustainable Development Goals of United Nations. Calculation on the water saving or water-supply potential is assumed at 2000 m3/ha in average [24]. The main economic crop in the study region is paddy rice. | |
| Development of alternative water sources | Domestic wastewater reclamation | B1 | Reclamation of secondary effluent from domestic wastewater treatment plants. Determination on the water-supply potential is based on the quantity of wastewater effluents and water recovery rate. The water recovery rate is assumed at 80% for conventional wastewater reclamation technology. |
| Industrial wastewater reclamation | B2 | Reclamation of industrial wastewater. The reclaimed water can be directly used on-site as source water or for secondary use. The reclamation was determined based on the actual data from a major manufacture in the study region. | |
| Seawater desalination | B3 | A company-owned seawater desalination plant was proposed at a capacity of 100,000 m3/year [22]. The main process for desalination is membrane-based reverse osmosis with energy recovery device (i.e., less energy consumption as compared to conventional ones). | |
| Rainwater harvesting from flood detention pond | B4 | Establishment of rainwater harvesting system for collecting available rainwater using flood detention ponds [23]. Estimation on the harvested rainwater is based on average daily precipitation, available area for rainwater catchment, and probability of precipitation. | |
| Rainwater harvesting from installation of engineered catchment system (company-owned) | B5 | Establishment of rainwater harvesting system for collecting available rainwater. This company-owned system collects rainwater for cooling or secondary uses. This system is a flexible and low-cost decentralized measure with relatively small impacts to the ecosystem [9]. | |
| Rainwater harvesting from installation of engineered catchment system (using public land area) | B6 | Establishment of rainwater harvesting system for collecting available rainwater. Estimation on the harvested rainwater is based on average daily precipitation, available area for rainwater catchment and probability of precipitation. The collected rainwater is aimed for secondary use. | |
| Irrigation return water reusing | B7 | Reuse of agricultural return water. The amount of reuse was proportional to agricultural water demand [23,24]. | |
| Improvement in effective water management | Aged pipelines replacement | C1 | Replacement of aged pipelines to lower the possibility of leakage [25]. The leakage rate in Taiwan is about 16% in average. |
| Leakage rate reduction for agricultural irrigation canals | C2 | Reducing leakage rate from long irrigation canals. The rate is proportional to the length of canals [23,24]. | |
| Improved monitoring and management of groundwater pumping | C3 | Improvement in monitoring of wells to reduce and manage inappropriate groundwater overpumping [23]. |
Table 2.
Summary of selected performance criteria for water resource management practices.
| Classification | Criteria | Description |
|---|---|---|
| Technical | Water-supply potential | Potential for increasing quantity of water supply or reducing water demand, thus, reducing the pressure on the water supply system. This could be done by increasing alternative water sources or conserving water use. Higher water-supply potential is preferred. |
| Systemic energy efficiency | Implementation of water resource management practices may contribute to increase in systemic energy demand. Lower increment on the energy demand (or higher energy efficiency) of the water supply system is preferred. | |
| Economic | Economic feasibility | Feasibility of monetary investment to the implementation of water resource management practices. It is closely related to the practice project’s scale, as costly development on a national or regional scale may not be economically feasible for practical implementation [31]. Therefore, higher economic feasibility on the practice is preferred. |
| Environmental | Climate-related stability | Stability from the influences of climate change. For instance, the volume of rainwater harvesting is strongly affected by climate condition, whereas desalination and wastewater reclamation plants are less affected by climate change [3]. |
Table 3.
Existing land use inventory (area in km2) and population (as of July 2017) for the Changhua and Yunlin Counties.
Table 3.
Existing land use inventory (area in km2) and population (as of July 2017) for the Changhua and Yunlin Counties.
| County | Agricultural | Forest | Transportation/Communication | Water Utilities | Buildings | Public Use | Recreation | Mining | Others | Total Population |
|---|---|---|---|---|---|---|---|---|---|---|
| Yunlin | 834.7 | 117.1 | 80.7 | 138.4 | 109.9 | 13.0 | 4.6 | 1.3 | 99.9 | 688,559 |
| Changhua | 637.5 | 85.3 | 75.1 | 130.6 | 151.7 | 13.6 | 7.1 | 0.9 | 142.8 | 1,278,945 |
| Total | 1472.2 | 202.4 | 155.8 | 269.0 | 261.7 | 26.5 | 11.7 | 2.2 | 242.7 |
Table 4.
Assignment of performance value for economic feasibility and climate change stability criteria.
Table 4.
Assignment of performance value for economic feasibility and climate change stability criteria.
| Performance Rating | Economic Feasibility | Climate-Related Stability |
|---|---|---|
| 1 | Very low | Strong impact |
| 3 | Low | - |
| 6 | Average | Slight impact |
| 9 | High | - |
| 12 | Very high | No impact |
Table 5.
Performance of water-supply potential and assigned rating value for the proposed practices.
Table 5.
Performance of water-supply potential and assigned rating value for the proposed practices.
| Classification | Water Resource Management Practices | Calculation/Assumption | Water-Supply Potential (10,000 m3/year) e | Performance Ranking for MCDA f |
|---|---|---|---|---|
| Enhancing water-use efficiency | A1 Water conservation program for residential sector (Yunlin County) a | 20 L/capita-day | 502.6 | 3 |
| A2 Water conservation program for agriculture sector b | 2000 m3/ha | 22,500 | 11 | |
| Development of alternative water sources | B1 Domestic wastewater reclamation d | 3,600 m3/day at 80% water recovery rate | 105 | 1 |
| B2 Industrial wastewater reclamation b | 17,300 m3/day | 630 | 5 | |
| B3 Seawater desalination a | company-owned at 100,000 m3/year | 3650 | 8 | |
| B4 Rainwater harvesting from flood detention pond b | - | 390 | 2 | |
| B5 Rainwater harvesting from installation of engineered catchment system (in a local company) d | 17,000 m3/day | 620.5 | 4 | |
| B6 Rainwater harvesting from installation of engineered catchment system (using public land area) d | 22,076 m3/day | 805.8 | 6 | |
| B7 Irrigation return water reusing b | 1,100,000 m3/day at 50% recovery rate | 20,000 | 10 | |
| Improvement in effective water management | C1 Aged pipelines replacement c | reduce leakage by 5% | 1000 | 7 |
| C2 Leakage rate reduction for agricultural irrigation canals b | 70 m3/m/year | 65,500 | 12 | |
| C3 Improved monitoring and management of groundwater pumping b | - | 17,100 | 9 |
Data source: a [22]; b [23,24]; c [25]; d based on authors’ calculations or assumptions. 1 m3 of water = 1 ton; 1 ha = 10,000 m2; e Calculation of the potential was based the calculation/assumption from references or authors’ own calculations. f Determination of the performance ranking was based on the calculated water-supply potential.
Table 6.
Performance of systemic energy efficiency and assigned rating value for the proposed practices.
Table 6.
Performance of systemic energy efficiency and assigned rating value for the proposed practices.
| Classification | Water Resource Management Practices | Calculation/Assumption | Specific Energy Demand (kWh/m3) | Change in Annual Systemic Energy Demand (10,000 kWh/yr) g | Performance Ranking for MCDA h |
|---|---|---|---|---|---|
| Enhancing water-use efficiency | A1 Water conservation program for residential sector (Yunlin County) a | provides water and energy savings es | varies f | * | 8 |
| A2 Water conservation program for agriculture sector b | provides water and energy savings e | varies f | ** | 11 | |
| Development of alternative water sources | B1 Domestic wastewater reclamation d | for industrial use (tertiary treatment) | 2.14 | +225 | 7 |
| B2 Industrial wastewater reclamation b | for industrial process use (cascade wastewater streams) | 1.5 | +945 | 3 | |
| B3 Seawater desalination a | RO+ERD e | 3.1 | +11,315 | 2 | |
| B4 Rainwater harvesting from flood detention pond b | 0.58–1.7 kWh/m3 | 1.0 | +360 | 6 | |
| B5 Rainwater harvesting from installation of engineered catchment system (in a local company) d | 0.58–1.7 kWh/m3 | 1.0 | +620.5 | 5 | |
| B6 Rainwater harvesting from installation of engineered catchment system (using public land area) d | 0.58–1.7 kWh/m3 | 1.0 | +805.8 | 4 | |
| B7 Irrigation return water reusing b | for secondary use | 1.1 | +22,000 | 1 | |
| Improvement in effective water management | C1 Aged pipelines replacement c | provides water and energy savings e | ─ | * | 8 |
| C2 Leakage rate reduction for agricultural irrigation canals b | provides water and energy savings e | ─ | *** | 12 | |
| C3 Improved monitoring and management of groundwater pumping b | provides water and energy savings | ─ | ** | 10 |
Data source: a [22]; b [23,24]; c [25]; d based on authors’ calculations or assumptions; e RO = reverse osmosis, ERD = energy recovery devices. 1 m3 of water = 1 ton. e Implementation of the water conservation programs and improvement in effective water management are expected to provide both water and energy savings. f The specific energy demand for water conservation program varies as the technology changes, therefore, the energy demand was excluded from the analysis. g Calculation of the potential was based the calculation/assumption from references or authors’ own calculations. Practices with * signs indicate both water and energy savings (use less energy for accessing and obtaining source water), while the number of * signs shows intensity of the savings. h Determination of the performance ranking was based on the change in systemic energy demand. The performance of systemic energy efficiency for studied practices was assumed to be proportional to the water-supply potential.
© 2018 by the authors. Licensee MDPI, Basel, Switzerland. This article is an open access article distributed under the terms and conditions of the Creative Commons Attribution (CC BY) license (http://creativecommons.org/licenses/by/4.0/).
Share and Cite
MDPI and ACS Style
Lee, M.; Yu, C.-Y.; Chiang, P.-C.; Hou, C.-H. Water–Energy Nexus for Multi-Criteria Decision Making in Water Resource Management: A Case Study of Choshui River Basin in Taiwan. Water 2018, 10, 1740. https://doi.org/10.3390/w10121740
AMA Style
Lee M, Yu C-Y, Chiang P-C, Hou C-H. Water–Energy Nexus for Multi-Criteria Decision Making in Water Resource Management: A Case Study of Choshui River Basin in Taiwan. Water. 2018; 10(12):1740. https://doi.org/10.3390/w10121740
Chicago/Turabian StyleLee, Mengshan, Chia-Yii Yu, Pen-Chi Chiang, and Chia-Hung Hou. 2018. "Water–Energy Nexus for Multi-Criteria Decision Making in Water Resource Management: A Case Study of Choshui River Basin in Taiwan" Water 10, no. 12: 1740. https://doi.org/10.3390/w10121740
Note that from the first issue of 2016, this journal uses article numbers instead of page numbers. See further details here.