Sustainability Assessment of the Water Management System for the Boukan Dam, Iran, Using CORDEX- South Asia Climate Projections


Department of Geohydraulics and Engineering Hydrology, University of Kassel, 34125 Kassel, Germany
*
Author to whom correspondence should be addressed.
Water 2018, 10(12), 1723; https://doi.org/10.3390/w10121723
Submission received: 31 October 2018
/
Revised: 18 November 2018
/
Accepted: 21 November 2018
/
Published: 25 November 2018
(This article belongs to the Section Water Resources Management, Policy and Governance)
Abstract
:The present study aimed to quantify the future sustainability of a water supply system using dynamically-downscaled regional climate models (RCMs), produced in the South Asia Coordinated Regional Downscaling Experiment (CORDEX) framework. The case study is the Boukan dam, located on the Zarrine River (ZR) of Urmia’s drying lake basin, Iran. Different CORDEX- models were evaluated for model performance in predicting the temperatures and precipitation in the ZR basin (ZRB). The climate output of the most suitable climate model under the RCP45 and RCP85 scenarios was then bias-corrected for three 19-year-long future periods (2030, 2050, and 2080), and employed as input to the Soil and Water Assessment Tool (SWAT) river basin hydrologic model to simulate future Boukan reservoir inflows. Subsequently, the reservoir operation/water demands in the ZRB were modeled using the MODSIM water management tool for two water demand scenarios, i.e., WDcurrent and WDrecom, which represent the current and the more sustainable water demand scenarios, respectively. The reliability of the dam’s water supply for different water uses in the study area was then investigated by computing the supply/demand ratio (SDR). The results showed that, although the SDRs for the WDrecom were generally higher than that of the WDcurrent, the SDRs were all <1, i.e., future water deficits still prevailed. Finally, the performance of the water supply system was evaluated by means of risk, reliability, resiliency, vulnerability, and maximum deficit indices, and the combination of the indices to estimate the Sustainability Group Index (SGI). The findings indicated that, compared to the historical period for both the water demand scenarios, WDcurrent and WDrecom, the average SGI of each RCP would be decreased significantly, particularly, for the more extreme RCP85 scenario. However, as expected, the SGI decrease for the WDrecom was less than that of the WDcurrent, indicating the advantage of implementing this more sustainable water demand scenario.
1. Introduction
The growing population rate and the limitations of available water resources as a vital factor for human survival will increase the likelihood of water scarcity in future years. This holds in particular, for countries located in areas with arid and semi-arid climates, such as Iran in southwest Asia. In Iran, inefficient agriculture together with mismanagement and the ongoing thirst for development have led to a looming water crisis in recent years [1]. Based on evidence from the GRACE (Gravity Recovery and Climate Experiment) satellite data [2], NASA has found that large parts of the arid Middle East region and western Iran have lost freshwater reserves rapidly over the past decade. This situation is exacerbated by the rising trends in climate variability due to global climate change, with the effect that the currently available water resources and bodies in Iran will be adversely affected in the near future [3], which may result in hydro-climatic disasters, with severe losses for the vulnerable natural systems and communities. Therefore, the first inevitable task to prepare the potentially affected regions for these adverse events is to identify recent, as well as future, climate variations and to assess the water scarcity risk, followed by a prediction of the effects of the events on future hydrology to allow the definition of adaptation plans to mitigate the aforementioned negative impacts on the water supply systems.
In several previous studies [4,5,6], the impacts of a changing climate on available water resources and hydrological conditions have been investigated in three river basins located in Central Italy, Kenya, and Burkina Faso, respectively, using regionally downscaled climate of GCM projections, i.e., RCM-predictors, including the COordinated Regional climate Downscaling EXperiment (CORDEX) project [7], as climate drivers in hydrologic models; specifically, the globally used Soil and Water Assessment Tool (SWAT), which is a comprehensive integrated river basin model [8]. As an option for future water resource management under the impacts of climate change, water management and planning models, such as the MODSIM-DSS or WEAP (Water Evaluation and Planning system), which are capable of simulating various characteristics and features of water resources in a river basin, can be coupled with the SWAT hydrologic model. Such a methodology has been investigated in some studies [9,10], where it has been found that such an approach is an invaluable tool for hydro-climatology predictions to support long-term water resource management and planning.
Numerous studies have dealt with the impacts of climate change on streamflow and available water resources in Iran (e.g., References [11,12]), wherein in some of these studies [3,13], the SWAT model was applied. Most of the researchers concluded that climate and hydrological variables would experience significant and adverse changes in the future in the wake of climate change. This particularly applies to regions of Iran that already have vulnerable situations of water availability. Current studies show that this situation will become worse, especially in the drier regions, where more prolonged droughts will occur, but also, in contrast, there will be other regions that will experience more frequent and more intensive floods [3,13,14].
Loucks [15] suggested that the sustainability of water systems can be assessed using various statistical measures, i.e., reliability, resiliency, and vulnerability (RRV), all of which are summarized in a sustainability index (SI). The author defined reliability as the probability of success in a system when water demands are supplied sufficiently; resilience as the recovery speed of a system from a failure condition; and vulnerability as the severity degree of a failure condition. Karamouz et al. [16] also introduced a threefold approach for estimating the sustainability level of supply and demand for the Aharchay river basin of Iran. In one of these approaches, a simulation model, the WEAP, was utilized to estimate the reliability, resiliency, vulnerability, and maximum deficit for a river basin to determine a group sustainability index based on Sandoval-Solis et al. [17]. Veldkamp et al. [18] suggested a risk-based water scarcity assessment approach, based on probabilistic methods to deal with variability and extremes, as well as applying a Gamma distribution to estimate water scarcity conditions at the global scale under historic and future conditions, by incorporating multiple climate change and population growth scenarios.
The present study used the bias-corrected [19] CORDEX RCM climate predictors as input into the SWAT model for streamflow and water resource predictions in the vulnerable Boukan watershed, located upstream of the Boukan Reservoir within the Zarrine River basin in northwest Iran. The ensuing SWAT hydrological predictions were then evaluated by the water management and planning model MODSIM. Finally, the water supply reliability of the study area and the sustainability of the reservoir operation system were assessed using the aforementioned performance indices, including reliability, resiliency, vulnerability, and maximum deficit measures, together with the impact of the demand management scenarios. Using this cascade-methodology, the hydrologic impacts of climate change, namely, streamflow and water resources, as well as the subsequent management strategies for mitigation were analyzed in detail. An important objective of this study was to improve the efficiency of future water use under climate change conditions in the study region and to assess the water scarcity risk. Moreover, the output obtained from this analysis could be used to support better decision systems for water resource planning in the watershed.
2. Study Area
2.1. Zarrine River Basin
The Zarrine River basin (ZRB) is located in the southern part of Lake Urmia, between 45°46′ E to 47°23′ W longitude and 35°41′ S to 37°44′ N latitude. The river has a length of about 300 km and its basin covers an area of 12,000 km2, where the larger portion is mountainous, and the remainder is rather plain. The basin belongs to the Lake Urmia hydrologic basin with the major reach being the main inflow source of Lake Urmia, as shown in Figure 1a. The Lake Urmia itself, which has international importance based on the Ramsar convention, has been diminishing steadily since 1995.
The ZRB contains several dams where the biggest and most important operating dam is the Boukan Dam, and a diversion dam, the Nouroozloo, located in its downstream. The Boukan reservoir has a gross storage capacity of 760 million m3 (MCM) and a live storage capacity of 654 MCM, with an annual adjustable water volume of around 624 MCM. Its water is used for agricultural irrigation and the supply of drinking and industrial water in the region with the amounts of 787, 169, and 5 MCM/year, respectively [19].
The region’s climate is mostly characterized as semi-wet cold or wet-cold, but it changes to semi-dry in the vicinity of Lake Urmia. The average annual temperature varies between 8 and 12 °C, whilst the rainfall on the ZRB is in the range of 200–850 mm/year.
The major land cover of the ZRB is 45% dry land, 37% pasture, and 14% forest. The agricultural areas within the basin cover a total area of 74,318 ha, all irrigated by groundwater and surface water resources, including from the Boukan reservoir, as the crop growing season of the basin is mostly during the dry season lasting from mid-spring to mid-autumn. Nevertheless, the basin is rather prone to flooding and there have been devastating floods there in recent years, especially, in the beginning of spring.
2.2. Data
The data required for this research in the ZRB is detailed in Table 1, along with its sources. The Digital Elevation Map (DEM), land-use, and soil classification maps were used to delineate the SWAT modelled ZRB-watershed, and to identify the stream reaches. Climate input data of the model consisted of the daily maximum and minimum temperatures, as well as the daily precipitation, over the period from 1987 to 2015 for six synoptic stations located in or close to the ZRB, whilst monthly streamflow data for the six gauging stations of the ZRB was available for the period from 1987 to 2012.
For the future climate scenarios, predictors of the CORDEX-regional climate models archive (see following section for details) were gathered from the Centre for Climate Change Research at the Indian Institute of Tropical Meteorology website: http://cccr.tropmet.res.in/home/data_cccrdx.jsp.
3. Materials and Methods
3.1. Generation of Downscaled Climate Projections
Global Climate Models (GCM) climate predictor data is frequently used to explore climate change impacts for a limited spatial region but given the spatial resolution is usually coarse, varying from around 1 to 3 degrees, the data needs to be downscaled to a finer scale for regional and local climate variations estimations. This is mostly done using a statistical downscaling technique, e.g., the Statistical DownScaling Model (SDSM) [20,21] which works well for temperatures, but less so for precipitation [22]. Therefore, for the latter, the Quantile Mapping (QM) bias correction technique [23,24] has come to the fore, and it has also been used in a previous climate impact study in the ZRB by Reference [19].
However, in the present study, a dynamical downscaling approach based on the CORDEX dataset (Coordinated experiments for projections of regional climate change) [25], i.e., output from a high-resolution regional model (RCM) driven by various driving GCMs was used. Iran is located in more than one of the CORDEX domains, with the most adequate in Region 6, namely the WAS (South Asia), and in Region 13, namely the MNA (Middle East North Africa—MENA). Mousavi et al. [26] investigated the applicability of these two CORDEX domains for climate predictions over Iran and found that the WAS dataset had better agreement with the observational data. This dataset was also applied in the drought analysis study across Iran described in Reference [27]. Based on the above findings, the WAS dataset with rotated poles and at a resolution of 0.44° × 0.44° (WAS-44) was also used to generate the climate predictors in the present study.
The available experiments for the WAS-44 dataset consisted of 16 GCM-RCM CORDEX combinations, i.e., ten CMIP5- archive GCMs as the driving models and two RCMs, regCM4 and RCA4, all taken from the websites of the Indian Institute of Tropical Meteorology (IITM) and the Swedish Meteorological and Hydrological Institute (SMHI). The experiments are listed in Table 2.
The above 16 CORDEX RCM’s were then ranked based on a multi-criteria scoring approach as in Reference [19], by evaluating the models particular skills to simulate the past observed climate in the ZRB during the reference period (1987–2005), based on various standard statistical performance measures (see Section 4). The climate predictors of the best-ranked model were then selected for further processing, i.e., bias-correction. To that avail, the ISI-MIP trend-preserving method described in Reference [28] was applied to correct the monthly biases of the simulated temperatures and precipitation. More specifically, for the minimum and maximum temperatures, an additive correction constant and for precipitation a multiplicative factor , were employed. For further details, the readers are referred to studies by Emami and Koch [19,29].
3.2. Hydrologic Simulation Model SWAT
3.2.1. General Description of SWAT Model
The Soil and Water Assessment Tool (SWAT) [30,31] is a physically-based, semi-distributed, time-continuous rainfall-runoff simulation model that operates on a daily time step. The hydrology and water quality processes taking place in a watershed can be simulated in a computationally efficient manner at various spatial scales. The SWAT was originally developed to assess the impacts of land use and management changes on water supplies, sediment and nutrient transport, and pesticide fate in large-scale catchments [8]. However, over the last decade, this model has been frequently used to investigate climate change impacts on agro-hydrological systems. This is usually done by using meteorological time series from downscaled future predictions of GCMs (e.g., Reference [19]) or RCMs [32,33], including ones from the CORDEX project, as climate drivers of the SWAT model.
The SWAT simulates various components of the hydrological cycle, i.e., the surface runoff, percolation, lateral subsurface flow, channel transmission losses, evapotranspiration, and groundwater return flow. Model inputs include the physical characteristics of the watershed and its sub-basins, such as soil type, land use, land slope, slope lengths, lengths and widths of the surface water bodies, Manning’s n-values, and precipitation and temperature, as the ultimate climate drivers of the various runoff processes [31].
The runoff volume was estimated using the modified SCS-curve number method. The watershed’s concentration time was evaluated using Manning’s formula, considering both the overland and channel flow. The SWAT uses a storage routing technique to predict the flow through each soil layer in the root zone. Downward flow occurs when the field capacity of a soil layer is exceeded and the layer below is not yet saturated.
In the distributed SWAT model configuration, the major watershed was divided further into sub-basins, as can be seen for the ZRB in Figure 1b. To represent the large-scale spatial heterogeneity of the study area, each sub-watershed was parameterized further by a series of HRUs (Hydrologic Response Units), which are a combination of land cover, soil, and management areal units. The soil water content, surface runoff, nutrient cycles, sediment yield, crop growth, and the management practices were simulated for each HRU and then aggregated for the corresponding sub-basin by a weighted average. Physical characteristics, such as the watershed slope, reach dimensions, and the meteorological/climatic data were considered for each sub-basin. Estimated streamflow obtained for each sub-basin was then routed and accumulated accordingly through the river system to provide the final outlet discharge to be used for the calibration and validation of the model.
3.2.2. SWAT Model Setup and Calibration-Validation
Using the data categories listed in Table 2, the SWAT model was set up with the help of ArcSWAT 2012, an extension of the ARCGIS, and was subsequently calibrated and validated for the available data period from 1991–2012. This study relied on the originally calibrated SWAT model for the ZRB by Emami and Koch [19], who calibrated and validated the model using the stochastic Sequential Uncertainty Fitting version 2 (SUFI-2) algorithm of the SWAT-CUP program [34], which has been widely used in recent SWAT related studies. In the SUFI, the input parameters of the SWAT model were expressed as ranges to be treated as random variables, accounting for all possible sources of uncertainties. As initial parameters, default values and/or determined parameters from the manual calibration or deduced parameters from the literature were taken. Then the most effective parameters were defined based on a sub-basin-wise sensitivity analysis, which was done hierarchically from the last streamflow gauging station in the upstream sections (sub-basin 11, Sonnateh station) down to the outlet of the total basin (sub-basin 2, Nezamabad station).
To simulate the impacts of climate change on the surface water runoff, the future (2006–2099), biased-corrected precipitation and temperature predictions of the top-ranked CORDEX GCM-RCM combination (HADGEM2-RegCM4) under the two widely used emission scenarios, RCP45 and RCP85, were used as hydrological drivers in the calibrated SWAT model.
3.3. Water Management and Planning Model MODSIM
3.3.1. Theoretical Basis of the MODSIM Modeling Approach
MODSIM-DSS is a general river basin management model that can be used as a decision support system. Originally developed by Dr. John Labadie of Colorado State University in the mid-1970s, it has been applied since then in numerous complex river basin systems, such as the Poudre River Basin in Colorado [35]; lower Nile River basin [36]; Guiem River Basin in South Korea [37]; Karkheh River Basin [10]; and the Zarrine River Basin [38] in Iran, mainly, for developing basin-wide strategies for short-term water management, long-term operational planning, drought contingency, and climate change adaptation planning. Other applications include the analysis of water rights and resolving conflicts between urban, agricultural, and environmental interests [39].
The main idea behind the MODSIM is that a complex river basin system can be represented by a network flow system consisting of a range of nodes and links. The nodes symbolize storage components, such as reservoirs and aquifers, as well as points of inflow, demand, diversion, and river confluence. The links connecting the nodes represent river reaches, pipelines, canals, and stream-aquifer interconnections defining stream depletions from pumping and returns flows from the seepage and surface water applications. These nodes and links in the MODSIM do not only represent the physical components of a river basin system, but may also be utilized to symbolize artificial and conceptual elements, like reservoir operating targets, consumptive and in-stream flow demands, evaporation and channel losses, reservoir storage rights and exchanges, and stream–aquifer interaction components [40].
Once the conceptual network was constructed, a highly efficient network flow optimization (NFO) algorithm was employed in MODSIM, providing solutions that simulate the optimal allocation of water in a river basin, according to water availability under various water rights and other priority constraints. Basically, the following constrained optimization is solved in MODSIM for each time step of the planning period:
subject to:
where A is the set of all the arcs or links in the network; N is the set of all the nodes; qk is the integer valued flow rate in link k; ck are c the cost or weighting factors, or priorities per unit of flow rate in link k; bit is the (positive) gain or (negative) loss at node i at time t; Ii is the set of all links terminating at node i (inflow links); Oi is the set of all links originating at node i (outflow links); and lk and uk are the lower and upper bounds on flow in link k, respectively. Once the terms in Equations (1)–(3) have been specified for a particular watershed, the constrained optimization problem is solved with the Lagrangian relaxation algorithm RELAX-IV described in Reference [41].
The cost factor ck for accounting for active storage and demand links priorities is generally calculated using the following formula:
where PRk is the integer priority ranking which ranges between 1 and 5000 for the reservoirs or the demands, as discussed below.
ck = −(50,000 − 10 × PRk)
3.3.2. Setup of the MODSIM Network and Demand Scenarios for the ZRB
Sustainable water management has been defined by Mays [42] as a strategy that can meet the current water demands of all water users, without impairing the future water supply, whilst maintaining the environmental and hydrologic integrity [43]. This means that, in general, the potable and environmental demands should be highlighted with the highest priority, with lower- ranking industrial and water agricultural needs to be limited correspondingly to amounts which will not compromise the future sustainable water supply.
Based on these ideas, the water demands in the MODSIM network of the ZRB, shown in Figure 2, are categorized into the present and future development types, where the former describes a continuation of the demands of the historical period as authorized officially by the Iran Ministry of Energy, whilst the latter encompasses secondary, additional demands that are expected to arise in the wake of ongoing future development plans, as discussed in Emami and Koch [19] and MOE [44]. The irrigation losses and Legzi water transfer nodes were also classified as present agricultural demands. In summary, the water uses in the basin network system downstream of the Boukan Dam contain, in order of decreased supply priority for future conditions: (1) present potable; (2) environmental flow of dam; (3) environmental flow entering Lake Urmia; (4) present industrial; (5) present agricultural; (6) future development potable; (7) future development industrial; (8) future development agricultural; and (9) filling of the reservoir [19,38]. Furthermore, one goal of the present study was to analyze how different future projected water uses in the ZRB can be sustained by the available water supply in the wake of climate change. The flow components of the MODSIM model were mainly driven by the inflow of the Boukan Reservoir, captured from the earlier mentioned simulations of the SWAT model for different climate scenarios.
Following these statements, two water demand scenarios, hereinafter called WDcurrent and WDrecom (recommended) will be simulated by the MODSIM, using the projected SWAT simulated inflow to the Boukan Dam. The WDcurrent—water demand scenario extended the current water policies, such that it assumed the continuing development of the ZRB water supply projects for potable, industrial, and agricultural demands. The WDrecom—water demand scenario, on the other hand, was a sustainable water management scenario, where demand management strategies were implemented based on the recommended scenario of potable and industrial predicted water demands [44], together with a decreased agricultural demand, including application of pressurized irrigation and improvement of the irrigation networks of the ZRB [19,29].
3.4. Assessment of the Water Supply System Performance, Reliability, Resilience, and Vulnerability
Various performance criteria were employed in the present study to assess the water management policies of a water supply system, and to enable the comparison of alternative policies. The performance of the system can be evaluated by an analysis of the time series of a particular representative parameter, Xt (for example, the water demand deficit), with time t = 1,..., T with T being the total time horizon inspected. More specifically, a system performance index to identify a satisfactory condition (S) versus an unsatisfactory (U) condition of the system can be defined based on some threshold values in the representative time series, Xt.
In this study, the water demand deficit was used as the system performance variable, Xt, which is defined as:
where , and were water deficit, total water demand, and the water supply of the i-th user at time t, respectively. Thus, defines the threshold of the indicator state to change from a satisfactory (S) to an unsatisfactory (U) condition, or vice versa.
The most widely used indices for system sustainability assessment are Reliability, Resilience, and Vulnerability, also abbreviated as RRV, firstly introduced by Hashimoto et al. [45]. Based on these three indices, and the deficit index above, Loucks [15] then proposed a summary index of the sustainability index (SI) to measure the sustainability of water resource systems, which for the i-th user was defined as:
where , , and are reliability, resiliency, vulnerability, and maximum deficit, respectively. These four performance criteria have also been used in previous studies of this kind [16,17].
Reliability, is the probability (percentage of time) that the water demand is fully supplied, specifically, the ratio of the number of times to the total number of time intervals, N:
From the reliability index,, the opposite, i.e., the risk of the system, which is the probability of failure during a period, can be directly calculated as:
Resiliency, , describes how the system is likely to recover from a failure status. It can be interpreted as the probability that a successful period follows a failure period, which means the number of times that is followed by , normalized by N, as above:
Vulnerability, Vuli, is the expected value of deficits, i.e., the sum of the deficits , divided by the deficit period (number of times ) and then divided again by the annual water demand of the i-th water user, , to make it dimensionless:
The maximum deficit, , if it occurs, is the worst-case annual deficit, max (), divided again by the annual water demand, to make it dimensionless:
All these five indices vary between 0 and 1.
Finally, the Sustainability by Group Index (SGI) is defined as the weighted average of sustainability indices with the relative weights calculated according to the water demand. So, the SGI for the group of demands is expressed as follows:
where is the sustainability index (Equation (6)) for the ith water user, with an annual water demand of , and is the total water demand. In this study, k = 8 eight demand indices for the domestic (present, future), environmental (dam and lake), industrial (present, future), and agricultural (present, future) users were considered, with the weights equal to the relative volumes of water demand.
4. Results and Discussion
4.1. Selection of the Best CORDEX RCM for Climate Prediction in the ZRB
For the selection of the most suitable CORDEX RCM from the set of 16 eligible CORDEX RCM’s in Table 2, for later future climate predictions in the ZRB, the models’ past-performances, i.e., the ability to simulate the monthly aggregated climate observations of the reference period (1987–2005) were evaluated first, using the skill score multi-criteria method [19]. The method is based on four performance indicators, namely, system bias (B) (=ratio of the GCM- simulated variables to the observed ones, and ideally close to 1); coefficient of determination (R2), ideally close to 1; the normalized root mean square error (NRMSE) (ideally close to 0); and the NSE (ideally close to 1), from which a total skill score for simulating temperatures and precipitation was calculated (=16 and =1, for the models with the best and worst performances, respectively). These terms are defined as:
where oi and pi are the observed and predicted GCM weather data and and are the averages, respectively, and n is the number of months (=228) in the reference period.
Summarized in Table 3 are the results of the scoring analysis for the 16 GCM-RCM combinations (see Table 1), regarding the predictions of temperatures and precipitation in the reference period and averaged over the observing stations. From the table, the GCM-RCM combination of HADGEM2-RCA4 had the best performance, i.e., the highest skill score of 14.5. Therefore, the climate predictions of this model were considered for further analysis.
4.2. Bias Correction of the Best CORDEX RCM-Climate Predictors
In the subsequent step, the temperature and precipitation predictions of the (best) HADGEM2-RCA4 model were bias-corrected by applying the ISI-MIP trend-preserving method [28]. The results of this exercise are listed in terms of the B and NRMSE indices before and after the bias correction in Table 4. One can notice that, on average, the monthly biases of the two climate predictors at the various climate stations were decreased considerably through the application of the ISI-MIP method, specifically, by 30% and 19% for the biases B and by 54% and 58% for the NRMSE for temperatures and precipitation, respectively. Furthermore, for the individual stations, both the B and NRMSE were in an acceptable range, with B > 0.8 and NRMSE < 0.17 for the precipitation and B > 0.99 and NRMSE < 0.11 for the minimum and maximum temperatures.
4.3. Future Projections of Temperatures and Precipitation
The HADGEM2-RCA4 ISI-MIP trend-preserving bias-corrected mean annual temperature and precipitation obtained for the three future periods: 2021–2039, 2041–2060, and 2071–2089, abbreviated in short by 2030, 2050, and 2080, respectively, under the two RCP emission scenarios, RCP45 and RCP85, are compared with those of the historical period in the corresponding boxplots of Figure 3.
As generally expected, the annual temperature (lower panel) will increase between 2030 and 2080, and this increase is naturally more intense for the more extreme RCP85 than for the RCP45. However, the average (median) temperature is likely to experience a slight decrease compared to the historical period, especially in the 2030 period.
Moreover, as is typical for GCM precipitation predictions (top panel), the ranges become wider, as one projects more into the future, and this holds particularly for the RCP85, where large extremes of low and high annual flows are to be expected in the far-future (2080) period. Compared to the median precipitation for the historical period, there will be an overall slight decrease of that variable for RCP85 for the three future periods considered.
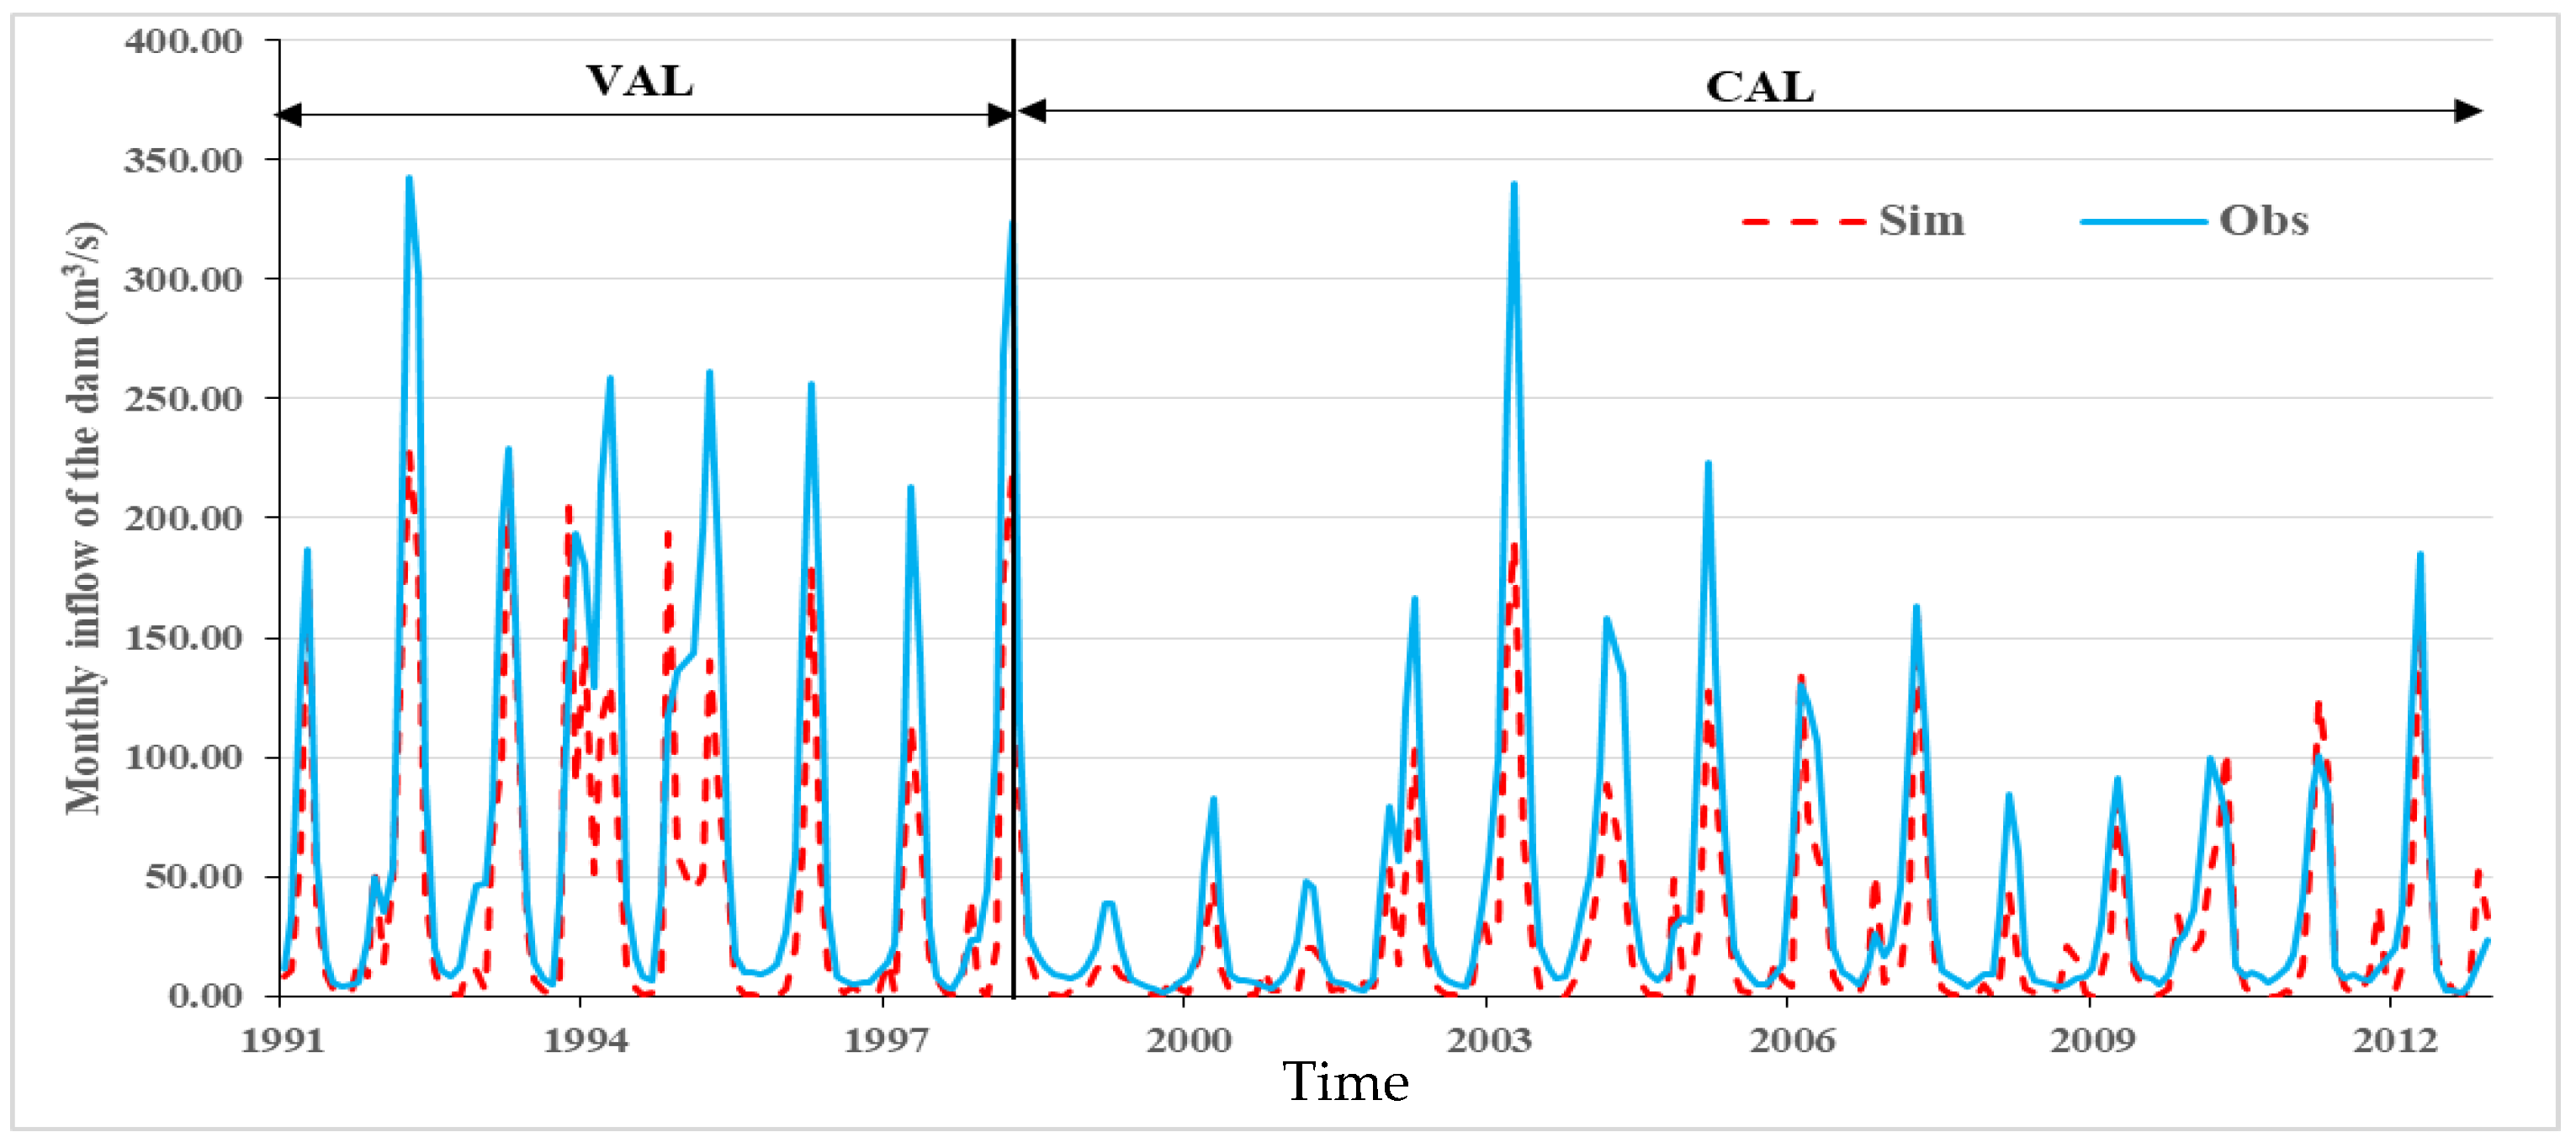
4.4. SWAT Predictions of Historic and Future Inflows of the Dam and Interbasin Flows
4.4.1. SWAT Calibration and Validation of Historical Streamflow
To predict the inflow of the Boukan Dam and the inter-basin flows of the ZRB in the wake of climate change, the integrated basin-wide hydrologic model, the SWAT, was calibrated and validated using SWATCUP-SUFI2 for the time periods 1991–1997 and 1998–2012, respectively. The first 4 years of available data (1987–1990) were used as the warm up period.
The inflow of the dam which corresponds to the discharge of the Zarrine River at the outlet of sub-basin 8 (see Figure 1), is compared to the observed records in Figure 4. One may notice from Figure 4 that the performance of the model in hydrologic simulation was rather satisfactory, although most of the peak-flow events were underestimated, especially, in the validation period. One reason for this was possibly the occurrence of some irregular dry years, particularly, for the 1998–2002 period. Additionally, there was the tendency of the SWAT model to underestimate the flow in the wet season due to inaccurate estimation of the soil moisture conditions [46].
To assess the performance of the SWAT model, the ranges of the quantitative statistical measures for the streamflow were calculated at the outlet stations of the six sub-basins (see Figure 1b) for both the calibration and validation periods and presented in terms of the coefficient of determination (R2), the Nash Sutcliffe (NS), and the weighted bR2 in Figure 5. All efficiency criteria were within the acceptable ranges, according to the classification proposed by Moriasi et al. [47], where the NS, as the most prominent measure, ranged between 0.5 and 0.7.
As another measure of the SWATCUP-SUFI2- model’s performance, the two uncertainty indices, the P-factor and R-factor, were also estimated for the optimized objective functions (misfits of observed and modelled streamflow at the various gauge stations). The measures are listed in Table 5. The P-factors, which indicate the percentage of observed streamflow enveloped by the calibrated/validated ones simulated under the uncertain parameter ranges, were mostly higher than 70%. The R-factors, measuring the ratio of the width of the 95PPU envelope, relative to the standard deviation of the data, were hovering around 1, i.e., values that characterized a satisfactory calibration/validation of the model. For further details on the calibration and a discussion of the most sensitive parameters, the reader is referred to References [19,29].
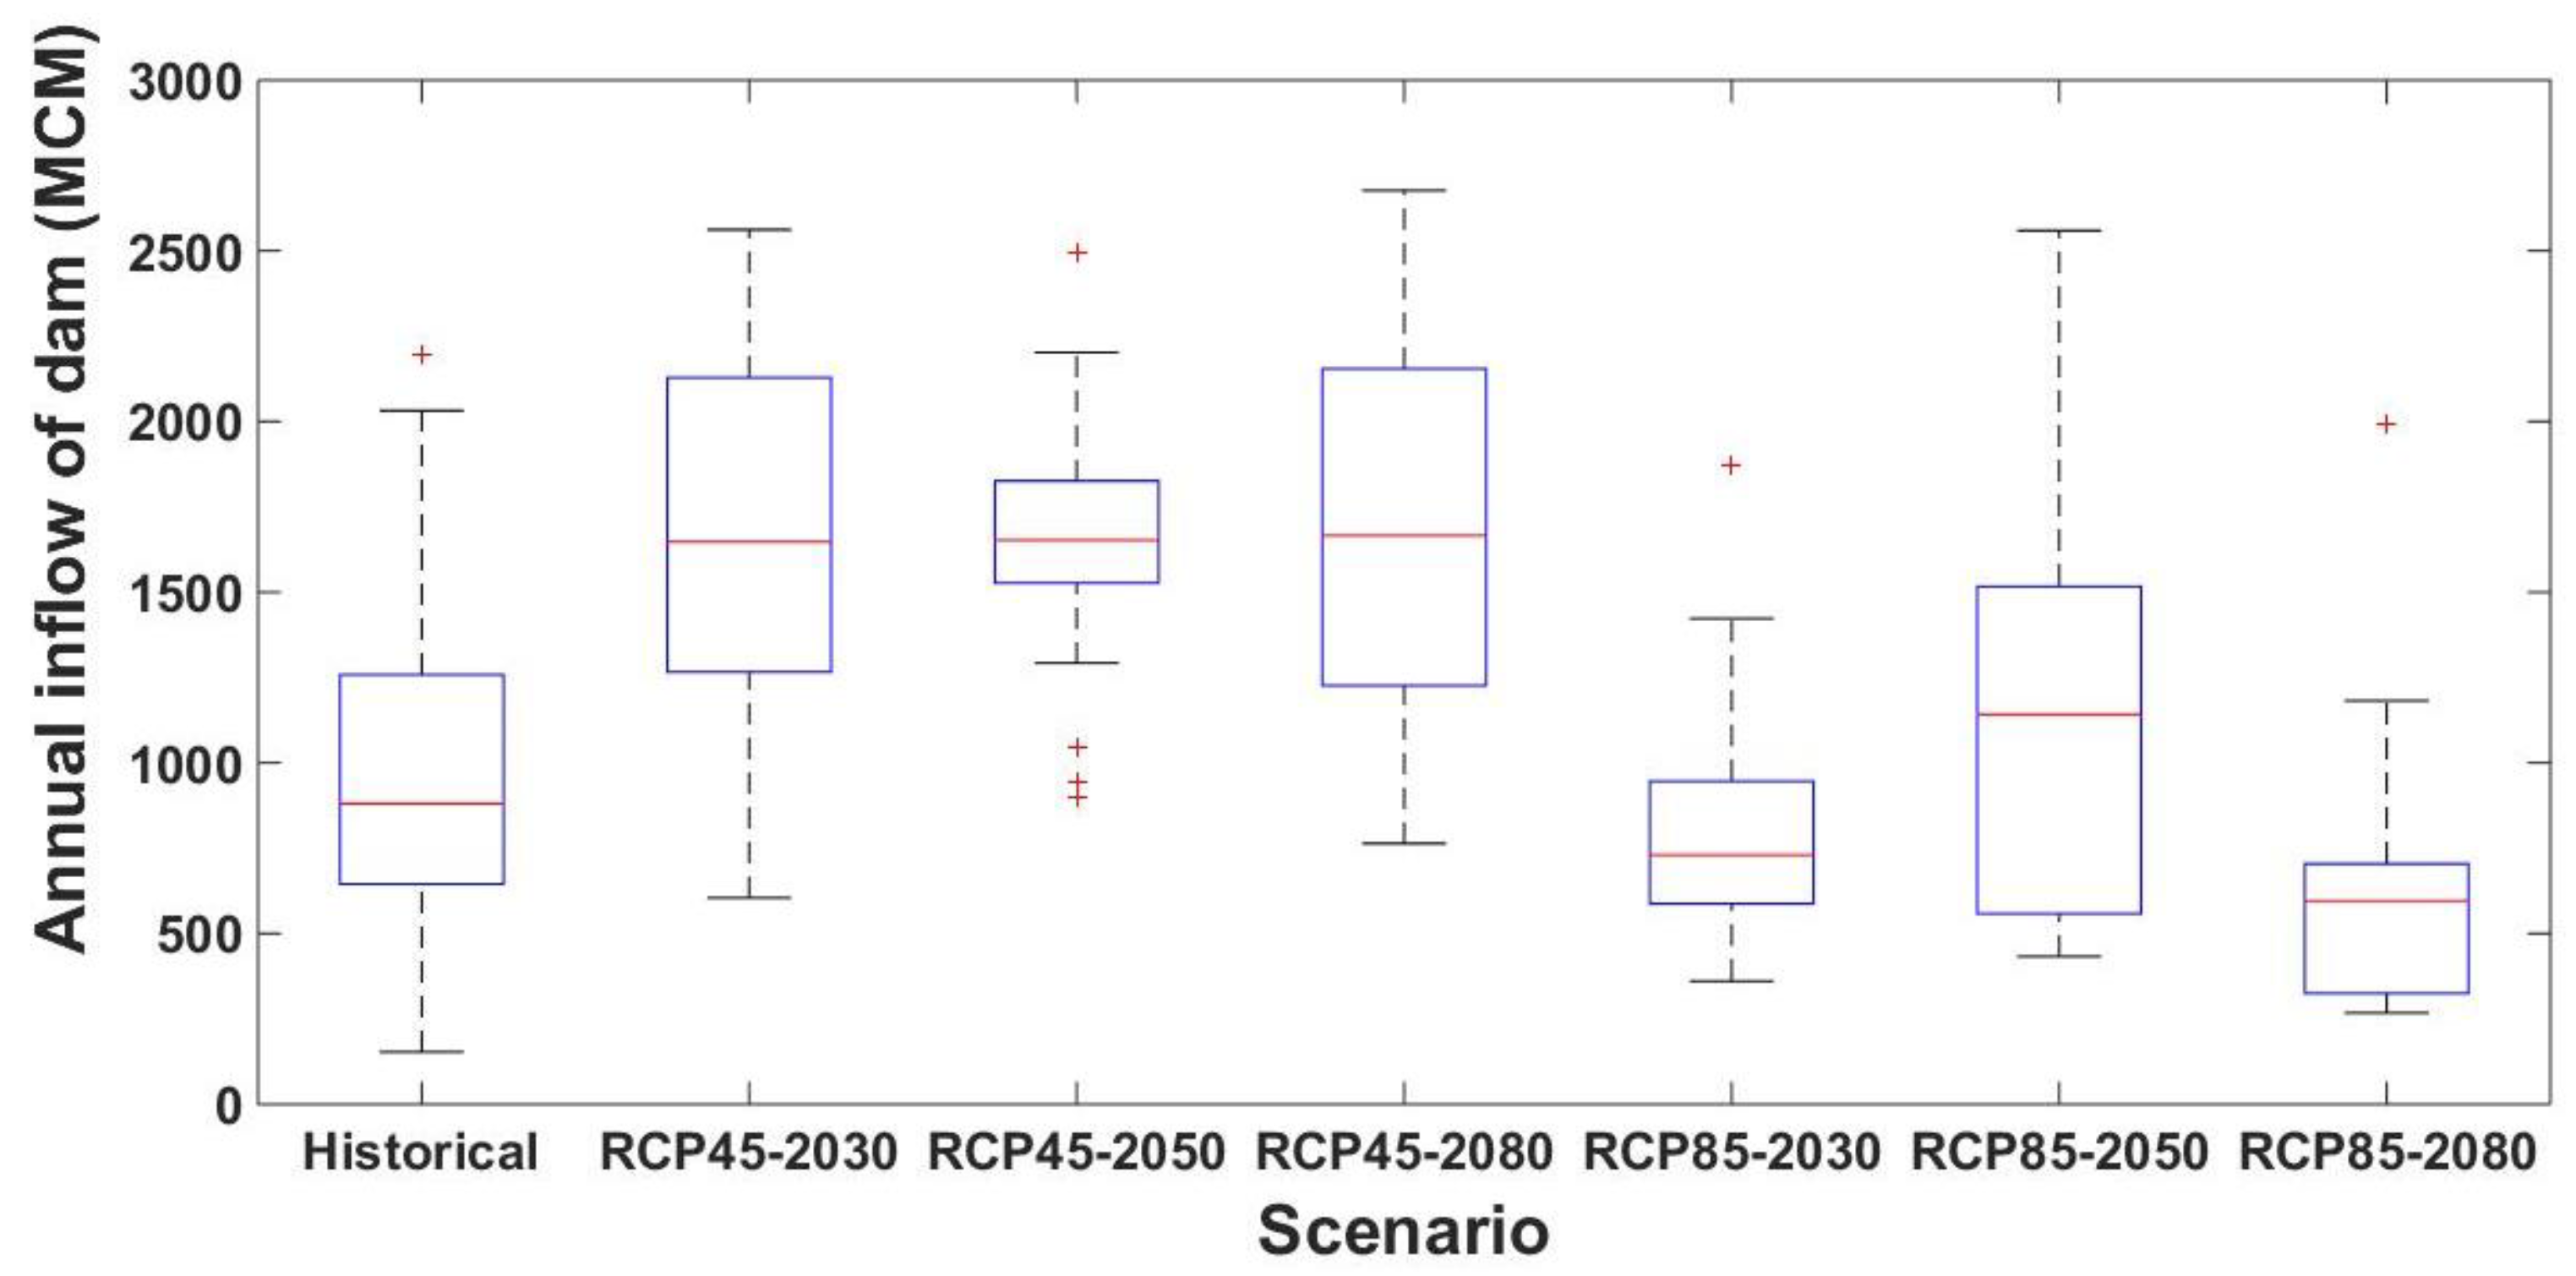
4.4.2. SWAT Simulation of Future Streamflow
The statistics of the simulated annual inflow to the Boukan Dam are compared to the historical and future scenarios in the box plots of Figure 6. As can be seen, between the historical and the 2030 period, the average (median) dam inflow had almost doubled for the RCP45 scenario, whereas for RCP85 it had slightly decreased over this time.
In addition, the RCP45-2030 and RCP85-2050 had the biggest ranges of maximum and minimum dam inflow, whilst the RCP45-2050 and RCP85-2080 had the narrowest ones. Furthermore, the low (25th percentile) and high (75th percentile) quartiles of the dam inflow will increase in all future periods for the RCP45, but decrease for the RCP85, except for the high quartile of the 2050 period, when it will increase.
In summary, the future annual inflow will, on average, be almost constant under the “climate mitigation” scenario (RCP45 case) but it will fluctuate more under the “no mitigation” scenario (RCP85 case), such that it increases firstly from the 2030 to the 2050 period, and then halves again to the 2080 period.
4.5. Assessment of Supplied Water (SDR) under Different Climate and Demand Management Scenarios
To assess the reliability of the future Boukan Dam water supply, the supply/demand ratio (SDR) was calculated for the different RCPs/future periods, assuming two water demand scenarios, i.e., (1) The WDcurrent scenario which was a continuation of the current water policies, and (2) the WDrecom scenario which described the recommended water policies as a more sustainable water management scenario. The SDRs were computed for each of the scenarios into eight demand categories of the ZRB, for the present and future (development) types, with the priority orders, as explained in Section 3.3.2, namely, potable, environmental, industrial, and agricultural water uses, with future demands in the lower order.
The SDR results obtained for the WDcurrent scenario for each of the eight user categories are presented in Table 6. In this scenario, the total water demand from the Boukan Dam was assumed to gradually increase from 1408 MCM/year for the historical period to 1826, 1910, and 2038 MCM/year in the 2030, 2050, and 2080 future periods, respectively, attributed to the eight different categories, as indicated in the table. The SDRs listed revealed how much of the requested demand was met in each of the user categories for the different RCPs/future periods. From the table, one can notice among other things, that the future available water resources will meet the present potable demands completely, except for RCP85 in the 2030 and 2050 periods, when there will be a 19% to 21% water shortage. Both the environmental flow for the dam and the Lake Urmia will be supplied in the range of 77–98%, though somewhat less for the extreme RCP85 scenario.
The supplied water for the other demands, including industrial and agricultural demands, was acceptable for the RCP45 in the 2030 and 2050 periods, but less so, in the 2080 period, and again, with a higher degree of water scarcity experienced for the RCP85 than for RCP45. Finally, the last row of Table 6 shows that the total future water demand will, in general, be satisfied by ratios ranging between 62–93%.
Hence, these results clearly demonstrated that the anticipated climate change in the ZRB, in conjunction with the WDcurrent scenario projected increase of future water demands, will lead to a significant shortage of water resources.
On the other hand, for the more sustainable water management scenario WDrecom recommended by MOE [44], the situation looked more positive, as shown in Table 7. Here, the SDR-differences with those of the WDcurrent scenario were additionally presented. For the WDrecom scenario, the supplied water from the Boukan Dam was expected to increase to 1697, 1763, and 1891 MCM/year in the 2030, 2050, and 2080 future periods, respectively, i.e., much less than was assumed for the WDcurrent. In the WDrecom scenario, not only will the future potable and industrial demands, but also the agricultural demands, be decreased slightly by assuming that the irrigation efficiency in the ZRB will be increased from 38% to 49%, by implementing pressurized irrigation systems [29].
As shown in Table 7, although the SDRs of the future industrial demand category are decreased slightly for the RCP85, compared with that of the WDcurrent (Table 6), for the other demand types, the water supply reliability has noticeably improved, particularly for the RCP45 in the 2080 far future period, where the SDRs reach values of 89%, 97%, 86%, and 83% for the potable, environmental, industrial, and agricultural demands, respectively. Although improvements were also obtained for RCP85, they were not enough to fully compensate for the water deficits which still amounted to 57%, 89%, 56%, and 34% in the four demand types, respectively.
In summary, the MODSIM simulated future water supplies obtained under the impacts of climate change in the ZRB were not enough to satisfy the assumed water demands of either of the two water demand scenarios, i.e., neither the extreme WDcurrent nor the more benevolent WDrecom scenario. This meant that the future additional categorical water demands (future potable, future industrial, and future agricultural) should be further limited, using some demand management executive strategies to avoid future irrecoverable losses in human life and ecosystems.
4.6. Evaluating Risk and Vulnerability of the Water Supply System Performance
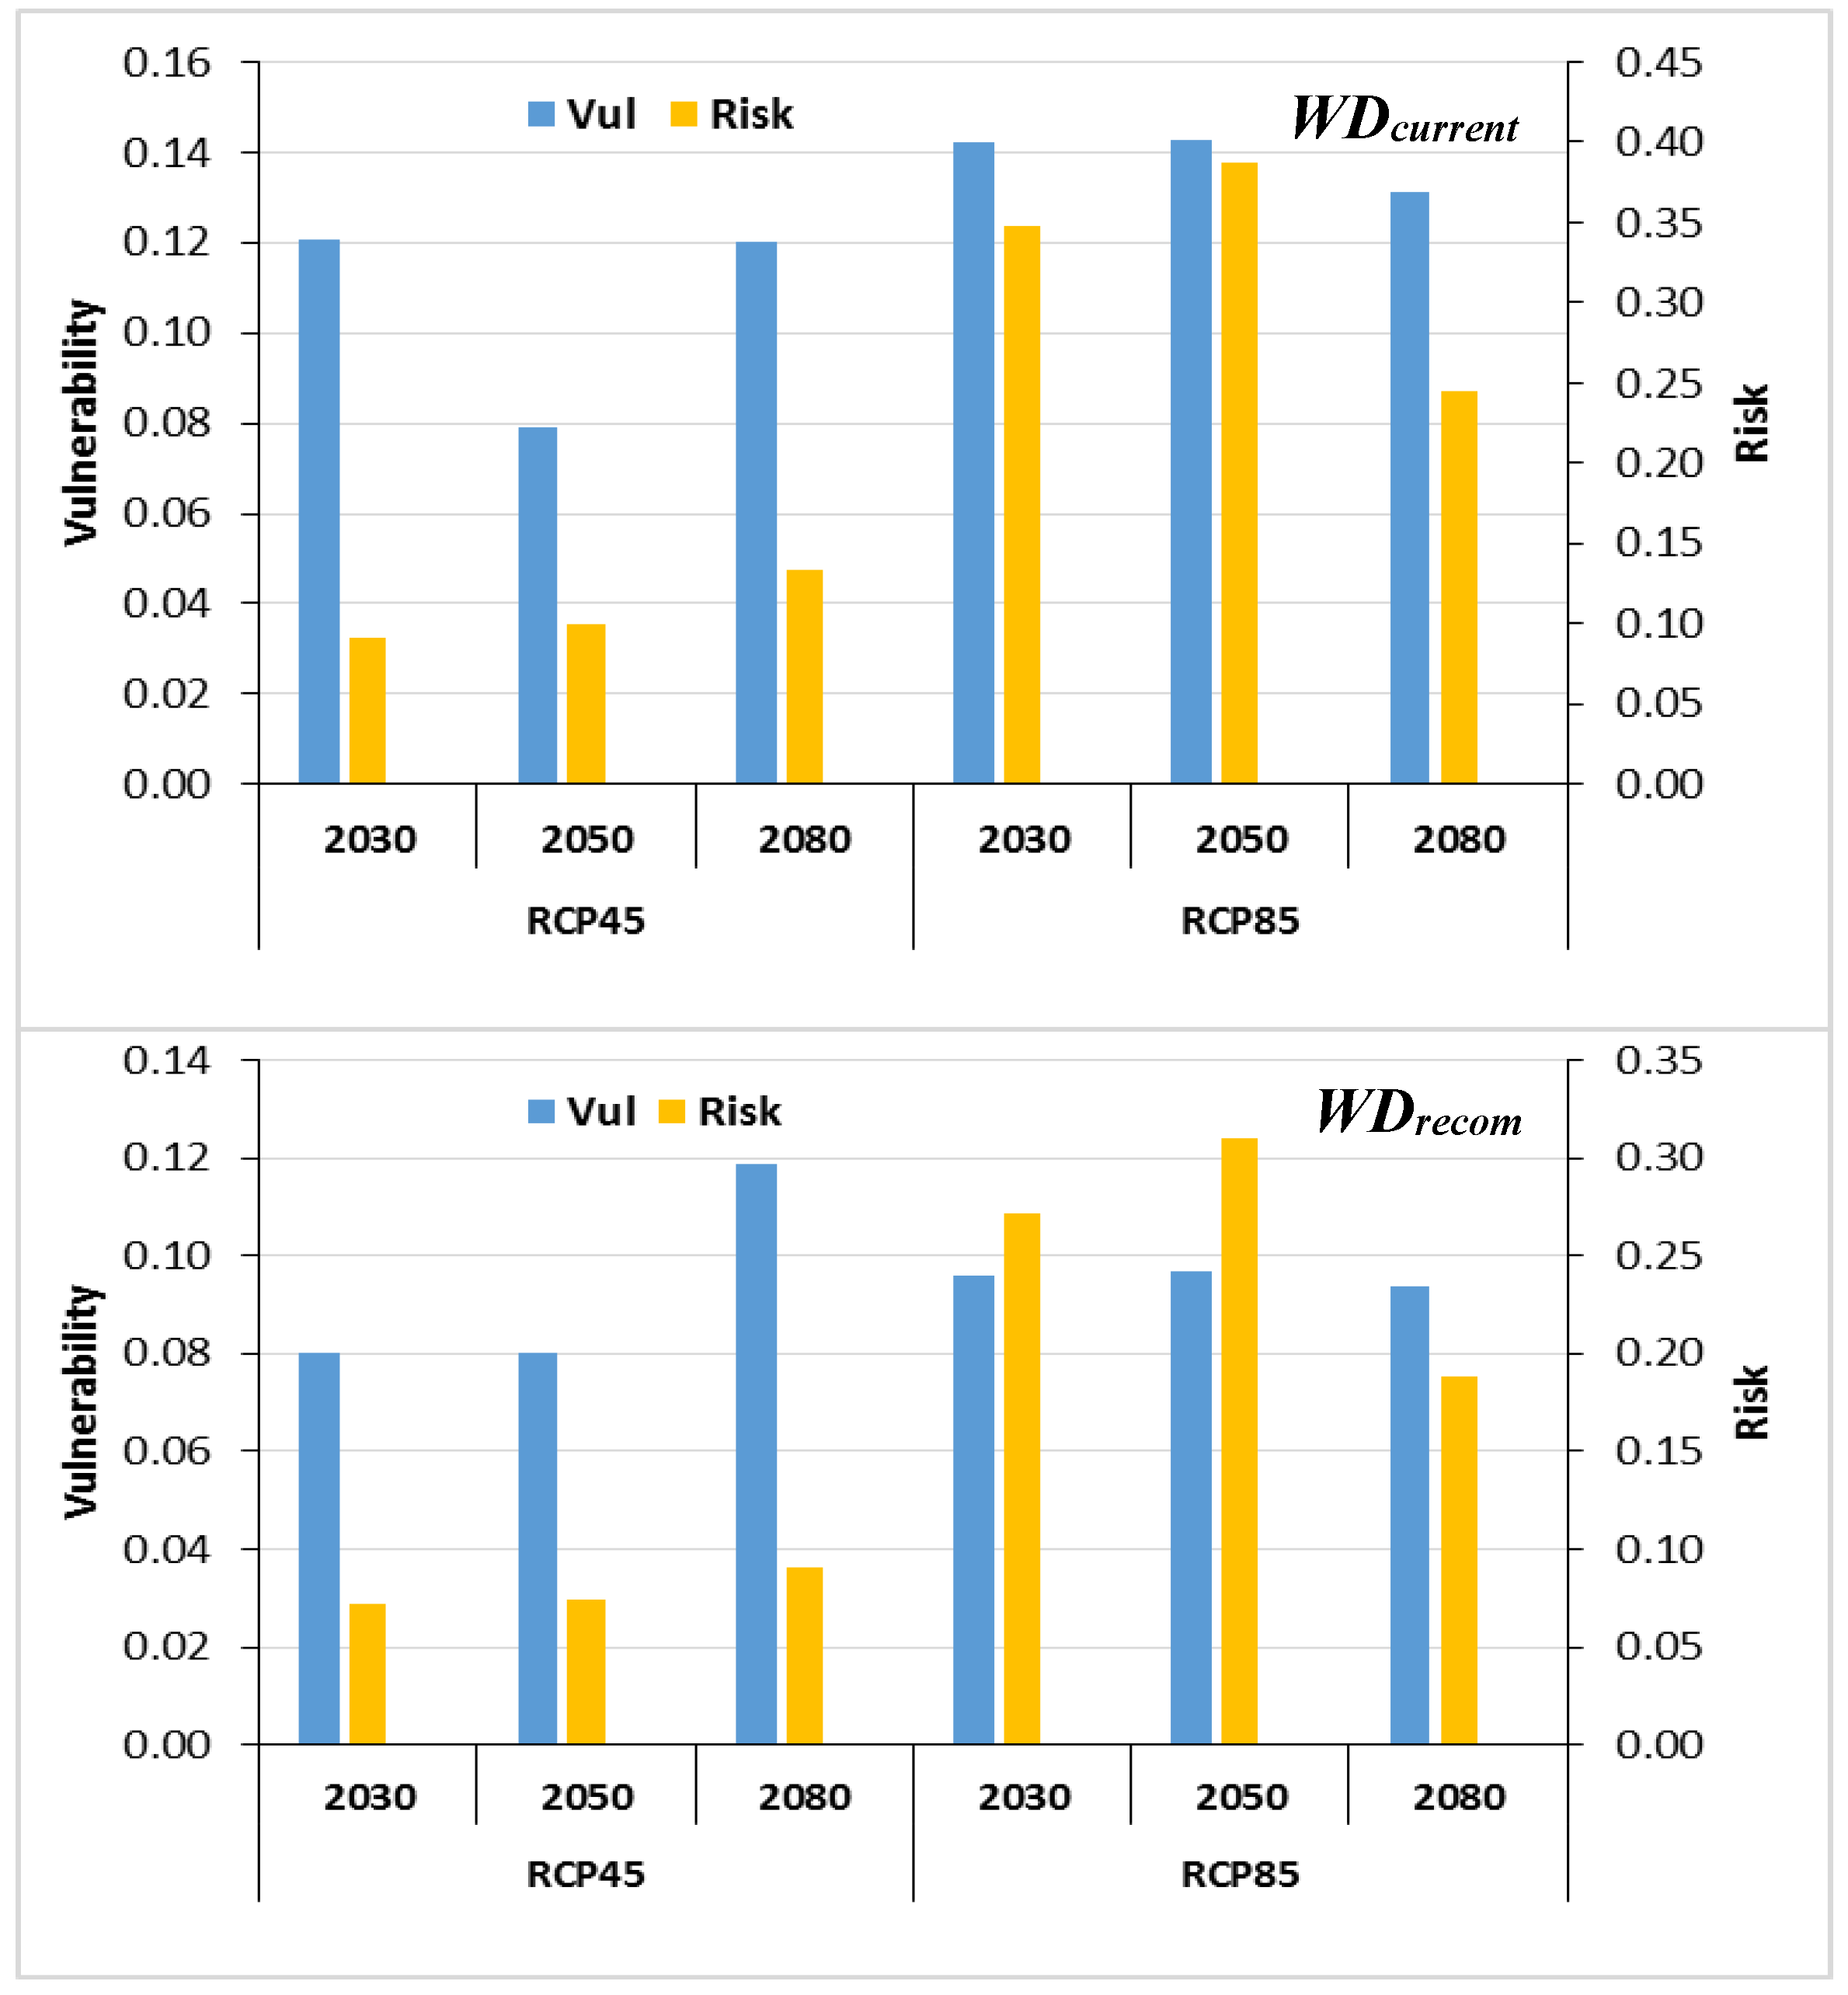
Using Equations (8) and (10), respectively, the weighted average risk of the ZRB water supply system/reservoir operation and the weighted average vulnerability of the various demand stakeholders were computed using the individual values listed in Table 8, exemplary of the WDrecom scenario/RCP45/2030period for the two water demand scenarios WDcurrent and WDrecom.
The results are depicted in Figure 7 and show clearly that both the risk of the water supply system and the average vulnerability are remarkably higher for the (more extreme) RCP85 than for RCP45 scenario. Moreover, for the RCP85, both indices exhibited a similar behavior, i.e., a higher degree of risk goes hand in hand with more vulnerability, whereas for the RCP45 this was not the case, noting that although the risk of the reservoir system was quite low, the average vulnerability of all water demand stakeholders was still high. This curious behavior was most likely a consequence of the more erratic formula for vulnerability (Equation (8)) and that for the risk (Equation (10)).
However, Figure 7 also reveals that, compared to the WDcurrent demand scenario, WDrecom noticeably reduces both the risk and the vulnerability, particularly for the RCP45. For the RCP85, the system was still vulnerable and had a high risk, particularly in the 2030 and 2050 periods; whereas for the RCP45, the system would be relatively vulnerable, though without water supply risk in the 2080 period.
In the subsequent step, the overall performance of the ZRB water supply system was assessed using the Sustainability Group Index (SGI), as defined in Equation (12) and the associated variables defined in the previous Equations (6) to (11). These variables were computed for each water use category, with the results also listed in Table 8 for the WDrecom scenario/RCP45/2030period. Similar results would be obtained for the other WD-scenario/RCP/periods combinations.
Using this procedure, the SGI indices for all the RCPs/periods were calculated for both the WDcurrent and WDrecom water demand scenarios. The individual results, together with the future period averages of each RCP are listed in Table 9.
As can be seen from the table, compared with the historical period, for both water demand scenarios, WDcurrent and WDrecom, the average SGI of each RCP will be decreased significantly, particularly for the more extreme RCP85 scenario. However, as expected, the SGI decrease for WDrecom was less than that of WDcurrent, indicating the advantage of implementing this more sustainable water demand scenario. Whereas for the RCP45, the system performance was the best for the 2050 future period, it was at that time the worst for the RCP85, though it improved again for the latter in the 2080 period, owing to the high SDR found previously for that RCP/period (see Table 7). Nevertheless, for all the RCP/period combinations, the SGIs are systematically higher for WDrecom than for WDcurrent, and unless some adaptation strategies and policy changes to a lower emission scenario are implemented, the water sustainability in the ZRB will deteriorate tremendously in the future.
5. Summary and Conclusions
In this study, a combination of the SWAT with the MODSIM model was applied to evaluate the possible impacts of climate change on the water supply system performance in terms of sustainability for the important multi-purpose reservoir Boukan dam in the ZRB, northwest Iran. To do this, firstly the available CORDEX RCM models for the South Asia region at a resolution of 0.44° × 0.44° were compared using a skill score multi-criteria method based on past performance of the models for precipitation and temperatures (minimum and maximum). Then, for the most suitable available experiment, the HadGEM2-RCA4, the monthly biases of the climate predictors were corrected using a trend-preserving (ISI-MIP) bias correction method which applies a multiplicative correction factor (CPj) for precipitation and an additive one for temperatures (CTj) in each month j of the year.
The satisfactorily calibrated and validated SWAT model (using the SWATCUP-SUFI2-module) was then utilized to simulate the impact of climate change on the hydrology in the ZRB using the bias-corrected climate variables above, as input drivers to the SWAT model. The effects of two RCP-emission scenarios (RCP45 and RCP85) were investigated for three 19-year-long future periods (2030, 2050, and 2080).
The projected SWAT modeled inflows to the Boukan dam were then applied to the MODSIM water resource planning and management model to analyze two possible future water demand scenarios: (1) WDcurrent which extends the current water policies by assuming the complete development of the water supply projects of the different water uses; (2) WDrecom as a more sustainable water demand scenario, recommended by MOE, where the potable and industrial developments are improved and the agricultural demands are decreased by improving the irrigation network efficiency.
The reliability of the dam’s water supply for different water uses in the study area was then investigated through the definition of the supply/demand ratio (SDR). Next, the vulnerability and the risk of the water supply system were evaluated and combining these with other system performance indices, including reliability, resiliency, and maximum deficit, the sustainability group index (SGI) of the water supply system was assessed for the different water demand/climate change scenarios.
The results showed that the WDcurrent scenario (continuation of the current water policies with a projected increase of the demands) will lead to a considerable future decrease of the SDRs for the different water-demand categories, i.e., more water deficits, especially for the extreme “no mitigation” scenario RCP85. On the other hand, with the more sustainable water demand scenario WDrecom, the SDRs were mostly improved, particularly, for the “climate mitigation” scenario RCP45, although for RCP85 the SDR was just slightly increased and some water deficits still prevailed, specifically, in the agricultural demand category.
The analysis of the risk and vulnerability of the water supply system showed that these two parameters were noticeably higher for the more extreme emission scenario RCP85 than for the medium scenario RCP45. Interestingly, both indices had a similar trend for RCP85, i.e., a high degree of risk coincides with more vulnerability, whilst this holds less so for RCP45. Moreover, as expected, for the recommended water demand scenario WDrecom, the water supply system will experience lower vulnerability and risk than for the current scenario WDcurrent, but even so, the system is still vulnerable with a high risk of water scarcity for RCP85 in the 2030 and 2050 periods and for RCP45 in the 2080 period. These results indicated that the negative impact of overuse of the water resources in ZRB, namely from the Boukan Dam, cannot completely be averted in the future, but may, at least, be controlled by implementing the more sustainable water management demand scenario WDrecom.
The sustainability assessment revealed that for both the water demand scenarios, WDcurrent and WDrecom, the best water supply performance in terms of the sustainability group index (SGI) was expected to be in the 2050 future period for RCP45, and in the 2080 period for RCP85. Expectedly, the SGIs were about 15–26% higher for WDrecom than for WDcurrent, where the SGI will be quite satisfactory for RCP45, with SGI = 0.82, which was close to that of the historical period, with an SGI = 0.54 for the more extreme RCP85 scenario.
Thus, in conclusion, to adapt to future climate change in the ZRB, the industrial, potable future water-use sectors, and especially, the agricultural water-use, as the biggest share of the demand, should be decreased in the future by enhancing the efficiency of water use and by implementing the MOE recommended strategies, whilst respecting lower emission mitigation scenarios.
It should also be noted that, as shown in the study by Emami and Koch [29], a further decrease in the agricultural water demand in the ZRB can be achieved, especially for RCP85, by employing some adaptation strategies through the optimization of the crop pattern in the area.
The results of this study indicate that the add-on or coupling of a water decision making model (MODSIM) to a hydrological model (SWAT) results in a powerful simulation tool that be used for integrated watershed management based on sustainable water management principles. The modelling approach of the research proposed here could be used for assessing and predicting the sustainability of a water supply system in other similar river basins and further as a base tool for managing available freshwater resources with a sustainable and optimal river basin management approach. However, as the analysis here has been done using the present water management criteria and water supply data as the objective functions, the effects of more recent, possibly different economic and social criteria should be investigated in upcoming SWAT-MODSIM studies.
Author Contributions
F.E. conceived the research, implemented the procedures, and wrote the outline of the manuscript. M.K. supervised the research. Both authors contributed in finalizing the manuscript, with M.K. doing the final major editing.
Funding
This research received no external funding.
Conflicts of Interest
The authors declare no conflict of interest.
References
- Madani, K. Water management in iran: What is causing the looming crisis? J. Environ. Stud. Sci. 2014, 4, 315–328. [Google Scholar] [CrossRef]
- Voss, K.A.; Famiglietti, J.S.; Lo, M.; De Linage, C.; Rodell, M.; Swenson, S.C. Groundwater depletion in the middle east from grace with implications for transboundary water management in the Tigris-Euphrates-Western Iran region. Water Resour. Res. 2013, 49, 904–914. [Google Scholar] [CrossRef] [PubMed]
- Abbaspour, K.C.; Faramarzi, M.; Ghasemi, S.S.; Yang, H. Assessing the impact of climate change on water resources in Iran. Water Resour. Res. 2009, 45. [Google Scholar] [CrossRef] [Green Version]
- Fiseha, B.; Setegn, S.; Melesse, A.; Volpi, E.; Fiori, A. Impact of climate change on the hydrology of Upper Tiber river basin using bias corrected regional climate model. Water Resour. Manag. 2014, 28, 1327–1343. [Google Scholar] [CrossRef]
- Aditya, S.; Lal, M.; Silva, N.; McCartney, M. Understanding the Hydrological Impacts of Climate Change in the Tana River Basin, Kenya; IWMI Working Paper; International Water Management Institute: Colombo, Sri Lanka, 2017. [Google Scholar]
- Yira, Y.; Diekkrüger, B.; Steup, G.; Bossa, A.Y. Impact of climate change on hydrological conditions in a tropical West African catchment using an ensemble of climate simulations. Hydrol. Earth Syst. Sci. 2017, 21, 2143. [Google Scholar] [CrossRef]
- Giorgi, F.; Jones, C.; Asrar, G.R. Addressing climate information needs at the regional level: The Cordex framework. World Meteorol. Organ. Bull. 2009, 58, 175. [Google Scholar]
- Gassman, P.W.; Reyes, M.R.; Green, C.H.; Arnold, J.G. The soil and water assessment tool: Historical development, applications, and future research directions. Trans. ASABE 2007, 50, 1211–1250. [Google Scholar] [CrossRef]
- McCartney, M.; Forkuor, G.; Sood, A.; Amisigo, B.; Hattermann, F.; Muthuwatta, L. The Water Resource Implications of Changing Climate in the Volta River Basin; IWMI: Colombo, Sri Lanka, 2012; Volume 146. [Google Scholar]
- Ashraf Vaghefi, S.; Mousavi, S.J.; Abbaspour, K.C.; Srinivasan, R.; Arnold, J.R. Integration of hydrologic and water allocation models in basin-scale water resources management considering crop pattern and climate change: Karkheh river basin in Iran. Reg. Environ. Chang. 2015, 15, 475–484. [Google Scholar] [CrossRef]
- Hashemi, H. Climate change and the future of water management in Iran. Middle East Crit. 2015, 24, 307–323. [Google Scholar] [CrossRef]
- Danesh, A.S.; Ahadi, M.S.; Fahmi, H.; Nokhandan, M.H.; Eshraghi, H. Climate change impact assessment on water resources in Iran: Applying dynamic and statistical downscaling methods. J. Water Clim. Chang. 2016, 7, 551–577. [Google Scholar] [CrossRef]
- Faramarzi, M.; Abbaspour, K.C.; Schulin, R.; Yang, H. Modelling blue and green water resources availability in Iran. Hydrol. Process. Int. J. 2009, 23, 486–501. [Google Scholar] [CrossRef]
- Zahabiyoun, B.; Goodarzi, M.; Bavani, A.M.; Azamathulla, H. Assessment of climate change impact on the Gharesou River Basin using swat hydrological model. CLEAN Soil Air Water 2013, 41, 601–609. [Google Scholar] [CrossRef]
- Loucks, D.P. Quantifying trends in system sustainability. Hydrol. Sci. J. 1997, 42, 513–530. [Google Scholar] [CrossRef] [Green Version]
- Karamouz, M.; Mohammadpour, P.; Mahmoodzadeh, D. Assessment of sustainability in water supply-demand considering uncertainties. Water Resour. Manag. 2017, 31, 3761–3778. [Google Scholar] [CrossRef]
- Sandoval-Solis, S.; McKinney, D.C.; Loucks, D.P. Sustainability index for water resources planning and management. J. Water Resour. Plan. Manag. 2011, 137, 381–390. [Google Scholar] [CrossRef]
- Veldkamp, T.; Wada, Y.; Aerts, J.; Ward, P. Towards a global water scarcity risk assessment framework: Incorporation of probability distributions and hydro-climatic variability. Environ. Res. Lett. 2016, 11, 024006. [Google Scholar] [CrossRef]
- Emami, F.; Koch, M. Evaluation of statistical-downscaling/bias-correction methods to predict hydrologic responses to climate change in the Zarrine River Basin, Iran. Climate 2018, 6, 30. [Google Scholar] [CrossRef]
- Wilby, R.L.; Dawson, C.W.; Barrow, E.M. Sdsm—A decision support tool for the assessment of regional climate change impacts. Environ. Model. Softw. 2002, 17, 145–157. [Google Scholar] [CrossRef]
- Wilby, R.L.; Dawson, C.W. Statistical Downscaling Model–Decision Centric (SDSM-DC) Version 5.1 Supplementary Note; Loughborough University: Loughborough, UK, 2013. [Google Scholar]
- Hessami, M.; Gachon, P.; Ouarda, T.B.; St-Hilaire, A. Automated regression-based statistical downscaling tool. Environ. Model. Softw. 2008, 23, 813–834. [Google Scholar] [CrossRef]
- Themeßl, J.M.; Gobiet, A.; Leuprecht, A. Empirical-statistical downscaling and error correction of daily precipitation from regional climate models. Int. J. Climatol. 2011, 31, 1530–1544. [Google Scholar] [CrossRef]
- Miao, C.; Su, L.; Sun, Q.; Duan, Q. A nonstationary bias-correction technique to remove bias in GCM simulations. J. Geophys. Res. Atmos. 2016, 121, 5718–5735. [Google Scholar] [CrossRef] [Green Version]
- Giorgi, F.; Gutowski, W.J. Coordinated experiments for projections of regional climate change. Curr. Clim. Chang. Rep. 2016, 2, 202–210. [Google Scholar] [CrossRef]
- Mousavi, V.; Naghavi Azad, A.; Mostafavi, P.; Ildar Tanha, N. Downscaling the regional climate of Iran and its challenges, center for research in climate change and global warming. In Proceedings of the 8th ICTP Workshop on the Theory and Use of Regional Climate Models, Trieste, Italy, 23 May–3 June 2016. [Google Scholar]
- Senatore, A.; Hejabi, S.; Mendicino, G.; Bazrafshan, J.; Irannejad, P. Climate conditions and drought assessment with the palmer drought severity index in Iran: Evaluation of CORDEX South Asia climate projections (2070–2099). Clim. Dyn. 2018, 1–27. [Google Scholar] [CrossRef]
- Hempel, S.; Frieler, K.; Warszawski, L.; Schewe, J.; Piontek, F. A trend-preserving bias correction—The ISI-MIP approach. Earth Syst. Dyn. 2013, 4, 219–236. [Google Scholar] [CrossRef]
- Emami, F.; Koch, M. Agricultural water productivity-based hydro-economic modeling for optimal crop pattern and water resources planning in the Zarrine River Basin, Iran, in the wake of climate change. Sustainability 2018, 10, 3953. [Google Scholar] [CrossRef]
- Arnold, J.G.; Srinivasan, R.; Muttiah, R.S.; Williams, J.R. Large area hydrologic modeling and assessment Part I: Model development 1. JAWRA J. Am. Water Resour. Assoc. 1998, 34, 73–89. [Google Scholar] [CrossRef]
- Neitsch, S.; Arnold, J.; Kiniry, J.E.A.; Srinivasan, R.; Williams, J. Soil and Water Assessment Tool User’s Manual Version 2000; GSWRL Report; Texas Water Resources Institute: College Station, TX, USA, 2002; Volume 202. [Google Scholar]
- Glavan, M.; Ceglar, A.; Pintar, M. Assessing the impacts of climate change on water quantity and quality modelling in small Slovenian Mediterranean catchment–lesson for policy and decision makers. Hydrol. Process. 2015, 29, 3124–3144. [Google Scholar] [CrossRef]
- Anand, J.; Devak, M.; Gosain, A.K.; Khosa, R.; Dhanya, C.T. Spatial extent of future changes in the hydrologic cycle components in ganga basin using ranked CORDEX RCMS. Hydrol. Earth Syst. Sci. Discuss. 2017. in review. [Google Scholar] [CrossRef]
- Abbaspour, K.C.; Rouholahnejad, E.; Vaghefi, S.; Srinivasan, R.; Yang, H.; Kløve, B. A continental-scale hydrology and water quality model for europe: Calibration and uncertainty of a high-resolution large-scale swat model. J. Hydrol. 2015, 524, 733–752. [Google Scholar] [CrossRef]
- Labadie, J.W.; Bode, D.A.; Pineda, A.M. Network model for decision support in municipal raw water supply 1. J. Am. Water Resour. Assoc. 1986, 22, 927–940. [Google Scholar] [CrossRef]
- El-Beshri, M.; Labadie, J. Optimal conjunctive use of surface and groundwater resources in egypt. In Proceedings of the VIII IWRA World Congress on Water Resources, Cairo, Egypt, 21–25 November 1994. [Google Scholar]
- Labadie, J.W.; Fontane, D.G.; Lee, J.H.; Ko, I.H. Decision support system for adaptive river basin management: Application to the Geum River basin, Korea. Water Int. 2007, 32, 397–415. [Google Scholar] [CrossRef]
- Emami, F.; Koch, M. Evaluating the water resources and operation of the Boukan dam in Iran under climate change. Eur. Water 2017, 59, 17–24. [Google Scholar]
- Labadie, J. MODSIM: River Basin Network Flow Model for Conjunctive Stream-Aquifer Management; Program User Manual and Documentation; Colorado State University: Fort Collins, CO, USA, 1995. [Google Scholar]
- Fredericks, J.W.; Labadie, J.W.; Altenhofen, J.M. Decision support system for conjunctive stream-aquifer management. J. Water Resour. Plan. Manag. 1998, 124, 69–78. [Google Scholar] [CrossRef]
- Bertsekas, D.P.; Tseng, P. Partial proximal minimization algorithms for convex programming. SIAM J. Optim. 1994, 4, 551–572. [Google Scholar] [CrossRef]
- Mays, L.W. Water Resources Sustainability; McGraw-Hill: New York, NY, USA, 2007. [Google Scholar]
- Russo, T.; Alfredo, K.; Fisher, J. Sustainable water management in urban, agricultural, and natural systems. Water 2014, 6, 3934–3956. [Google Scholar] [CrossRef]
- Ministry of the Energy. Updating of Water Master Plan of Iran; Water and Wastewater Macro Planning Bureau: Tehran, Iran, 2014.
- Hashimoto, T.; Stedinger, J.R.; Loucks, D.P. Reliability, resiliency, and vulnerability criteria for water resource system performance evaluation. Water Resour. Res. 1982, 18, 14–20. [Google Scholar] [CrossRef] [Green Version]
- Qiu, L.J.; Zheng, F.L.; Yin, R.S. SWAT-based runoff and sediment simulation in a small watershed, the loessial hilly-gullied region of China: capabilities and challenges. Int. J. Sediment Res. 2012, 27, 226–234. [Google Scholar] [CrossRef]
- Moriasi, D.N.; Arnold, J.G.; Van Liew, M.W.; Bingner, R.L.; Harmel, R.D.; Veith, T.L. Model evaluation guidelines for systematic quantification of accuracy in watershed simulations. Trans. ASABE 2007, 50, 885–900. [Google Scholar] [CrossRef]
Figure 1.
Map of the Zarrine River basin (ZRB) in northwestern Iran with the Boukan Dam and the climate and streamflow stations (a), together with the basin configuration of the Soil and Water Assessment Tool (SWAT) model (b).
Figure 1.
Map of the Zarrine River basin (ZRB) in northwestern Iran with the Boukan Dam and the climate and streamflow stations (a), together with the basin configuration of the Soil and Water Assessment Tool (SWAT) model (b).

Figure 2.
MODSIM conceptualized network system for the Boukan Dam and the ZRB watershed.

Figure 3.
Box (whisker) plots of the predicted mean annual temperature (a) and precipitation (b) for the historical period (1987–2012) and the three future periods under the two RCPs.
Figure 3.
Box (whisker) plots of the predicted mean annual temperature (a) and precipitation (b) for the historical period (1987–2012) and the three future periods under the two RCPs.

Figure 4.
Simulated and observed Boukan Dam inflow for the calibration and validation periods.

Figure 5.
Ranges of goodness of fit measures R2, NSE, bR2, for the outlet stations of the six sub-basins for the calibration and validation periods.
Figure 5.
Ranges of goodness of fit measures R2, NSE, bR2, for the outlet stations of the six sub-basins for the calibration and validation periods.

Figure 6.
Box (whisker) plots of the historical and future predicted annual Boukan Dam inflows.

Figure 7.
Weighted- average vulnerability and risk for the different RCP/periods for water demand scenario WDcurrent (top panel) and WDrecom (bottom panel).
Figure 7.
Weighted- average vulnerability and risk for the different RCP/periods for water demand scenario WDcurrent (top panel) and WDrecom (bottom panel).


Table 1.
Data and the data sources used in the hydrologic analysis of the ZRB.
| Data Type | Resolution | Source | Description |
|---|---|---|---|
| Digital Elevation Model (DEM) | 85 m | Iranian surveying organization | Elevation, overland, channel slopes and lengths |
| Land use map | 1000 m | Iranian Ministry of Agriculture, MOA | Land use classifications |
| Soil map | 10 km | Global FAO digital soil map | FAO-UNESCO classifications |
| Climate data | 6 stations (see Figure 1a) | Iranian meteorological organization | Daily precipitation, maximum and minimum temperatures |
| Streamflow data | 7 stations (see Figure 1a) | Ministry of Energy, Iran | Monthly river discharge of the stations at outlets the main sub-basins |
Table 2.
List of WAS-44 COordinated Regional climate Downscaling EXperiment (CORDEX) GCM-RCMs combinations with the labels used in the present study and the most suitable model found in bold.
Table 2.
List of WAS-44 COordinated Regional climate Downscaling EXperiment (CORDEX) GCM-RCMs combinations with the labels used in the present study and the most suitable model found in bold.
| Driving GCM | RCM | CORDEX RCM Abbreviation | Driving GCM | RCM | CORDEX RCM Abbreviation |
|---|---|---|---|---|---|
| CCCma-CanESM2 | IITM-RegCM4 | CanESM2-RegCM4 | IPSL-IPSL-CM5A-LR | IITM-RegCM4 | IPSL-RegCM4 |
| SMHI-RCA4 | CanESM2-RCA4 | SMHI-RCA4 | IPSL-RCA4 | ||
| CNRM-CERFACS-CNRM-CM5 | IITM-RegCM4 | CNRM-RegCM4 | MOHC-Had GEM2-ES | SMHI-RCA4 | HadGEM2-RCA4 |
| SMHI-RCA4 | CNRM-RCA4 | MPI-M-MPI-ESM-MR | IITM-RegCM4 | MPI-RegCM4 | |
| CSIRO-QCCCE-CSIRO-Mk3-6-0 | IITM-RegCM4 | CSIRO-RegCM4 | SMHI-RCA4 | MPI-RCA4 | |
| SMHI-RCA4 | CSIRO-RCA4 | NCC-Nor ESM1-MR | SMHI-RCA4 | NorESM1-RCA4 | |
| ICHEC-EC-EARTH | SMHI-RCA4 | ICHEC-RCA4 | NOAA-GFDL-GFDL-ESM2M | IITM-RegCM4 | NOAA-RegCM4 |
| MIROC-MIROC5 | SMHI-RCA4 | MIROC-RCA4 | SMHI-RCA4 | NOAA-RCA4 |
Table 3.
Statistical performances of the available CORDEX GCM-RCM models of WAS-44, and the resulting skill score for precipitation and temperature, with the best model highlighted in gray.
Table 3.
Statistical performances of the available CORDEX GCM-RCM models of WAS-44, and the resulting skill score for precipitation and temperature, with the best model highlighted in gray.
| CORDEX GCM-RCM Mode | Precipitation | Temperature | Overall Score | ||||||||
|---|---|---|---|---|---|---|---|---|---|---|---|
| B | NRMSE | R2 | NSE | Score | B | NRMSE | R2 | NSE | Score | ||
| CNRM-RCA4 | 1.32 | 2.09 | 0.08 | 0.28 | 1 | 0.61 | 0.50 | 0.91 | 0.51 | 8 | 4.5 |
| ICHEC-RCA4 | 0.95 | 1.78 | 0.08 | 0.48 | 10 | 0.61 | 0.36 | 0.89 | 0.74 | 5 | 7.5 |
| IPSL-RCA4 | 0.59 | 1.15 | 0.06 | 0.63 | 11 | 0.68 | 0.33 | 0.90 | 0.78 | 16 | 13.5 |
| MIROC-RCA4 | 1.40 | 2.07 | 0.16 | 0.33 | 3 | 0.59 | 0.33 | 0.90 | 0.79 | 12 | 7.5 |
| MPI-RCA4 | 1.13 | 1.80 | 0.13 | 0.42 | 6 | 0.55 | 0.39 | 0.90 | 0.69 | 3 | 4.5 |
| NOAA-RCA4 | 0.89 | 1.64 | 0.08 | 0.57 | 13 | 0.56 | 0.45 | 0.88 | 0.59 | 1 | 7 |
| CanESM2-RCA4 | 0.74 | 1.59 | 0.01 | 0.65 | 8 | 0.68 | 0.56 | 0.92 | 0.40 | 10 | 9 |
| HADGEM2-RCA4 | 1.29 | 1.29 | 0.15 | 0.38 | 15 | 0.66 | 0.34 | 0.90 | 0.78 | 14 | 14.5 |
| NorESM1-RCA4 | 1.03 | 1.74 | 0.02 | 0.60 | 9 | 0.70 | 0.30 | 0.89 | 0.82 | 15 | 12 |
| CSIRO-RCA4 | 1.20 | 1.87 | 0.08 | 0.46 | 2 | 1.40 | 3.34 | 0.90 | 0.61 | 2 | 2 |
| CanESM2-RegCM4 | 0.80 | 1.62 | 0.12 | 0.07 | 7 | 0.73 | 0.93 | 0.93 | 0.36 | 13 | 10 |
| CNRM-RegCM4 | 1.08 | 1.64 | 0.14 | 0.11 | 12 | 0.92 | 1.04 | 0.92 | 0.22 | 11 | 11.5 |
| CSIRO-RegCM4 | 1.16 | 1.61 | 0.23 | 0.13 | 14 | 1.06 | 1.14 | 0.93 | 0.13 | 6 | 10 |
| IPSL-RegCM4 | 1.02 | 1.68 | 0.17 | 0.08 | 16 | 1.01 | 1.09 | 0.91 | 0.16 | 4 | 10 |
| MPI-RegCM4 | 1.02 | 1.73 | 0.12 | 0.06 | 5 | 1.00 | 1.08 | 0.92 | 0.19 | 9 | 7 |
| NOAA-RegCM4 | 1.06 | 1.72 | 0.11 | 0.06 | 4 | 0.79 | 0.88 | 0.91 | 0.26 | 7 | 5.5 |
Table 4.
Effects of bias-correction of precipitation and temperatures based on B and NRMSE indices before and after application of the ISI-MIP method.
Table 4.
Effects of bias-correction of precipitation and temperatures based on B and NRMSE indices before and after application of the ISI-MIP method.
| Climate Variable | Bias Correction | Measure | St1 | St2 | St3 | St4 | St5 | St6 |
|---|---|---|---|---|---|---|---|---|
| Precipitation | Before | B | 0.69 | 0.71 | 0.70 | 0.60 | 0.68 | 0.71 |
| NRMSE | 0.36 | 0.34 | 0.44 | 0.36 | 0.24 | 0.23 | ||
| After | B | 0.85 | 0.92 | 0.86 | 0.80 | 0.84 | 0.94 | |
| NRMSE | 0.15 | 0.13 | 0.17 | 0.16 | 0.14 | 0.13 | ||
| Temperatures | Before | B | 0.68 | 0.30 | 0.91 | 0.94 | 0.83 | 0.50 |
| NRMSE | 0.23 | 0.22 | 0.29 | 0.23 | 0.16 | 0.15 | ||
| After | B | 1.00 | 1.00 | 0.99 | 0.99 | 0.99 | 1.00 | |
| NRMSE | 0.09 | 0.07 | 0.11 | 0.10 | 0.08 | 0.07 |
Table 5.
SWATCUP-SUFI2 P- and R- factor uncertainty indices for calibration and validation for the different streamflow gauge stations.
Table 5.
SWATCUP-SUFI2 P- and R- factor uncertainty indices for calibration and validation for the different streamflow gauge stations.
| Station | Calibration | Validation | ||
|---|---|---|---|---|
| P-Factor | R-Factor | P-Factor | R-Factor | |
| Nezamabad | 0.85 | 1.15 | 0.80 | 1.23 |
| Chooblooche | 0.78 | 1.28 | 0.76 | 1.33 |
| Sarighamish | 0.69 | 1.34 | 0.67 | 1.34 |
| Boukan Dam | 0.89 | 1.13 | 0.84 | 1.22 |
| Safakhaneh | 0.72 | 0.98 | 0.75 | 1.10 |
| Sonateh | 0.67 | 1.33 | 0.65 | 1.40 |
| Average | 0.77 | 1.20 | 0.75 | 1.30 |
Table 6.
Annual water demand for historical and future periods (2030, 2050, and 2080) under the eight categories in decreasing order, and the simulated supply/demand ratio (SDR) for these future periods under the RCP45 and RCP85 for the WDcurrent water demand scenario.
Table 6.
Annual water demand for historical and future periods (2030, 2050, and 2080) under the eight categories in decreasing order, and the simulated supply/demand ratio (SDR) for these future periods under the RCP45 and RCP85 for the WDcurrent water demand scenario.
| Demand Category | Demand (MCM) | SDR (%) | |||||||||
|---|---|---|---|---|---|---|---|---|---|---|---|
| RCP45 | RCP85 | ||||||||||
| Historic | 2030 | 2050 | 2080 | 2030 | 2050 | 2080 | 2030 | 2050 | 2080 | ||
| Pot | Present | 169 | 169 | 169 | 169 | 100% | 99% | 99% | 81% | 78% | 98% |
| Env | Dam | 378 | 378 | 378 | 378 | 96% | 97% | 84% | 82% | 77% | 84% |
| Env | Lake | 262 | 262 | 262 | 262 | 98% | 97% | 96% | 92% | 92% | 96% |
| Ind | Present | 5 | 5 | 5 | 5 | 97% | 100% | 81% | 67% | 63% | 81% |
| Agr | Present | 594 | 787 | 787 | 787 | 92% | 87% | 57% | 48% | 42% | 57% |
| Pot | Future | - | 60 | 130 | 272 | 90% | 87% | 69% | 62% | 54% | 69% |
| Ind | Future | - | 15 | 29 | 15 | 92% | 91% | 74% | 63% | 60% | 74% |
| Agr | Future | - | 150 | 150 | 150 | 86% | 76% | 40% | 35% | 30% | 40% |
| Total/Average | 1408 | 1826 | 1910 | 2038 | 94% | 92% | 75% | 66% | 62% | 75% | |
Table 7.
Similar to Table 6, but for the WDrecom water demand scenario. Included are the percentile difference of the SDRs with those of the WDcurrent.
Table 7.
Similar to Table 6, but for the WDrecom water demand scenario. Included are the percentile difference of the SDRs with those of the WDcurrent.
| Demand Category | Demand (MCM) | SDR (%) Difference to SDR (WDcurrent) | |||||||||
|---|---|---|---|---|---|---|---|---|---|---|---|
| RCP45 | RCP85 | ||||||||||
| Historic | 2030 | 2050 | 2080 | 2030 | 2050 | 2080 | 2030 | 2050 | 2080 | ||
| Pot | Present | 169 | 169 | 169 | 169 | 100% | 100% | 100% | 83% | 81% | 100% |
| 0% | 1% | 1% | 2% | 3% | 2% | ||||||
| Env | Dam | 378 | 378 | 378 | 378 | 99% | 100% | 97% | 91% | 89% | 93% |
| 3% | 3% | 13% | 9% | 12% | 9% | ||||||
| Env | Lake | 262 | 262 | 262 | 262 | 100% | 100% | 100% | 97% | 97% | 98% |
| 2% | 3% | 4% | 5% | 5% | 2% | ||||||
| Ind | Present | 5 | 5 | 5 | 5 | 98% | 100% | 99% | 68% | 64% | 85% |
| 1% | 0% | 18% | 1% | 1% | 4% | ||||||
| Agr | Present | 594 | 695 | 695 | 695 | 94% | 92% | 90% | 51% | 47% | 64% |
| 2% | 5% | 33% | 3% | 5% | 7% | ||||||
| Pot | Future | - | 42 | 108 | 238 | 93% | 92% | 89% | 69% | 57% | 73% |
| 3% | 5% | 20% | 7% | 3% | 4% | ||||||
| Ind | Future | - | 13 | 13 | 11 | 93% | 92% | 86% | 61% | 56% | 69% |
| 1% | 1% | 12% | -2% | -4% | -5% | ||||||
| Agr | Future | - | 133 | 133 | 133 | 91% | 86% | 83% | 41% | 34% | 50% |
| 5% | 10% | 43% | 6% | 4% | 10% | ||||||
| Total/Average | 1408 | 1697 | 1763 | 1891 | 96% | 95% | 93% | 70% | 66% | 79% | |
| 2% | 4% | 18% | 4% | 4% | 4% | ||||||
Table 8.
ZRB water supply system performance based on the Reliability, Resilience, and Vulnerability (RRV) indices and the ensuing Sustainability Indexes (SIs) (Equation (6)), for the various water uses and the final total Sustainability Group Index (SGI) for the WDrecom scenario/RCP45/2030period. The last column lists the normalized weights wi = / entering the SGI-Equation (12).
| i | Demand Name | Risk | Vul | Rel | Res | Max.Def | SI | w |
|---|---|---|---|---|---|---|---|---|
| 1 | Pot_Boukan_Present | 0.08 | 0.05 | 0.92 | 0.91 | 0.36 | 0.84 | 0.22 |
| 2 | Pot_Tabriz_Present | 0.07 | 0.01 | 0.93 | 0.97 | 0.29 | 0.89 | 0.15 |
| 3 | Irr_Loss | 0 | 0 | 1.00 | 0.98 | 0.00 | 0.99 | 0.02 |
| 4 | Env_Boukan | 0.05 | 0.08 | 0.95 | 0.94 | 0.10 | 0.93 | 0.10 |
| 5 | Env_LakeUrmia | 0 | 0.04 | 1.00 | 0.98 | 0.02 | 0.98 | 0.09 |
| 6 | Ind_Present | 0.07 | 0.09 | 0.93 | 0.92 | 0.43 | 0.82 | 0.02 |
| 7 | Pump_Legzi | 0.05 | 0.1 | 0.95 | 0.97 | 0.18 | 0.91 | 0.01 |
| 8 | Agr_WR_Present | 0.06 | 0.13 | 0.94 | 0.92 | 0.89 | 0.29 | 0.08 |
| 9 | Agr_Present | 0.09 | 0.13 | 0.91 | 0.91 | 0.78 | 0.63 | 0.29 |
| 10 | Agr_Future | 0.07 | 0.08 | 0.93 | 0.91 | 0.50 | 0.79 | 0.01 |
| 11 | Pot_Future | 0.01 | 0.08 | 0.99 | 0.97 | 0.08 | 0.95 | 0.00 |
| 12 | Ind_Future | 0 | 0 | 1.00 | 0.98 | 0.99 | 0.97 | 0.01 |
| Weighted average | 0.07 | 0.08 | SGI = Sum (w × SI) = 0.79 | |||||
Table 9.
SGI index of the water supply performance for WDcurrent and WDrecom water demand scenarios for the historic and the different RCPs/periods. Included are the averages of each RCP.
Table 9.
SGI index of the water supply performance for WDcurrent and WDrecom water demand scenarios for the historic and the different RCPs/periods. Included are the averages of each RCP.
| Water Demand Scenario | Historic Period | RCP45/2030 | RCP45/2050 | RCP45/2080 | RCP45-Average | RCP85/2030 | RCP85/2050 | RCP85/2080 | RCP85-Average |
|---|---|---|---|---|---|---|---|---|---|
| WDcurrent | 0.89 | 0.70 | 0.81 | 0.62 | 0.71 | 0.46 | 0.31 | 0.52 | 0.43 |
| WDrecom | 0.79 | 0.89 | 0.78 | 0.82 | 0.57 | 0.45 | 0.59 | 0.54 |
© 2018 by the authors. Licensee MDPI, Basel, Switzerland. This article is an open access article distributed under the terms and conditions of the Creative Commons Attribution (CC BY) license (http://creativecommons.org/licenses/by/4.0/).
Share and Cite
MDPI and ACS Style
Emami, F.; Koch, M. Sustainability Assessment of the Water Management System for the Boukan Dam, Iran, Using CORDEX- South Asia Climate Projections. Water 2018, 10, 1723. https://doi.org/10.3390/w10121723
AMA Style
Emami F, Koch M. Sustainability Assessment of the Water Management System for the Boukan Dam, Iran, Using CORDEX- South Asia Climate Projections. Water. 2018; 10(12):1723. https://doi.org/10.3390/w10121723
Chicago/Turabian StyleEmami, Farzad, and Manfred Koch. 2018. "Sustainability Assessment of the Water Management System for the Boukan Dam, Iran, Using CORDEX- South Asia Climate Projections" Water 10, no. 12: 1723. https://doi.org/10.3390/w10121723
Note that from the first issue of 2016, this journal uses article numbers instead of page numbers. See further details here.