Depth-Dependent Seasonal Variation of Soil Water in a Thick Vadose Zone in the Badain Jaran Desert, China


MOE Key Laboratory of Groundwater Circulation and Environmental Evolution, China University of Geosciences (Beijing), Beijing 100083, China
*
Author to whom correspondence should be addressed.
Water 2018, 10(12), 1719; https://doi.org/10.3390/w10121719
Submission received: 9 October 2018
/
Revised: 18 November 2018
/
Accepted: 21 November 2018
/
Published: 24 November 2018
(This article belongs to the Section Water Resources Management, Policy and Governance)
Abstract
:In a vadose zone the soil water content can change seasonally, driven by seasonal variations of meteorological factors. This dynamic behavior is depth-dependent, which controls the groundwater recharge from infiltration, and plays an essential role in the environments in arid and semi-arid regions. In particular, the depth-dependent seasonal variations of soil water were investigated in the Badain Jaran Desert (BJD), China, where the vadose zone is thick. The monitoring results showed that the amplitudes of temperature and soil moisture content in the shallow vadose zone (depth < 3 m) significantly decrease with depth. For the deep vadose zone (depth >3 m), the depth-dependent dynamic was synthetically estimated with both numerical and analytical models. Results show that the penetration depth of seasonal fluctuation is about 47 m, below which the infiltration flux stabilizes at a level of 30.7 ± 4 mm/yr. The depth to water table in the BJD is generally larger than 50 m, up to 480 m. As a consequence, groundwater recharge from infiltration in this area almost does not change in different seasons.
1. Introduction
Periodic variations of meteorological factors at the land surface, such as precipitation and evapotranspiration, can be transmitted downward into the vadose zone by soil water movements, causing fluctuations of available soil water for plants and of groundwater recharge from infiltration. A typical behavior of this kind of dynamic is the seasonal variation of soil water content; rising in some seasons and falling in the other seasons. Such a seasonal fluctuation of soil water content is accompanied by the seasonal fluctuation of vertical flow rate, which is of great significance for groundwater recharge from infiltration, especially in arid and semi-arid regions. Generally, a buffer effect exists in the vadose zone so that fluctuation amplitudes of soil water content and flux decay with increasing depth.
Depth-dependent soil water fluctuation has been investigated by Klute and Heermann (1974) [1] with numerical models for a shallow depth (<3 m) and a short cycle (<2 h), which showed the decay trend of fluctuation amplitude. Assuming a cosine type of time-varying infiltration rate at land surface, Bakker and Nieber (2009) [2] presented an analytical formula for the amplitude of vertical soil water flux damping with depth, and found that the decay rate is positively related to the fluctuation frequency. This theoretical formula was used by Dickinson et al. (2014) [3], who defined the damping depth as the depth at which the variation range of flux is only 5% of that at the land surface. According to their estimation, when the seasonal fluctuation (a cycle of 365 d) is accounted for, the damping depth is generally 1 to 30 m in clay soils, but is up to 10 to 1000 m in sandy soils. These results highlighted the depth-dependent fluctuation of soil water for groundwater recharge from precipitation infiltration through a thick vadose zone, which widely exist in arid and semi-arid regions.
The Badain Jaran Desert (BJD), in China, is characterized by a thick vadose zone in mega sand dunes that are generally 50 to 400 m higher than local depressions with lakes. The lakes are groundwater fed and have been there for thousands of years or more [4]. Some highly controversial conjectures of water origination in this desert were presented in the literature [5,6,7]. A key question that arose was that could precipitation provide sufficient groundwater recharge via infiltration through the thick unsaturated zone [8]? A paleorecharge rate of less than 5 mm/yr was suggested after analyzing environmental tracer on unsaturated profiles [7,9,10,11,12], which seemed to be too small to counterbalance the evaporation loss of lake water, which is about 940–1300 mm/yr [4,13]. The tracer method relies on hydrochemistry information with a lot of uncertainties. It is necessary to solve the problem with direct observation and analysis on the dynamic process of soil water. In the last decade, several researchers carried out experimental studies on moving wetting fronts and varying soil water content in the vadose zone after rains in the desert [14,15,16,17,18]. They found that the wetting depth was seldom more than 3 m and thus set a negative conclusion for groundwater recharge from precipitation infiltration. In fact, we should not speculate that there is no infiltration recharge when wetting fronts after rains could not touch the water table at the zone below 3 m. The rain events behaved like a high frequency infiltration fluctuation, which could only be transmitted, moving as wetting front, into a shallow zone due to the damping effect [2,3]. This does not mean a zero-infiltration recharge, in contrast, is a result of the environment whereby the deep unsaturated zone yields almost uniform downward water flux [19]. In recent years, numerical modeling of unsaturated flow in the desert has been carried out to analyze the precipitation infiltration process according to long-term observation data [20,21]. It was found that the infiltration rate at 3 m depth was 5 to 33 mm/yr, which was a plausible and more accurate estimation of groundwater recharge. However, the thickness of the numerical model was limited to 3 m; therefore, less than the general thickness of the vadose zone in the desert.
In this paper, we analyze the seasonal variation of soil water moisture content, suction and temperature at different depths according to the long-term monitoring data in the BJD. The general details of study region and observation methods are presented in Section 2. The decay of fluctuation amplitude with depth for soils in the shallow zone (depth <3 m) is identified in Section 3. For the seasonal variation of soil water in the deep vadose zone (depth >3 m), which is hard to observe, the theory of Bakker and Nieber (2009) [2] and the numerical modeling method for unsaturated flow are used in the analysis and presented in Section 4. A new estimation of groundwater recharge in the BJD is obtained with the method.
2. Study Area and Observation Methods
2.1. Study Area
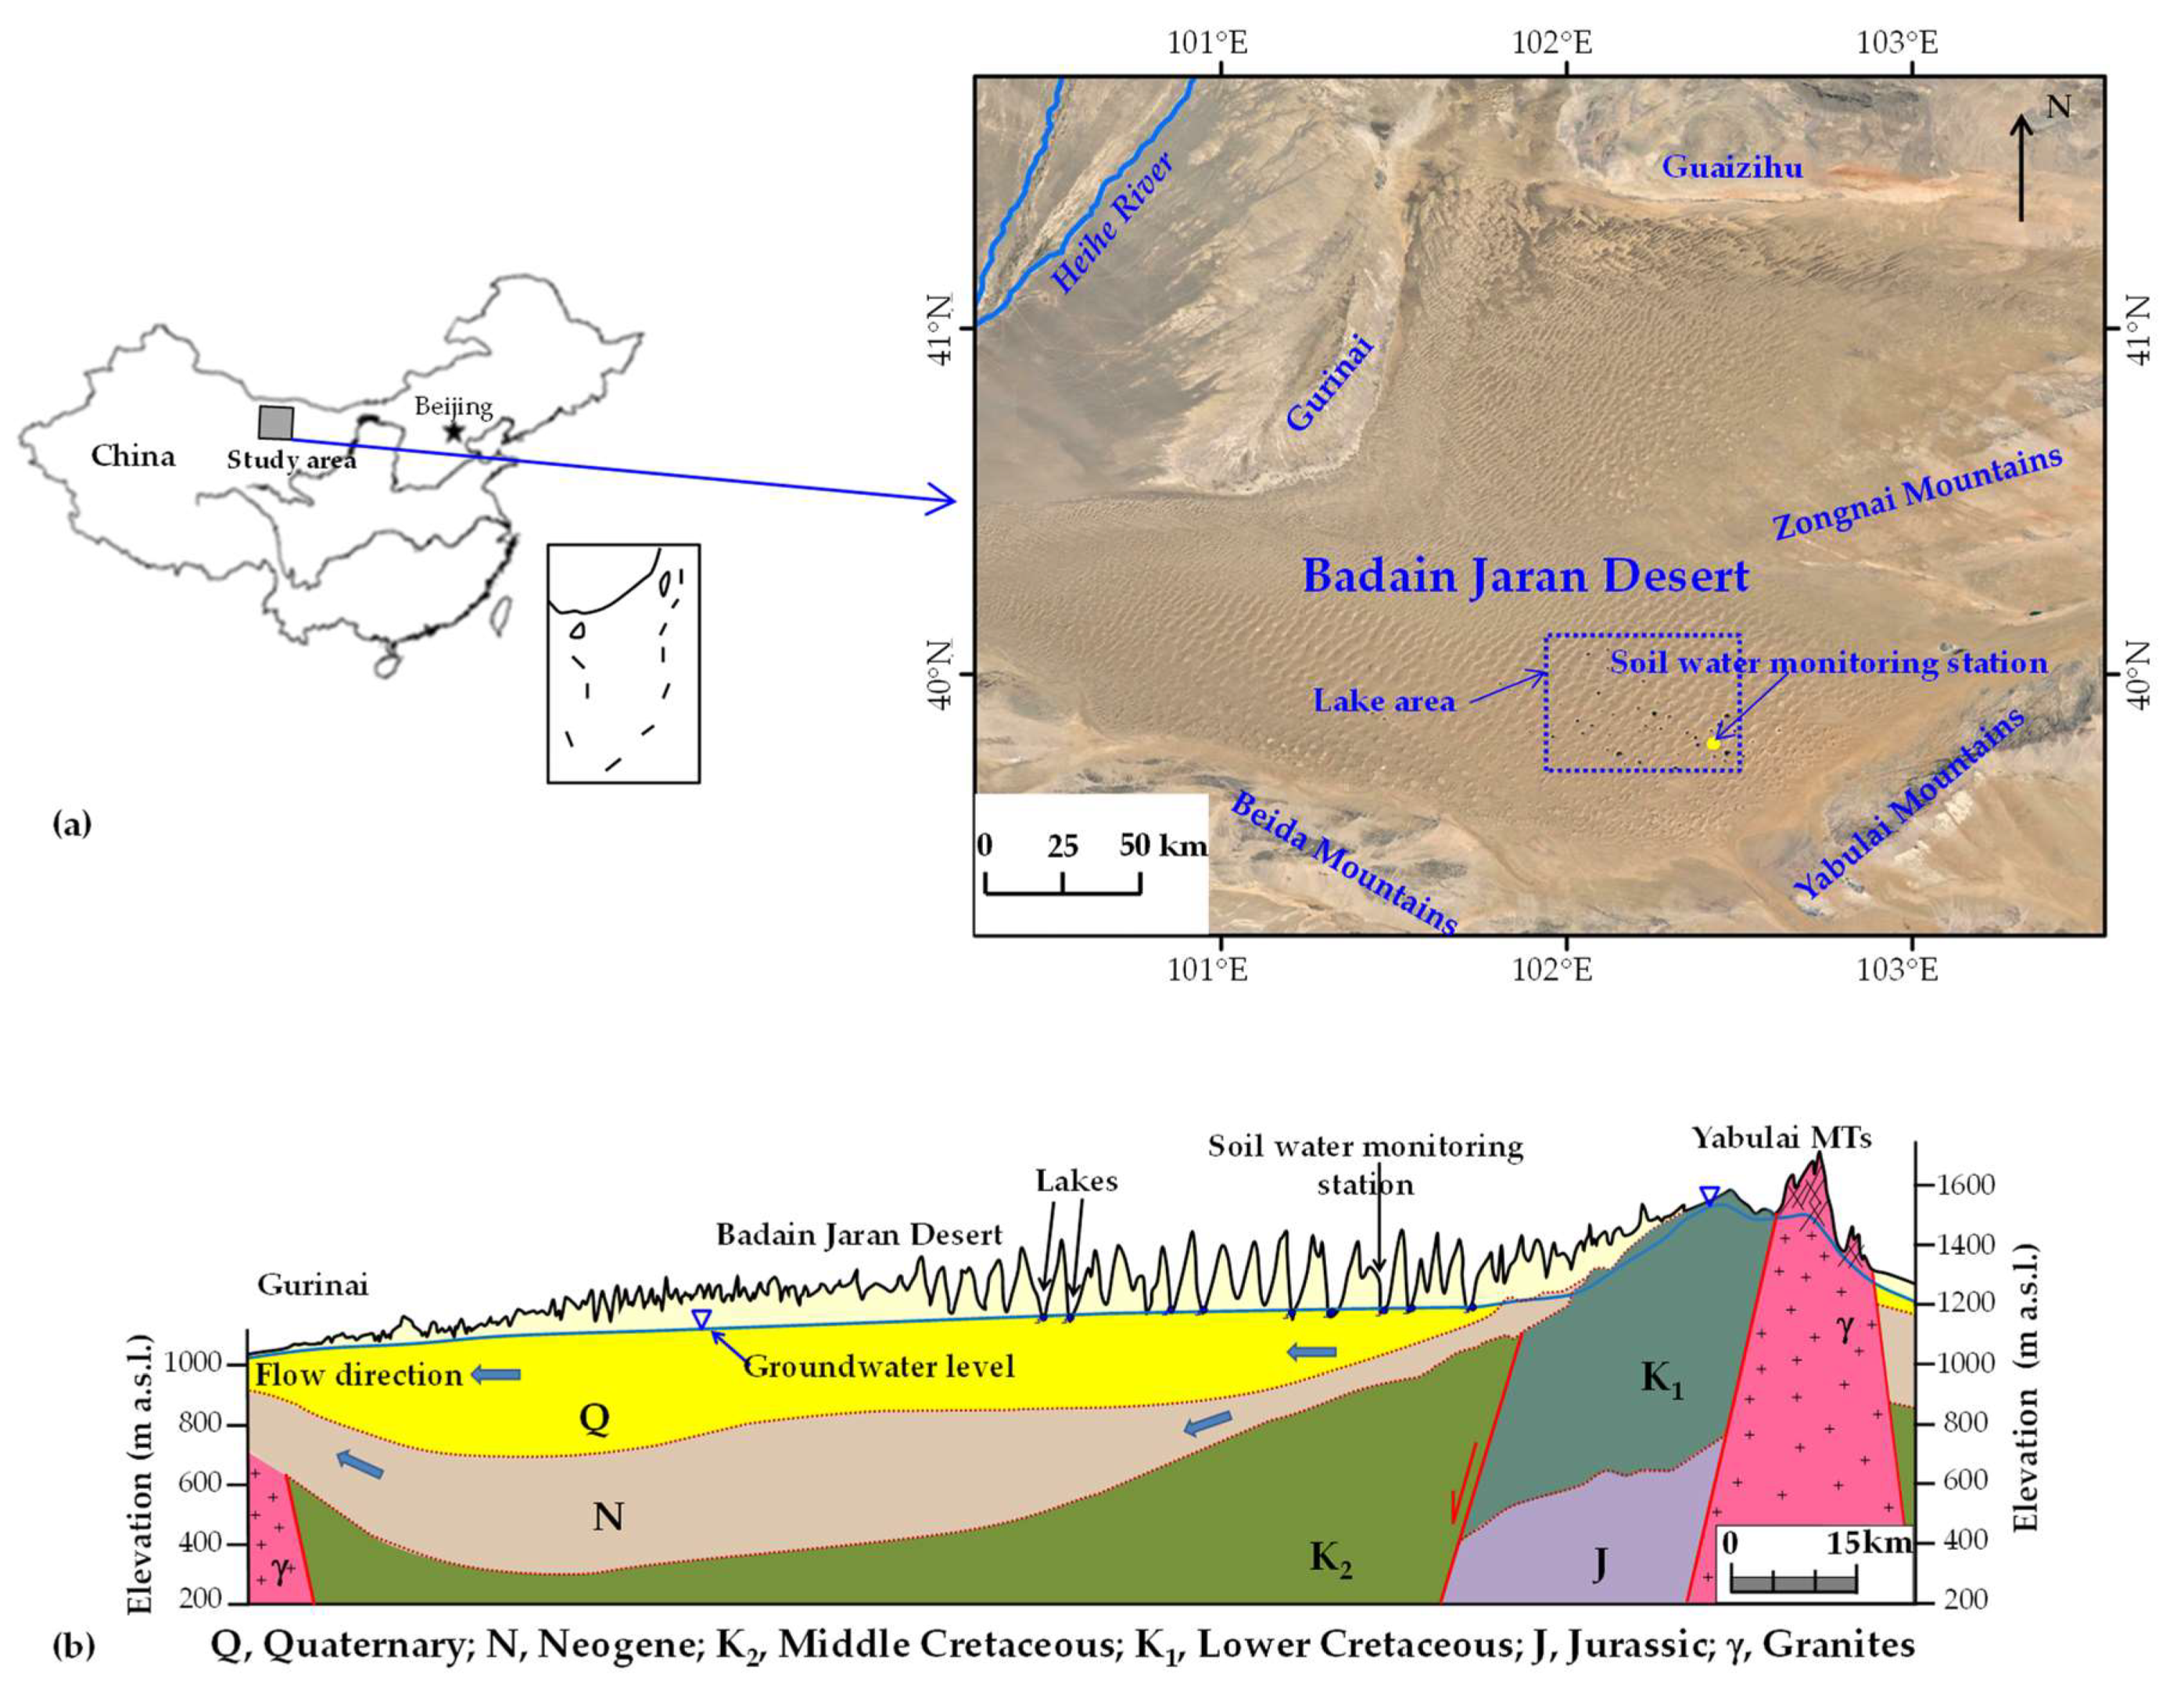
The BJD is located in the Alxa Plateau in the western Inner Mongolia, China (Figure 1a), between longitudes 99°48′ E and 104°14′ E, and between latitudes 39°30′ N and 41°38′ N, covering an area of about 50,000 km2 [22]. The desert is bounded by several mountains on the southern (Beida Mountains) and eastern (Yabulai Mountains, Zongnai Mountains) sides. To the West and North, it extends to the plains of Gurinai and Guaizihu. The Gurinai plain belongs to the Heihe River Basin, where the second largest inland river in China, the Heihe River, transports water from the Qilian Mountains to the Ejina basin, which lies on the Northwest of the BJD. The desert has been well-known for having the world’s highest sand dunes, which can be up to 480 m high [23], and more than 100 lakes of different sizes and salinity are distributed among the megadunes. These dunes and lakes form a unique landscape of the Alxa Desert Geological Park. The BJD is a typical arid zone characterized by low precipitation and high potential evaporation. The annual precipitation generally ranged between 50 and 100 mm from 1957–2000. The mean annual potential evaporation observed by the 20-cm-diameter evaporation pan was higher than 3000 mm from 1957–2000 [24], which indicates an extremely arid climate in the desert.
For the hydrogeological conditions, the BJD is a part of the Yingen-Ejina basin [25,26], bounded by mountains of magmatic rocks, in which the thick sedimentary formations function as the aquifer system for groundwater flow, partly shown in Figure 1b. The Cretaceous sandstones are a porous-fractured aquifer, with a thickness that normally ranges between 1000 and 3000 m, up to 4000 m [24,27]. The overlying Neogene sandstones are semi-consolidated and function as a confined porous aquifer, of which the thickness is generally less than 400 m. On the top are the Quaternary sediments, with fine to coarse sands, which function as an unconfined aquifer. The thickness of the saturated zone in the Quaternary system is generally larger than 100 m. Groundwater level could be higher than 1200 m near the mountains and less than 1000 m at the places of Gurinai and Guaizihu. This difference in groundwater level triggers a regional groundwater flow from the South and East to the North and West. Groundwater-fed lakes in the BJD are connected with the unconfined Quaternary aquifer and have attracted a lot of research interest. However, the hydraulic properties of the aquifer are poorly known because of limited hydrogeological surveys.
2.2. Observation Methods
The data used in this study were obtained from a soil water monitoring station that was set up by China University of Geosciences (Beijing) in the southeast of the BJD in 2012. It was located on a sand dune to the north of Sumujaran South lake, with the longitude and latitude coordinates: 39°47′44.30″ N and 102°25′19.93″ E. The ground surface was relatively flat at the site and the altitude was 1192 m a.s.l., which was 13 m higher than the water level in the nearby lake. Instruments for the soil water monitoring experiments are shown in Figure 2. At the site, the soil water contents at the depths of 0.2 m, 0.5 m, and 1.0 m (denoted as MS1, MS2, and MS3, respectively, in Figure 2) were measured using two-needle capacitance probes (AVALON, Dallas, TX, USA), at the accuracy level of ±1%. In addition, the temperature and soil water matrix suction were monitored using pF-meters (GeoPrecision GmbH, Ettlingen, Germany) installed at the depths of 0.2 m, 0.5 m, 1.0 m, 1.5 m, 2.0 m, and 3.0 m (denoted as P1–P6 in Figure 2), at the accuracy level of ±0.05 °C for temperature and ±1 cm for suction. The distance between the sites of the capacitance probe and the pF-meter probe was less than 2 m. Since the aeolian sand on the dune was relatively uniform, the monitoring data at the two sites could be regarded as obtained at the same place. The instruments were powered by a solar panel.
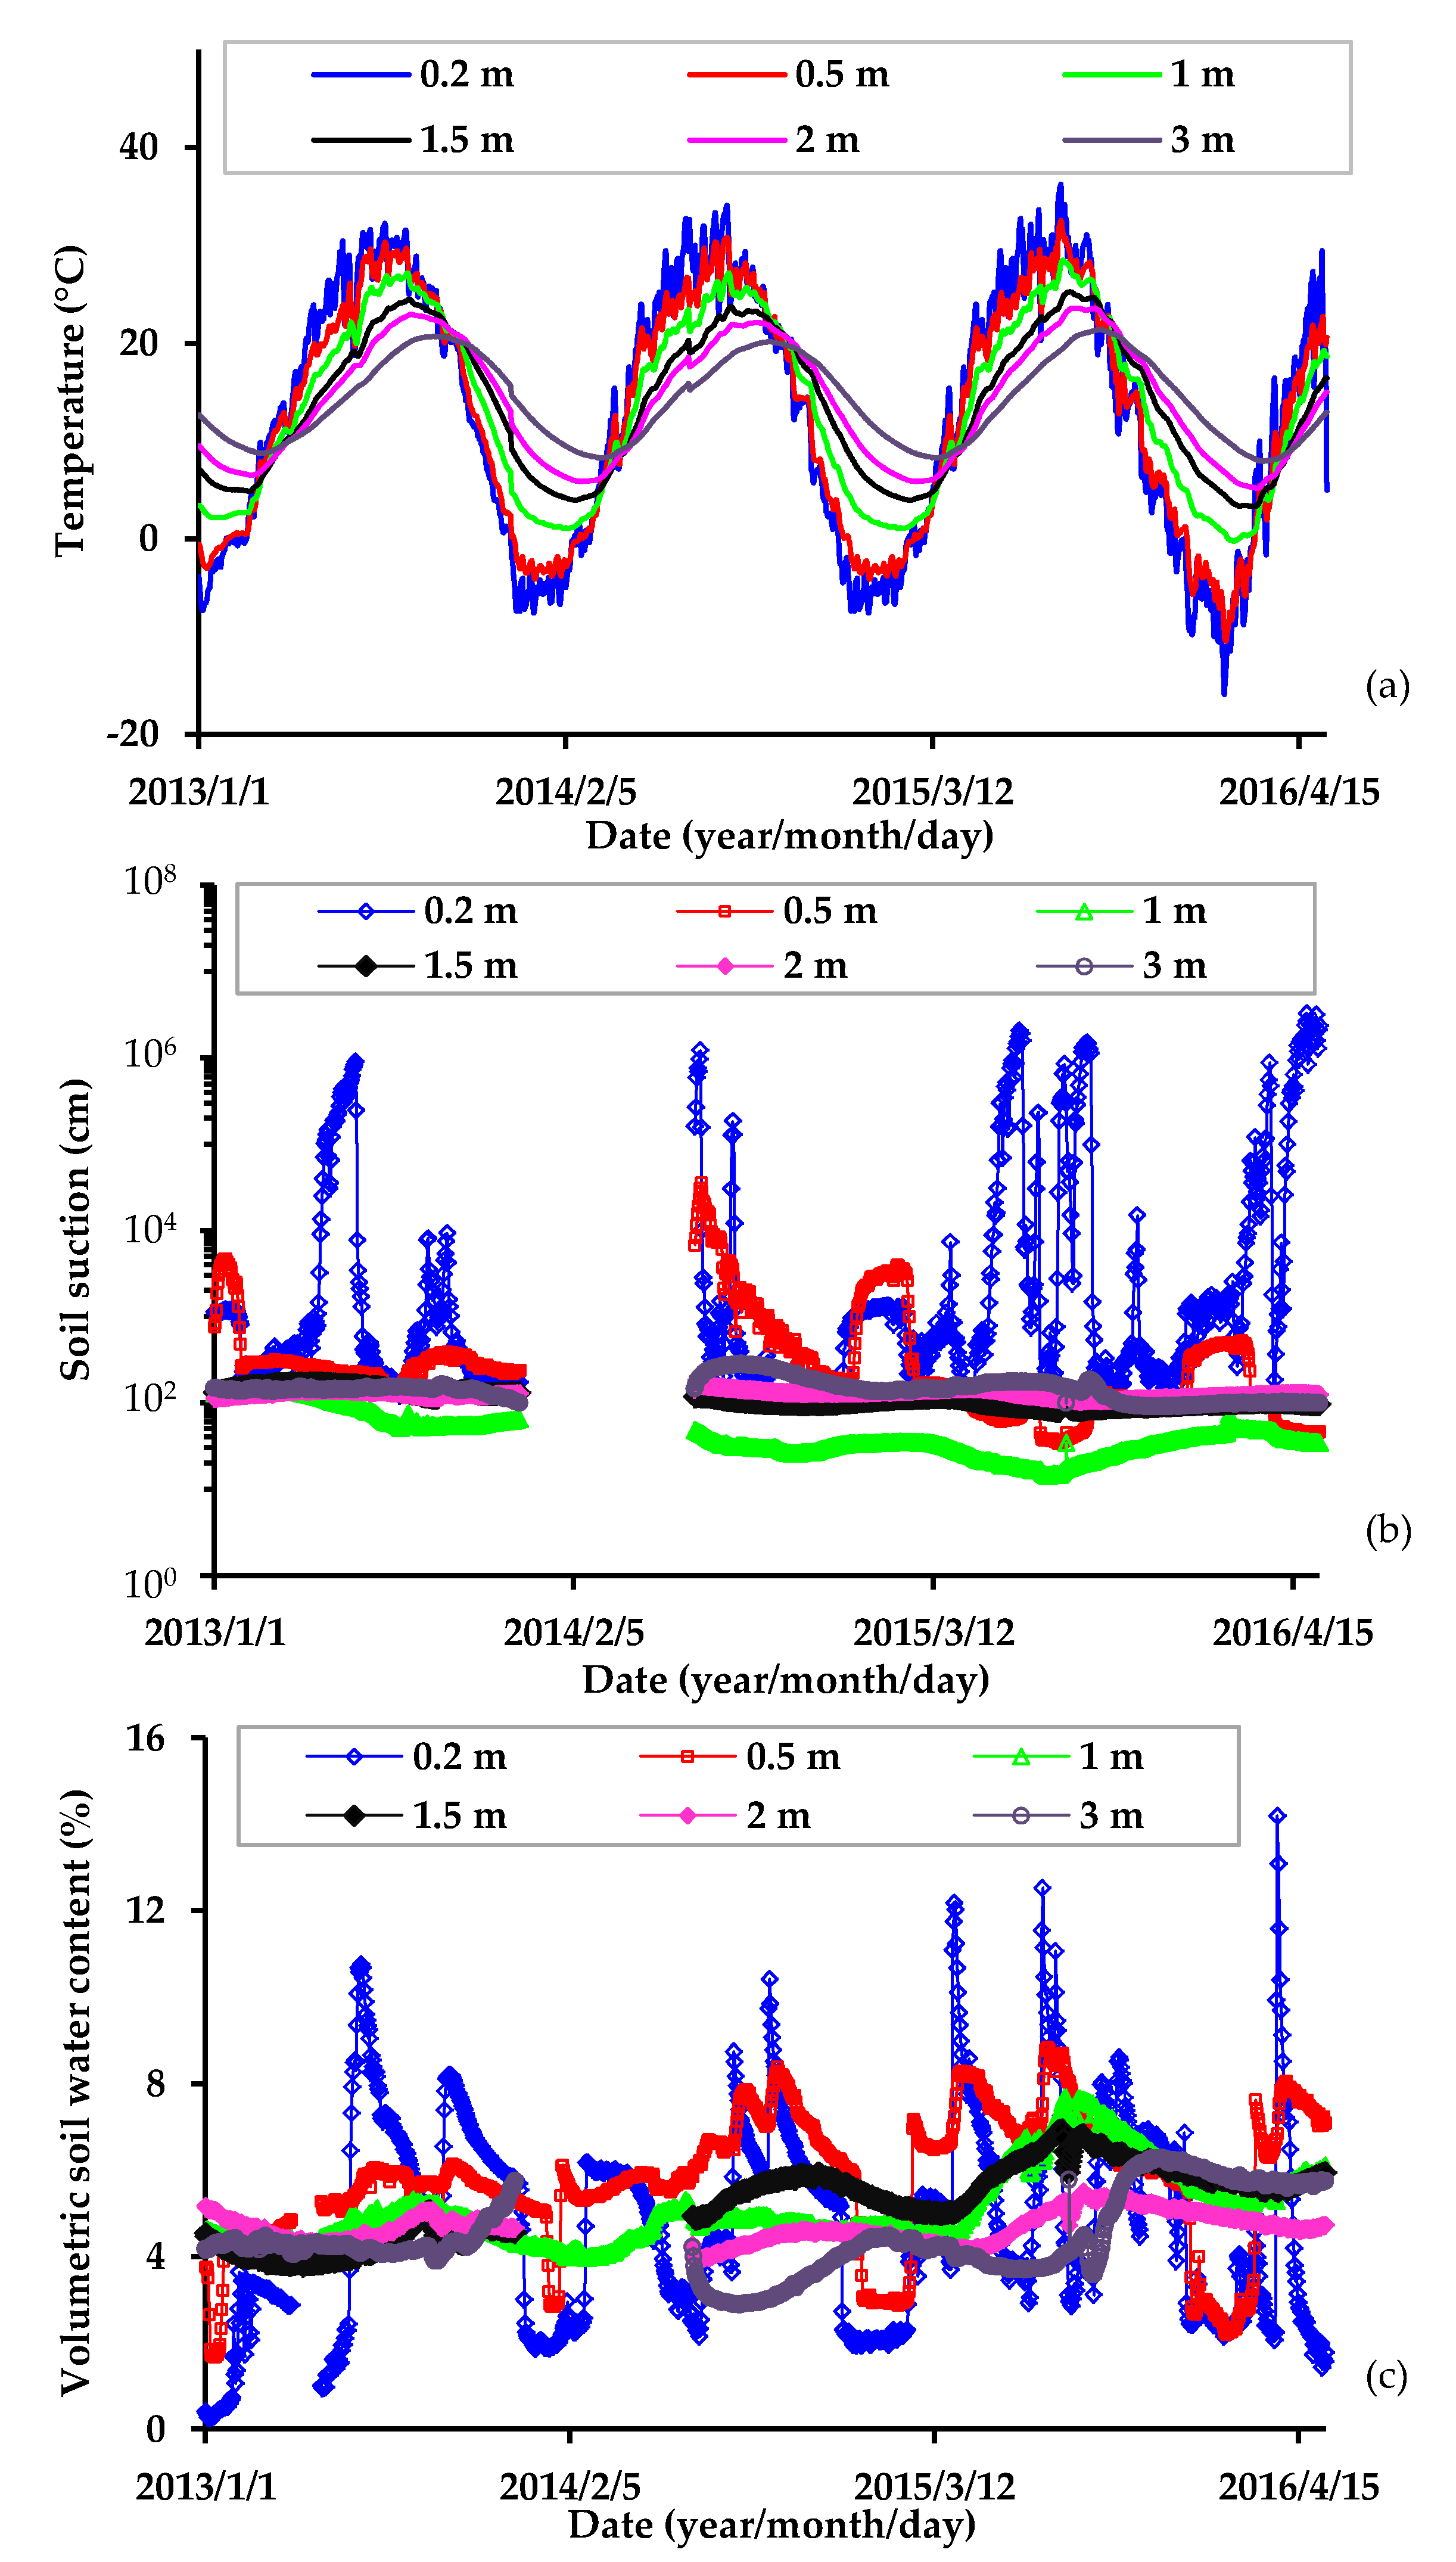
A data logger was set up at the monitoring station to store all data that was extracted at the frequency of 30 min. To capture the seasonal variations of soil water, at least one year of data has to be collected. In this study, observation data in the period of 2013–2016 were selected, and their daily averages were calculated to analyze the seasonal variations. The variations in the soil temperature and suction during this period are shown in Figure 3a,b, respectively. However, it should be noted that some of the suction data were lost during the winter of 2014 due to instrument failure.
3. Observed Soil Water Variation in the Shallow Zone
The soil monitoring data used in this study were within the depth of 3 m, which was relatively shallow in comparison with the general thickness of the desert unsaturated zone, hence the observed soil water variation only represents the characteristics of the shallow vadose zone in the BJD. This section is focused on the depth-dependent features of the seasonal soil water variation within 3 m, and the characteristics for deeper depths are analyzed in Section 4.
3.1. Data Processing
In the soil water monitoring station, the maximum depth of installed capacitance probes was 1 m, so that only the soil water content variation within 1 m could be observed directly. In order to obtain the water content at the depth of 1–3 m, converting the soil suction observed by pF-meter into the water content was needed. The transformation was performed by using the van Genuchten model [28], which is known as V-G formula for short, and can be written as follows:
where θr and θs denote the residual and saturated volumetric water contents (m3/m3), respectively; h is the soil water pressure head represented by the negative value of soil suction (m) for unsaturated conditions; α is a parameter related to the air entry pressure (m−1); n is a non-dimensional parameter and n >1; and m is equal to (1−1/n).
To obtain the appropriate parameters of the V-G model (θr, θs, α, n), the synchronous soil water content and suction data, measured at 0.2 m, 0.5 m, and 1.0 m, were used to adjust the parameters until the moisture content converted from the suction data best matched the measured moisture content. The results of the parameter optimization were: θr = 0.02, θs = 0.39, α = 5.2 m−1, n = 2.8. The soil moisture data at different depths are shown in Figure 3c.
To assess the seasonal variation of soil water, some quantitative indices were extracted from the daily data, including the annual maximum value, the annual minimum value, the annual mean value, and the times when the maximum and minimum values appear. The fluctuation amplitude of the seasonal variation was defined as:
where W denotes a physical variable with respect to the soil water (temperature, water content, suction, etc.); Wmax and Wmin are the annual maximum and minimum values, respectively; and Aw is the fluctuation amplitude. The absent suction data in the winter of 2014 had to be speculated in order to determine some of the indices in that year. The soil suction would increase significantly due to the frozen effect when the temperature was less than 0 °C. During the years studied, the variation of temperature in the winter of 2013 was mostly close to that in the winter of 2014. Therefore, we used the suction data in the winter of 2013 as an approximate replica for that in 2014.
3.2. Characteristics of the Seasonal Variations
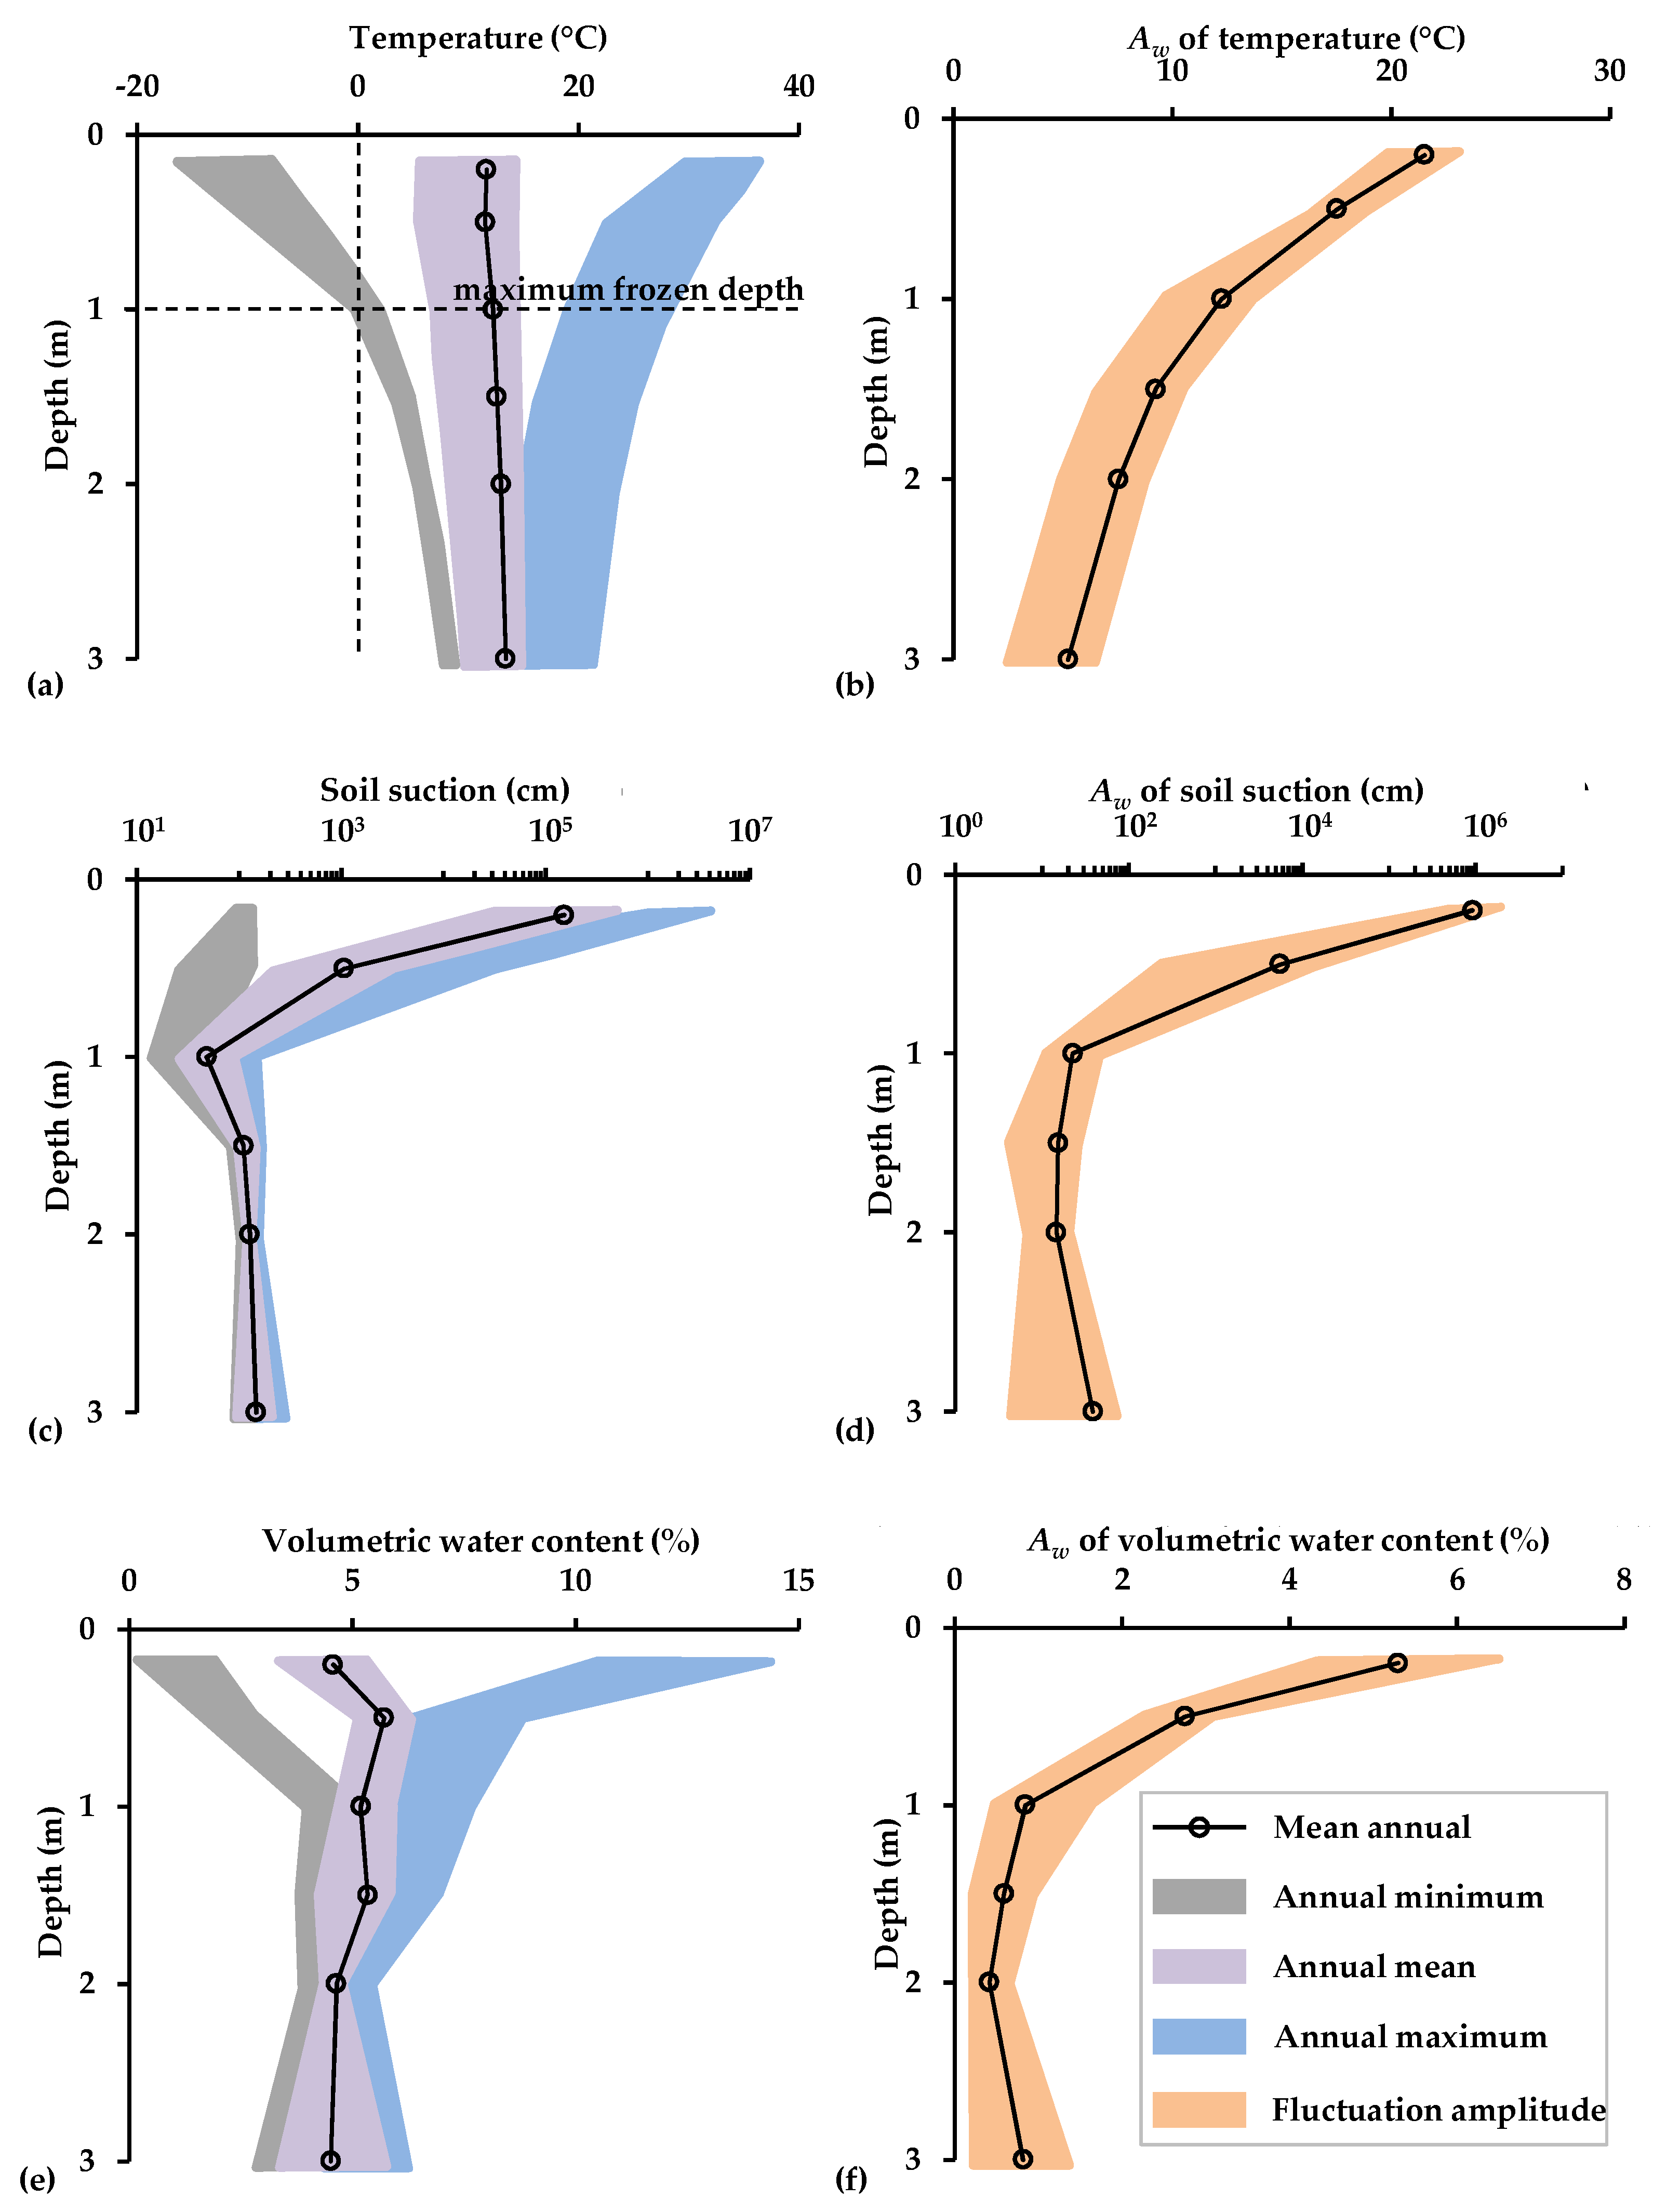
It is shown in Figure 3a that the soil temperature changed in a large range. At the depth of 0.2 m, the temperature varied from −20 to 40 °C, the extreme low value occurred in December and the maximum occurred in July, indicating a significant seasonal fluctuation on land surface. At deeper positions, the seasonal fluctuation of temperature became weaker, and the occurrence times of the maximum and minimum temperatures were delayed. The time lag at the depth of 1.5 m was about one month, whereas it was larger than two months at the depth of 3 m. The changes in the extreme values, mean value, and fluctuation amplitude of temperature with depth are shown in Figure 4a,b. It can be seen that the minimum temperature increased, whereas the maximum value decreased with depth. The annual mean temperature at different depths varied between 5.4 and 14.8 °C. The mean annual temperature was close to 12.4 °C, and showed a slight increasing trend with depth, which may be caused by the slight decrease of atmospheric temperature in the 2013–2016 period. Below the depth of 1 m, the temperature was always higher than 0 °C, indicating the frozen depth at the site was limited and the maximum frozen depth was 1 m. The fluctuation amplitude of temperature significantly decreased with depth, from a value more than 20 °C near the land surface to a value less than 7 °C at the depth of 3 m.
Figure 3b shows that the soil suction also changed dramatically. The suction at depth of 0.2 m ranged between 102 and 106 cm, indicating a normally dry condition. In fact, the suction at the depth of 0.2 m could be reduced to a value below 10 cm in the summer by rains, but such low suction only persisted for a few hours. After a rain, the suction increased rapidly by strong evaporation, so that the daily average suction was still above 100 cm. Soil suction was also significantly altered by changes in temperature around 0 °C due to the soil water freeze–thaw effect. Consequently, the maximum soil suction occurred either in summer (by intense evaporation) or in winter (by freeze). In Figure 4c,d, the depth-dependent variations of extreme values, mean value, and fluctuation amplitude of soil suction are shown. The seasonal variation of soil suction showed a significant decay trend with depth when within the depth of 1 m; however, almost showed a depth-independent pattern in the zone deeper than 1 m. This seemed to imply that, below the depth of 1 m, the soil water movement was not dominated by the soil suction gradient, but rather driven by gravity. An unexpected increase in Aw was exhibited when the depth increased from 2 to 3 m, which may have been caused by the soil heterogeneity in this zone. At the depth of 3 m, the mean annual fluctuation amplitude of soil suction was close to 39 cm, and the maximum value was a bit higher than 50 cm, indicating that a 3 m depth was not the extinction depth of seasonal soil water variations. However, the difference of Aw between depths of 2 and 3 m was not significant, and did not change the general decay trend of Aw with depth.
The volumetric soil water content varied in a relatively small range (2–15%), as shown in Figure 3c. The water content at the depth of 0.2 m was significantly influenced by rains and evaporation on land surface, such that a dramatic fluctuation was seen. With the increasing depth, the fluctuation of water content decayed gradually, or even disappeared. The moisture content at depths between 1–2 m slowly declined in autumn and winter; however, slowly increased in spring and summer. Figure 4e,f show the depth-dependent variation of water content and its fluctuation amplitude, respectively. The annual mean value changed slightly with depth, but in an irregular pattern, varying in the range between 4% and 6%. Within a depth of 1 m, with the increase of depth, the maximum and minimum values of water content quickly converged to the mean value. Accordingly, the fluctuation amplitude of volumetric water content decreased from a value close to 6%, near the land surface, to about a value that was less than 1% (below the accuracy of capacitance measurement), at the depth of 1 m. In the zone deeper than 1 m, it seemed that the seasonal fluctuation of water content did not significantly depend on depth. In addition, the increase in Aw value at depths from 2 to 3 m seemed to be caused by the soil heterogeneity; however, the effect was not significant.
The above results showed that there were similar depth-dependent features between temperature and soil water content, for instance, both the fluctuations of temperature and soil water content decayed sharply with depth in the upper 1-m-thickness layer. This seemed to indicate that temperature was a control of the seasonal variation of soil water in the near surface zone. To understand the relationship between them, the correlation analysis was carried out. It is clearly shown in Figure 5 that both Aw of the logarithmic soil suction and Aw of the volumetric water content were positively correlated with the Aw of temperature. The linear correlation coefficients (R2) were 0.540 and 0.831, respectively, for the temperature–suction relationship and the temperature–water content relationship, as represented by the red lines in Figure 5. However, the data points for that observed below the 1 m depth seemed to be poorly correlated with the temperature because they were not significantly influenced by the seasonal freezing–thawing process. Therefore, it was better to do the correlation analysis only on the data points within the maximum frozen depth zone, as represented by the blue lines in Figure 5. In this shallow zone, the Aw of the logarithmic soil suction, shown in Figure 5a, had the highest positive correlation with the Aw of temperature (R2 = 0.997), whereas the positive correlation was also high (R2 = 0.974), shown in Figure 5b, for the Aw of the volumetric water content versus temperature.
4. Computing Soil Water Variation in the Deep Vadose Zone
In Section 3 the attenuation of soil water fluctuations with depth in the shallow zone was identified according to the observation data of soil water and temperature. However, for soil water in the deep vadose zone the observation data were not available so that the seasonal variation had to be identified with indirect approaches. In this section, we used both an analytical formula and a numerical model to solve this problem, considering the depth of 3 m as a known boundary of the unsaturated flow in the deep vadose zone.
4.1. Existing Analytical Formula
Generally, the one-dimensional vertical flow of soil water can be described by the Richards equation [29] as follows:
where z is the relative depth (m); t is the time (d); K(h) is the hydraulic conductivity (m/d), which varies with the pressure head; and C is the soil moisture capacity (m−1) that is estimated as C(h) = ∂θ/∂h. The variation of θ with h is expressed as the soil–water retention curve. Source and sink terms, due to factors like root water uptake, were not included in Equation (3) because plants in the sand dunes were sparse and the deep soil zone was not significantly influenced by roots.
An approximate analytical solution of Equation (3) was proposed by Bakker and Nieber [2], who did not use the V-G formulas but rather used the Gardner-Kozeny model (G-K formulas for short) to represent the soil–water retention curve and K(h) function. The G-K formulas can be written as follows:
where Ks is the saturated hydraulic conductivity (m/d); he is the pressure head at air entry point (m); β (m−1) is a parameter dependent on the pore size distribution; and μ (m−1) is a fitting parameter. In their mathematical model, the top boundary condition is characterized by a sinusoidal time-dependent infiltration flux (positive downward), q, which is expressed as:
where qs (m/d) is the average infiltration flux; Aq (m/d) is the fluctuation amplitude of the periodic infiltration flux at the top; and ω (d−1) is the angular frequency. At the infinite depth, the flow is uniform and expressed as q(z → ∞, t) = qs.
According to the analytical solution derived by Bakker and Nieber ([2], the variation of the infiltration flux with depth and time can be expressed by a formula as follow:
where λ is the characteristic length of the amplitude attenuation, k is a coefficient of the phase shift, and both of them depend on the parameters in Equations (4) and (5). The value of λ increases with the increasing ω value, which can be calculated by [3]:
where D is defined as
It can be seen that the characteristic length is related to the average infiltration flux. The periodic solution of h can be also obtained from Equation (6), but does not show a sinusoidal fluctuation.
4.2. Numerical Model Based on Hydrus-1D
There were two limitations in the analytical formula proposed by Bakker and Nieber [2]: (1) The soil-water retention curve was not described with the more widely used V-G formulas; and (2) the top of model was settled as a known flux boundary with a sinusoidal time-dependent infiltration flux, whereas the direct observation of the flux is quite difficult. In practice, it is not easy to use the formula because only the data of soil moisture contents or pressure heads are available. To obtain more realistic results, we established a numerical model of the unsaturated flow in the deep zone with Hydrus-1D [30]. The modeling results were then used in comparison with the above analytical model. Hydrus-1D solves the unsaturated flow with the Richards equation but describes the soil–water retention curve with the V-G formulas, where the relationship between water content and pressure head is shown in Equation (1), while the hydraulic conductivity is expressed as:
where l is a pore connectivity parameter, which has been generally assumed to be 0.5 [28].
In order to avoid the complexity of the precipitation–evaporation and freeze–thaw processes, only the soil water flow below the 3 m depth was simulated, and the actual measurement of the pressure head at the depth of 3 m was taken as the upper boundary condition. The thickness of the vertical one-dimensional model was 100 m. The pressure head gradient of the lower boundary was assumed to be zero. The boundary conditions were then described as follows
where hs and Ah are the mean annual and fluctuation amplitude of the pressure head, respectively. According to the monitored data, which was presented in Section 3, we specified the control parameters as: hs = −1.38 m, Ah = 0.39 m, and ω = 2π/365 d−1. The model needed to be preheated, for which the mean annual value of the pressure head was taken as the initial condition, and the repeated simulations of many periodic processes were carried out until the simulation results were completely in a state of periodic repetition and not affected by the initial condition. The preheating period should be at least 20 years according to the test results.
In the Hydrus-1D model, the variable time-step iterative method was used to match the convergence, with the minimum of 0.00001 d and the maximum of 5 d. The convergence accuracy of moisture content in the model was 0.1%. The effective interval of the element nodes were optimized to balance the accuracy of the results and the computation cost, which was finally specified as 0.1 m. The parameters of the soil–water retention curve have been given in Section 3.1, but the saturated permeability coefficient Ks has not been determined yet. The Ks of aeolian sands obtained from previous infiltration tests undertaken in the BJD were 0.5–75.0 m/d [31]. One test zone with an area of 25 m2 near the soil water monitoring station yielded Ks values in the range of 6.6–46.0 m/d with a Gaussian distribution [31]. In this study, the average infiltration effect at the site was focused on, so that the arithmetic average Ks value, 25 m/d, was used in the Hydrus-1D model.
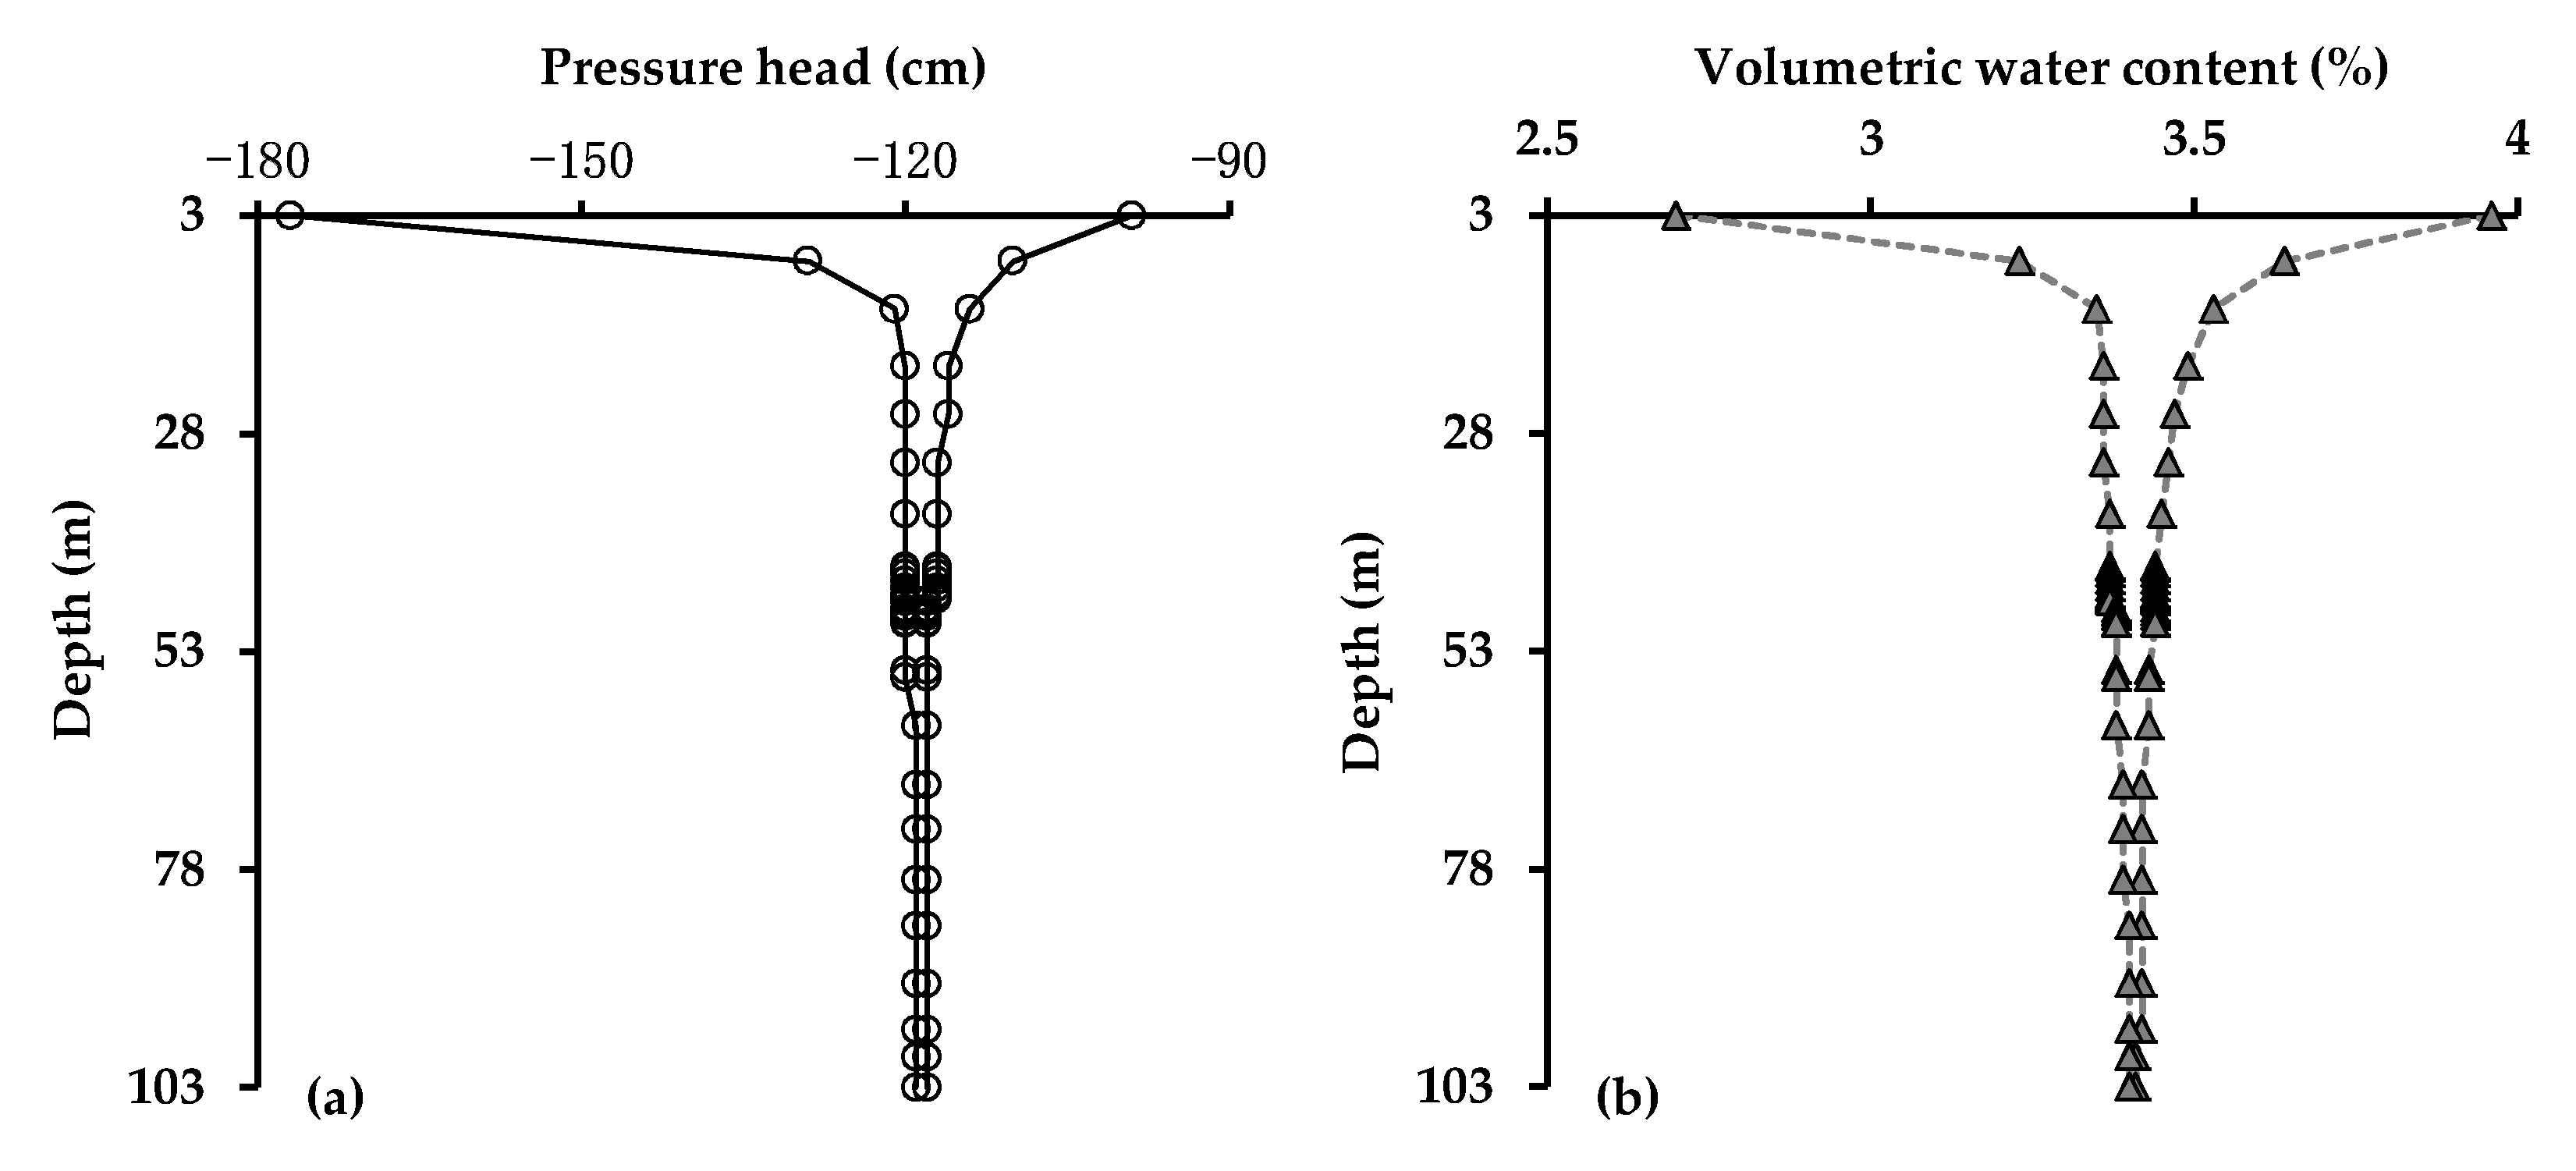
The seasonal variations of the soil water at the deep zone are exhibited in Figure 6, according to the modeling results. With increasing depth, both the maximum and minimum pressure head values changed and finally converged to a steady value of about −119 cm, as shown in Figure 6a, which was close to the hs value. Since the measurement accuracy of soil suction by pF-meter was ±1 cm, we took the maximum ignorable change in pressure head to be 1 cm in order to define the penetration depth of seasonal variation in this study. The penetration depth is the depth at which the fluctuation amplitude of pressure head damps to 1 cm. As indicated in Figure 6a, it was 47.1 m for the seasonal soil water variation simulated in the model. Correspondingly, the maximum and minimum volumetric water contents moved to the value of 3.4% with increasing depth, as shown in Figure 6b. The fluctuation amplitude of the water content was less than 0.1% in the zone below the penetration depth.
4.3. Depth-Dependent Flux in the Deep Zone
The vertical soil water flux in the deep zone could be estimated with the analytical model developed by Bakker and Nieber [2] or the numerical model presented in Section 4.2. The upper boundary condition was specified in different ways: A sinusoidal time-dependent infiltration flux was assumed in the analytical model, whereas a sinusoidal time-dependent pressure head was used in the Hydrus-1D model. In order to compare the results of these two models, we applied the following formula to calculate the flux for the numerical model:
where z is also the depth related to the top of the model.
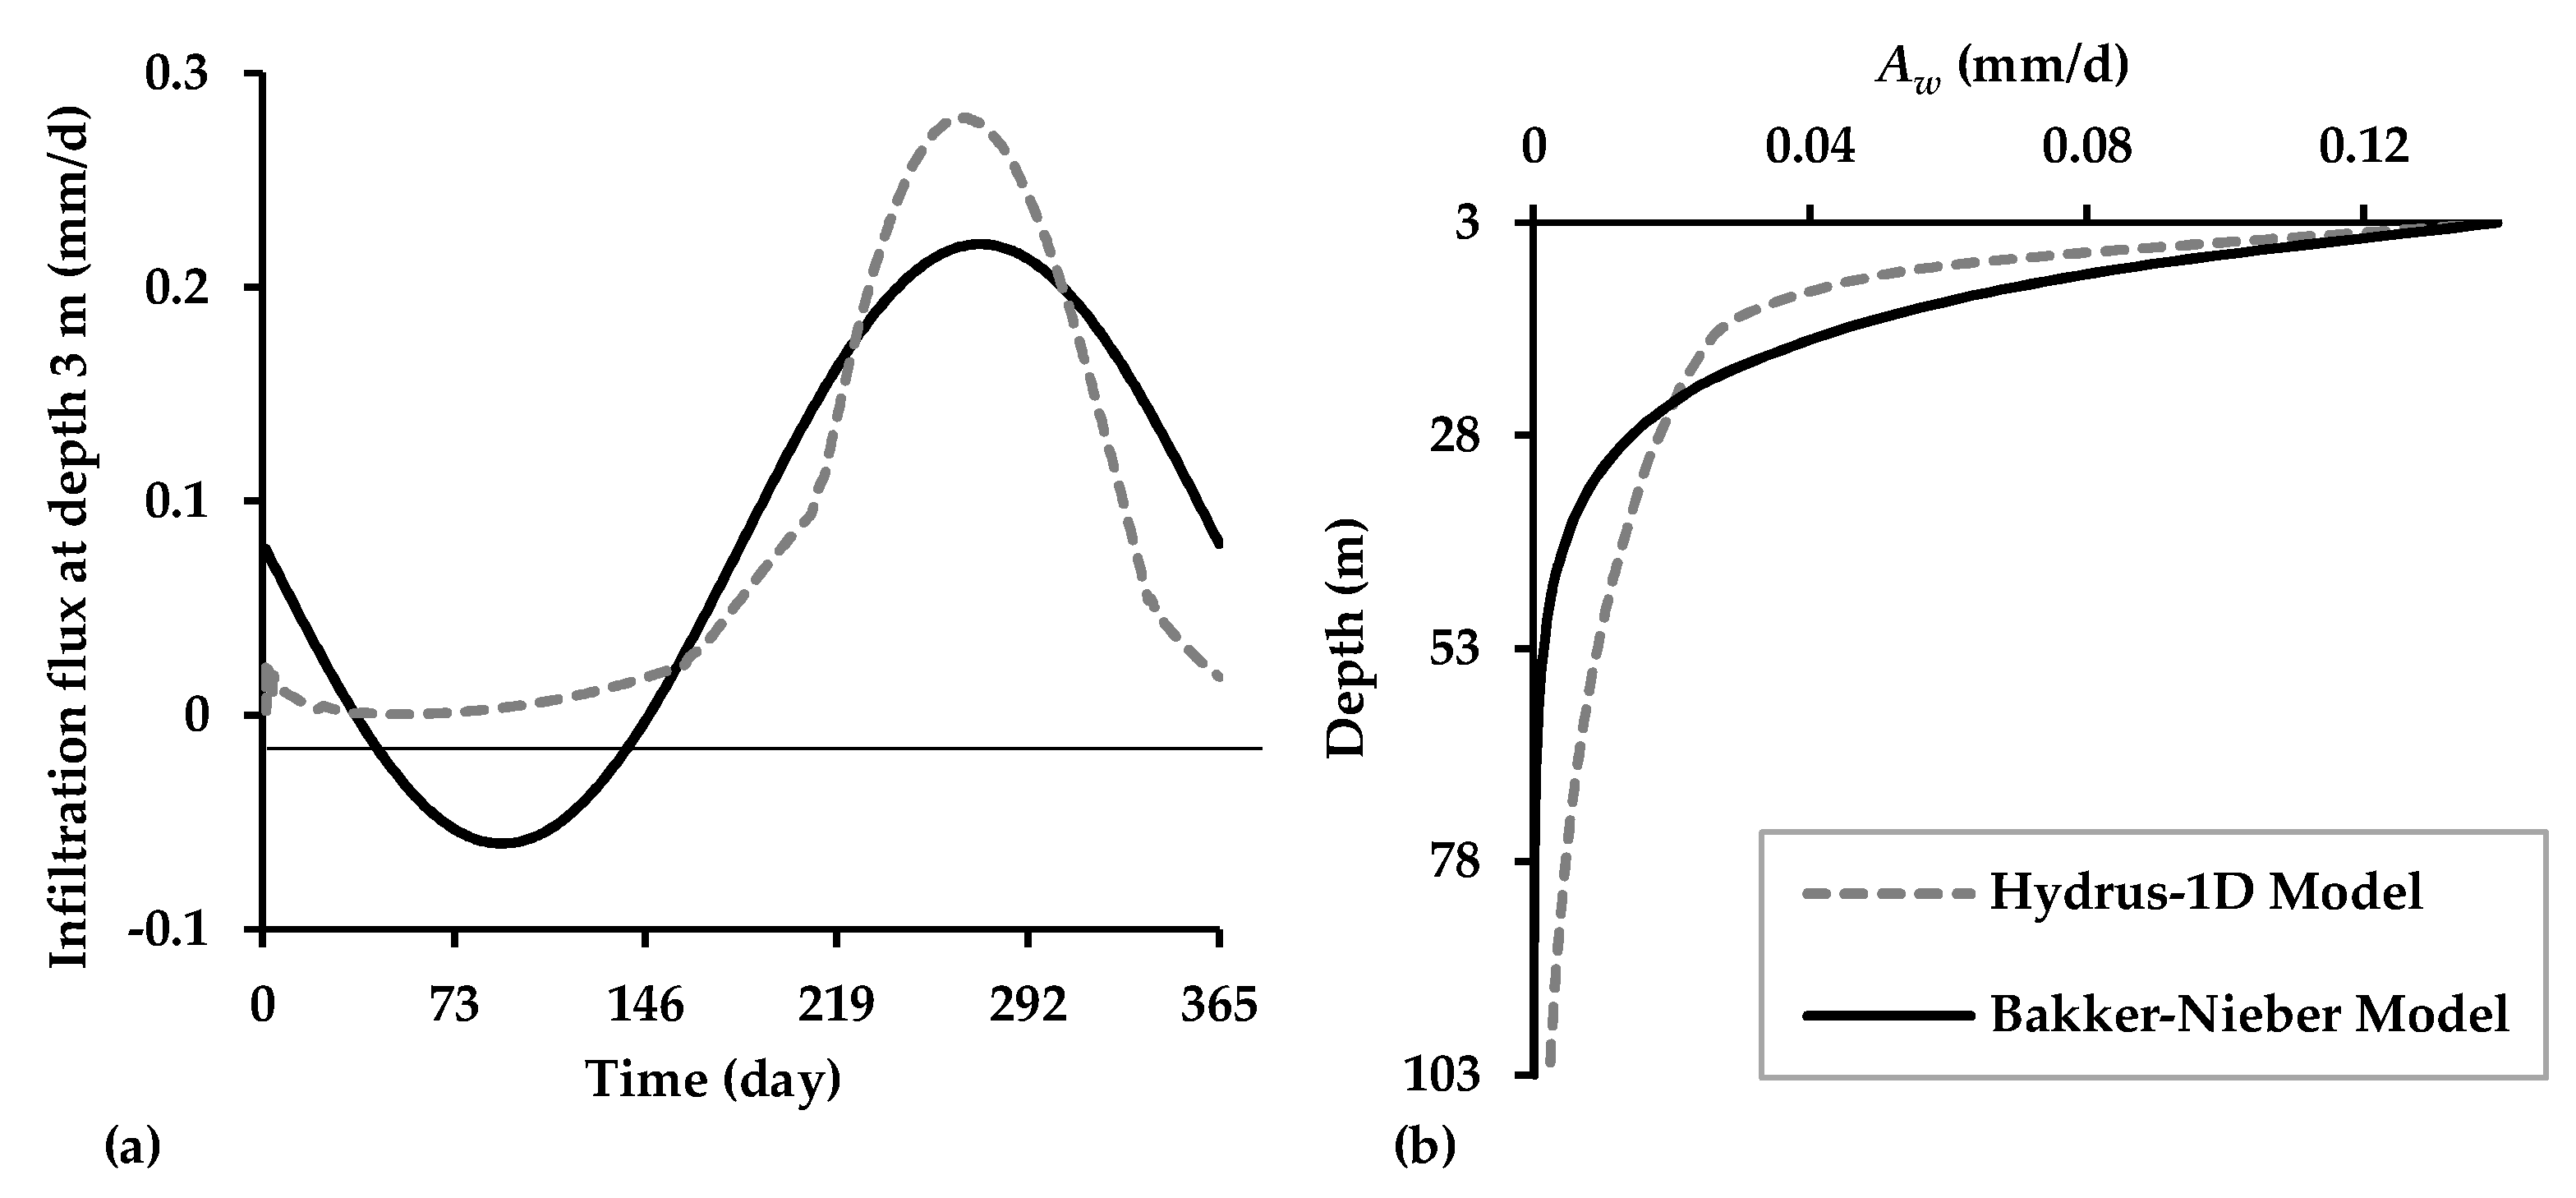
According to the modeling results of Hydrus-1D, the infiltration fluxes at different depths were obtained with Equation (12), including the infiltration flux at the top (where the real depth was 3 m), as represented by the dashed line in Figure 7a. Obviously, variation of the infiltration flux with time did not follow a sine function. The maximum q, which was 0.28 mm/d, occurred on the 264th day of the year cycle. The average q was 0.08 mm/d and the fluctuation amplitude of q was 0.14 mm/d. No negative q value existed, indicating the permanent downward flow of soil water was at the depth of 3 m below ground surface. The annual infiltration was 30.7 mm, which was estimated from the average q value.
If the Bakker-Nieber model is used, the q value at the top has to be determined as described in Equation (5). For comparison, we specified the average value and fluctuation amplitude for the analytical model as the same of the numerical modeling results (i.e., qs = 0.08 mm/d and Aq = 0.14 mm/d). Therefore, the sinusoidal time-dependent variation of q for the analytical model was obtained, as represented by the solid line in Figure 7a. Note that there existed a short term of negative q values (upward soil water flow). In this situation, the depth-dependent of infiltration flux could be estimated with Equation (6) after determining the parameters of the G-K formulas. By fitting the soil–water retention curve with respect to the V-G formulas, the optimum matching parameters of the G-K formulas were obtained, that were: he = 0, μ = 2.2 m−1, and β = 9.0 m−1. The other parameters were the same as those used in the Hydrus-1D model. By substituting the parameters into Equations (7) and (8), the characteristic length was estimated as λ = 10.9 m. Subsequently, the change in the fluctuation amplitude of the infiltration flux with depth, following Equation (6), could be determined as Aqexp(−z/λ).
Two Aw-depth curves are shown in Figure 7b, which were obtained from the analytical and numerical model. Overall, the two curves showed similar attenuation characteristics. The analytical model yielded an extremely small value of the fluctuation amplitude for the zone below 50 m, which was close to zero and significantly smaller than that in the numerical model. At the penetration depth, 47.1 m, of the seasonal variation that was determined from Section 4.2, the fluctuation amplitude of the infiltration flux in the numerical model was damped to 7.8% of Aq, which was only 0.01 m/d. Accordingly, below the depth of 47.1 m the infiltration flux was basically steady at the level of 30.7 ± 4 mm/yr. In the southern BJD, the depth from the sand dunes to water table was generally larger than 50 m. Figure 7a indicates that the infiltration recharge in the BJD did not show significant seasonal variation, even the near-surface soil water dramatically changed.
5. Conclusion Remarks
In the BJD, the groundwater recharge from precipitation infiltration is highly dependent on the hydrodynamic processes in the vadose zone, which can be investigated by analyzing the seasonal variation of soil water. Monitoring data of soil water and temperature at depths of 0–3 m in the BJD are presented and analyzed in this study. The seasonal fluctuations of soil temperature and moisture in the shallow zone were significant. With the increase in depth, the fluctuation amplitudes of the temperature, soil suction, and moisture content showed an obvious decreasing trend. Under the depth of 3 m, the seasonal fluctuation of soil water could still propagate downward, but would attenuate to an ignorable level after reaching a certain depth.
By using the monitoring results at the depth of 3 m, as the boundary condition, the seasonal variation of soil water in the deep zone was evaluated with a numerical model of Hydrus-1D and the analytical model developed by Bakker and Nieber [2]. Taking 1 cm as the maximum ignorable value of change in the soil water pressure head, the penetration depth of the seasonal fluctuation was about 47 m. Below this depth, the infiltration flux was almost steady at 0.08 mm/d, with a small fluctuation amplitude that was less than 0.01 mm/d. This indicated an infiltration recharge of groundwater at the level of 30.7 ± 4 mm/yr if the depth to the water table was larger than 47 m. The thickness of the vadose zone in the BJD is generally larger than 50 m; thus, the groundwater recharge from precipitation infiltration in the desert almost has no seasonal change even though the near-surface soil water dramatically changes.
Due to the limitations in the observations and modeling methods, the estimated recharge from infiltration in this study is just a preliminary result. Uncertainties of the results could be caused by the soil heterogeneity, which should be highlighted in further studies. Phreatophyte effects and the vertical vapor flow are ignored in this study, which could introduce additional uncertainties. Nevertheless, due to the sparsely vegetated land surface on the sand dunes, the phreatophyte effects is potentially insignificant in the general infiltration process. The numerical modeling of soil water and vapor movements undertaken by Hou et al. (2016) [21] resulted in an estimated infiltration rate between 11–30 mm/yr at the depth of 3 m, which was less than the result in our study. This difference may be caused by additional loss of soil moisture from vapor flow. Further investigations are expected to address this problem.
Author Contributions
Y.Z. designed and carried out this research; X.-S.W. supervised and instructed this research; Y.Z. and X.-S.W. wrote this paper; P.-F.H. provided help for the field work; and all authors have approved the manuscript.
Funding
This research was funded by the National Natural Science Foundation of China (Nos. 41772249).
Acknowledgments
The authors are grateful to the editors and four anonymous reviewers for their constructive comments.
Conflicts of Interest
The authors declare no conflicts of interest.
References
- Klute, A.; Heermann, D.F. Soil water profile development under a periodic boundary condition. Soil Sci. 1974, 117, 265–271. [Google Scholar] [CrossRef]
- Bakker, M.; Nieber, J.L. Damping of sinusoidal surface flux fluctuations with soil depth. Vadose Zone J. 2009, 8, 119–126. [Google Scholar] [CrossRef]
- Dickinson, J.E.; Ferré, T.P.A.; Bakker, M.; Crompton, B. A screening tool for delineating subregions of steady recharge within groundwater models. Vadose Zone J. 2014, 13, 859–879. [Google Scholar] [CrossRef]
- Gong, Y.P.; Wang, X.S.; Zhou, Y.X.; Hao, C.B. Groundwater contributions in water-salt balances of the lakes in the Badain Jaran Desert, China. J. Arid Land 2016, 8, 694–706. [Google Scholar] [CrossRef]
- Chen, J.S.; Zhao, X.; Sheng, X.F.; Dong, H.Z.; Rao, W.B.; Su, Z.G. Study on formation mechanism of lake groups and dunes in the Badain Jaran Desert. Chin. Sci. Bull. 2006, 51, 2789–2796. (In Chinese) [Google Scholar] [CrossRef]
- Ding, H.W.; Wang, G.L. Study on the formation mechanism of the lakes in the Badain Jaran Desert. Arid Zone Res. 2007, 24, 1–7, (In Chinese with English abstract). [Google Scholar] [CrossRef]
- Gates, J.B.; Edmunds, W.M.; Ma, J.Z.; Scanlon, B.R. Estimating groundwater recharge in a cold desert environment in northern China using chloride. Hydrogeol. J. 2008, 16, 893–910. [Google Scholar] [CrossRef]
- Wang, X.S.; Zhou, Y.Y. Investigating the mysteries of groundwater in the Badain Jaran Desert, China. Hydrogeol. J. 2018, 26, 1639–1655. [Google Scholar] [CrossRef]
- Ma, J.Z.; Li, D.; Li, X.H.; Edmunds, W.M. Chloride as a tracer and climatic change record from unsaturated zone of Badain Jaran Desert. J. Desert Res. 2004, 24, 674–679, (In Chinese with English abstract). [Google Scholar] [CrossRef]
- Ma, J.Z.; Edmunds, W.M.; He, J.H.; Jia, B. A 2000 year geochemical record of palaeoclimate and hydrology derived from dune sand moisture. Paleogeogr. Palaeoclimatol. Paleoecol. 2009, 276, 38–46. [Google Scholar] [CrossRef]
- Liu, X.Y.; Chen, J.S.; Sun, X.X. Application of chloride tracer method to study replenishment ratio of precipitation in desert. Trans. CSAE 2010, 26, 146–149, (In Chinese with English abstract). [Google Scholar] [CrossRef]
- Ma, J.; Wang, Y.; Zhao, Y.; Jin, X.; Ning, N.; Edmunds, W.M.; Zhou, X. Spatial distribution of chloride and nitrate within an unsaturated dune sand of a cold-arid desert: Implications for paleoenvironmental records. Catena 2012, 96, 68–75. [Google Scholar] [CrossRef]
- Yang, X.P.; Ma, N.; Dong, J.F.; Zhu, B.Q.; Xu, B.; Ma, Z.B.; Liu, J.Q. Recharge to the inter-dune lakes and Holocene climatic changes in the Badain Jaran Desert, western China. Quat. Res. 2010, 73, 10–19. [Google Scholar] [CrossRef]
- Gu, W.J.; Chen, J.S.; Wang, J.Y.; Zhao, X. Challenge from the appearance of vadose water within the surface layer of megadunes, Badain-Jaran dune desert, Inner Mongolia. Adv. Water Sci. 2004, 15, 695–699, (In Chinese with English abstract). [Google Scholar] [CrossRef]
- Zeng, Y.J.; Su, Z.B.; Wan, L.; Yang, Z.L.; Zhang, T.K.; Tian, H.; Shi, X.; Wang, X.S.; Cao, W.B. Diurnal pattern of the drying front in desert and its application for determining the effective infiltration. Hydrol. Earth Syst. Sci. 2009, 13, 703–714. [Google Scholar] [CrossRef] [Green Version]
- Ma, N.; Wang, N.A.; Zhao, L.Q.; Zhang, Z.Y.; Dong, C.Y.; Shen, S.P. Observation of mega-dune evaporation after various rain events in the hinterland of Badain Jaran Desert, China. Sci. Bull. 2014, 59, 162–170. [Google Scholar] [CrossRef]
- Wen, J.; Su, Z.; Zhang, T.; Tian, H.; Zeng, Y.; Liu, R.; Kang, Y.; van der Velde, R. New evidence for the links between the local water cycle and the underground wet sand layer of a mega-dune in the Badain Jaran Desert, China. J. Arid Land 2014, 6, 371–377. [Google Scholar] [CrossRef]
- Dong, C.Y.; Wang, N.A.; Chen, J.S.; Li, Z.L.; Chen, H.B.; Chen, L.; Ma, N. New observational and experimental evidence for the recharge mechanism of the lake group in the Alxa Desert, north-central China. J. Arid Environ. 2016, 124, 48–61. [Google Scholar] [CrossRef]
- Walvoord, M.A.; Plummer, M.A.; Phillips, F.M.; Wolfsberg, A.V. Deep arid system hydrodynamics 1. Equilibrium states and response times in thick desert vadose zones. Water Resour. Res. 2002, 38. [Google Scholar] [CrossRef]
- Shang, J. Water Dynamics of Vadose Zone in Badain Jaran Desert. Master’s Thesis, China University of Geosciences (Beijing), Beijing, China, 2014. (In Chinese with English abstract). [Google Scholar]
- Hou, L.Z.; Wang, X.S.; Hu, B.X.; Shang, J.; Wan, L. Experimental and numerical investigations of soil water balance at the hinterland of the Badain Jaran Desert for groundwater recharge estimation. J. Hydrol. 2016, 540, 386–396. [Google Scholar] [CrossRef]
- Dong, Z.B.; Qian, G.Q.; Lv, P.; Hu, G.Y. Investigation of the sand sea with the tallest dunes on Earth: China’s Badain Jaran Sand Sea. Earth Sci. Rev. 2013, 120, 20–39. [Google Scholar] [CrossRef]
- Dong, Z.B.; Qian, G.Q.; Luo, W.Y.; Zhang, Z.C.; Xiao, S.C.; Zhao, A.G. Geomorphological hierarchies for complex mega-dunes and their implications for mega-dune evolution in the Badain Jaran Desert. Geomorphology 2009, 106, 180–185. [Google Scholar] [CrossRef]
- Yan, Y.K.; Yuan, B.Q.; Yang, G.Y.; Zhang, C.G.; Shen, A.B.; Xu, H.H. The characteristics of gravity field and fault structure in Yingen-Ejinaqi basin, western Inner Mongolia. Geol. Bull. China 2011, 30, 1962–1968, (In Chinese with English abstract). [Google Scholar] [CrossRef]
- Liu, J.L.; Shen, A.B.; Chen, X.L. Application of magnetotelluric sounding for carboniferous-Permian petroleum geological survey in Yingen-Ejin banner basin, western Inner Mongolia. Geol. Bull. China 2011, 30, 993–1000, (In Chinese with English abstract). [Google Scholar] [CrossRef]
- Zhang, J.; Wang, X.S.; Jia, F.C.; Li, G.M.; Dong, Y.H. New insights into the flow directions of groundwater in western Alxa, Inner Mongolia. Geoscience 2015, 29, 213–219, (In Chinese with English abstract). [Google Scholar] [CrossRef]
- Wang, X.S.; Hu, X.N.; Jin, X.M.; Hou, L.Z.; Qian, R.Y.; Wang, L.D. Interactions between groundwater and lakes in Badain Jaran Desert. Earth Sci. Front. 2014, 21, 91–99, (In Chinese with English abstract). [Google Scholar] [CrossRef]
- Van Genuchten, M.T. A closed-form equation for predicting the hydraulic conductivity of unsaturated soils. Soil. Sci. Soc. of Am. J. 1980, 44, 892–898. [Google Scholar] [CrossRef]
- Lei, Z.D.; Yang, S.X.; Xie, S.C. Soil Hydrodynamics, 1st ed.; Tsinghua University Press: Beijing, China, 1988; pp. 154–196. ISBN 7-302-00208-8. (In Chinese) [Google Scholar]
- Simunek, J.; Sejna, M.; Saito, H.; Sakai, M.; van Genuchten, M.T. The HYDRUS-1D Software Package for Simulating the Movement of Water, Heat, and Multiple Solutes in Variably Saturated Media, Version 4.17, HYDRUS Software Series 3; Department of Environmental Sciences, University of California Riverside: Riverside, CA, USA, 2013; p. 343. [Google Scholar]
- Dai, J.X. Study on the Aeration Zone Permeability and the Influencing Factors in Badain Jaran Desert. Master’s Thesis, China University of Geosciences (Beijing), Beijing, China, 2014. (In Chinese with English abstract). [Google Scholar]
Figure 1.
(a) Location of the Badain Jaran Desert; (b) a schematic geological profile between the Gurinai and Yabulai Mountains, modified from Wang and Zhou (2018) [8].
Figure 1.
(a) Location of the Badain Jaran Desert; (b) a schematic geological profile between the Gurinai and Yabulai Mountains, modified from Wang and Zhou (2018) [8].

Figure 2.
Schematic diagram of the instruments used for soil water observation.

Figure 3.
Daily data during the 2013–2016 period with respect to various depths (0.2 to 3.0 m) at the soil monitoring station in the Badain Jaran Desert (BJD): (a) Temperature; (b) soil matrix suction; and (c) volumetric soil water content.
Figure 3.
Daily data during the 2013–2016 period with respect to various depths (0.2 to 3.0 m) at the soil monitoring station in the Badain Jaran Desert (BJD): (a) Temperature; (b) soil matrix suction; and (c) volumetric soil water content.

Figure 4.
Depth-dependent indices in the shallow vadose zone: (a) Temperature; (b) fluctuation amplitude of temperature; (c) soil suction; (d) fluctuation amplitude of soil suction; (e) volumetric water content; and (f) fluctuation amplitude of volumetric water content.
Figure 4.
Depth-dependent indices in the shallow vadose zone: (a) Temperature; (b) fluctuation amplitude of temperature; (c) soil suction; (d) fluctuation amplitude of soil suction; (e) volumetric water content; and (f) fluctuation amplitude of volumetric water content.

Figure 5.
The relationship plots for fluctuation amplitudes of different factors in the shallow vadose zone: (a) temperature vs soil suction; (b) temperature vs volumetric soil water content.
Figure 5.
The relationship plots for fluctuation amplitudes of different factors in the shallow vadose zone: (a) temperature vs soil suction; (b) temperature vs volumetric soil water content.

Figure 6.
The depth-dependent maximum and minimum values of the pressure head (a) and volumetric water content (b) in the deep zone, according to numerical modeling results.
Figure 6.
The depth-dependent maximum and minimum values of the pressure head (a) and volumetric water content (b) in the deep zone, according to numerical modeling results.

Figure 7.
Infiltration flux in the deep zone: (a) The periodic variation of the infiltration flux at the depth of 3 m; and (b) the change in the fluctuation amplitude of the infiltration flux along depth.
Figure 7.
Infiltration flux in the deep zone: (a) The periodic variation of the infiltration flux at the depth of 3 m; and (b) the change in the fluctuation amplitude of the infiltration flux along depth.

© 2018 by the authors. Licensee MDPI, Basel, Switzerland. This article is an open access article distributed under the terms and conditions of the Creative Commons Attribution (CC BY) license (http://creativecommons.org/licenses/by/4.0/).
Share and Cite
MDPI and ACS Style
Zhou, Y.; Wang, X.-S.; Han, P.-F. Depth-Dependent Seasonal Variation of Soil Water in a Thick Vadose Zone in the Badain Jaran Desert, China. Water 2018, 10, 1719. https://doi.org/10.3390/w10121719
AMA Style
Zhou Y, Wang X-S, Han P-F. Depth-Dependent Seasonal Variation of Soil Water in a Thick Vadose Zone in the Badain Jaran Desert, China. Water. 2018; 10(12):1719. https://doi.org/10.3390/w10121719
Chicago/Turabian StyleZhou, Yanyi, Xu-Sheng Wang, and Peng-Fei Han. 2018. "Depth-Dependent Seasonal Variation of Soil Water in a Thick Vadose Zone in the Badain Jaran Desert, China" Water 10, no. 12: 1719. https://doi.org/10.3390/w10121719
Note that from the first issue of 2016, this journal uses article numbers instead of page numbers. See further details here.