Conceptual Framework for Sediment Management in Torrents


Department of Civil Engineering and Natural Hazards, University of Natural Resources and Life Sciences Vienna (BOKU), 1190 Vienna, Austria
Water 2018, 10(12), 1718; https://doi.org/10.3390/w10121718
Submission received: 24 October 2018
/
Revised: 15 November 2018
/
Accepted: 21 November 2018
/
Published: 24 November 2018
(This article belongs to the Special Issue Erosion and Torrent Control)
Abstract
:Torrential catchments are complex systems showing a huge diversity of sediment and flow regime reactions. Therefore, it seems reasonable to decrease the complexity by introducing a conceptual framework to obtain a general idea of the torrential system’s behavior. The aim of the manuscript is to provide a conceptual framework and a stepwise procedure to develop a reproducible sediment management concept. This involves starting with a definition of torrential process types. These processes are then routed through the drainage system, which is divided into homogeneous reaches. Each reach transfers a flow process from the upstream node to the adjacent downstream reach, based on driving geomorphic factors of sediment mobilization and deposition. Additionally, a sediment budget, derived from cumulative erosion and deposition volumes, is calculated. The estimated flow process together with the sediment budget enables the selection of a sediment management strategy. The implementation of the strategy is based upon the selection of functions, which define the desired modification with regard to the torrential system. Ultimately, the sum of each function’s performance must lead to the fulfilment of the overall protection objective.
1. Introduction
Torrents are characterized as steep streams with perennial or intermittent water courses. Associated with rapidly varying discharge, sediments are mobilized within the watershed and often transported downstream in a hazardous dimension. These sediments are then either deposited within or outside the channel or delivered to another receiving water course. In that way torrents can have high discharges with respect to the area of the watershed, a short duration of the rising limb of the hydrograph, erodible sediment sources, and a well-developed sediment connectivity to facilitate the subsequent transport of huge amounts of sediments to the cone or fan. Therefore, a torrential catchment is divided into the watershed and the deposition area (fan or cone). Within the watershed the runoff converges, sediments are mobilized and transported to the fan apex. The alluvial fan or debris cone represents the deposition area. Usually the amount of deposited sediments is quantified and used as basic information for planning mitigation measures. Although this procedure may suffice for a basic hazard management, it seems to be worth improving the selection of different mitigation measures on the basis of a conceptual framework for sediment management in torrents.
2. Torrential Processes and their Magnitude-Frequency Relationship
2.1. Definition of Torrential Processes
Defining torrential processes has a long history. Popular and traditional classification schemes sometimes are in conflict with scientific definitions. Additionally, different branches of science create new terms and definitions, leading to some confusion. To overcome this problem, a classification was developed based on tradition [1,2], but supported by scientific literature [3,4]. These definitions have been published as national engineering standards in Austria [5] (Table 1). The proposed flow processes comprise water dominant flows (flood and bedload transport) and debris dominant flows (debris flood and debris flow). These definitions are required for event documentation, for hazard and risk analysis, and for the design of mitigation structures.
2.2. Magnitude and Frequency
For hazard analysis, torrential processes are usually characterized by their magnitude-frequency relationship. Because of the lack of data, this approach is open to many interpretations. Generally speaking, the less sediment, the higher is the accuracy of the estimated magnitude-frequency relationship in terms of discharge. Sediment mobilization rate and sediment mobilization volume can strongly modify an estimated hydrograph. These two parameters are not always in accordance with rainfall data (Table 2), which are generally used as input value to calculate a hydrograph of the given frequency.
3. System States of Torrential Catchments
A torrential catchment can be considered as a system, with rainfall as input, soil moisture and sediment as storages, and the drainage system acting as routing element, and runoff as output. The storage capacities modify the system status, generating either water dominant flows or debris dominant flows. This can be explained by the concept of disposition [6], describing the susceptibility of water and solids to be delivered downstream as a reaction to a triggering event. If a catchment displays a high disposition in terms of the storage capacity of soil moisture, the catchment is expected to show a significant response to rainfall input. On the other hand, if there is a high disposition of sediment release and debris sources can easily be triggered, the reaction of the catchment is essentially controlled by the mobilized sediment. Therefore, the disposition is the control factor determining whether either water or debris dominant processes will result from the rainfall.
Considering water dominant flows, the sediment storage capacity is not of particular importance. The magnitude-frequency relationship can easily be developed in the case of sufficient data. There is a clear relationship between recurrence interval and discharge, and therefore the discharge can be calculated for a given frequency within a range of accuracy. If a catchment behaves in that way, we may label this system as state I (Figure 1).
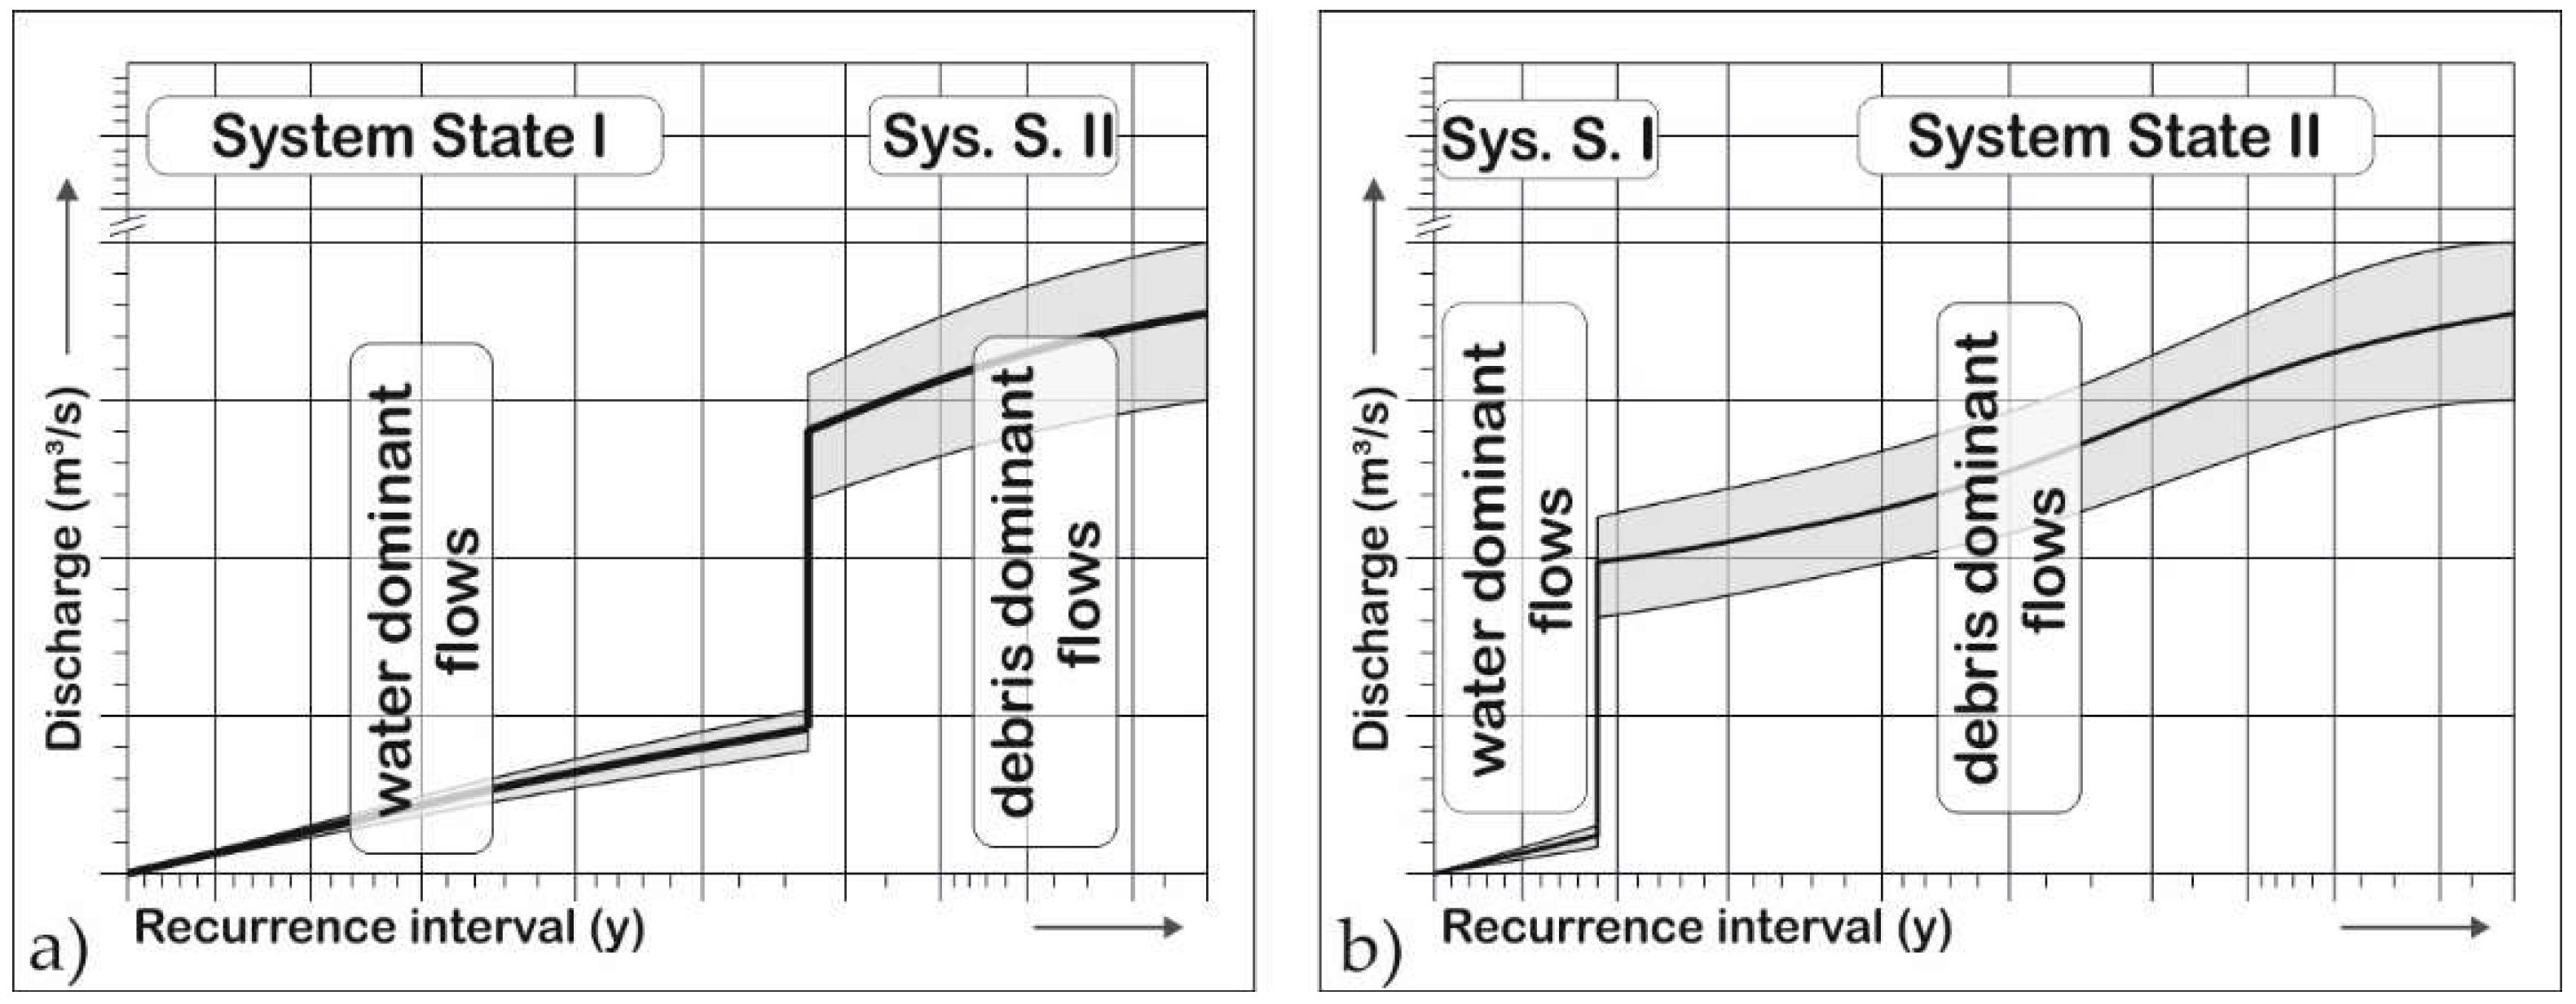
If a catchment shows a high disposition to mobilize sediment, the sediment storage cannot be neglected and modifies strongly the system output. This disposition may vary in time and between different catchments, depending on topography, geology, and vegetation, for example, leading to different thresholds when debris dominant flows are initiated. Using discharge as a proxy, the threshold to produce debris dominant flows may be exceeded with discharges of a very low frequency up to a very high frequency. Analyzing event cadasters, researchers have distinguished catchments of different behavior [7]. Some catchments produce periodic debris dominant flows, whereas others show irregular behavior, creating several huge discharges within a short time span followed by a period with only water dominant flows. It can be deduced from this behavior that if a catchment-specific threshold of discharge is exceeded, the sediment storage controls the resulting flow type, and we may therefore label this system as state II (Figure 2). The system state II’s characteristic is that peak discharges exceed the expected peak discharges of water dominant flows by a factor of more than 2 up to 50. This implies that above the threshold no water dominant flows occur.
4. Conceptual Drainage Network
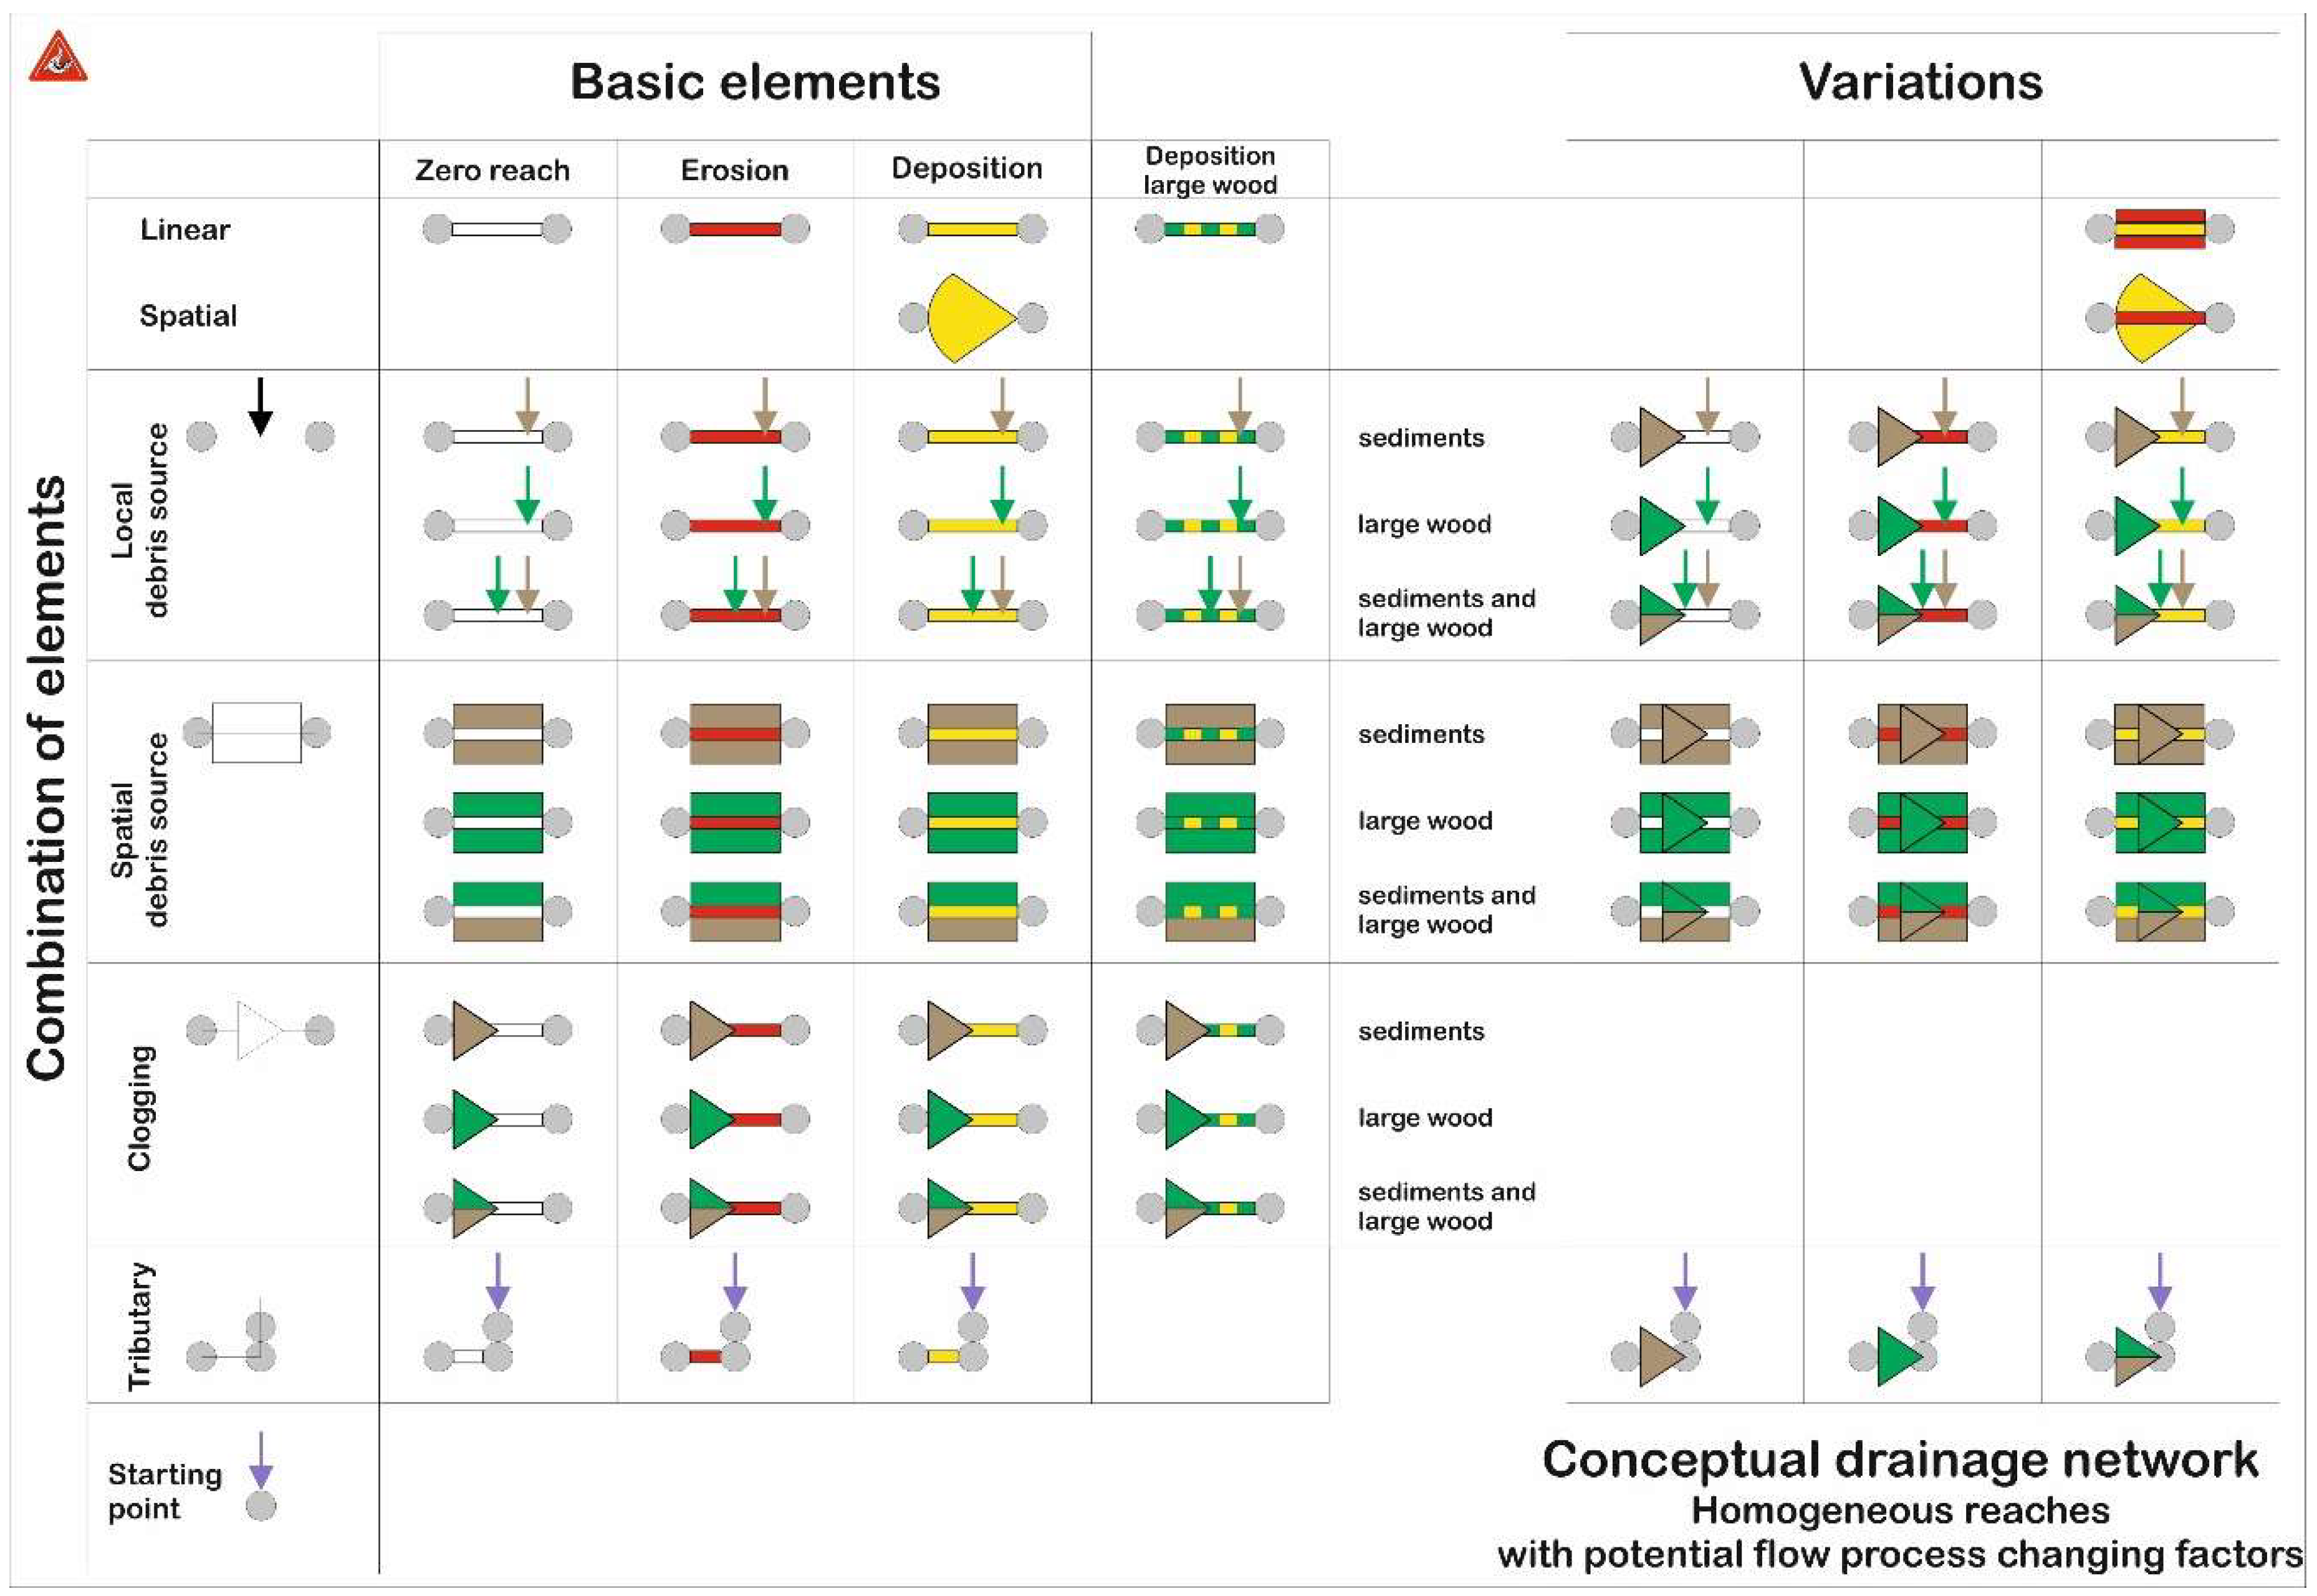
Based on the experience presented in documentation on torrential disasters and the implementation of the results obtained from the project “Erosion, Transport in Alpinen Systemen” ETALP [8], a concept was developed to illustrate the main geomorphic features together with the varying dominant flow types along the drainage network. This network is divided into homogeneous reaches based on the assumption that the driving geomorphic factors remain constant within a homogeneous channel reach. In the conceptual drainage network, such a channel section can be seen as an element. Basic elements (zero reach, erosion and deposition reaches) can be combined with potential debris and large wood sources, like local debris sources, spatially distributed debris sources, clogging, and tributaries. The method is open to variations of the selected elements (Figure 3).
The elements are connected by nodes. At each node the dominant flow type (Table 1) is identified, either retrospective with the help of “silent witnesses”, or predictive by expert opinion, based on the debris sources and their mobilization intensity. The dominant flow type is thus routed downstream through the channel system (process routing).
The outcome of this conceptual drainage system is a representation of erosional and depositional reaches, debris and large wood sources, and resulting dominant flow process types along the drainage system. The method gives an overview and helps to compare different hazardous events within the channel network and to identify critical reaches.
This concept can be used not only in a retrospective, but also in a predictive way. Scenarios for hazard analysis with different frequencies and sediment dispositions, based on expert knowledge, are easily presented and may support the application of numerical simulation tools. On the other hand, the desired effect of mitigation measures on debris sources and resulting dominant flow processes can be visualized.
5. Sediment Budget
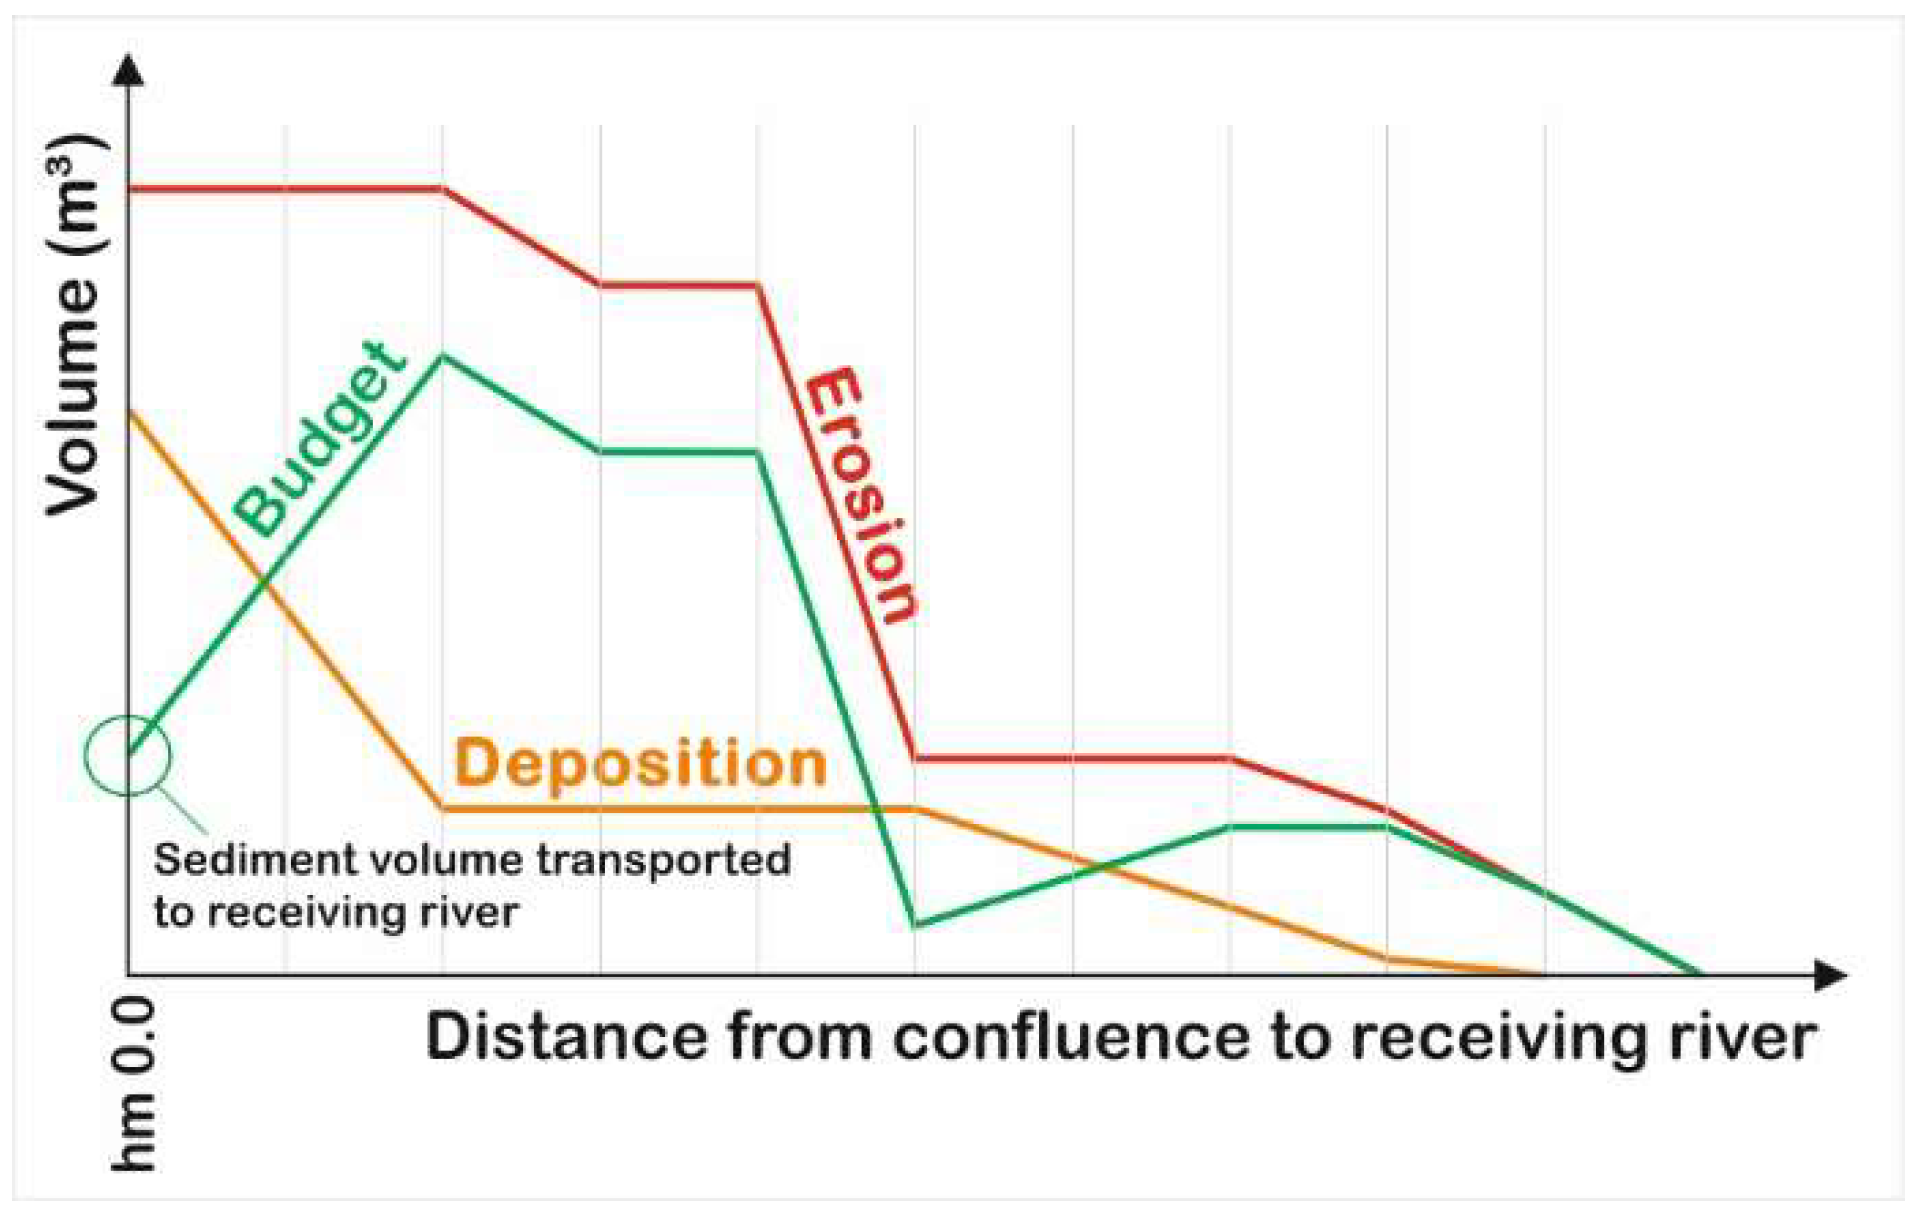
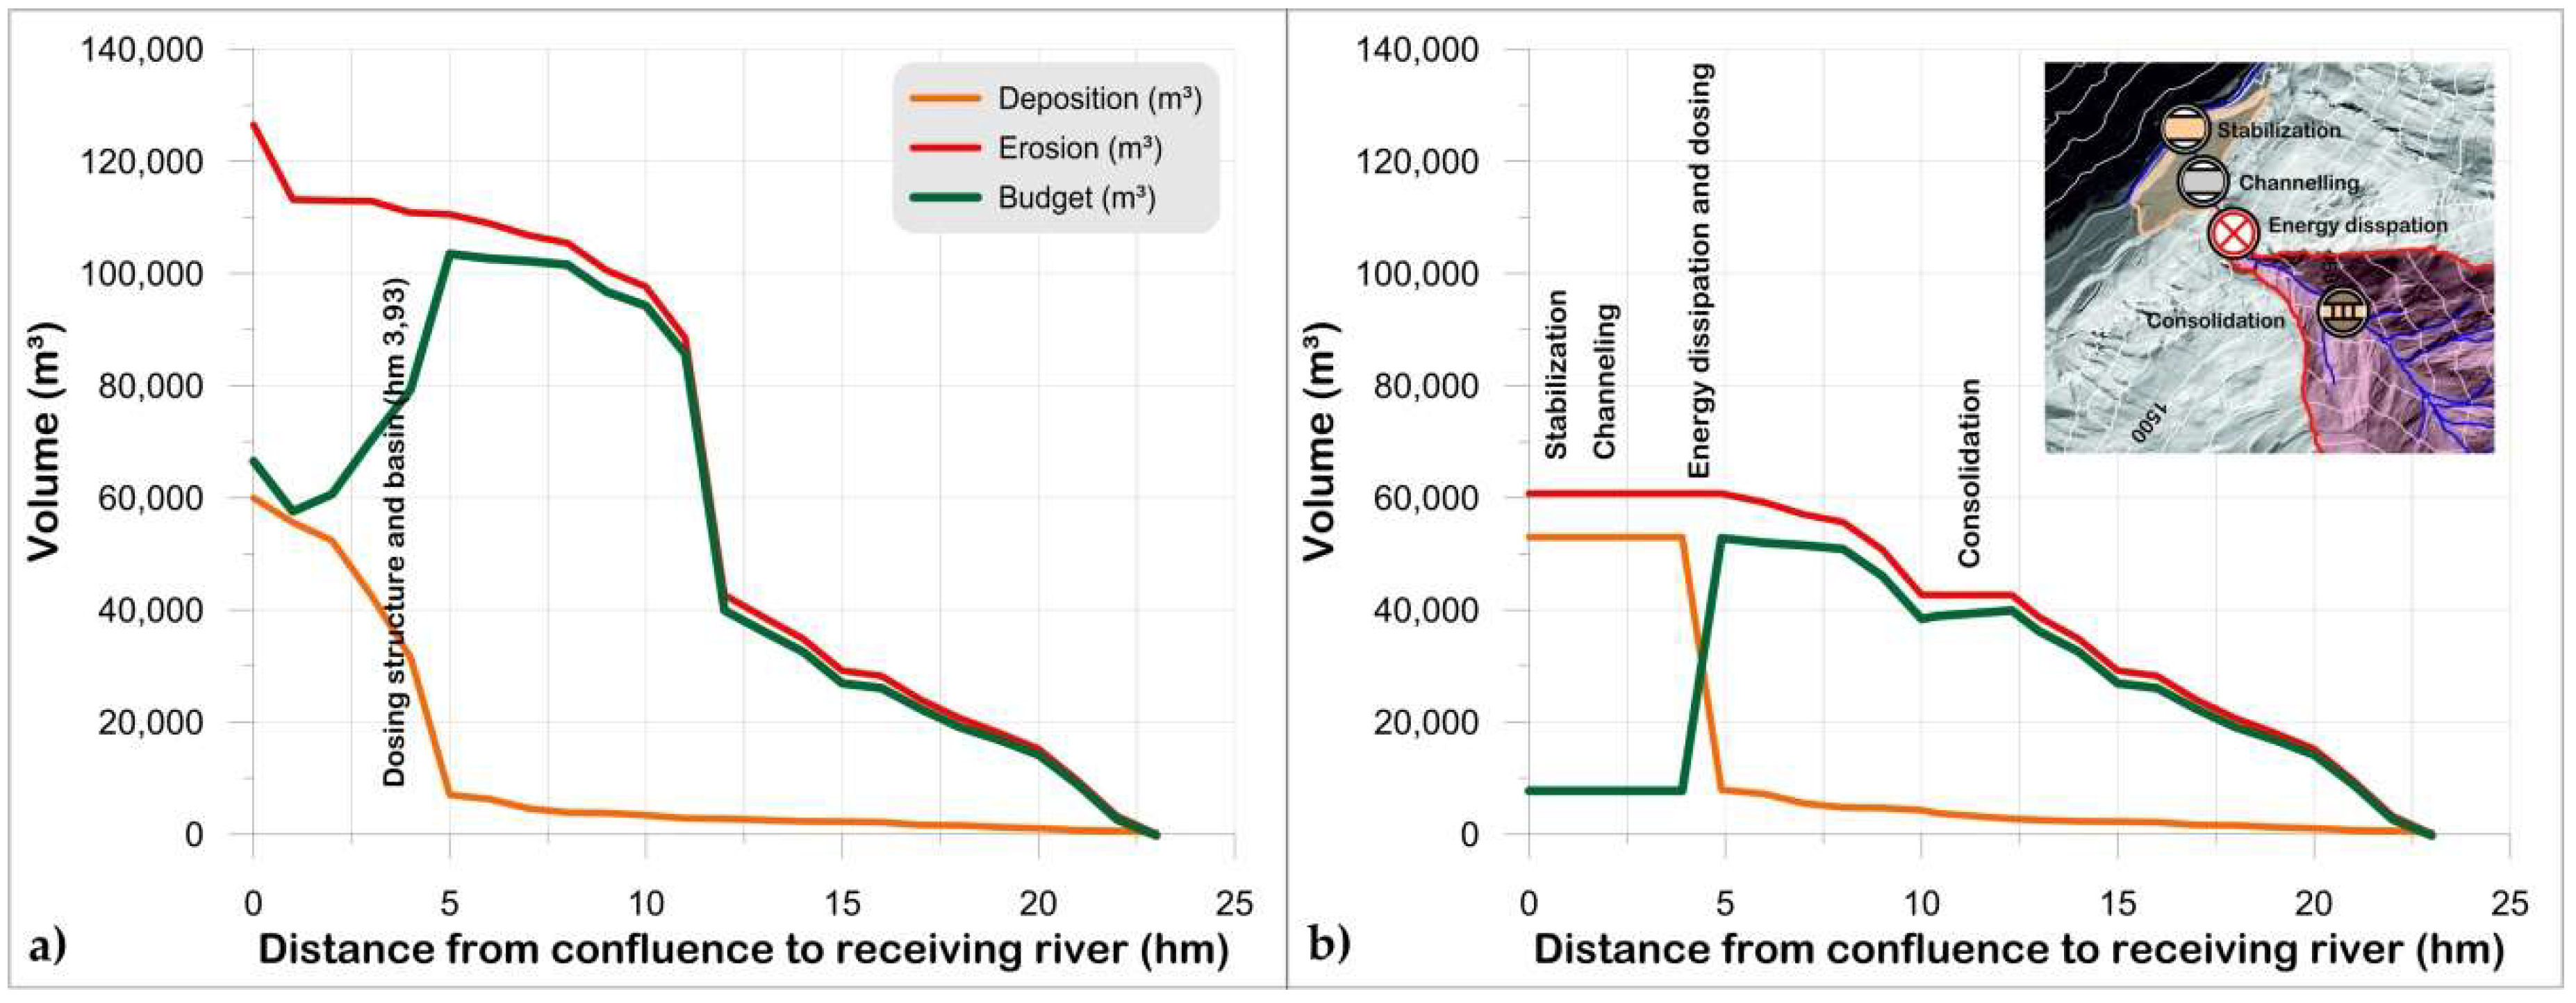
To quantify the erosion and the deposition volume for the homogeneous reaches, different methods can be applied. If airborne laser scanning (ALS) data are available before and after a torrential event, the difference of the digital elevation models (DEM) can be calculated and projected to the channel reaches. Otherwise, field survey methods must be executed as suggested by [9,10], where geometrically derived erosion and deposition volumes are estimated, taking different sediment sources along the channel into account. Empirical formulas can only be used as a rough estimate of the total sediment load [11,12,13,14,15,16], without considering variable sediment sources along the drainage network. Erosion and deposition volumes are cumulated in the downstream direction along the main channel and the net volumes are calculated (Figure 4). If the budget (erosion minus deposition) is increasing, erosion rates are higher than deposition rates and vice versa. A constant budget is achieved by equilibrium of erosion and deposition rate. At the downstream end of the channel, the budget indicates the sediment volume that is transferred to the receiving river. This very practical method can also be used to optimize and visualize the effect of mitigation measures.
6. Mitigation Measures for Sediment Management
6.1. Active and Passive Measures
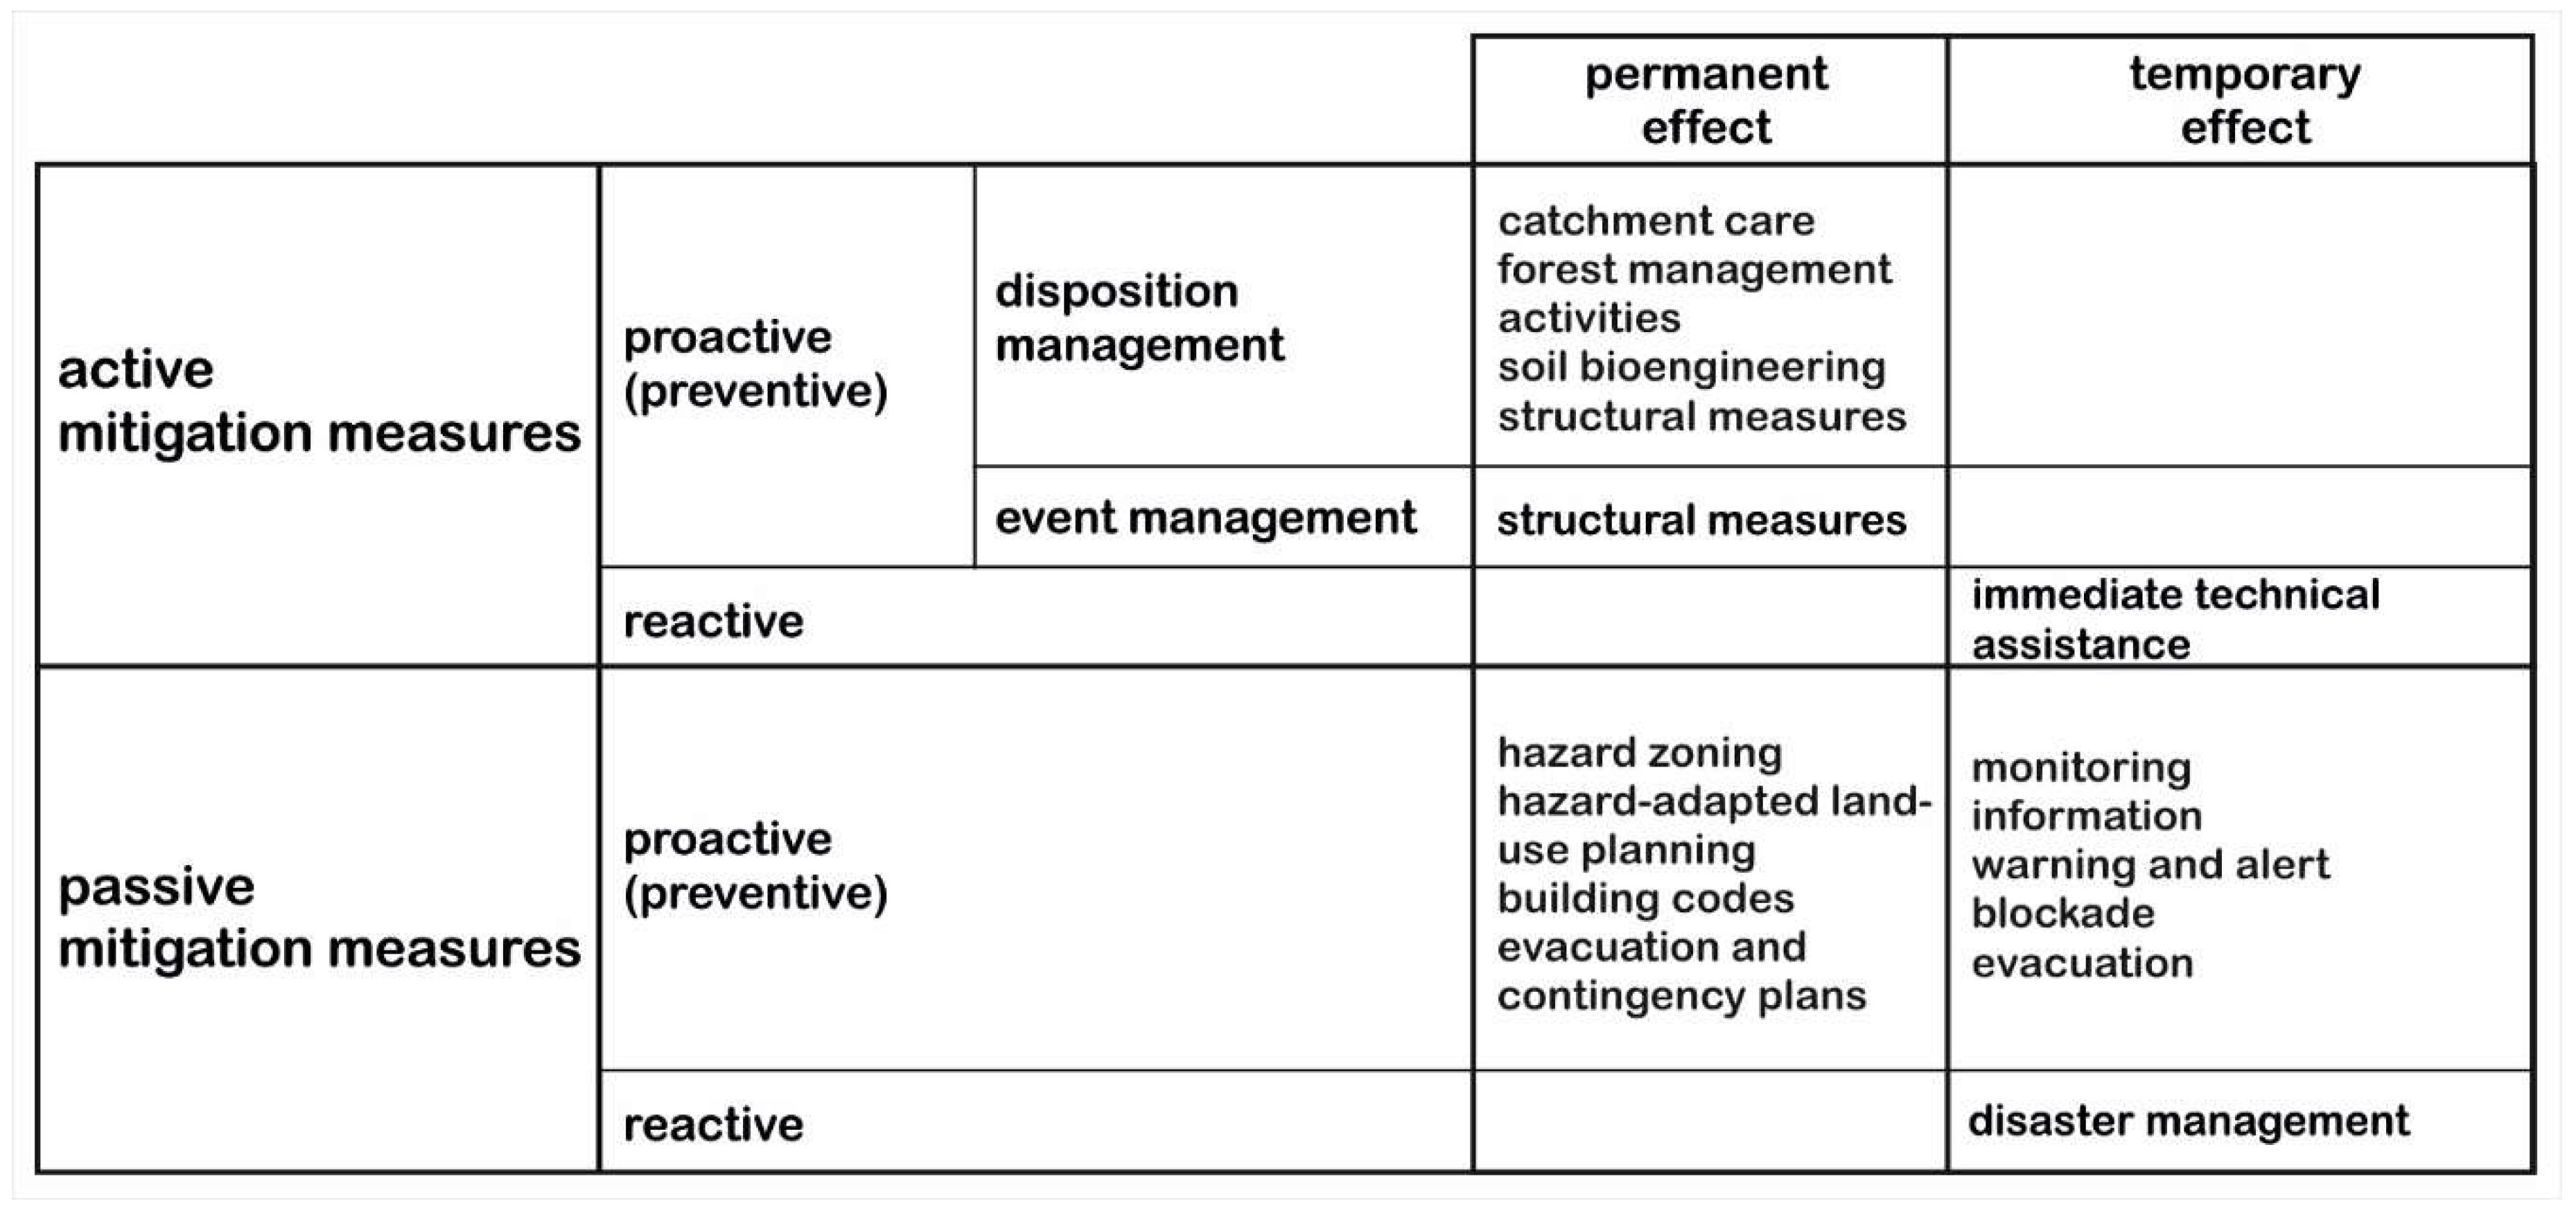
Mitigating torrential hazards has a long history. Depending on financial resources, available building material, worker expertise, construction material, technical standards, and facilities, several measures for sediment management were developed. Two types of mitigation measures can now be distinguished [17]: active measures and passive measures (Figure 5).
Active mitigation measures may affect the initiation, transport, or deposition of torrential flows, and can therefore modify its magnitude and frequency characteristics. This can be achieved either by changing the probability of occurrence (disposition management), or by manipulating the flow process itself (event management) [18].
Passive mitigation measures are used to reduce the potential losses by, for example, altering the spatial and temporal character of either the damage produced by the torrential process or the associated vulnerability. Vulnerability of a disaster can be changed either with proper land use planning based on hazard maps and meeting building codes, or through immediate disaster response. At this time, early warning systems are becoming more and more important [19]. Communication and training are the prerequisites for an effective application of these measures.
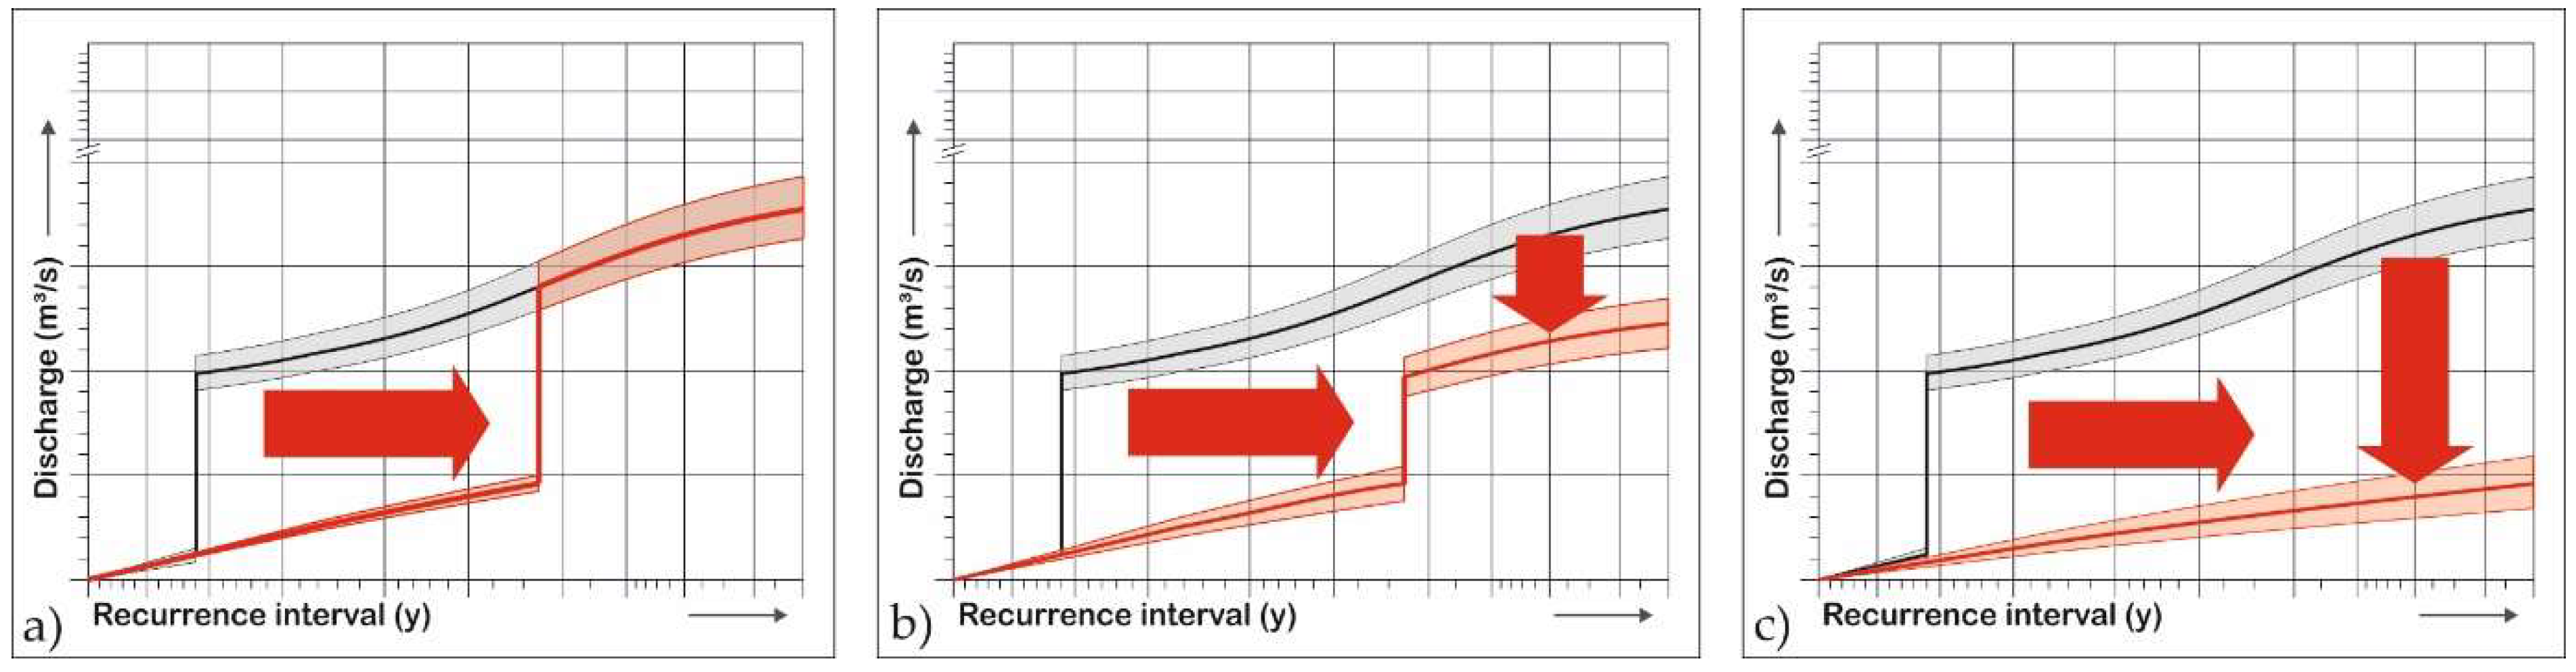
For changing the intensity and/or frequency of a torrential process, one has to modify the disposition of the watershed. A reduction of the disposition leads to a shift of the system state transition to the right, implying a lower frequency (Figure 6) for system state II processes. To reach this goal, one has to either improve the hydrological conditions or lower the mobilization rate of sediment sources in the catchment by active and preventive measures with permanent effect. A combination of these adaptation methods in Austria was termed the Forest-Technical System [20], primarily developed after huge disasters in the second half of the 19th century in the European Alpine region. The second proactive mitigation strategy aims at managing the event itself. The catchment reacts due to the input in a natural way. The transition from system II to state I is executed locally with the help of structural measures.
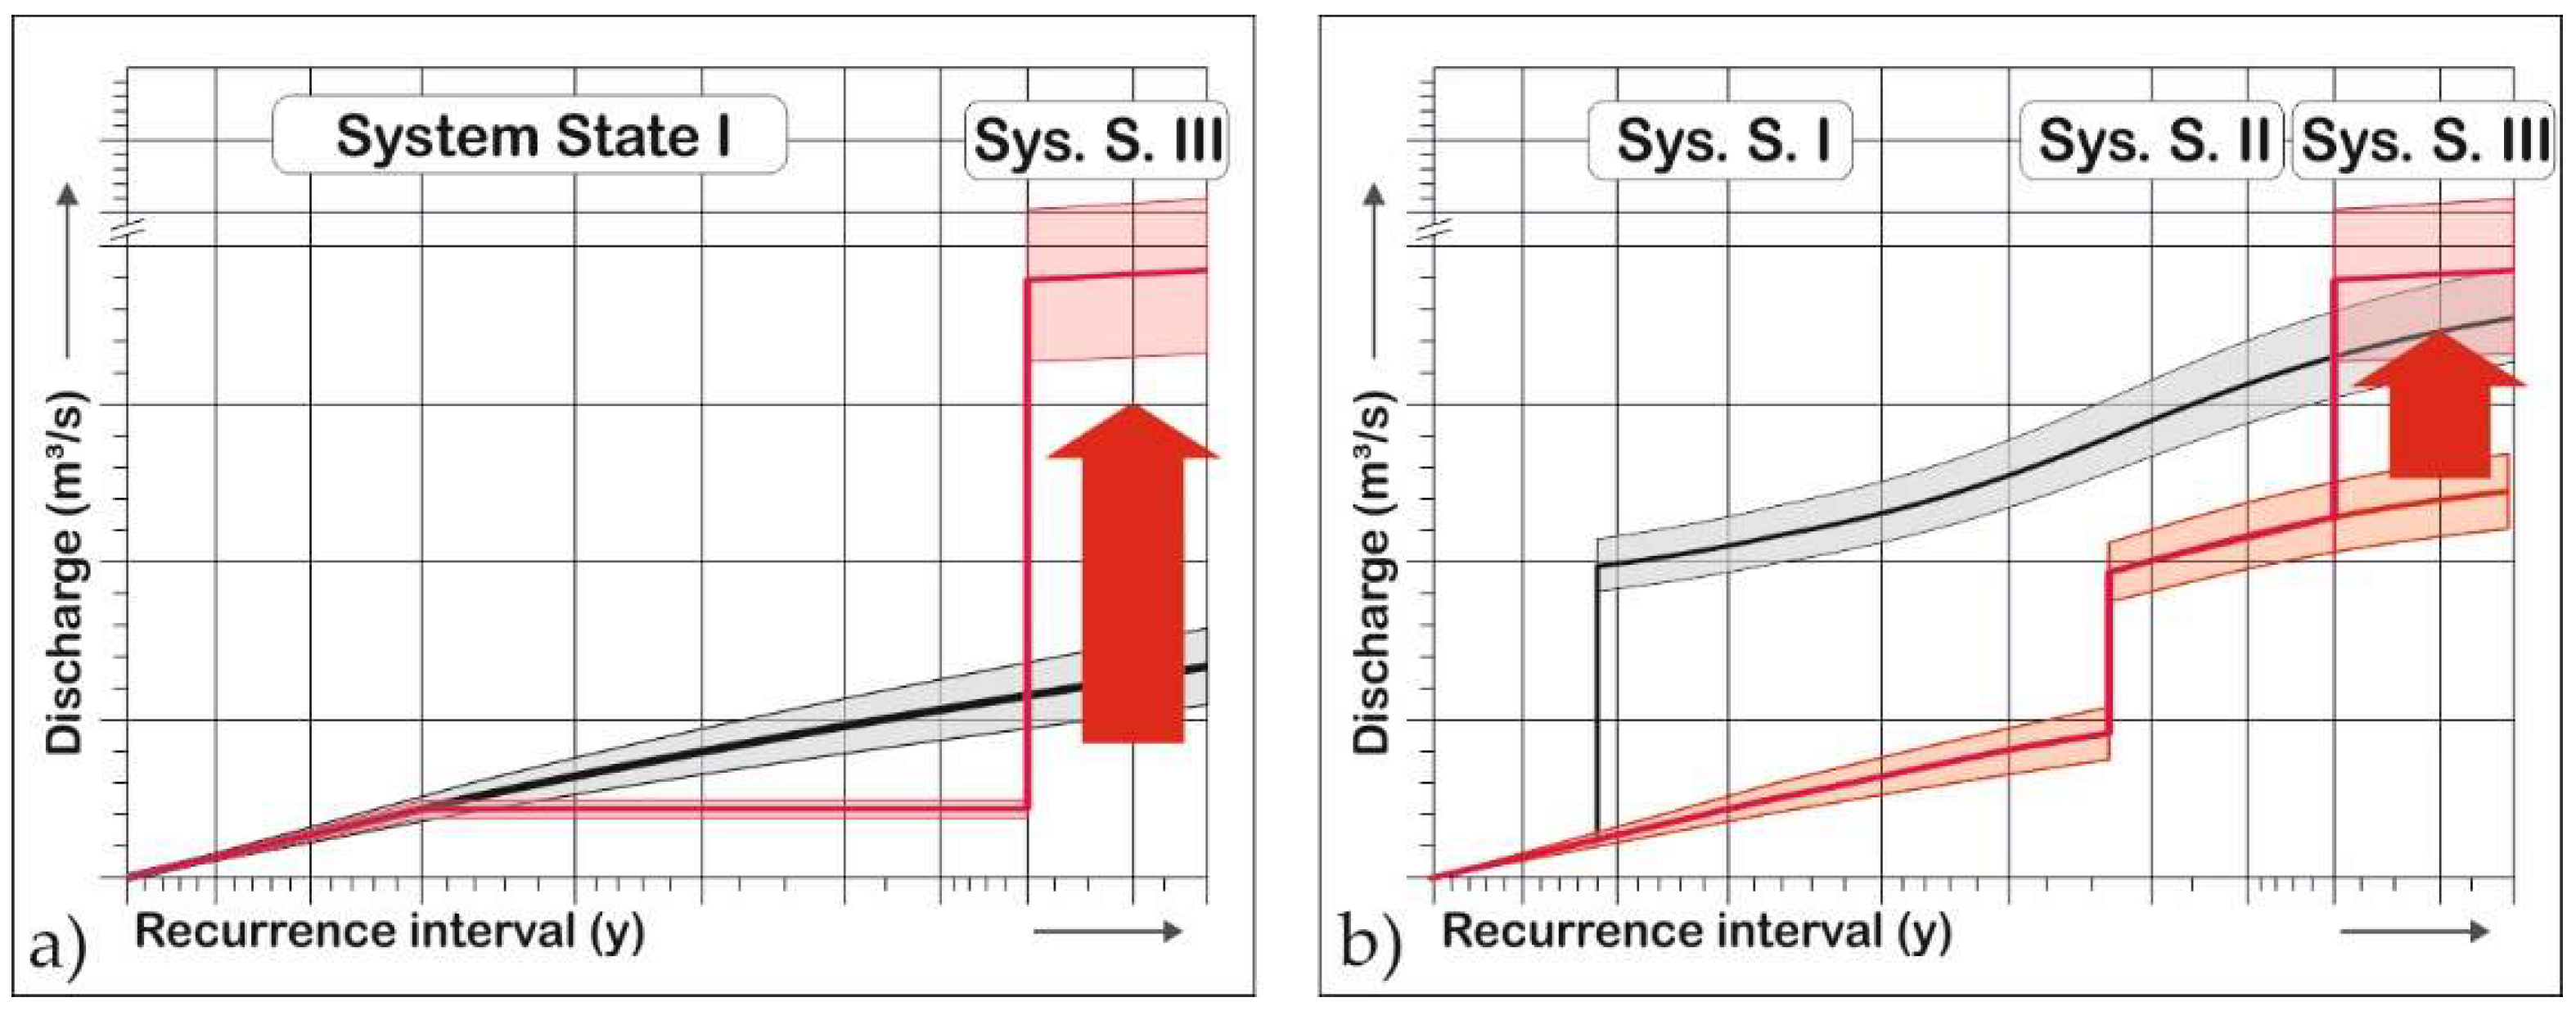
The failure of structural measures may lead to discharges that outreach the expected magnitude of a given frequency. These failures may occur in the course of water dominant flows as well as debris dominant flows. Therefore, a system state III is introduced (Figure 7). Within this state, all types of flow may occur. Examples of water or sediment retention structure failures that will show this state are the disasters at Enterbach [21], Fischbach [22], or, more recently, Simbach [23]. Failures have to be considered in risk management, therefore it is worth conceptually assessing the potential impact of failures. Generally speaking, the failure of measures for disposition management will create lower impacts than of measures for event management. This is due to their usually low storage capacity of sediment. However, with increasing volumes of deposited sediment or water the possible impact increases. State III can naturally be reached by glacial lake outburst floods or cascading effects like the one at Log Pod Mangrtom [24].
According to the specified protection goal, a strategy can be selected which takes into account the potential behavior of the torrential system. To implement the chosen strategy, mitigation measures are selected that fulfill defined requirements [25], so-called functions. The joint effect of these functions within the torrential system should contribute to reaching the protection goal in the most effective and efficient way. The performance of these functions must be evaluated at least after a torrential event to identify shortcomings and to optimize the selected measures.
6.2. Functions of Structural Measures
Rearranging and adapting the concept mentioned in [18], the following functions of structural measures were defined in the national guidelines of Austria [5]. They are grouped according to disposition and event management.
In the case of disposition management:
- StabilizationStabilization of the horizontal and vertical position of the channel and the embankment to minimize debris mobilization along the channel. The design channel slope should match the transport capacity, assessed with sediment transport equations. Stabilization is usually realized by a combination of longitudinal and transverse structures (e.g., trench, channel adjustment).
- ConsolidationLowering the probability of slope failures close to the channel by a considerable raise of the channel bed using a series of check dams to get a toe counterweight of the adjacent hillslope and bank. The channel gradient is thereby decreased, leading to less erosion within the channel. Consolidation can be supported by soil bioengineering techniques.
- DiversionCreating a bypass from the original channel to avoid excessive sediment mobilization along specific channel reaches (tunnel, rock channel).
In the case of event management:
- RetentionPermanent deposition of sediment upstream of a structure. Until the retention basin is filled, it completely interrupts bedload transport and can lead to excessive erosion downstream. When the basin is filled, the deposition angle of the retained material strongly depends on the volumetric sediment concentration of the flow. A dosing function might be obtained when the falling limb of the hydrograph or subsequent flows with lower sediment concentration erode the sediment from the basin.
- FiltrationSeparation and deposition of grain sizes exceeding a defined diameter or of large woody debris at the structure that may clog downstream reaches. This can be achieved by an open structure with a rake or grill situated upstream. In case the filter element is blocked by coarse material or woody debris, it behaves like a structure with a retention/dosing function. There is no natural remobilization of the deposited material, and the basin must be excavated mechanically.
- DosingTemporary deposition of sediments by creating backwater in a bottleneck (e.g., open check dam) or by changing channel geometry, e.g., slope reduction or channel widening. Some of the deposited material may be later eroded by subsequent flows deficient of sediment.
- Energy dissipationSlowing and depositing of the surge front of a debris flow to ensure a lower dynamic impact in the downstream reaches. In an array of different mitigation structures, a structure with this function is always in the most upstream position and should retain at least the volume of a debris flow surge. The commonly used term is debris flow breaker for a structure with this function.
Within the group of structural measures, two functions do not modify magnitude or frequency, but just influence the flow direction of the torrential process on the fan.
- ChannelingEnlargement and strengthening of the channel to assure the passing of the design flow without inundation of a potentially endangered area (e.g., trench, channel adjustment).
- DeflectionDirecting the flow towards areas of non-developed areas (e.g., agricultural or forested areas) in the deposition area with dikes or deflection walls. Deflection is commonly utilized as the last element of a systematic torrent control to diminish any remaining risk.
7. Example: Schallerbach, Tyrol, Austria
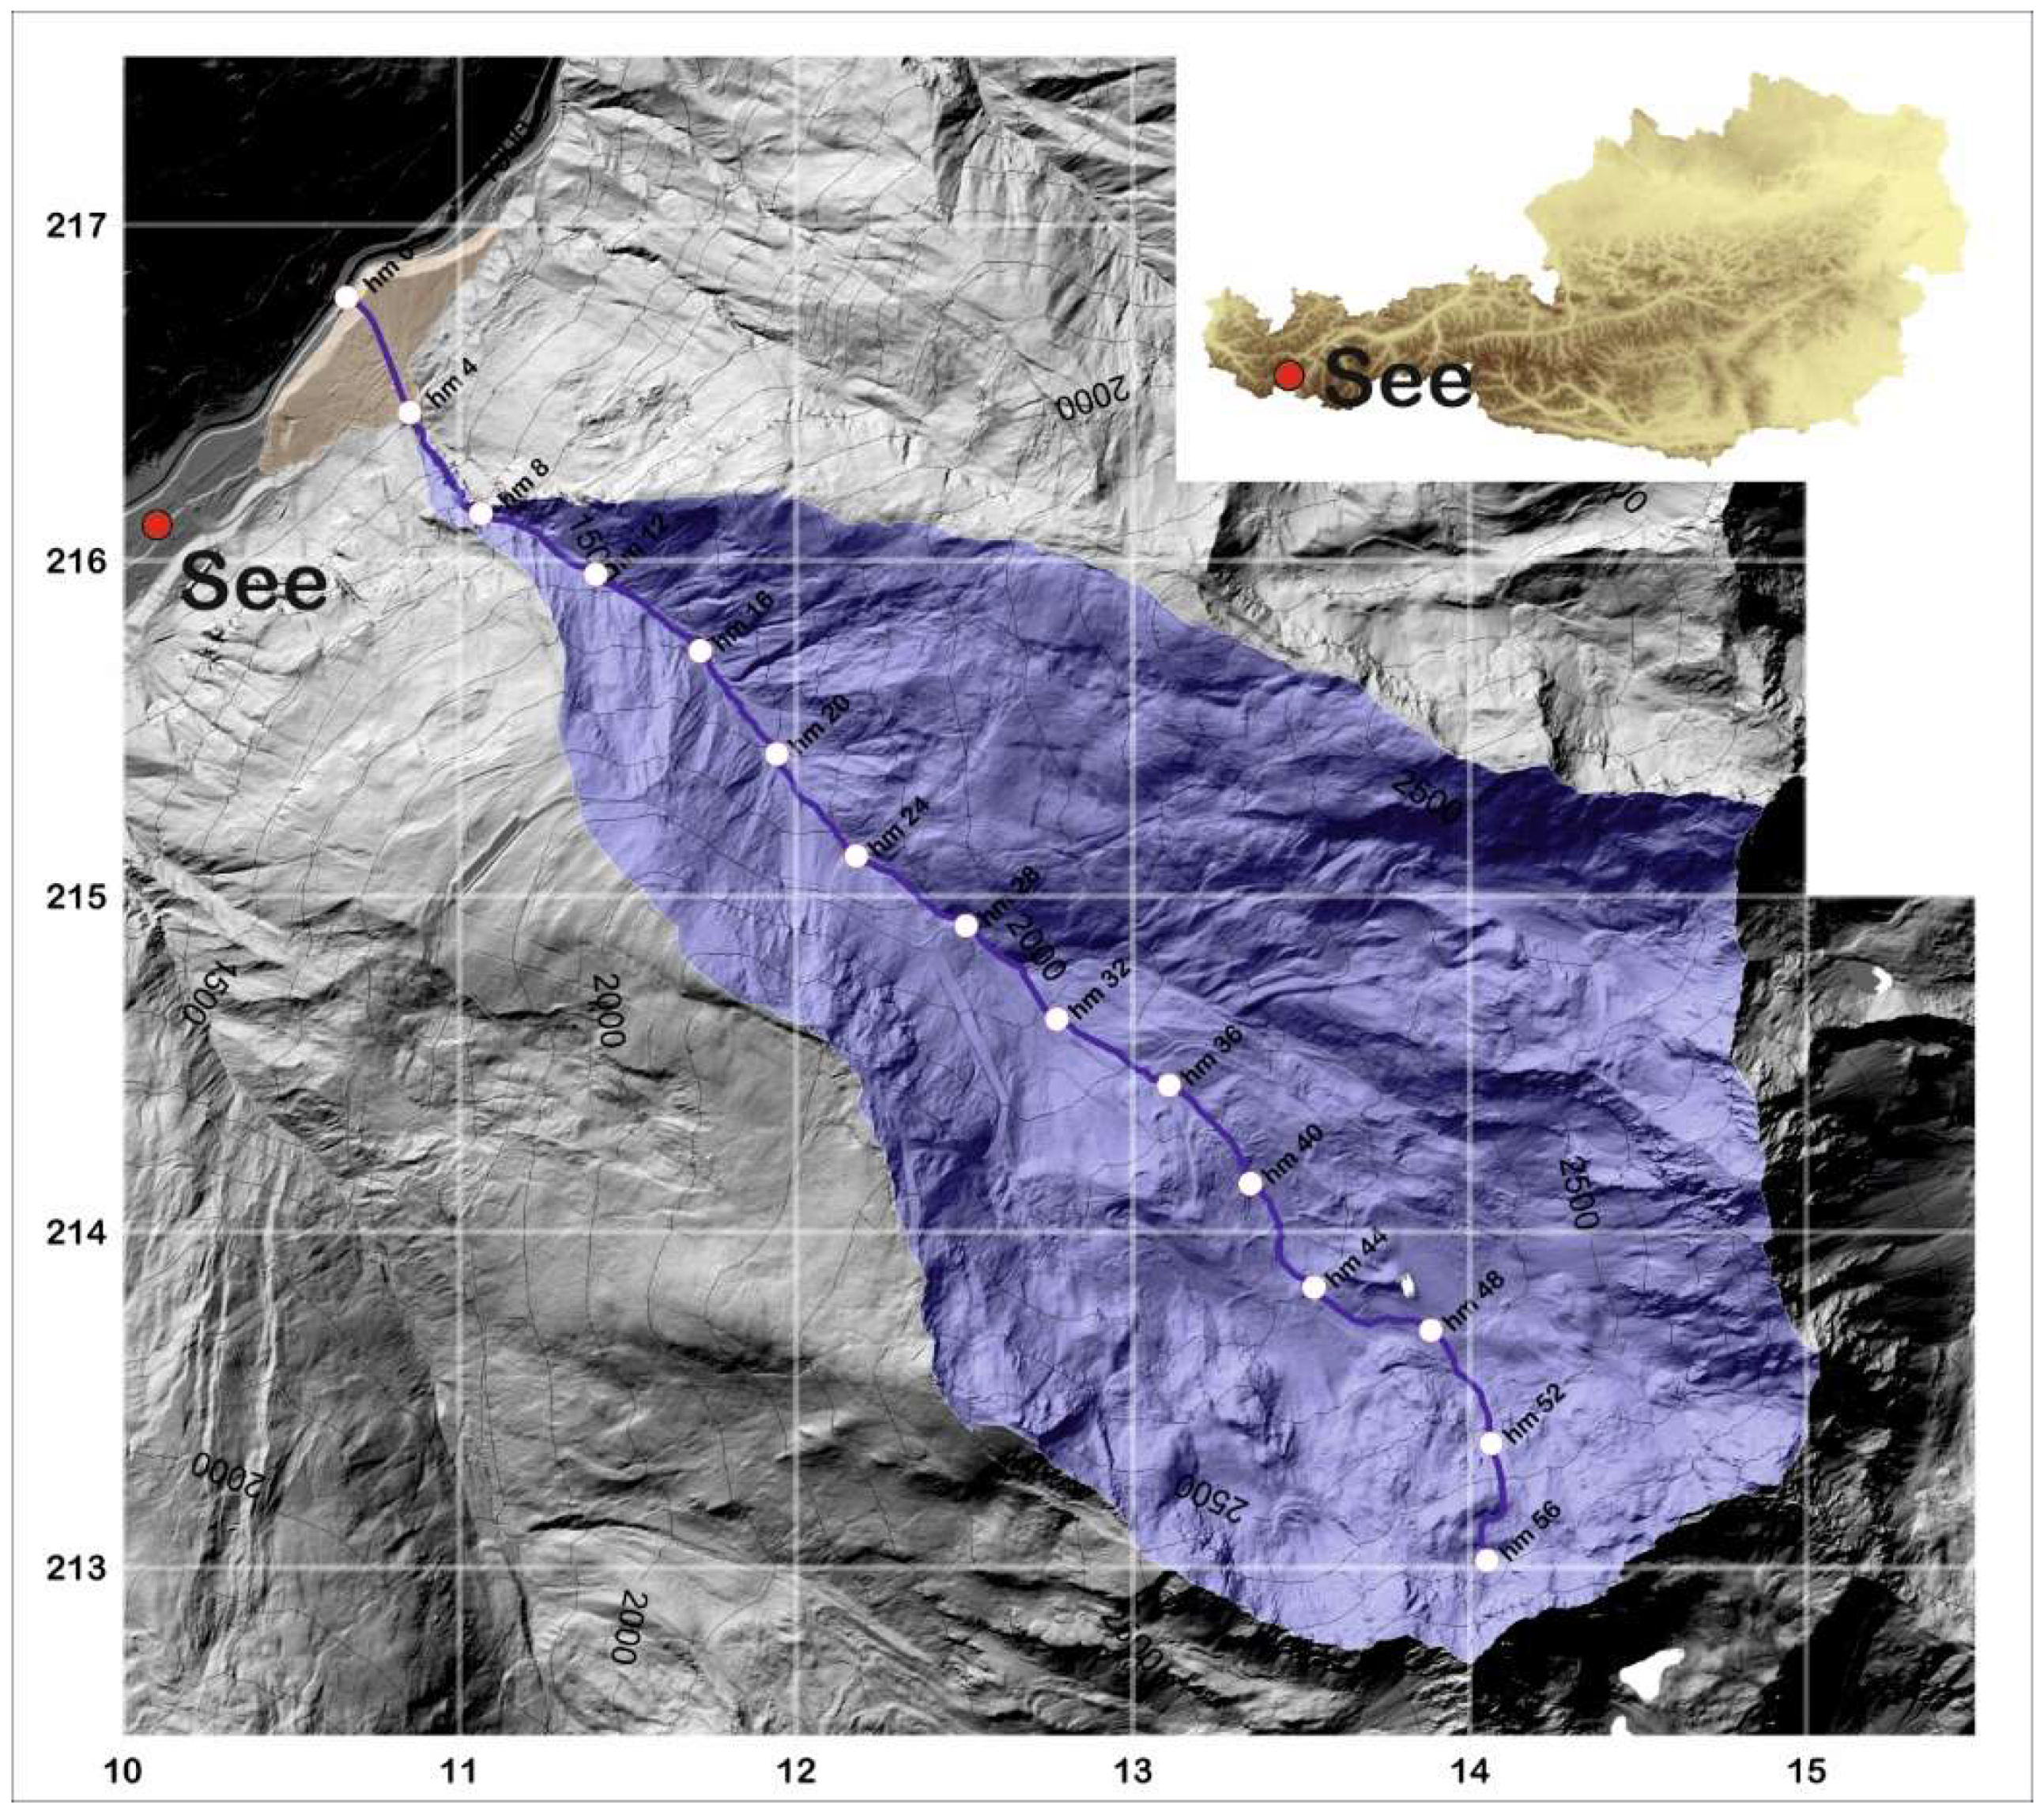
During the night of 7 to 8 June 2015, a disaster occurred in the Schallerbach catchment (Figure 8), namely, a torrent in the municipality of See, district Landeck, Tyrol [26].
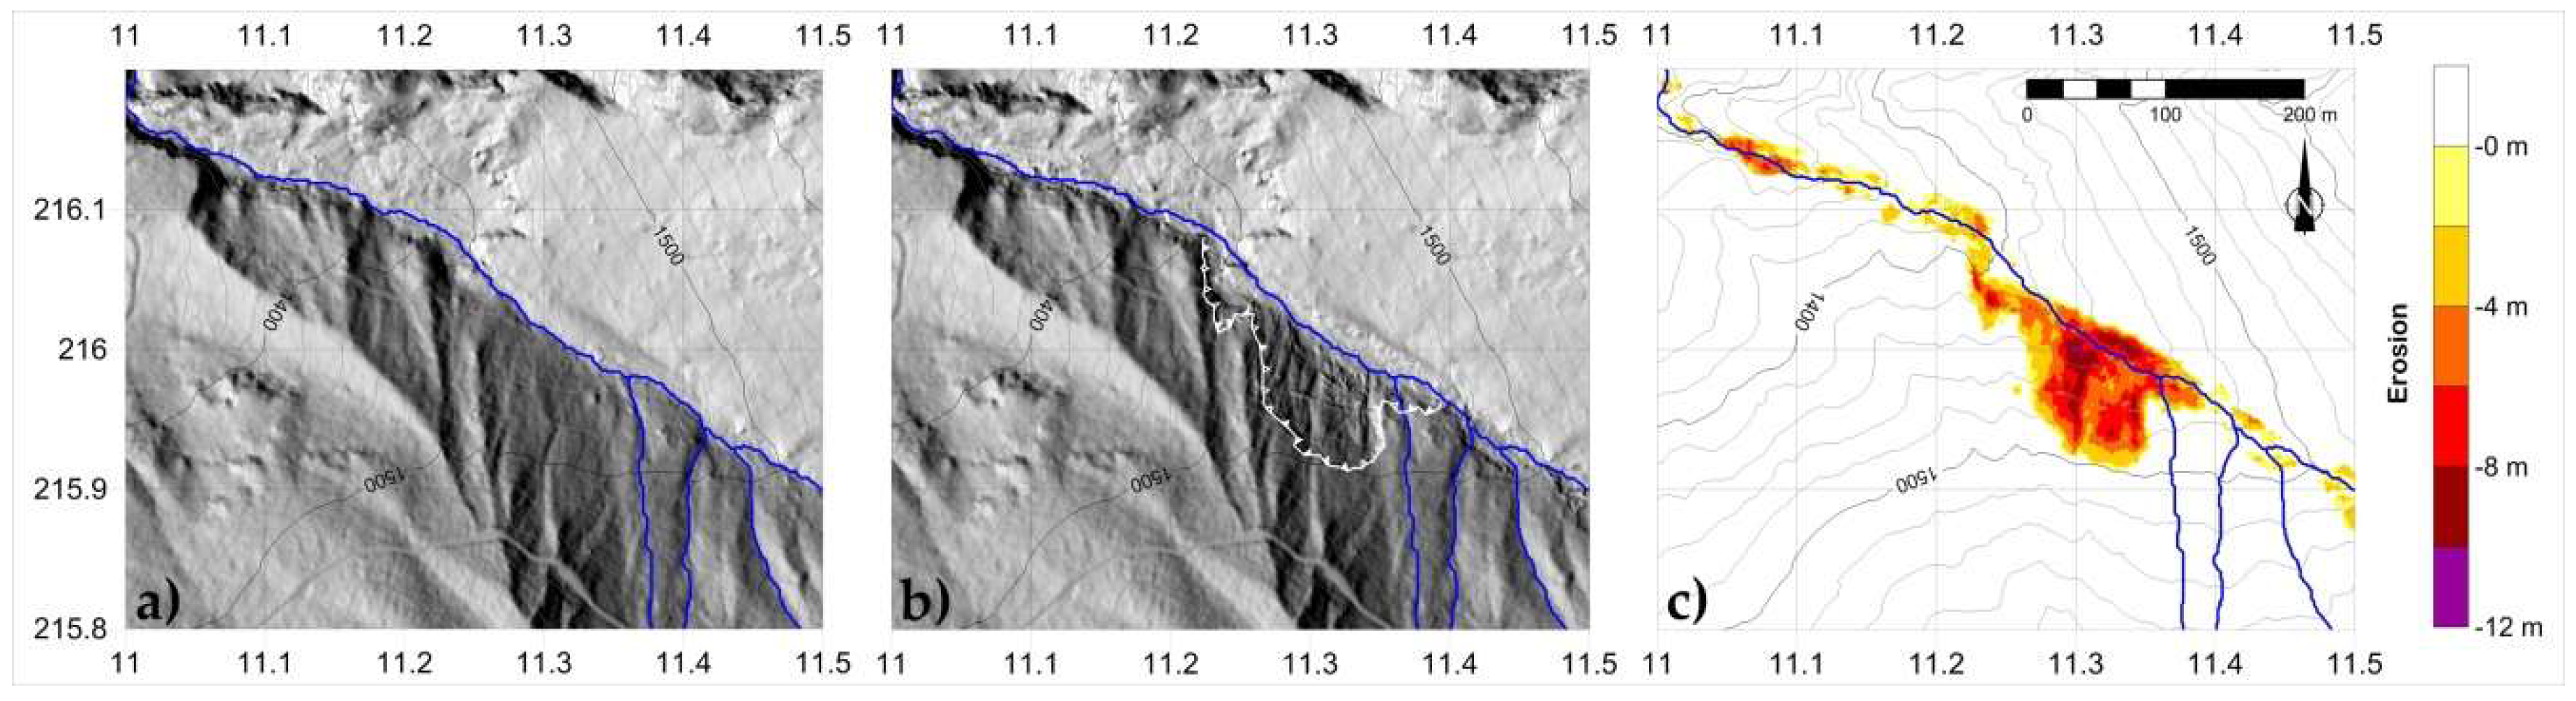
The analysis of weather radar data (derived from the Meteorological Service of Austria ZAMG) showed that heavy rainfall started at 20:00 Central European Time (CET) and lasted until 06:00 CET on the next day. Due to very intensive bedload transport with a total discharge of about 20 to 25 m3/s (cross-section and velocity estimates by technical experts on site during the event), the debris basin at the cone apex was completely filled at approximately midnight. At 04:00 CET, four debris flow surges, each lasting 20 to 30 s (eyewitness reports) with an estimated peak discharge of about 100 m3/s occurred. Field investigations and the subsequent comparison of ALS data from the years 2012 and 2015 lead to the notion that the debris flow surges were initiated by a landslide between hectometer (hm) 10.4 and 12.3 with a volume of 55,000 m3 (Figure 9).
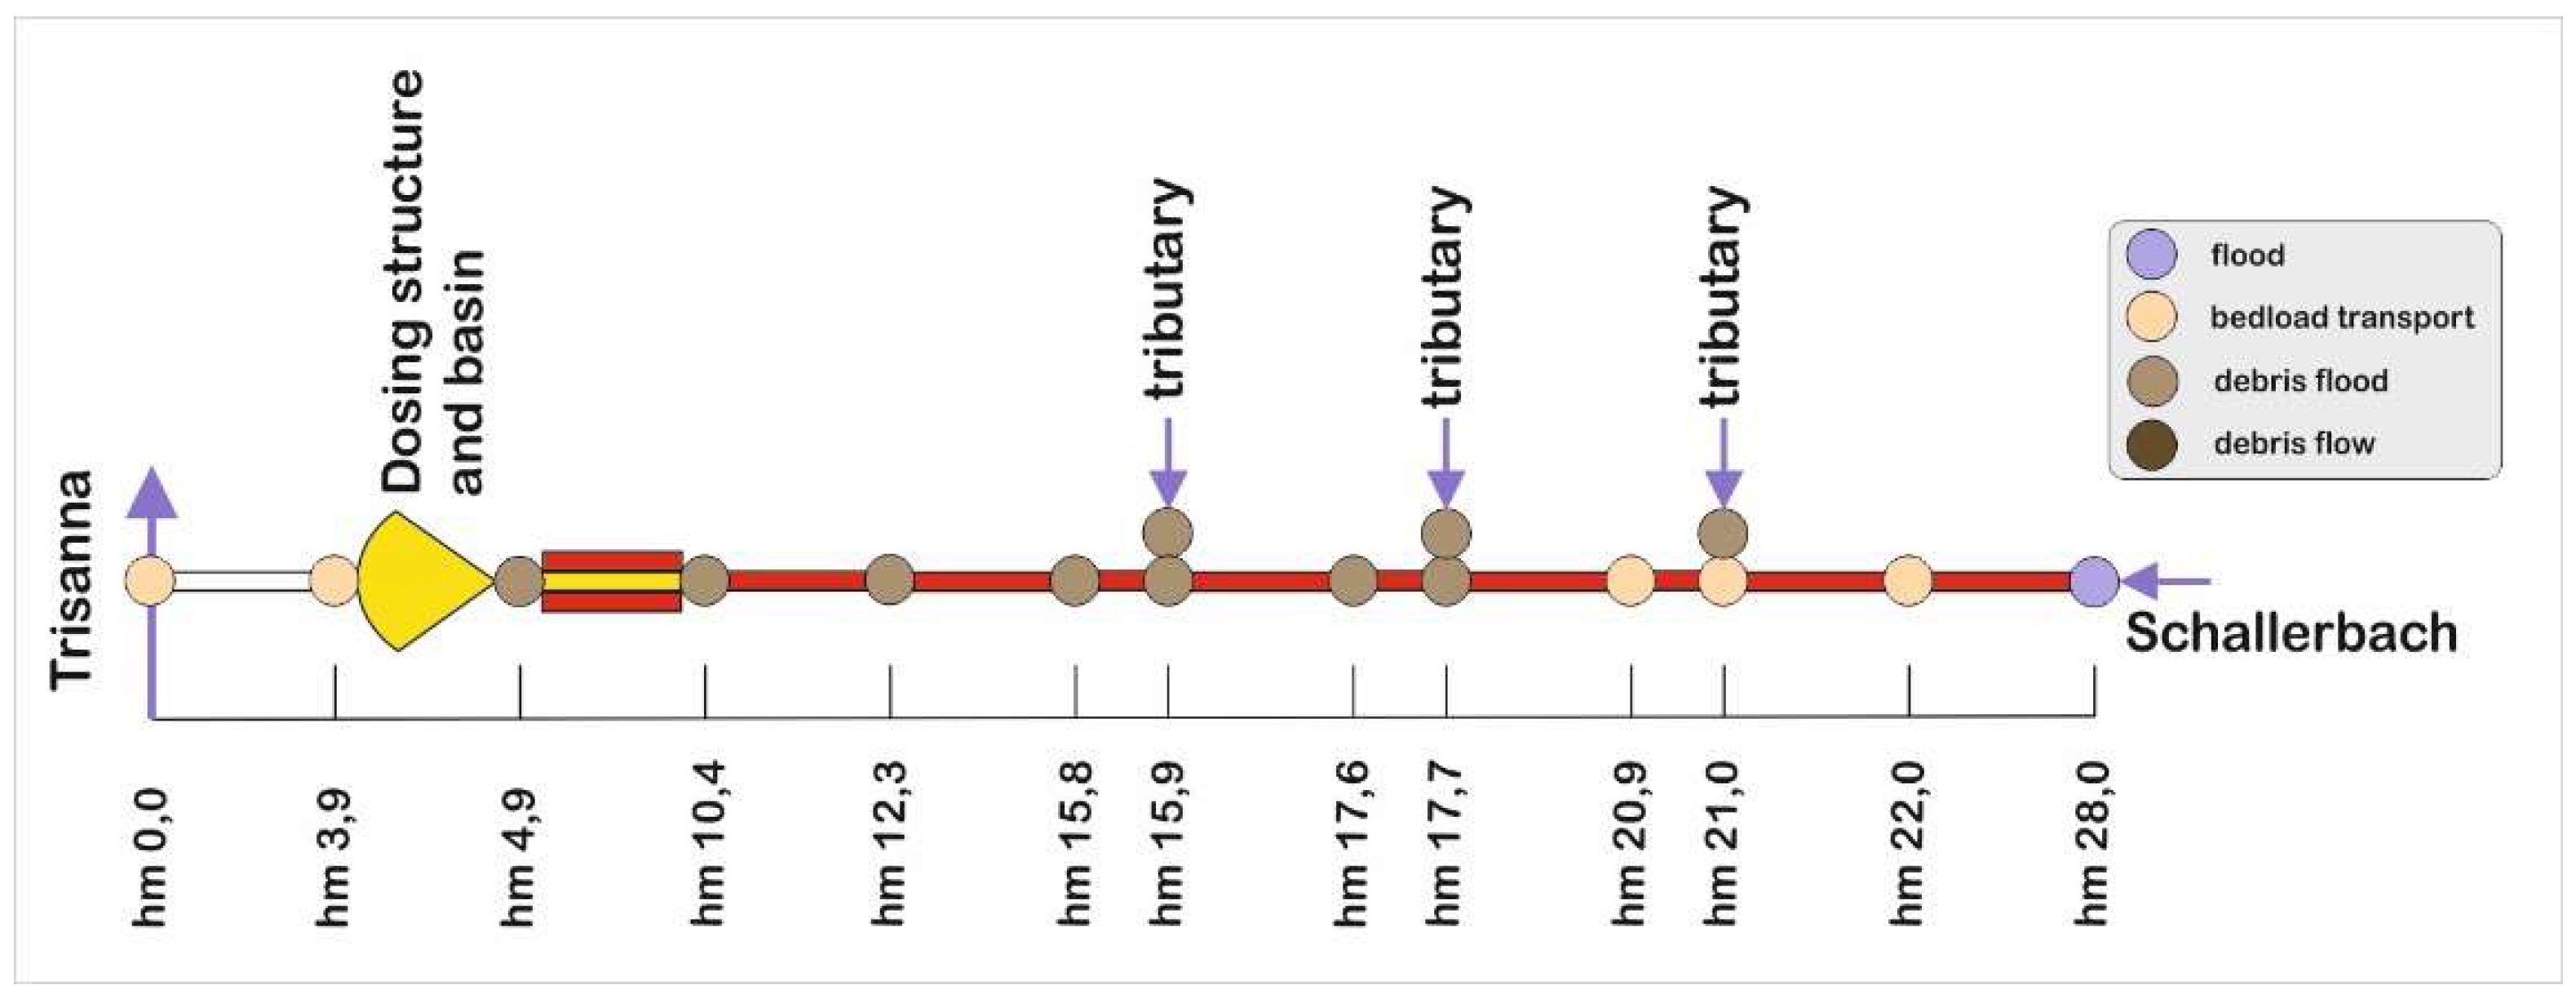
Using the elements of the conceptual drainage network, the situation before and after the landslide can be visualized. Figure 10 shows the situation before 04:00 CET. Due to channel bed erosion, the flood that originated in the headwaters was transformed to a bedload transport process. Downstream of hm 20.9, features of a debris flood were documented. The dosing structure with an associated basin at hm 3.9 retained the main part of the transported sediment, allowing only bedload transport to develop downstream of the structure. The system state I remained unchanged.
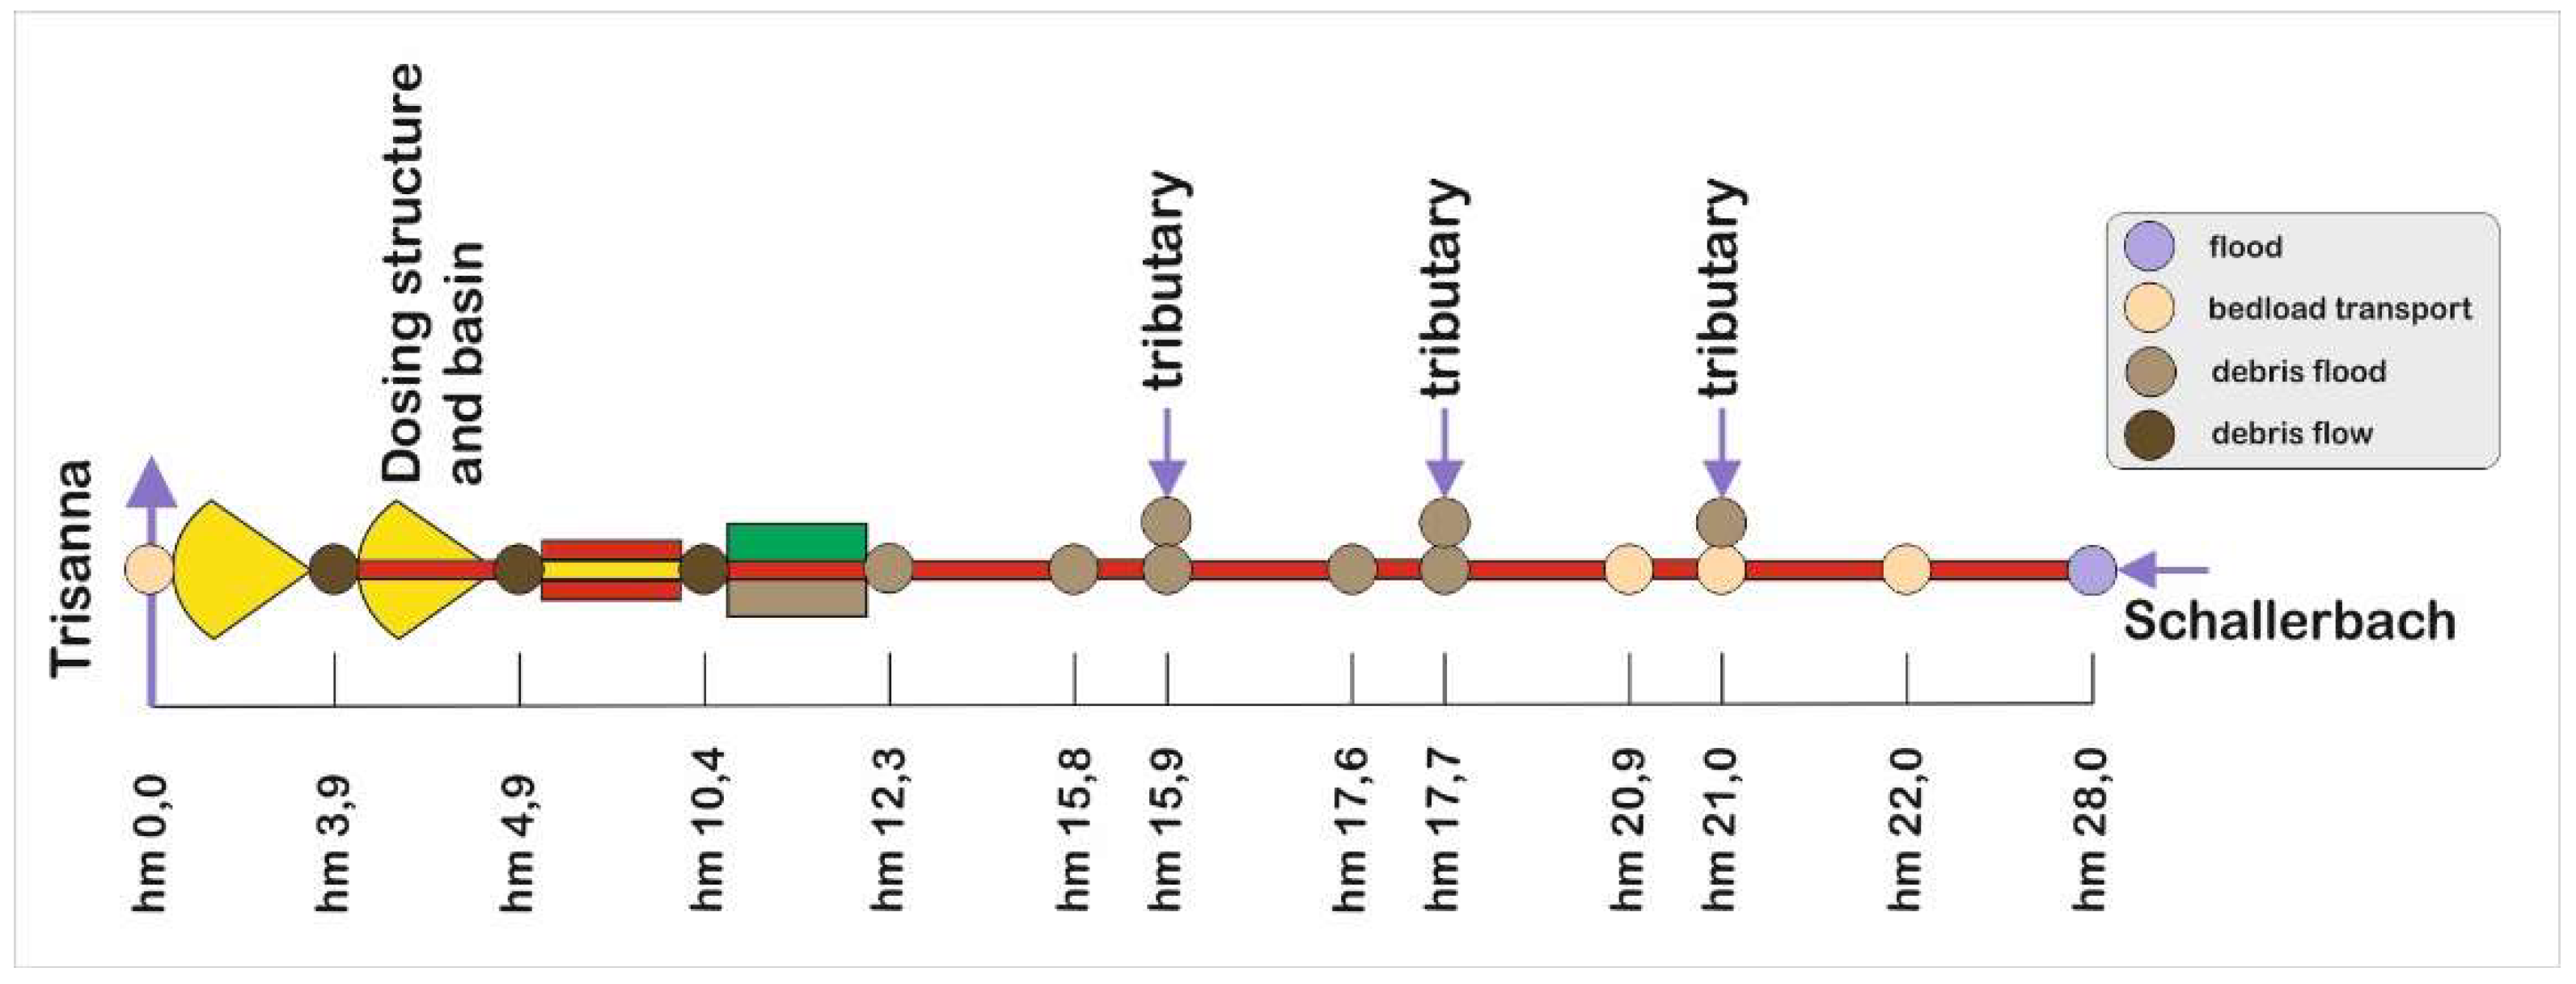
The landslide at approximately 04:00 CET initiated a debris flow at hm 10.4 (Figure 11), leading to system state II. The flow overtopped the basin, initiated a breach in the earth dam of the basin, and led to debris deposition on the fan. The last section to the receiving river Trisanna experienced only bedload transport.
For this case study, the chosen mitigation strategy encompassed a shift of the transition from state I to II at lower frequencies together with a decrease of the magnitude in state II (Figure 6b). This was achieved by a combination of the functions consolidation, energy dissipation, channeling and stabilization (Figure 12). To decrease the impact of a possible debris flow in the near future, an energy dissipation structure was built first in the year after the event. Within the next decade, after finalizing the consolidation structures upstream, the function of the dissipation structure will change from dissipation to dosing. With the help of these measures, the dominant flow process is expected to be transformed to bedload transport and the sediment budget will decrease to 10,000 m3, which will be transported by an enlarged and stabilized channel to the receiving river.
8. Discussion and Conclusions
The proposed conceptual framework cannot deliver new results. It simply permits researchers to step back and revisit traditional approaches to designing mitigation measures. It is worth spending some time to address the issue regarding the disposition of a torrential catchment with respect to the transition of the system states. The analysis of historical data from chronicles or event cadasters can help to quantify the occurrence of water or debris dominant flows. The conceptual drainage network along with the sediment budget procedure facilitates the comparison of homogeneous reaches in different environmental settings with respect to erosion and deposition of sediment, based on event documentation. Along with other parameters such as channel gradient or sediment composition of the debris sources, a dataset can be produced that helps to compare observed data with estimated field data and finally to assess the degree of uncertainty of sediment budget assessment. These considerations combined with the assignment of flow process types act eventually as a base for the application of numerical models and, of course, for the design of mitigation measures. The suggested functions interact with the homogeneous reaches, modify their characteristics inside the torrential system, and hence lead to a major alteration of the disposition of the watershed as well as of the magnitude of a torrential event. The proposed simplified illustration of the catchment characteristic with symbols eases the dissemination of the results of either the documentation or the mitigation strategy to the community stakeholders and involved engineers. Although it has been successfully tested in several event documents, the conceptual framework is open to the implementation of further improvements.
Funding
This research received no external funding.
Acknowledgments
The author would like to express his very great appreciation to his colleagues from the Institute of Mountain Risk Engineering, BOKU, Vienna for their valuable and constructive suggestions within the last few years, allowing the development of this work’s fundamentals. His grateful thanks are extended to R. Kaitna for his support in proofreading this manuscript. The author would also like to thank the staff of the Austrian Torrent and Avalanche Control for enabling him to be involved in the event documentation of torrential disasters for nearly twenty years.
Conflicts of Interest
The author declares no conflict of interest.
References
- Aulitzky, H. Preliminary two-fold classification of torrents. In Proceedings of the INTERPRAEVENT Internationales Symposium, Bad Ischl, Austria, 8–12 September 1980; Volume 4, pp. 285–309. [Google Scholar]
- Aulitzky, H. Die neue, vorläufige zweigeteilte Wildbachklassifikation; Wildbach- und Lawinenverbau: Innsbruck, Austria, 1984; pp. 8–60. (In German) [Google Scholar]
- Costa, J.E. Physical geomorpholgy of debris flows. In Developments and Applications in Geomorphology; Costa, J.E., Fleisher, P.J., Eds.; Springer: Berlin, Germany, 1984; pp. 268–317. [Google Scholar]
- Hungr, O.; Evans, S.; Bovis, M.; Hutchinson, J. A review of the classification of landslides of the flow type. Environ. Eng. Geosci. 2001, 7, 221–238. [Google Scholar] [CrossRef]
- Austrian Standards International. Protection Works for Torrent Control—Terms and their Definitions as well as Classification; Austrian Standards International: Vienna, Austria, 2009. [Google Scholar]
- Kienholz, H. Gefahrenbeurteilung und–Bewertung–Auf Dem Weg Zu Einem Gesamtkonzept; Zeitschrift f. Forstwesen: Zürich, Switzerland, 1995; pp. 701–725. (In German) [Google Scholar]
- Bergmeister, K.; Suda, J.; Hübl, J.; Rudolf-Miklau, F. Schutzbauwerke gegen Wildbachgefahren: Grundlagen, Entwurf und Bemessung, Beispiele; Ernst&Sohn: Berlin, Germany, 2009. (In German) [Google Scholar]
- ETALP. Erosion, Transport in Alpinen Systemen, Gesamtheitliche Erfassung und Bewertung von Erosions- und Transportvorgängen in Wildbacheinzugsgebieten, Handbuch Detailebene; Lebensministerium: Wien, Österreich, 2003; 126p. (In German) [Google Scholar]
- Frick, E. SEDEX (SEDiments and EXperts) Entwicklung einer Praxistauglichen Methode zur Beurteilung der Geschiebe-Szenarien in Wildbächen. Ph.D. Dissertation, Philosophisch-Naturwissenschaftliche Fakultät der Universität Bern, Bern, Schweiz, October 2003. (In German). [Google Scholar]
- Spreafico, M.; Lehmann, C.; Naef, O. Empfehlung zur Abschätzung von Feststofffrachten in Wildbächen; Mitteilungen der Arbeitsgruppe für operationelle Hydrologie: Bern, Schweiz, 1996; Volume 4. (In German) [Google Scholar]
- Hoffmann, L. Die Geröllfrachten in Wildbächen; Wildbach-und Lawinenverbau: Innsbruck, Austria, 1969; pp. 39–48. (In German) [Google Scholar]
- Kronfellner-Kraus, G. Extreme Feststofffrachten und Grabenbildungen von Wildbächen. In Proceedings of the INTERPRAEVENT International Symposium, Villach, Österreich, 5–8 June 1984; Volume 2, pp. 109–118. (In German). [Google Scholar]
- D’Agostino, V.; Cerato, M.; Coali, R. Il Trasporto Solido di Eventi Estremi nei Torrenti del Trentino Orientale. In Proceedings of the INTERPRAEVENT Internationales Symposium, Garmisch-Partenkirchen, Germany, 24–28 June 1996; Volume 1, pp. 377–386. (In German). [Google Scholar]
- Rickenmann, D.; Koschni, A.; Chiari, M.; Scheidl, C.; Canuto, N. Abschätzung von Feststofffrachten in Wildbächen und Gebirgsflüssen. In Ereignisanalyse Hochwasser 2005. Teil 2; BAFU/WSL: Bern, Schweiz, 2008; pp. 152–162. (In German) [Google Scholar]
- Bertschi, W.; Hunziker, G.; Kienholz, H. Empirische Modelle zur Geschiebeabschätzung. In Proceedings of the INTERPRAEVENT Internationales Symposium, Dornbirn, Austria, 26–30 May 2008; Volume 1, pp. 261–269. (In German). [Google Scholar]
- Gertsch, E. Geschiebelieferung Alpiner Wildbachsysteme bei Grossereignissen—Ereignisanalysen und Entwicklung eines Abschätzverfahrens. Ph.D. Dissertation, Philosophisch-naturwissenschaftlichen Fakultät der Universität Bern, Bern, Schweiz, March 2009. (In German). [Google Scholar]
- Zollinger, F. Debris Detention Basins in the European Alps. In Proceedings of the International Symposium on Erosion, Debris Flow and Disaster Prevention, Tsukuba, Japan, 3–5 September 1985; pp. 433–438. [Google Scholar]
- Hübl, J.; Fiebiger, G. Debris-Flow Mitigation Measures. In Debris-Flow Hazards and Related Phenomena; Jakob, M., Hungr, O., Eds.; Praxis Books in Geophysical Sciences; Springer: Berlin, Germany, 2005; pp. 445–487. [Google Scholar]
- Kienholz, H. Early Warning Systems Related to Mountain Hazards. In Early Warning Systems for Natural Disaster Reduction; Zschau, J., Küppers, A., Eds.; Springer: Berlin, Germany, 2003; pp. 555–564. [Google Scholar]
- Demontzey, P. Studien über die Wiederbewaldung und Berasung der Gebirge; Carl Gerold´s Sohn: Wien, Österreich, 1880. (In German) [Google Scholar]
- Aulitzky, H. Der Enterbach (Inzing in Tirol) am 26. Juli 1969, Versuch einer Analyse eines Murganges als Grundlage für die Neuerstellung einer Zerstörten Wildbachverbauung; Wildbach- und Lawinenverbau: Innsbruck, Austria, 1970; pp. 31–66. (In German) [Google Scholar]
- Hübl, J.; Ganahl, E.; Holzinger, G.; Moser, M.; Pichler, A. Dokumentation und Analyse des Ereignisses vom 17. Juli 02 am Fischbach; IAN-Report 87 Band 1; Institut für Alpine Naturgefahren, Universität für Bodenkultur: Wien, Österreich, 2003. (In German) [Google Scholar]
- Hübl, J. Hochwasser Simbach 2016: Dokumentation und Analyse. In Vorsorgender und nachsorgender Hochwasserschutz; Heimerl, S., Ed.; Springer Fachmedien Wiesbaden: Wiesbaden, German, 2018; pp. 210–216. [Google Scholar]
- Horvath, A. The Stože Landslide and Predelica Torrent Debris Flow. In Proceedings of the INTERPRAEVENT Internationales Symposium, Riva del Garda, Italy, 24–28 May 2004; Volume 4, pp. 77–87. (In Italian). [Google Scholar]
- Hübl, J. Strategy of Protection. In Risques Torrentiels; Didier, R., Zanolini, F., Eds.; Université Européenne d’Eté sur les Risques Naturels: Grenoble, France, 2001. [Google Scholar]
- Hübl, J.; Beck, M.; Zöchling, M.; Moser, M.; Kienberger, C.; Jenner, A.; Forstlechner, D. Ereignisdokumentation 2015; IAN-Report 175 Band 1; Institut für Alpine Naturgefahren, Universität für Bodenkultur: Wien, Österreich, 2016. (In German) [Google Scholar]
Figure 1.
Magnitude-frequency relationship for discharges in torrents in system state I.

Figure 2.
Magnitude-frequency relationship for discharges in torrents in system state II: (a) transition from system state I to II according to a low disposition to generate debris dominant flows; (b) transition from system state I to II according to a high disposition to generate debris dominant flows.

Figure 3.
Available elements for each homogeneous channel reach.

Figure 4.
Principle of sediment budget interpretation.

Figure 5.
Classification of mitigation measures in torrential catchments, based on [7].
Figure 5.
Classification of mitigation measures in torrential catchments, based on [7].

Figure 6.
Possible adaptation of the magnitude–frequency relationships through mitigation measures: (a) solely shift of the transition; (b): shift of the transition and lowering the magnitude in system state II and (c) total transition from system II into state I.
Figure 6.
Possible adaptation of the magnitude–frequency relationships through mitigation measures: (a) solely shift of the transition; (b): shift of the transition and lowering the magnitude in system state II and (c) total transition from system II into state I.

Figure 7.
System transitions due to failure of mitigation structures or exceptional torrential events with cascading effects: (a) possible transition due to failure of structural measures for event management; (b) possible transition due to failure of structural measures for disposition management.
Figure 7.
System transitions due to failure of mitigation structures or exceptional torrential events with cascading effects: (a) possible transition due to failure of structural measures for event management; (b) possible transition due to failure of structural measures for disposition management.

Figure 8.
Location map of Schallerbach catchment (data source: Austrian Torrent and Avalanche Control).
Figure 8.
Location map of Schallerbach catchment (data source: Austrian Torrent and Avalanche Control).

Figure 9.
Comparative airborne laser scans before and after the event: (a) DEM of the year 2012, (b) DEM 2015, and (c) difference of the DEMs showing the landslide area (data source: Austrian Torrent and Avalanche Control).
Figure 9.
Comparative airborne laser scans before and after the event: (a) DEM of the year 2012, (b) DEM 2015, and (c) difference of the DEMs showing the landslide area (data source: Austrian Torrent and Avalanche Control).

Figure 10.
Conceptual drainage network for Schallerbach before 8 June 2015 04:00 CET.

Figure 11.
Conceptual drainage network for Schallerbach after 8 June 2015 04:00 CET, showing the effect of the landslide to the drainage network and to the dominant flow processes.
Figure 11.
Conceptual drainage network for Schallerbach after 8 June 2015 04:00 CET, showing the effect of the landslide to the drainage network and to the dominant flow processes.

Figure 12.
Sediment budget for Schallerbach: (a) after the 8 June 2015 event and (b) after the completion of mitigation work.
Figure 12.
Sediment budget for Schallerbach: (a) after the 8 June 2015 event and (b) after the completion of mitigation work.


Table 1.
Characteristic features of flow processes in torrents [5].
Table 1.
Characteristic features of flow processes in torrents [5].
| Flow Type | Flood | Debris Flow | ||
|---|---|---|---|---|
| Movement type | Water dominant flow (fluvial) | Debris dominant flow | ||
| Flow process | Flood | Bedload transport | Debris flood | Debris flow |
| Flow behavior | Newtonian | Newtonian | Close to Newtonian | Non-Newtonian |
| Vol. sediment concentration | <1% | 0–20% | 20–40% | >40% |
| Grain size (max.) | mm-cm | -dm | -m | -m |
| Bulk density | 1000 kg/m3 | <1300 kg/m3 | 1300–1700 kg/m3 | >1700 kg/m3 |
| Determination of water discharge possible | yes | restricted | no | no |
| Determination of rating curves possible | yes | yes | no | no |
| Q (max)/Q (flood) | 1 | 1 | 1–2 | 2–10 |
| Viscosity | 0.001–0.01 Pa.s | 0.01–0.2 Pa.s | 0.2–2 Pa.s | >2 Pa.s |
| Shear strength | none | none | none | yes |
| Relevant stresses | turbulence, shear stress | turbulence, shear stress | buoyancy, turbulence, shear stress, collisional forces | buoyancy, viscose, collisional and frictional forces |
| Vertical distribution of sediment | close to channel bed (rolling, jumping, sliding); fine sediment suspended along height | close to channel bed (rolling, jumping, sliding); fine sediment suspended along height | bedload and fine sediment distributed along the height | sediment suspended along the height |
| Deposition pattern | layered deposits | sorted bars and lobes | bars and lobes, mostly clast-supported, coarse sediment up to maximum flow depth | coarse fronts, levees and lobes, clast- or matrix-supported, sharp borders of depositions, U-shaped cross-sections |
| Sorting of depositions | yes | yes | occasionally | no (sometimes inverse grading) |
| Damage due to | water and suspended sediment | water, suspended and fine sediment | sediment and water | sediment-water mixture |
Table 2.
Debris flow triggering rainfall thresholds at the Lattenbach, Landeck, Tyrol (data source: Institute of Mountain Risk Engineering, BOKU, Vienna). CET: Central European Time.
Table 2.
Debris flow triggering rainfall thresholds at the Lattenbach, Landeck, Tyrol (data source: Institute of Mountain Risk Engineering, BOKU, Vienna). CET: Central European Time.
| Onset of Debris Flow (CET) | Triggering Rainfall (mm) | Duration of Rainfall (min) | Max. Discharge (m3/s) | Debris Flow Volume (m3) |
|---|---|---|---|---|
| 16.08.2015 15:49:00 | 3.4 | 120 | 12 | 5000 |
| 09.08.2015 23:01:00 | 4.7 | 30 | 65 | 18,500 |
| 30.07.2017 17:26:00 | 6.8 | 110 | 87 | 41,000 |
| 10.09.2016 18:54:00 | 17.1 | 100 | 143 | 46,000 |
| 09.08.2015 20:03:00 | 23.8 | 110 | 47 | 12,000 |
| 29.07.2017 18:29:00 | 34.3 | 110 | 60 | 14,000 |
| 20.06.2007 17:02:00 | 42.4 | 80 | 200 | 22,000 |
© 2018 by the author. Licensee MDPI, Basel, Switzerland. This article is an open access article distributed under the terms and conditions of the Creative Commons Attribution (CC BY) license (http://creativecommons.org/licenses/by/4.0/).
Share and Cite
MDPI and ACS Style
Hübl, J. Conceptual Framework for Sediment Management in Torrents. Water 2018, 10, 1718. https://doi.org/10.3390/w10121718
AMA Style
Hübl J. Conceptual Framework for Sediment Management in Torrents. Water. 2018; 10(12):1718. https://doi.org/10.3390/w10121718
Chicago/Turabian StyleHübl, Johannes. 2018. "Conceptual Framework for Sediment Management in Torrents" Water 10, no. 12: 1718. https://doi.org/10.3390/w10121718
Note that from the first issue of 2016, this journal uses article numbers instead of page numbers. See further details here.