Inclusion of Modified Snow Melting and Flood Processes in the SWAT Model
by
 , , , , and
Yongchao Duan
1,2,3,4,5 ,
,
Tie Liu
1,*,
Fanhao Meng
1,3,
Min Luo
1,3,
Amaury Frankl
2,6,
Philippe De Maeyer
2,3,4 ,
,
Anming Bao
1,
Alishir Kurban
1,4,5 and
Xianwei Feng
1 1
State Key Laboratory of Desert and Oasis Ecology, Xinjiang Institute of Ecology and Geography, Chinese Academy of Sciences, Urumqi 830011, China
2
Department of Geography, Ghent University, 9000 Ghent, Belgium
3
College of Resources and Environment, University of Chinese Academy of Science, Beijing 100049, China
4
Sino-Belgian Joint Laboratory of Geo-information, Urumqi 830011, China
5
Sino-Belgian Joint Laboratory of Geo-information, 9000 Ghent, Belgium
6
Research Fund Flanders (FWO), 1000 Brussels, Belgium
*
Author to whom correspondence should be addressed.
Water 2018, 10(12), 1715; https://doi.org/10.3390/w10121715
Submission received: 8 November 2018
/
Revised: 19 November 2018
/
Accepted: 20 November 2018
/
Published: 23 November 2018
(This article belongs to the Special Issue Flood Modelling: Regional Flood Estimation and GIS Based Techniques)
Abstract
:Flooding, one of the most serious natural disasters, poses a significant threat to people’s lives and property. At present, the forecasting method uses simple snowmelt accumulation and has certain regional restrictions that limit the accuracy and timeliness of flood simulation and prediction. In this paper, the influence of accumulated temperature (AT) and maximum temperature (MT) on snow melting was considered in order to (1) reclassify the precipitation categories of the watershed using a separation algorithm of rain and snow that incorporates AT and MT, and (2) develop a new snow-melting process utilizing the algorithm in the Soil and Water Assessment Tool Model (SWAT) by considering the effects of AT and MT. The SWAT model was used to simulate snowmelt and flooding in the Tizinafu River Basin (TRB). We found that the modified SWAT model increased the value of the average flood peak flow by 43%, the snowmelt amounts increased by 45%, and the contribution of snowmelt to runoff increased from 44.7% to 54.07%. In comparison, we concluded the snowmelt contribution to runoff, flood peak performance, flood process simulation, model accuracy, and time accuracy. The new method provides a more accurate simulation technique for snowmelt floods and flood simulation.
1. Introduction
Most rivers in the world originate in high mountain areas where a large amount of water is stored in the form of snow and glaciers. In high snow and glacier catchments, melting water provides a more significant contribution to the discharge than rain [1,2,3]. This is especially true in the mountainous watershed of arid inland regions, where rivers enter the wet season when the spring snowmelt begins [4,5], and they enter the dry season at the end of the autumn snow melting. In mid- and high latitudes, snowmelt generally provides about 80% of the annual surface runoff [6]. Approximately one-sixth of the world’s population is distributed around rivers originating from snowmelt [7]. These rivers serve as water sources for agricultural, industrial, and municipal uses [8], but the frequent occurrence of snowmelt floods poses a serious threat to natural and socioeconomic systems. According to recent statistics, the number of deaths due to mountain torrents accounted for approximately 70% of the deaths due to floods [9,10], and associated disaster losses accounted for more than 50% of the total [11,12]. In association with climate change [13], the frequency of extreme weather, including hydrological events with larger ranges and greater severity, has increased significantly over the recent years [14,15,16]. Snowmelt runoff is an important source of water during the spring flood season in inland arid regions and a significant driving force for catastrophic floods. Therefore, the prediction of snowmelt runoff is of great importance for river flood control. To reduce or avoid the disasters and losses caused by flooding, it is necessary to study the entire snow-melting and flood process [17].
Mountainous areas with complex terrain are widely distributed in the Xinjiang region [18,19,20]. During the spring, temperatures warm significantly, with a corresponding increase in the frequency of flooding [21]. Through the analysis of daily flow observations at the Jiangka hydrometric station, it has been concluded that situations with “one day, one peak” and even “one day, multiple peaks” occur due to the melting of mountain snow [22,23]. Many models with snowmelt modules have been developed [24,25,26,27,28,29], including empirical models, conceptual models, physically based models, and distributed hydrological models. Calculation methods range from complex energy balance [30] to degree-day and water balance [31,32,33]. J. Herrero et al. developed a mass and energy balance snowmelt point model by adding a new atmospheric emissivity expression, which increased the evaporation accuracy during episodes of high winds, low relative humidity, and low temperatures [34]. However, the required data accuracy of this approach is more stringent. Georg Jost et al. used the functions obtained from snow albedo measurements and a modified canopy transmittance function to replace the internal albedo decay functions of the Distributed Hydrology Soil Vegetation Model (DHSVM) (Version, supplier, city, state, country); following this modification, the simulated albedo decay and canopy transmittance processes improved significantly [17]. However, the modified model was found to underestimate the influence of the slope aspect on snow accumulation and snowmelt. Yu et al. used the Fast All-season Soil Strength (FASST) model (Version, supplier, city, state, country) to calculate the snowmelt of alpine areas in China, and to evaluate and verify its applicability. However, when employing this method, it is necessary to rate numerous parameters, which increases its difficulty of use. Finally, when FASST was integrated into the SWAT model (Version, supplier, city, state, country) for snowmelt calculations, its accuracy improved [35]. However, even though this model association is straightforward, the integration of FASST into the SWAT model does not improve the SWAT model structure, and thus it increases the workload. The Soil Water Assessment Tool [36,37,38] (SWAT) is a distributed watershed hydrological model with physical mechanisms developed by the US Department of Agriculture and it is based on the Simulator for Water Resources in Rural Basins (SWRRB) model [23,39,40,41]. The SWAT model, which utilizes fewer parameters and less input data, is currently used to evaluate distributed snowmelt and runoff formation in snow watersheds [42].
In the SWAT model, the degree-day factor method is used to calculate snow melt [43,44,45]. That is, when the average temperature on a given day exceeds the snow-melting temperature threshold, snow begins to melt. However, only the daily average temperature is used as the temperature condition for snowmelt, which ignores the effect of AT on energy accumulation [46]. In addition, it is too simplistic and idealistic to only use the average temperature to determine precipitation conditions, as this approach lacks the accurate judgment of precipitation type yielded by including the AT [47,48]. Fontaine et al. developed algorithms that use elevation bands to distribute temperature and precipitation with altitude. However, this technique is still based on the traditional degree-day factor method [37]. Meng et al. integrated a distributed snowmelt runoff model based on physical processes into the SWAT model, and although the results improved to some extent, the required data and parameters increased significantly [49]. This makes it difficult to meet all of the data conditions in mountainous areas with complex terrain. Yu et al. integrated the Fast All-season Soil Strength model (FASST) into the SWAT model. This provided the calculation method for improving the snowmelt runoff but it increased the workload. In addition, the two models were not actually embedded together [35]. Luo et al. increased the ice-melting module in comparison with the snow-melting module of the SWAT model for the special geographical conditions found in the arid, mountainous areas of China [8]. Although it compensates for the simulation of the melting process, this algorithm still relies on the traditional degree-day factor method, which continues to reduce simulation accuracy.
Related attempts at enhancing these models have neglected improvements to the determination of precipitation type, thus ignoring the improvement of the traditional degree-day factor method. Therefore, based on the existing research, the determination of precipitation type was added in this study, and the temperature condition of the traditional degree-day factor method was modified. The objectives of this investigation included (1) differentiating rain and snow in overall precipitation by enhancing the temperature condition with the addition of AT, thus improving the accuracy of precipitation type determination in the original model; (2) improving the temperature condition of the traditional degree-day factor method by adding an AT judgment condition and modifying the parameter set, which would improve the simulation accuracy of the model; and (3) analyzing the simulation accuracy of the modified model, the calculation of snow-melting capacity, and the contribution of snowmelt to river runoff.
2. Study Site and Materials
2.1. Study Area
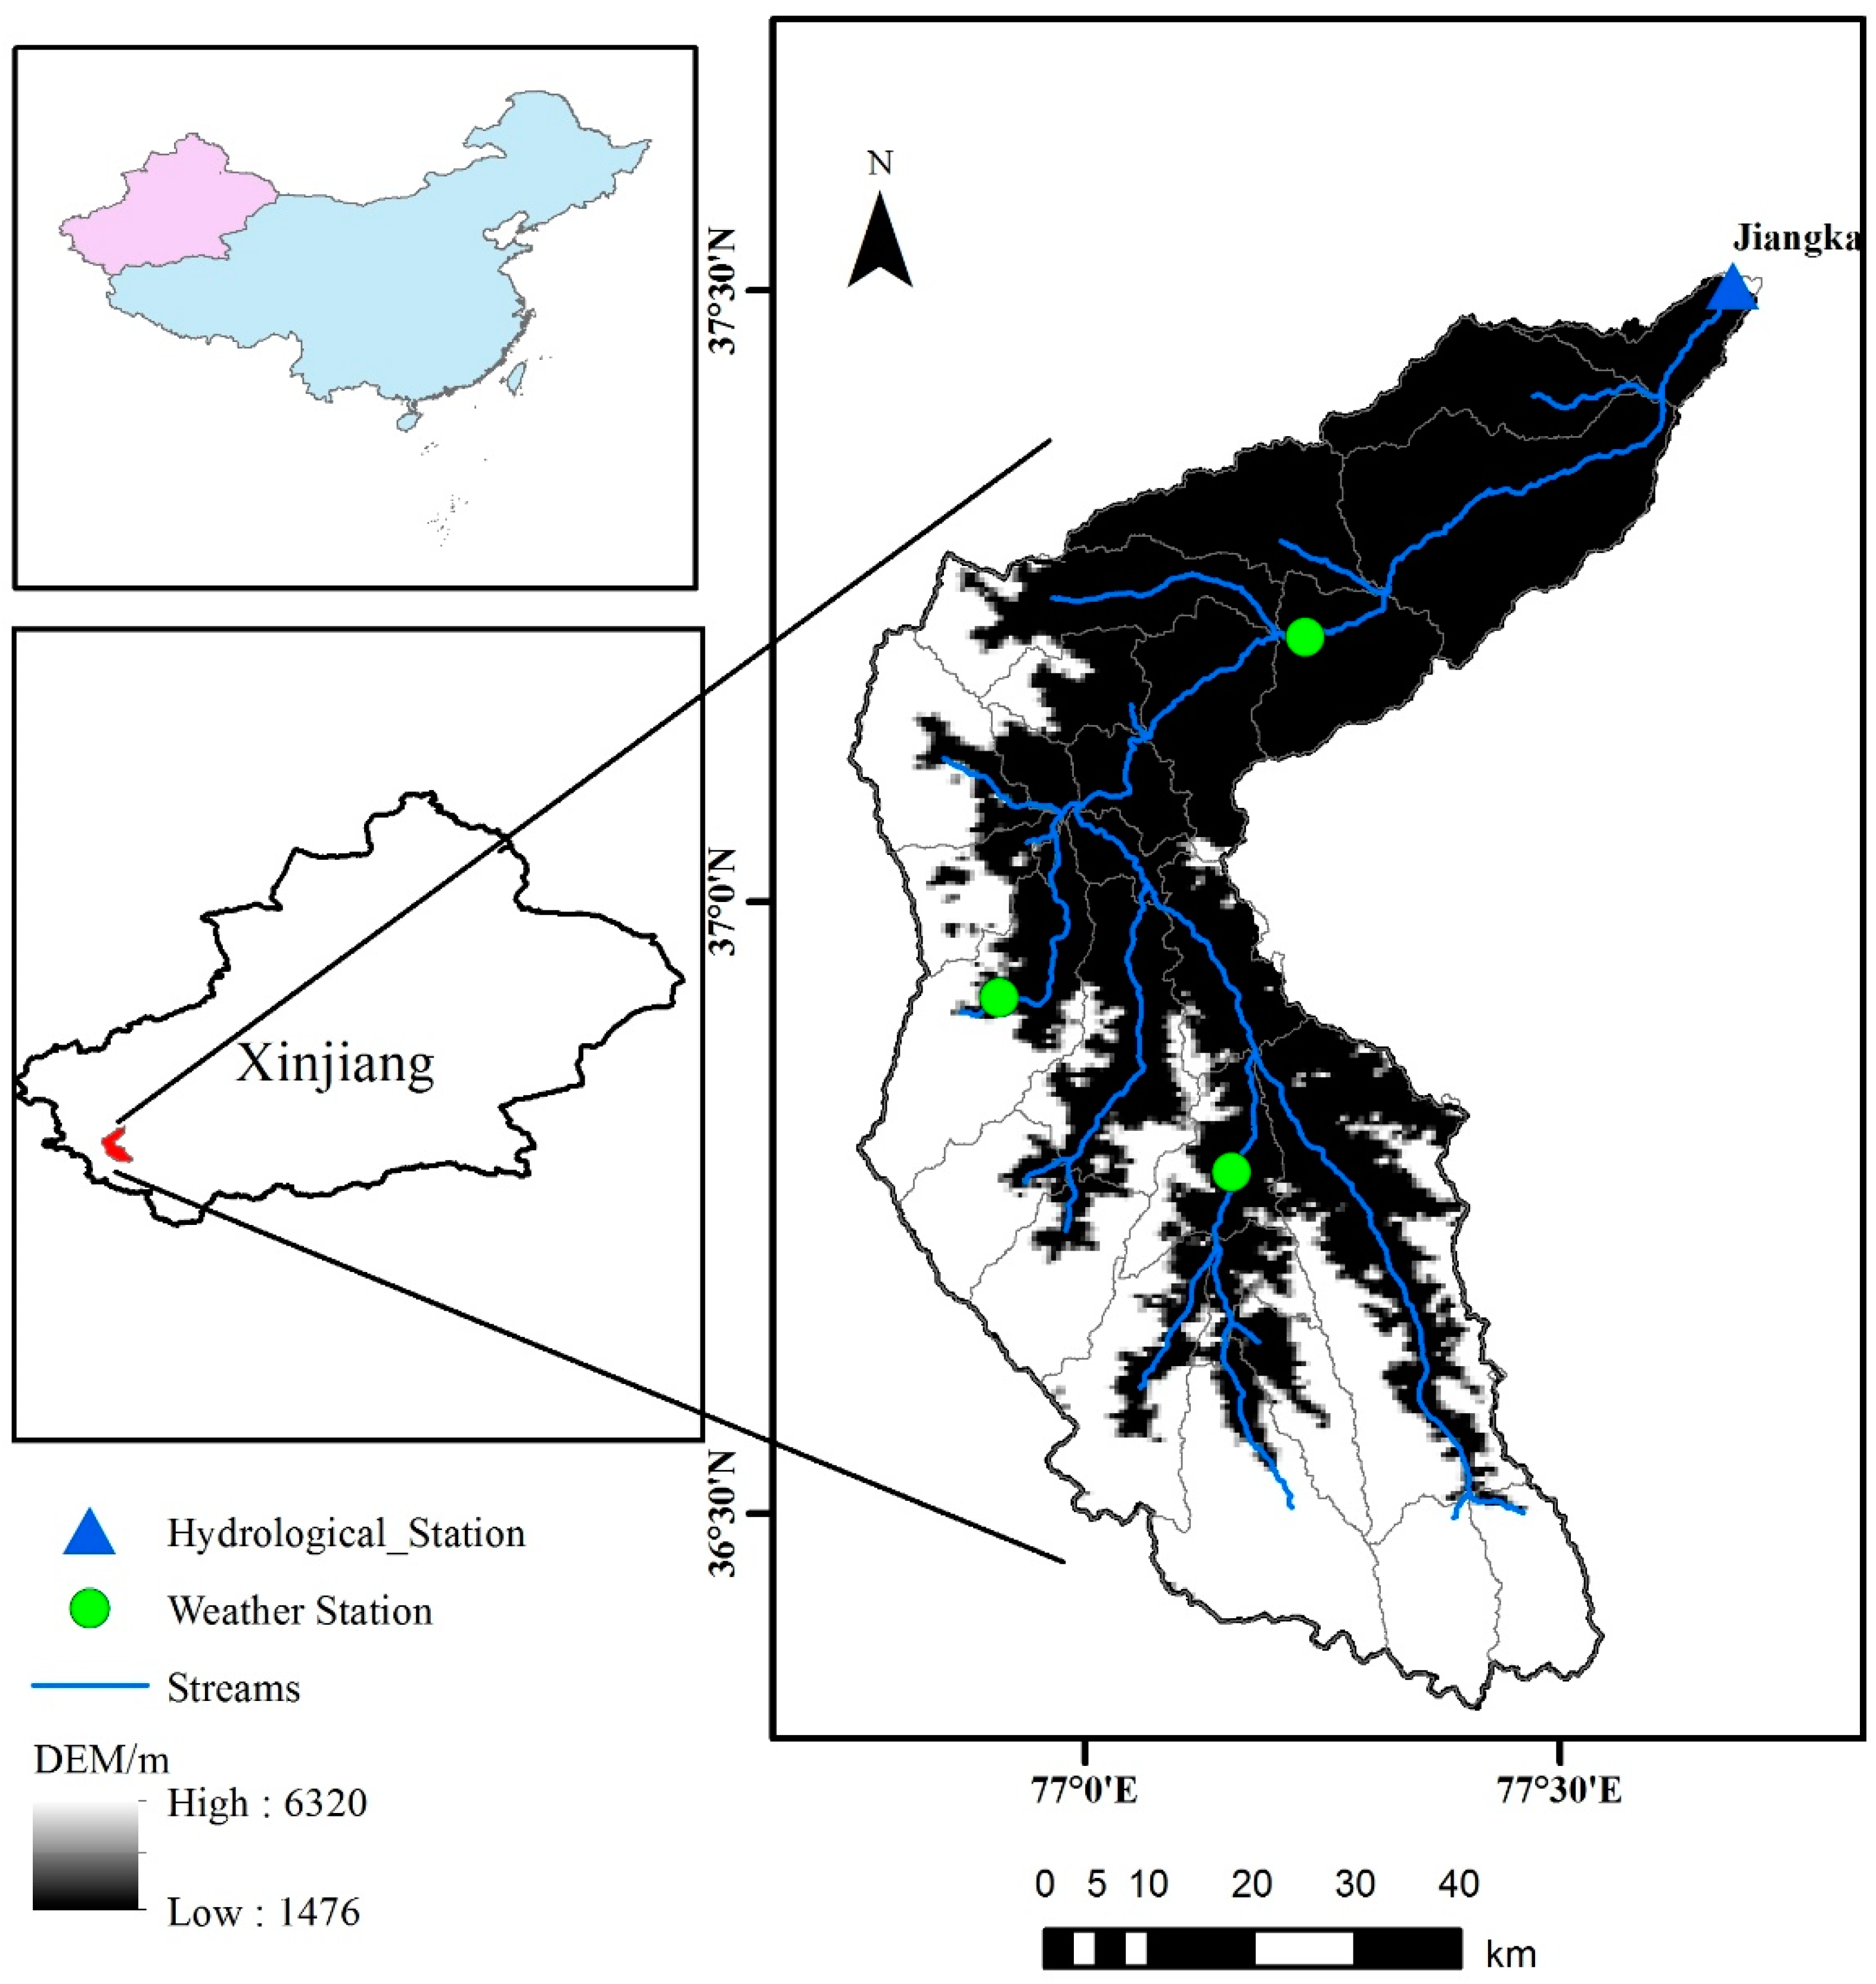
The Tizinafu River originates in the Keerake Daban region on the northern slopes of the Kunlun Mountains (Figure 1). The total catchment area is 5.6 × 10³ km2, and the length of the river is 335 km. In the river basin, the elevation ranges from 1476 m to 6320 m. There are a large number of modern continental glaciers, as well as a large amount of permanent snow cover and seasonal snow cover, in the catchment area [21].
The average daily temperature of the Tizinafu River Basin (TRB) is 6.71 °C, and the average daily precipitation is 0.6 mm. In March, temperatures begin to rise, and snowmelt, along with associated river runoff, starts to increase. During the summer, precipitation in the mountainous areas increases, significantly increasing river runoff. Snowmelt gradually comes to an end in October, when mountain temperatures and precipitation begin to decrease. Thus, the annual flood season generally runs from March to October. According to hydrological site observation data, the average annual runoff of the TRB is 35.22 m3·s−1. The average snow cover areas of the snow-melting and non-snow-melting seasons are 717.81 and 1203.47 km2, respectively.
2.2. Materials
A watershed SWAT model was constructed using land cover data, digital elevation models (DEMs), soil classifications, and meteorological data, as well as precipitation type event statistics. The DEM data had a resolution of 30 m and was downloaded from the Shuttle Radar Topography Mission (SRTM) official website (http://srtm.csi.cgiar.org/). Land use data was obtained from visual interpretation of the Landsat 8 30-meter resolution remote sensing imagery (https://www.usgs.gov/products/data-and-tools/real-time-data/remote-land-sensing-and-landsat). The soil category data was 30-meter resolution data downloaded from the China Soil Category Data Network (http://vdb3.soil.csdb.cn/). Precipitation type event statistics were derived from statistical data from the National Meteorological Network (http://www.cma.gov.cn/) and the Local Meteorological Network (http://www.weather.com.cn/weather/101130906.shtml).
There are three meteorological stations in the TRB, all at different altitudes (Figure 1). The meteorological data from these stations include the daily maximum temperature (MT), minimum temperature, average temperature, wind speed, wind direction, precipitation, and so forth, from 2010 until the present. The elevations of the Momuke, Kudi, and Xihexiu stations are 1863 m, 2862 m, and 3067 m, respectively. The meteorological data were pre-processed and evaluated, so as to satisfy the standard format of the model. The mean daily MT, minimum temperature, and average temperature of the three stations are 13.36 °C, 0.89 °C, and 7.13 °C, respectively. The daily discharge observation data from 2013–2014 at the Jiangka Station was used as the verification data. The snow cover data was from the MODIS snow product MODA10A2 (2013–2014), which could be employed as both the model input data and the calculation data and was used to determine the corresponding temperature thresholds.
3. Methods
In this study, the daily AT was calculated using the temperature integral method. The AT inflection points of the precipitation type and snow melting were confirmed from snow remote sensing data. In addition, based on the traditional degree-day factor, the determinations of precipitation type, as well as the influence of AT and MT on snow melting, were considered.
3.1. Introduction of the SWAT Model
The SWAT Model (2009, the United States Department of Agriculture, Agricultural Research Service (USDA-ARS), Beltsville, MD, USA) [36] is a physically-based distributed hydrological model [50,51] that uses the soil conservation service (SCS) Runoff Curve Number method to calculate surface runoff, and a relatively simple degree-day factor method to calculate snowmelt runoff. Based on the daily precipitation data, daily temperature data, daily relative humidity data, and wind speed data, the SWAT model simulates hydrological processes, such as surface runoff, snowmelt runoff, lateral flow, and infiltration in a river basin, as well as flows into a river via confluence [37,52,53].
In the SWAT model, hydrologic response units (HRUs) are categorized by vegetation type and soil properties. Runoff is calculated separately from the HRUs, and the total runoff of the entire catchment is then obtained using the hydrological model [54,55]. The basic water balance equation of the water cycle was utilized in the SWAT model:
where is the final soil water content (mm H2O), is the initial soil water content on day i (mm H2O), t is the time (days), is the amount of precipitation on day i (mm H2O), is the amount of surface runoff on day i (mm H2O), is the amount of evapotranspiration on day i (mm H2O), is the amount of water entering the vadose zone from the soil profile on day i (mm H2O), and is the amount of return flow on day i (mm H2O). Based on altitude, each sub-basin was divided into 10 elevation bands. Snowmelt calculation and simulation were performed for each band, and then from one sub-basin to the next. The land use and land cover map data along with the soil type data, each with a resolution of 30 m, were used as the input data and also to define the HRUs.
The snowmelt process is an important part of the water cycle in the SWAT model and it is also an important water recharge source during the alpine spring [56,57]. Snowmelt runoff is derived from the snow cover condition and the temperature threshold of the snowmelt runoff [58], which is calculated as a linear function of the air temperature. Snowmelt runoff is determined using the degree-day factor method, which sets a snow-melting temperature threshold. When the temperature rises by 1 °C, the melted snow water equivalent is a fixed value. When the snow is completely melted, the resulting water forms the vertical depth of the water layer. The equation for melting snow is:
where is the amount of snowmelt on a given day (mm H2O), is the melt factor for the day (mm H2O/°C-day), is the fraction of the HRU area, is the temperature of the snow pack, is the maximum air temperature on a given day (°C), and is the base temperature threshold at which snow melting is allowed (°C).
As the initial condition of snow melting, the snow pack temperature is a function of the mean daily temperature during the preceding days and varies as a dampened function of air temperature [25]. The equation for the snow pack temperature is:
where is the snow pack temperature on a given day (°C), is the snow temperature lagging the snow pack temperature on the previous day (°C), and is the average air temperature on the current day (°C). The lagging factor is used to represent this influence, which is linked to the snow pack density, snow pack depth, exposure, and other factors affecting snow pack temperature. The melt factor is allowed a seasonal variation, with maximum and minimum values occurring on the summer and winter solstices, respectively. The equation used to calculate the melt factor is:
where is the melt factor for 21 June (mm H2O/°C-day), is the melt factor for 21 December (mm H2O/°C-day), and is the day of the year number. The maximum and minimum limits of a city’s snow melt factor range are usually greater than those of the rural areas [59], due to the compression of the snow pack by vehicles, pedestrians, and so forth [60,61].
The Equations (2)–(4) are the original degree-day factor algorithm embedded in the SWAT model. The SWAT model divides each natural sub-basin into multiple elevation zones; moreover, the accumulated snow, sublimation, and snowmelt was proportionally distributed into elevation zones [62]. This method only takes the average temperature as the key factor of snowmelt calculation, which potentially bears certain bias. However, , as fixed parameters based on experience, must be rigorously calibrated. Given this experience-based approach, the snowmelt calculation method in the SWAT model has certain geographical application restrictions. It has good precision in plain areas with abundant precipitation and flat terrain, but it has relatively lower accuracy in mountainous areas with complex terrain.
3.2. The Concept of AT and the Differentiation of Snowfall and Rainfall
In the SWAT model, the determination of precipitation type and snowmelt calculations are primarily based on the daily MT, the average temperature, and the set threshold value, neglecting the AT as an important factor affecting both the precipitation type and the snowmelt process [63]. To address this shortcoming, we proposed a new method for calculating the differentiation of rain and snow, the basic principle and formula of which are described below.
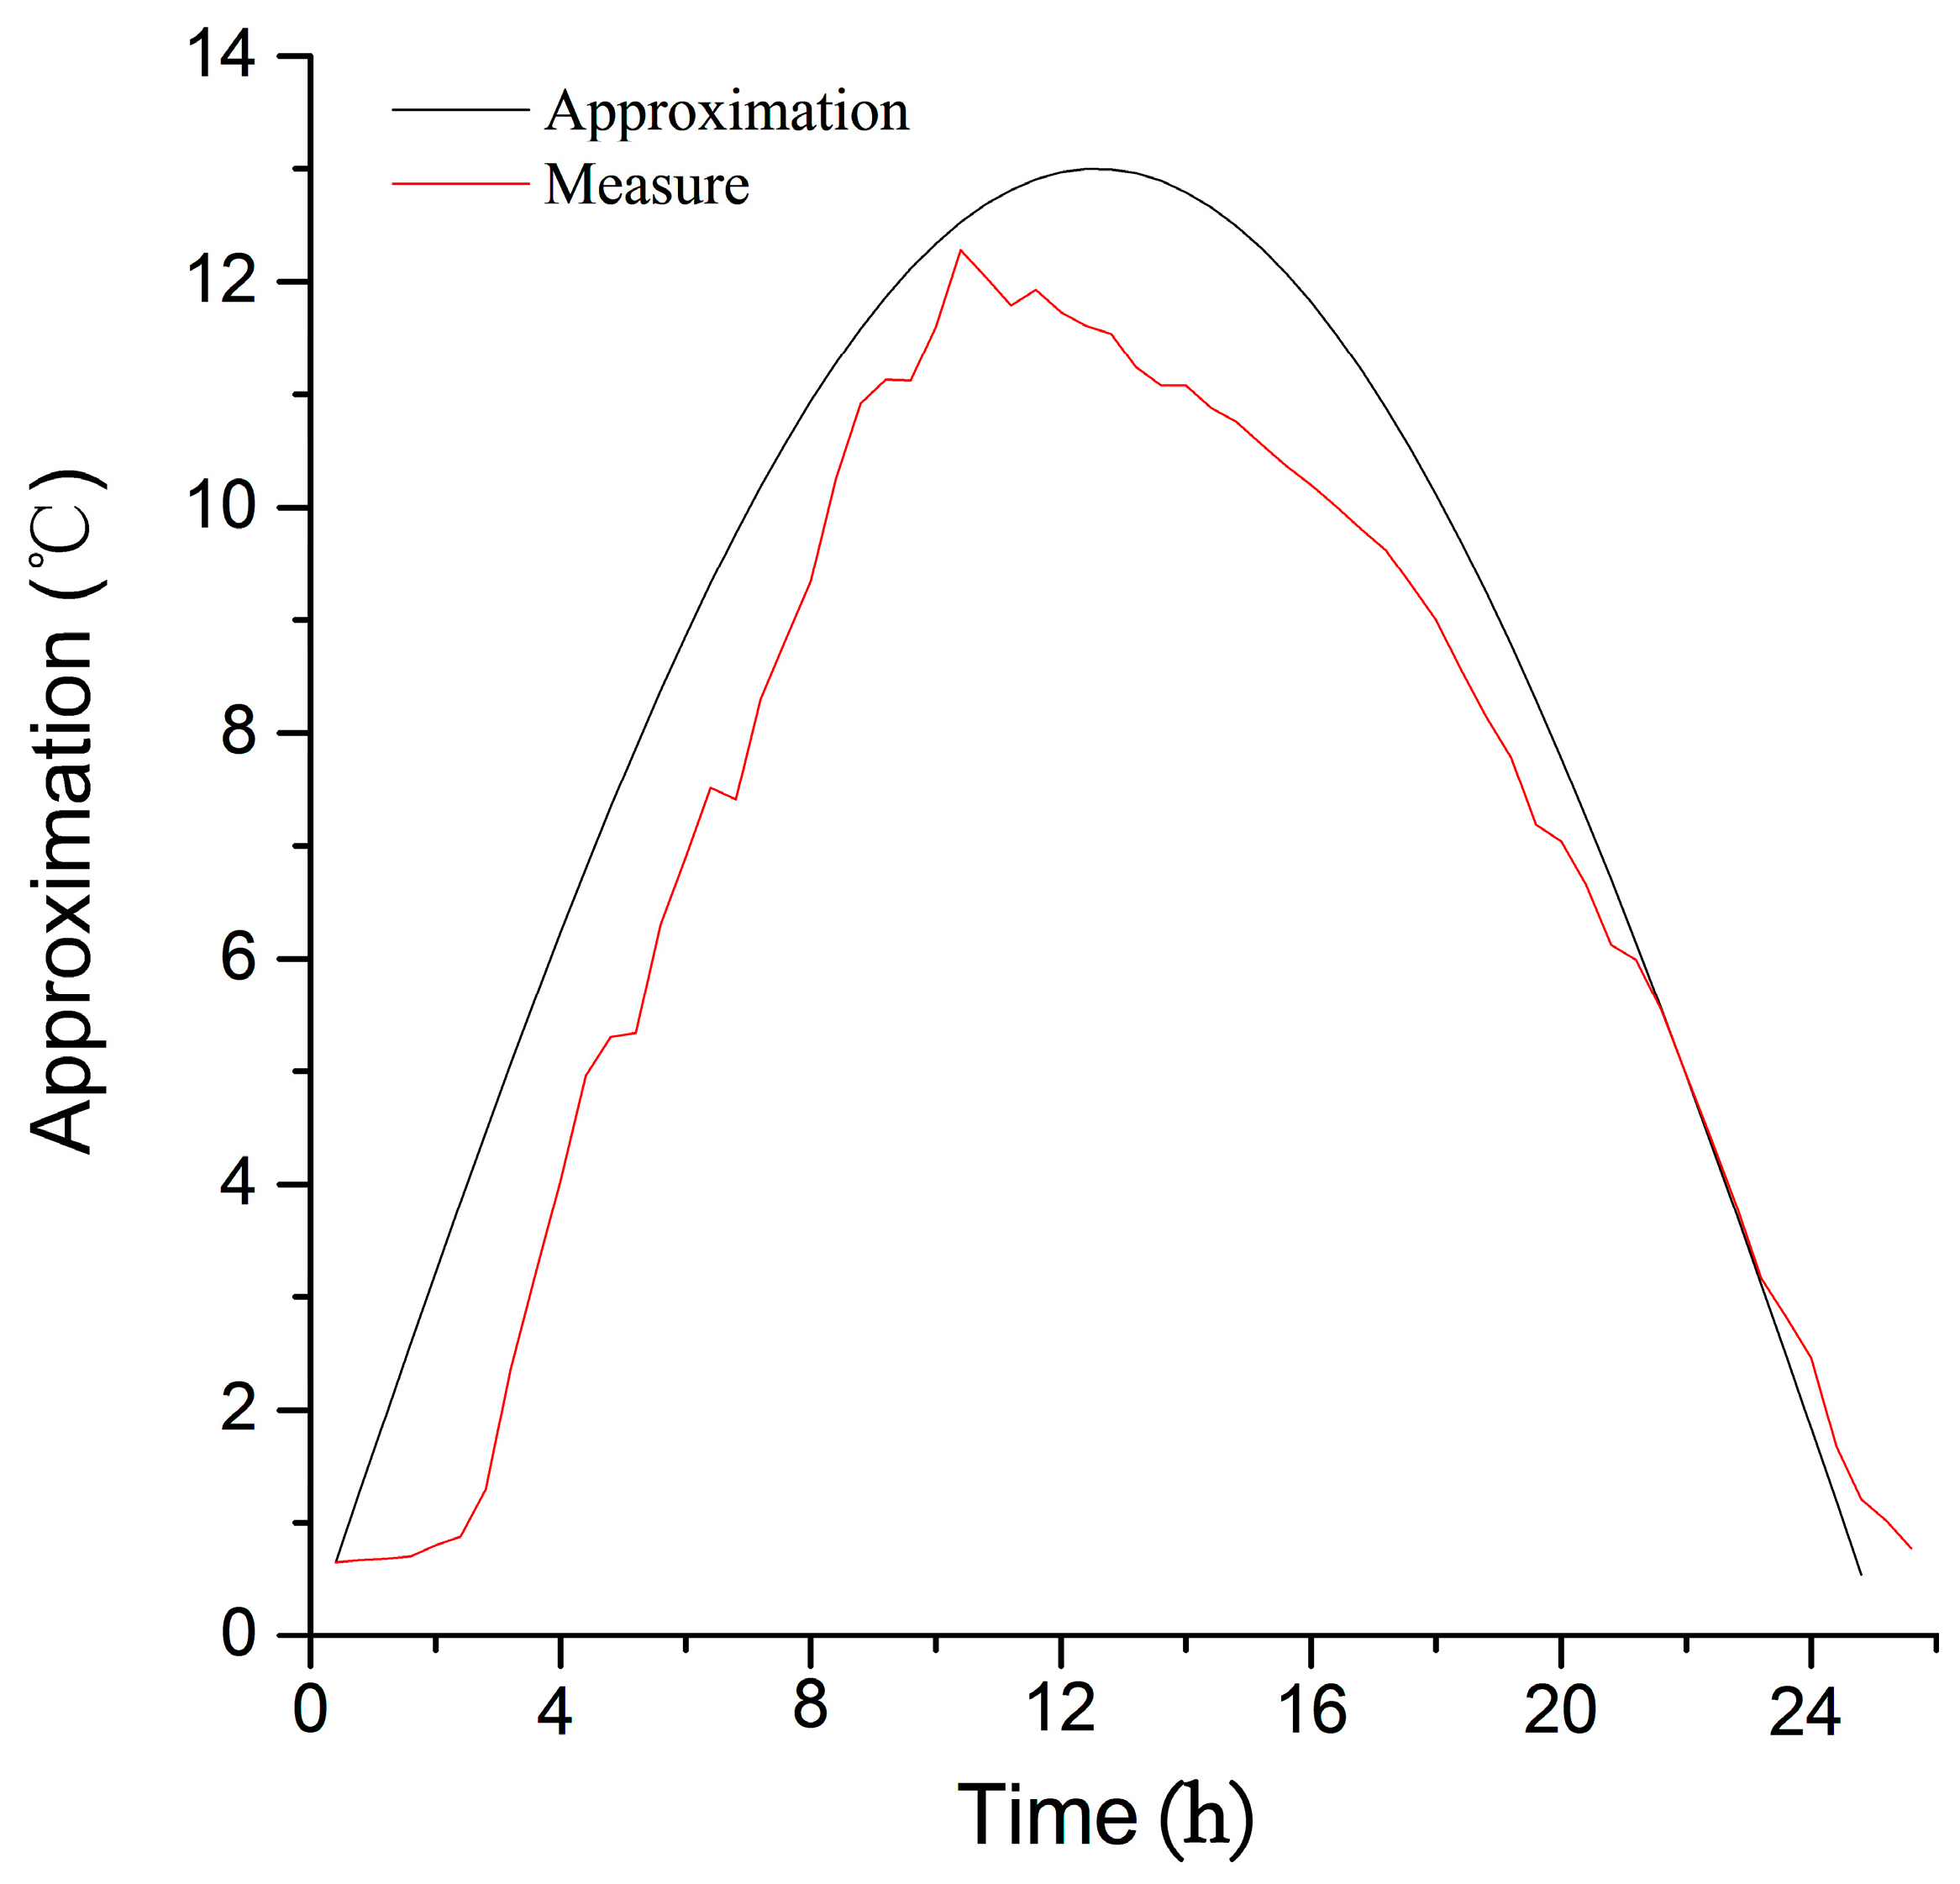
The change of temperature over the course of a day can be approximated as sinusoidal (Figure 2). The temperature integral method was used to calculate the AT using the MT and the minimum temperature, and to convert the 24 moments of a day into radians (0–π), as described in References [64,65]. Additionally, the temperature changes in one day can be subdivided into three categories: (1) The maximum daily air temperature is less than 0 °C; (2) the maximum daily air temperature is greater than 0 °C, but the minimum daily air temperature is less than 0 °C; and (3) the minimum daily air temperature is greater than 0 °C.
The precipitation type and the determination of snow melting will only be impacted by the AT when the air temperature is greater than 0 °C [66,67,68,69]. When the minimum daily air temperature is greater than 0 °C, the equation used to calculate the melt factor is as follows:
where is the temperature at any time of day, is the maximum daily air temperature, is the minimum daily air temperature, and t is the arc value in one moment. When the minimum daily air temperature is less than 0 °C and the maximum daily air temperature is greater than 0 °C, the equation used to calculate the AT is as follows:
and are the radins value when the temperature is 0 °C.
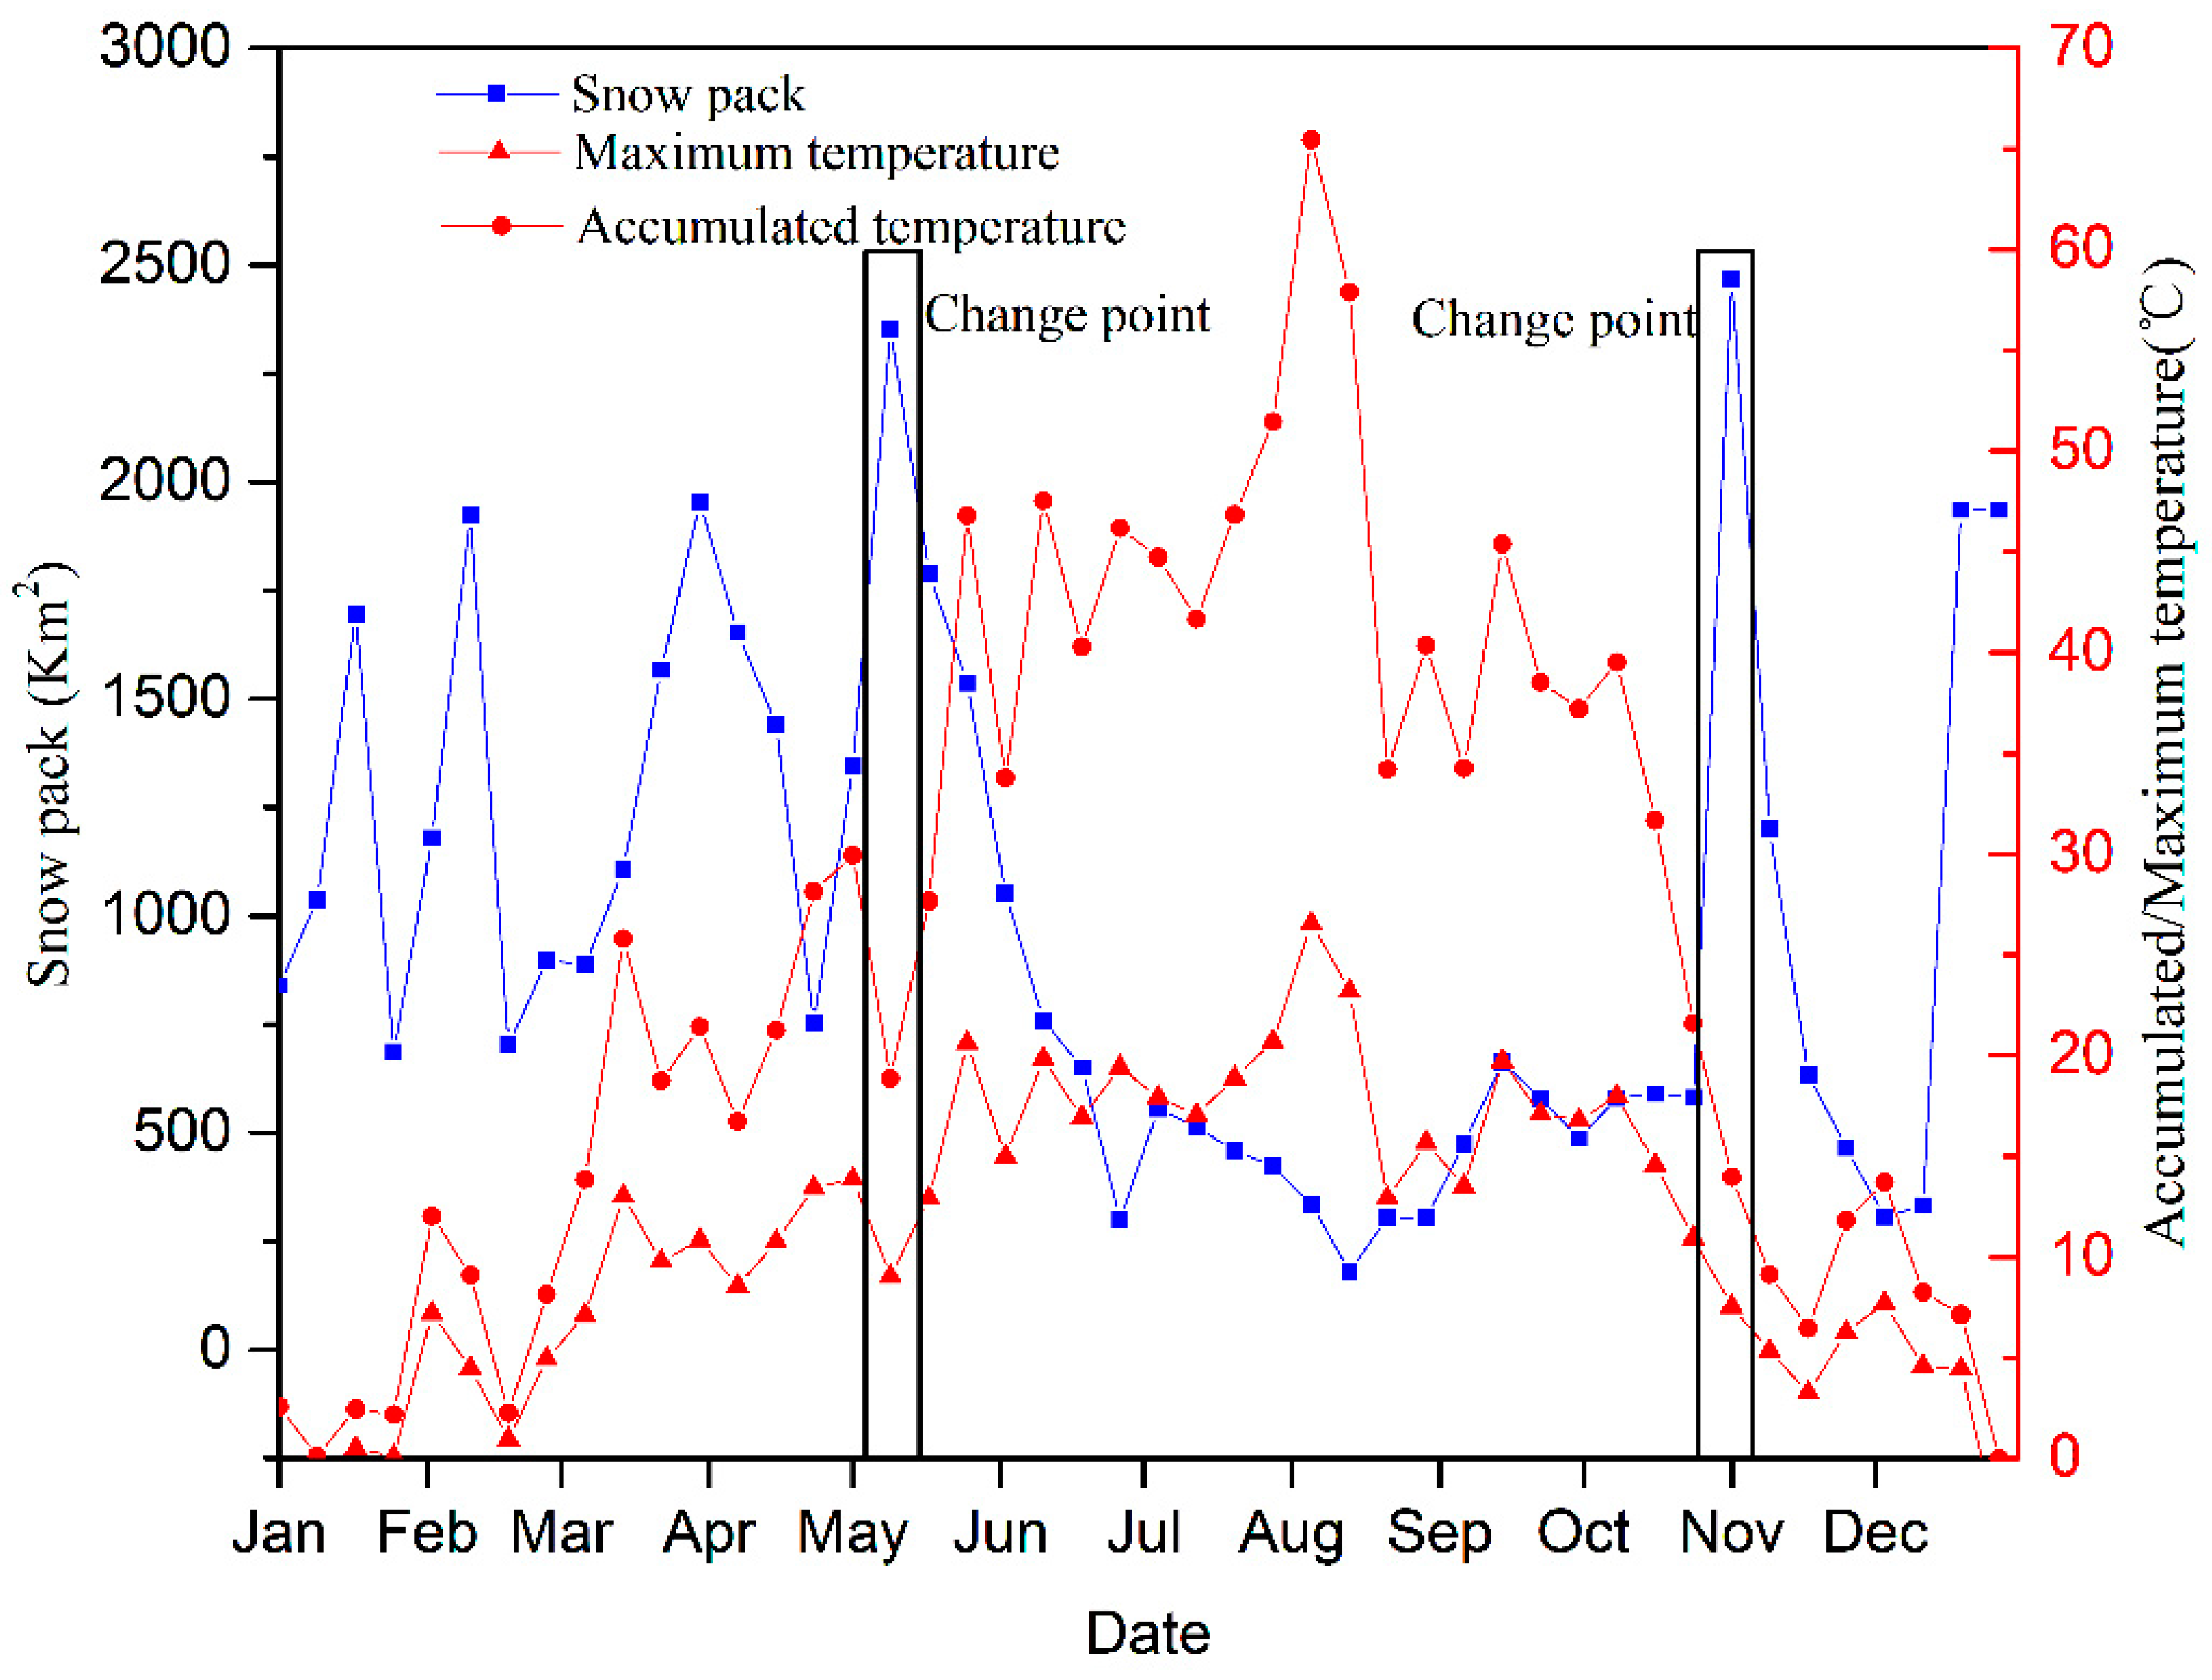
The relationship between the snow pack area and temperature in the Tizinafu River Basin in 2013 is shown in Figure 3. The black boxes represent the 2 inflection points of the snow area change during the year. Following the first inflection point, the snow pack area began to decrease, meaning that the snow had begun to melt. From that point, the snow pack area decreased, indicating that the precipitation during this period was mainly in the form of rain. The timescale for the snow cover was 8 days. The MT and AT values calculated during the 8 days between the inflection point and the next point were used as the temperature conditions for rainfall. During the first 8 days of the second inflection point, the snow pack area increased sharply, indicating that there was a wide range of snowfall events. Therefore, the daily average values of the MT and AT were used as the temperature conditions for snowfall during this period.
To verify the obtained temperature, precipitation event statistics and corresponding weather forecast data were examined. When there was a precipitation event on a given day, the day’s temperature was compared to the obtained temperature conditions in order to determine if the obtained temperature was within the given temperature conditions. Statistical comparisons were made for all the precipitation events, and the accuracy values obtained were used to assess overall accuracy.
3.3. The Modified Day-Degree Algorithm
Snow melting is a process of energy accumulation. It can also be a process of temperature accumulation. When the AT reaches a certain value, there will be snow melting. Therefore, increasing the threshold values of the AT and snowmelt temperature acts to limit the snowmelt conditions, which improves the accuracy of the snowmelt calculation. Snow melting will only occur when the MT and AT simultaneously reach the established conditions.
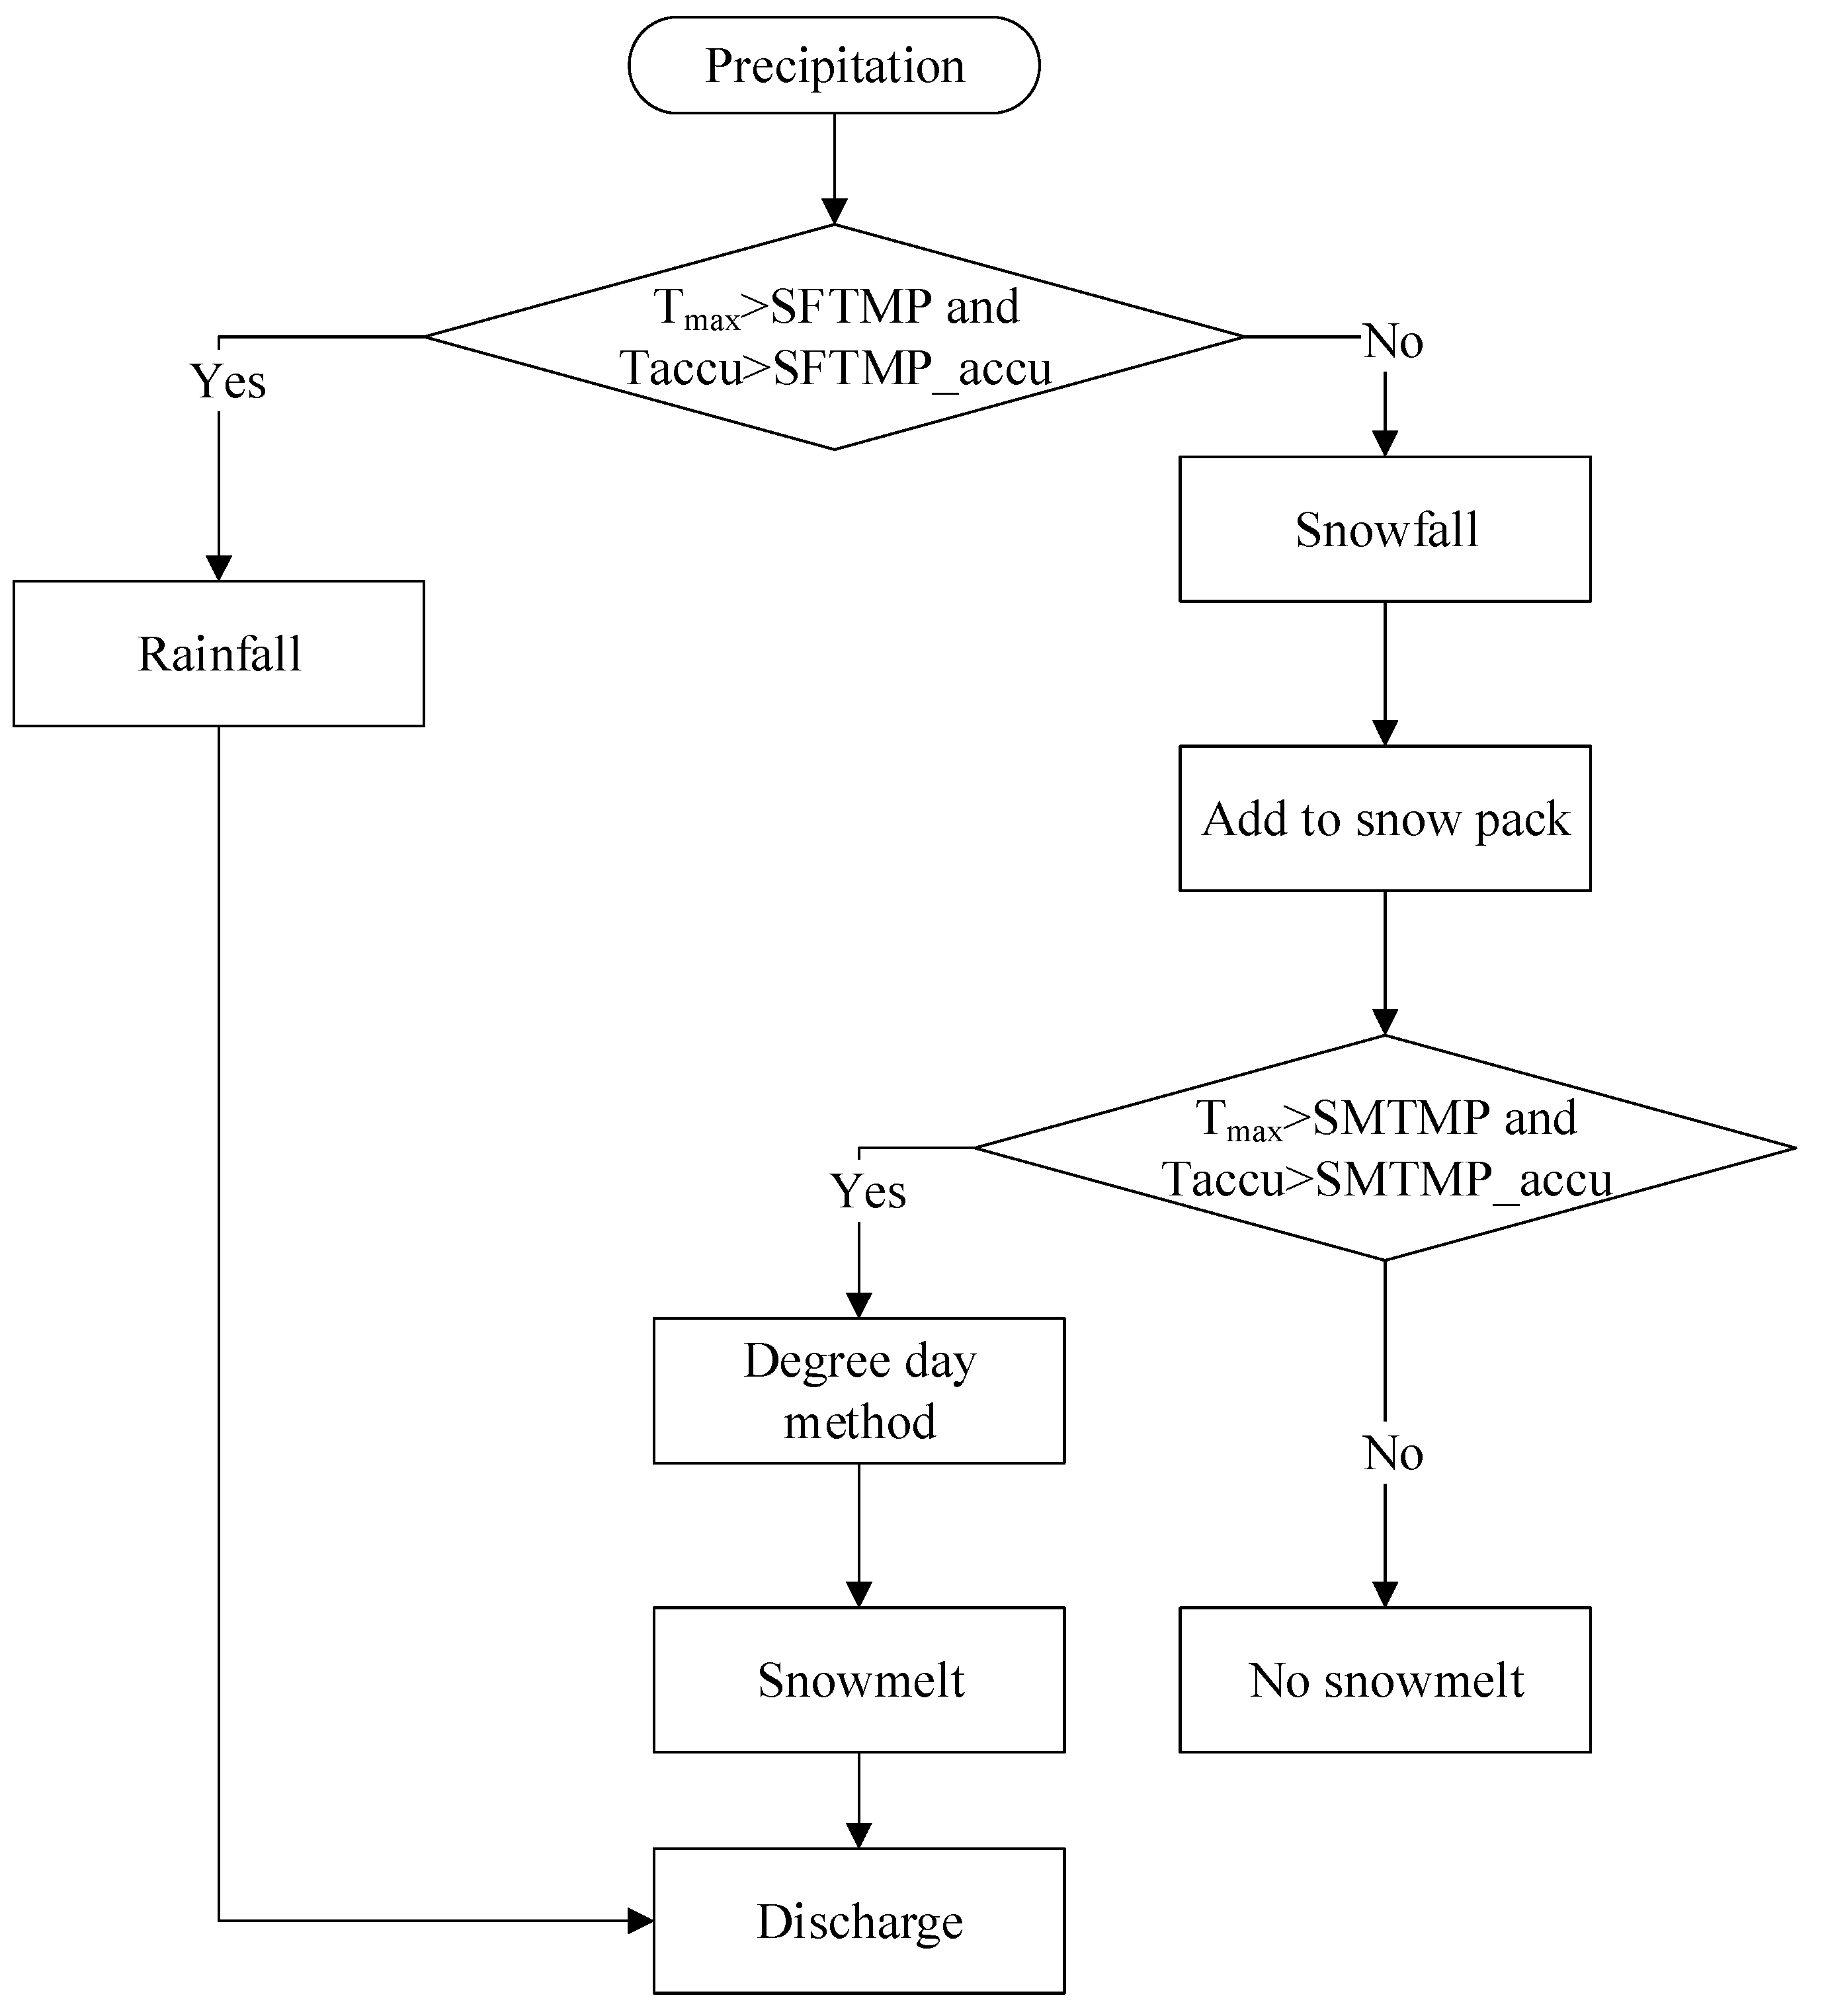
Figure 4 illustrates the modified snow-melting module in the SWAT model, which includes a new rain and snow separation algorithm. HRUs are added to the AT and MT to determine the precipitation type and are then calculated for different types of precipitation. When determining the precipitation type, if the temperature condition for rainfall is met, the precipitation is determined to be rainfall, and the contribution of the rainfall to the river runoff is derived according to the original calculation method of the model. If the form of precipitation is determined to be snowfall, this precipitation is added to the snow pack. At the same time, when snow-melting conditions are reached, the amount of snow melting and the contribution to the river runoff are calculated; otherwise, snow melting is 0. Adding the AT and MT to determine the snowmelt conditions addresses the shortcoming of neglecting AT in the traditional degree-day factor method, thus improving the model. The calculation of snowmelt during the non-melt period of the model is avoided following this improvement.
3.4. Calibration and Validation
The optimal parameter set was determined using parameter calibration to improve the simulation accuracy of the model. The study period was mainly divided into 3 parts: the warm-up period (2011–2012); the calibration period (2013); and the verification period (2014). The simulated daily streamflow was calibrated with the objective function, according to observation recorded at the Jiangka station. Three statistical coefficients were used to evaluate the simulated results: the Nash-Sutcliffe efficiency (NSE) [70], goodness of fit (R2), and percent bias (PBIAS) [71] indices.
The NSE is used to indicate the degree of fit between the simulated and measured values. If the value of the NSE is between 0 and 1, the result is acceptable. However, if the NSE value is less than 0, this is generally viewed as an unacceptable level of performance. Model performance is defined as ‘very good’, ‘good’, ‘satisfactory’, or ‘unsatisfactory’ for ranges of 0.75 < NSE ≤ 1.0, 0.65 < NSE ≤ 0.75, 0.5 < NSE ≤ 0.65, or NSE ≤ 0.5, respectively [71]. The equation used to calculate the NSE is:
R2 is used to indicate the correlation between simulated and measured values. The range of R2 is 0–1. The closer R2 is to 1, the better the simulation of the model. The equation used to calculate R2 is:
The PBIAS value measures the average tendency of the simulated results to be larger or smaller than the observations. The best PBIAS value is 0, which indicates that the simulated result is very accurate. A positive PBIAS value indicates a model underestimation bias. Conversely, a negative PBIAS value indicates a model overestimation bias. Model performance is defined as ‘very good’, ‘good’, ‘satisfactory’, or ‘unsatisfactory’ for values of PBIAS < ±10%, ±10% ≤ PBIAS < ±15%, ±15% ≤ PBIAS < ±25%, or ±25% ≤ PBIAS, respectively. The equation used to calculate the PBIAS is:
where is the measured discharge on the ith day (m3/s), is the simulated discharge on the ith day (m3/s), and are the average simulated and measured discharges during the simulation period (m3/s), respectively; and n is the total number of daily flow observations.
4. Results
4.1. Temperature Threshold of Rain and Snow Differentiation
From the temperature data statistics and calculations from 2013–2014 of the three weather stations within the study area, the temperature conditions associated with rainfall and snowfall were obtained, as shown in Table 1. These results indicate that when the AT reaches 41.27 °C and the MT reaches 16.29 °C, precipitation exists primarily in the form of rainfall at the Momuke Station. When there is snowfall, the AT and MT cannot exceed 34.62 °C and 16.92 °C, respectively. At the Kudi station, rainfall is associated with conditions in which the AT and MT reach 32.38 °C and 14.04 °C, respectively; for snowfall, the MT and AT must not exceed 23.33 °C and 11.7 °C, respectively. Similarly, at the Xihexiu station, the AT and MT thresholds for rainfall and snowfall are 18.63 °C, 8.69 °C and 7.08 °C, 3.6 °C, respectively.
There were two main reasons for these differences: (1) The impacts of altitude. The Momuke site is located on a plain, with low elevation and flat terrain. The other two sites are each located at an altitude of approximately 3000 m. The higher the altitude, the lower the snowfall temperature, and the easier it is to form a snow pack. (2) The influence of terrain. The Xihexiu and Kudi stations are located in the hinterland of the Kunlun Mountains, surrounded by mountains, topographical conditions that are associated with low snowfall temperatures [72,73].
Probabilistic statistical methods for different types of precipitation events at the three stations were used to verify the temperature conditions associated with different precipitation types. For each precipitation type, the simulated temperature conditions were compared with the given temperature conditions. If the above temperature conditions were met, then the precipitation event was considered to be correct. The proportion of correct precipitation events was used as an indicator of accuracy. Tabulated results showed that the accuracies of the Momuke, Kudi, and Xihexiu stations were 92.86%, 79.49%, and 88.3%, respectively.
4.2. Best Parameter Set
By determining the temperature conditions of the different precipitation types during the calibration period (2013), the AT and MT rainfall thresholds were found to be 32.18 °C and 13.66 °C, respectively. The corresponding AT and MT snowfall thresholds were 17 °C and 8.58 °C, respectively. In general, the AT threshold for snow melting should not be less than the AT threshold during snowfall. Therefore, the AT threshold for snow melting was set to 17 °C.
Some key parameters in the snow-melting process, including the temperature and precipitation lapse rates, are listed in Table 2. While the temperature of melting snow was a key research parameter, other parameters such as HRU, groundwater, and soil were not the focus of this study, and for that reason were not included in the table. From the determination of the relevant parameters, the optimal parameters were selected.
4.3. Model Performance
The NSE, R2, and PBIAS values are shown in Table 3. These statistical coefficients were used to compare the simulated and observed daily discharge values. To examine the differences between the observed and simulated streamflow values, the calibration data (2013) and validation data (2014) were extracted from the entire research period. The first 2 years (2011–2012) was the “warm-up period”, and thus was not included in the analysis of NSE, R2, and PBIAS.
Table 3 shows that the output from the original SWAT model during the calibration (2013), validation (2014), and overall (2013–2014) periods achieved ‘good’, ‘satisfactory’, and ‘good’ performance levels, respectively. Following model enhancement, the NSE values of the corresponding periods improved, achieving ‘very good’, ‘good’, and ‘good’ levels. When the R2 and PBIAS values were used as evaluation indicators for the model simulation results, the accuracy of the modified model exhibited significant improvement. However, the PBIAS indices for the calibration and validation periods revealed overestimations exceeding 5.79% and 7.30%, respectively, indicating that the model performance was ‘very good’ (PBIAS < ±10%). After the improvement of the SWAT snow-melt module, the PBIAS validation value increased from −18.04% to 2.89%. The performance during the verification period improved from ‘satisfactory’ (±15% ≤ PBIAS ≤ ±25%) to ‘very good’ (PBIAS < ±10%). In addition, the R2 value improved from 0.75 to 0.81. The NSE, R2, and PBIAS values of the overall time period (2013–2014) all improved following the model enhancement, indicating that the simulation performance had been upgraded.
The observed mean daily discharge was 4.10 m3·s−1 during the non-melting period. For the same period, the simulated mean daily flow values from the modified and original model versions were 5.22 and 6.90 m3·s−1, respectively. During the non-melting season (October–March), the simulation of the base flow was overestimated before and after the model improvement, although the values from the modified model were more reasonable and accurate (Figure 5). During the snow-melting season (April–September), the observed mean daily discharge was 66.16 m3·s−1. The average daily flow values simulated by the modified and original SWAT model versions were 61.15 and 66.47 m3·s−1, respectively. Although the average daily flow simulated by the original model was closer to the observed data, it did not perform well in the simulation of flood peaks. In the mountainous areas of Xinjiang, mass floods are mainly the result of snowmelt. Occasionally there is a “one peak, one day” flood phenomenon, in which case the effect of the simulated peak results is directly related to the accuracy of the model flood forecasts [74]. From the rate and flow statistics for the 17 peaks, occurring during the calibration and verification periods, the average peak flow following model improvement was found to be 43% higher than the average peak flow prior to model improvement. This indicated that the enhancement of the snow-melting module can definitely improve the model’s simulation of the discharge values, bringing them closer to the actual measured values, indicative of a more realistic model.
4.4. Snowmelt and Accumulation Temperature
The comparison of the amount of daily snow melting before and after the model improvement is shown in Figure 6. The degree-day factor method employed in the SWAT model is one of the most important approaches when calculating the melting of snow or ice [75,76]. Snowmelt runoff simulated in this way is more in line with the characteristics of snowmelt floods in the Xinjiang region.
When calculated using the traditional degree-day approach, the daily average snowmelt value in the Tizinafu River Basin was 76 mm. When calculated using the modified degree-day approach, this value decreased to 68.07 mm, a 10.43% reduction. However, by comparing the amount of snowmelt at the time of the flood peaks, the degree-day and modified degree-day approaches yielded snowmelt amounts of 162 mm and 199 mm, respectively, representing an increase of 22.84% as a result of the model improvement. It can also be clearly seen in Figure 6 that the modified model simulated significantly higher amounts of springtime snowmelt, also verifying the fact that spring is a period of pronounced snowmelt flooding in the mountainous regions of Xinjiang [21,46]. In addition, some unreasonable snowmelt events were eliminated, such as the snowmelt calculated by traditional models in January, November, and December. As a result of model improvement, the contribution of snowmelt to runoff increased from 44.7% to 54.07%.
In order to reveal the rationality of the modified model and snowmelt calculation, the relationship between the 8 days’ snowmelt volumes and the snow cover during the snowmelt season was analyzed in Figure 7. In the summer, due to the increasing temperature, the overall snow cover area shows a decreasing trend. The total volume of snowmelt from the modified model showed an increasing trend, which was close to the reality. While, the original model showed a decreasing trend in the same period. The snow cover has a ripple reduction, and peaks appear during each circle. It indicates snow cover increase for a short time, since the temperature drops suddenly, and snowfall occurs. Correspondingly, the amount of snowmelt decreases due to the reduced temperature. From this point of view, the modified model performs better than the original one.
This can also completely explain the fact that snowmelt floods in Xinjiang are prone to rapid formation and cause great harm [46]. When snowmelt temperature conditions are reached, snowmelt runoff rapidly increases, and flood peaks develop. By improving the model and removing the unreasonable snowmelt events created in the original version, flood peak runoff was increased to a certain extent, bringing it more in line with the characteristics of snowmelt floods in Xinjiang.
The relationship of AT and MT with monthly snow melting in 2013 and 2014 is shown in Figure 8. In general, snowmelt will only exist when the AT reaches 17 °C. The black boxes in the figure represent the non-melting months of November and February. In reality, it is impossible to have snow melting during these months. However, calculations by the traditional degree-day factor method yield snowmelt in both November and February, reflecting a certain amount of irrationality in the traditional degree-day technique. The improvement of the model eliminates snow melting during non-melting months. When the degree-day factor following improvement was used to calculate the snowmelt, the melting of snow only occurred when the AT reached the set threshold; otherwise it was 0. Calculating snowmelt in this way was both more reasonable and more accurate.
Snow accumulation in Xinjiang is mainly concentrated in the high-altitude mountainous areas. Under certain temperature conditions, the snow shows a high sensitivity to temperature. To illustrate the relationship between snow melting and AT in a more direct way, the monthly snowmelt and AT of the Tizinafu River Basin were plotted (Figure 9).
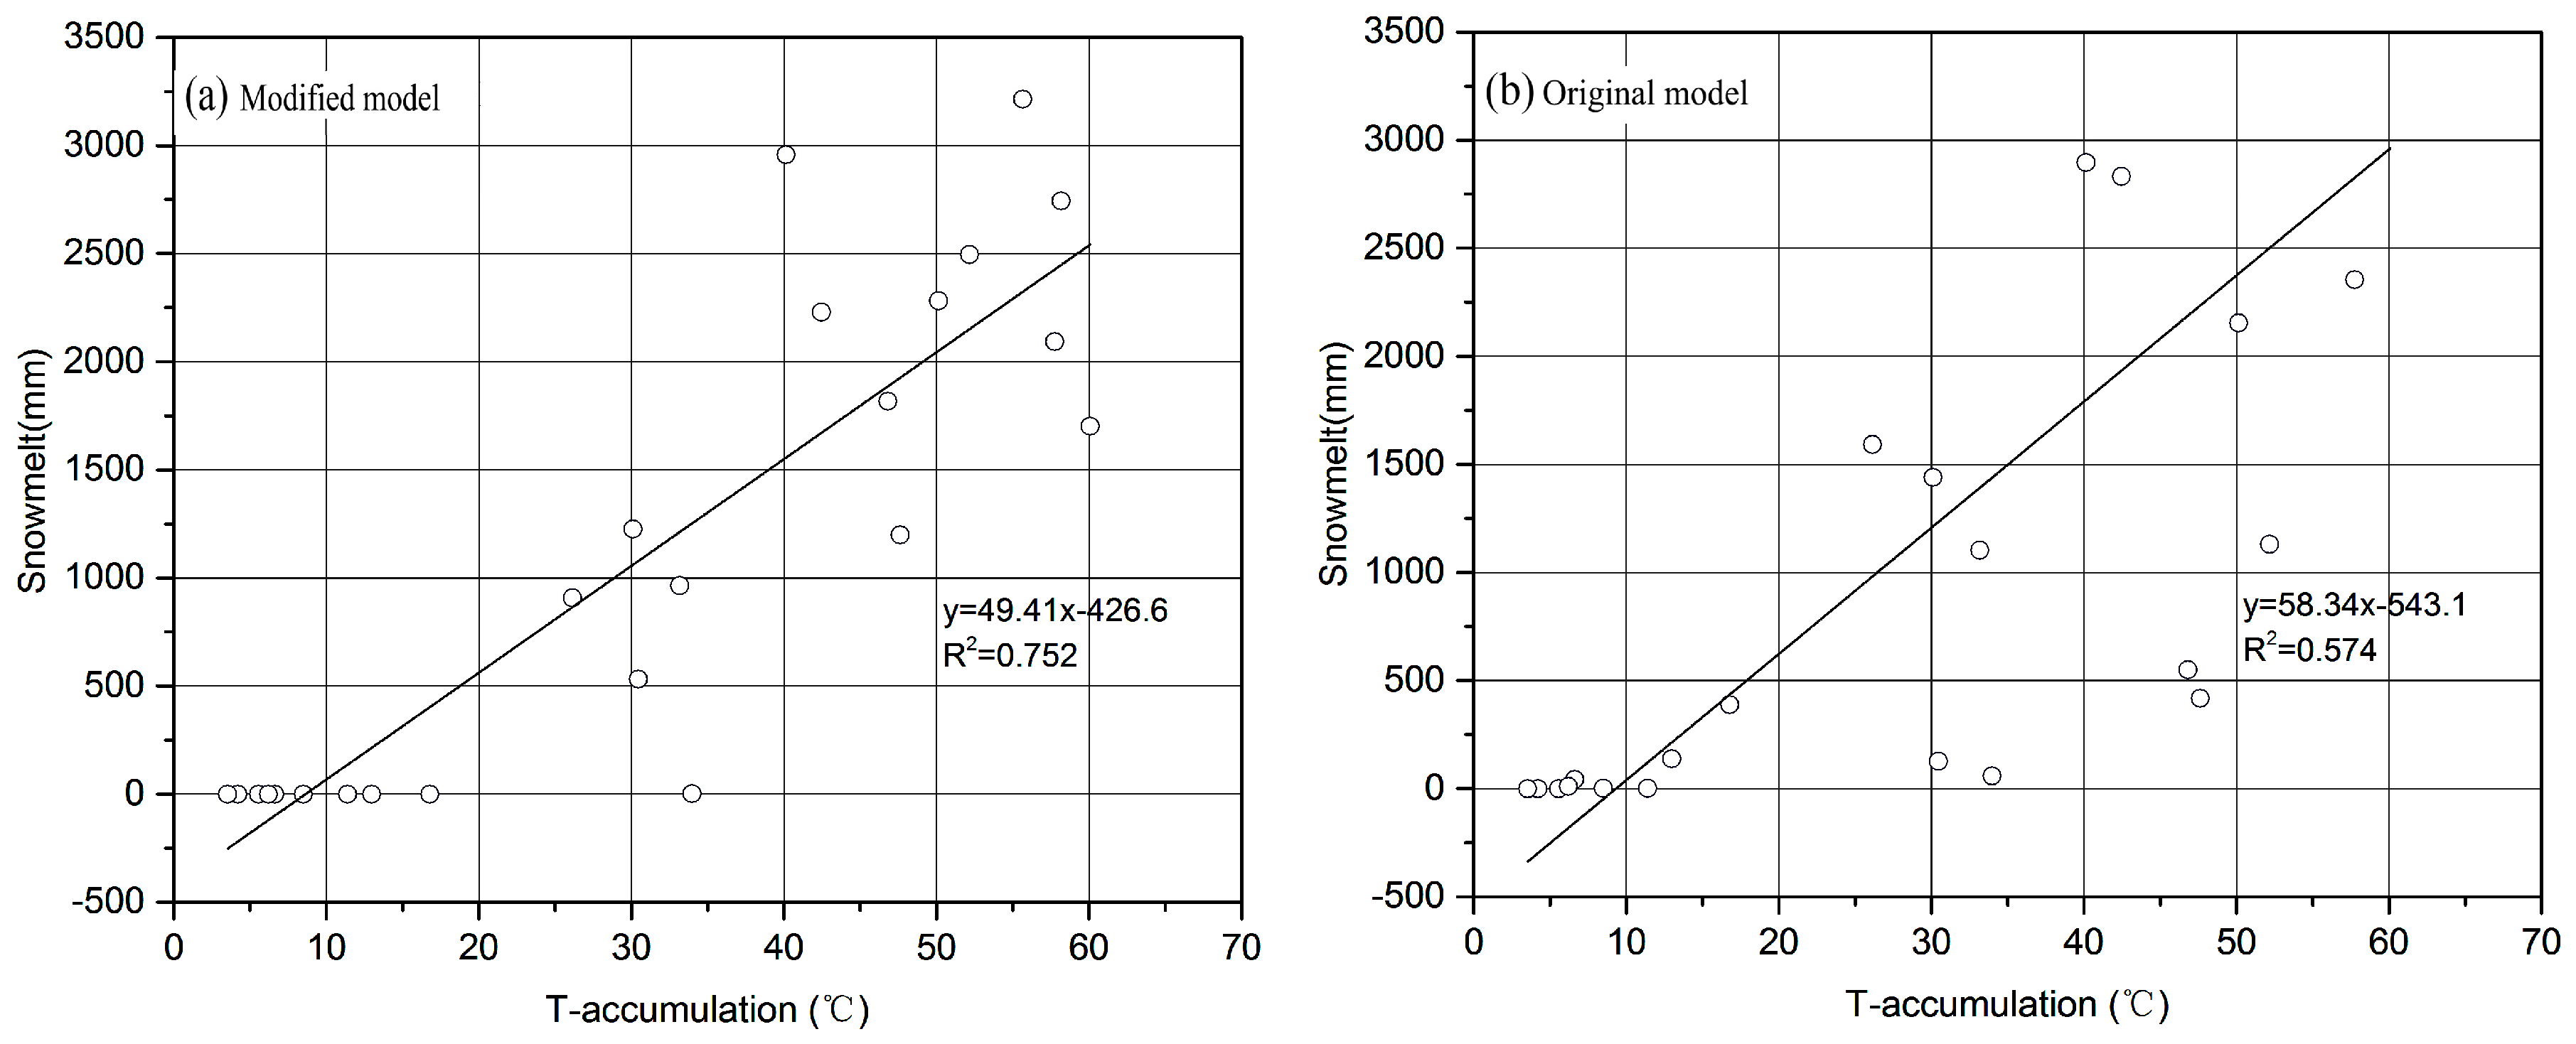
A linear regression analysis demonstrated that snow melting was correlated with the AT. Temperature, acting as an integrating indicator of energy balance over the snow surface, is the dominating factor in the melting of snow. The relationship between snow melting and the AT calculated by the modified degree-day factor (R2 = 0.752) was more relevant than the corresponding relationship from the traditional degree-day factor (R2 = 0.574). From the analysis of the relationship between snow melting and temperature, it was possible to determine the conditions associated with snow-melting floods to a certain extent. Differentiating the types of floods in combination with precipitation can help provide reliable information for flood forecasting, thus determining risks and appropriate adaptive measures.
5. Discussion
5.1. Temperature Threshold
The modified degree-day factor method was more accurate in calculating snowmelt than the original version. In terms of the traditional degree-day factor, as long as the AT of a given day is greater than the set snow-melting temperature, snow melting on that day is calculated on a 24-hour basis [56], which is obviously unrealistic. The diurnal variation of temperature in Xinjiang’s mountainous areas is sometimes extremely large. Although the temperature on a particular day may climb above 0 °C during the daylight hours, the nighttime temperature may plunge below 0 °C. Thus, it is not always the case that snow melting will occur at night [77]. It is obvious that flood peaks occur during the day [78]. The conditions for triggering snow melting are mainly energy accumulation, and the important factor affecting energy accumulation is the AT [79]. Through the correct determination of precipitation type, the accurate differentiation of rain and snow can be realized, which provides more reliable precipitation data for the calculation of different precipitation types. Applying the SWAT model to high-altitude mountainous areas by simply using the daily average temperature as the condition for rain and snow discrimination does not meet the accuracy requirement. By combining the AT with the MT, it is possible to more accurately divide precipitation into rain and snow, which improves the model’s calculation accuracy of different precipitation types [80]. As different precipitation types require different calculation methods, the accuracy of the initial precipitation categorization significantly affects the accuracy of the simulated results. In the SWAT model, temperature and precipitation data are very important input parameters. However, when this model uses precipitation to calculate runoff, it simply calculates precipitation as rainfall, ignoring the possibility of snowfall [81], which may lead to an increase in rainfall runoff and a reduction of snowmelt runoff. The differentiation of rain and snow in precipitation is achieved by means of the temperature integral method, which increases model calculation accuracy. It was found that the temperature threshold at the Momuke site was at least 34% higher than the thresholds at the other two sites, possibly due to topography, elevation, and water vapor conditions. Through the comparative analysis of the statistical logbook of precipitation events, the accuracies of the rain and the snow differentiation at the three sites were obtained. The accuracy of the rain and snow differentiation at the Momuke site was significantly higher than the differentiation accuracy at the other two sites. This was primarily because the Momuke site is located on a lower-elevation plain. The data in the Momuke statistical logbook is more detailed and the number of samples is larger than the information from the other stations. The remaining two stations are located in high-altitude mountainous areas with incomplete statistics and a small number of samples, which are deficits that affect the accuracy of rain and snow differentiation. In addition, the abrupt changes in climate in mountainous areas significantly impacts accuracy.
Commonly, the daily air temperature data is the most available data source to the public. Therefore, the daily maximum and minimum temperature was used in the SWAT model [82]. To determine precipitation morphology, it would be direct and accurate to judge it by the air temperature. When considering the influence of AT on snowmelt and precipitation, it would be more convenient to use the maximum and minimum temperatures to calculate the AT. However, there is some delay and temperature difference between the air temperature and the land surface temperature. It would be ideal to use the land surface temperature directly for calculating snow melt [83,84]. In future research, we will establish the relationship between the air temperature and the land surface temperature for different underlying cover types. The integration is considered to improve snowmelt module of the SWAT model further. In summary, the proposed approach in this study provided an obvious reference for other studies which might not consider the difference of ground temperature and air temperature.
When precipitation observations are made at meteorological sites, there is no distinction between precipitation types [85]. Observation values are input into the model, and the precipitation type is then determined by setting the temperature threshold, which increases the contingency of the precipitation type determination [86,87]. It is also difficult to achieve accurate rain and snow differentiation without the temperature verification accuracy of the site. Through the model improvement used in this study, the conditions for the AT and MT are enhanced, and the accuracy of rain and snow differentiation can be verified at different sites. The optimal AT and MT conditions were then obtained, and the accuracy of precipitation type in the model was modified. To some extent, the accuracy of the snow melting calculation was also modified.
At present, when investigating the relationship between snowmelt and temperature [88], researchers rarely employ the accumulated temperature in snowmelt calculations. Most of the studies simply use the daily average temperature. However, the most important temperature condition affecting snowmelt is the snow surface temperature. Simply using the average temperature as a snowmelt criterion affects the calculation of the snowmelt amount [89,90]. By utilizing both the AT and the MT in the snow-melting calculation, the process of surface temperature accumulation can then be well-represented, improving calculation accuracy.
5.2. Model Performance
In the SWAT parameter set, the snowmelt and snowfall conditions were determined by the added AT thresholds of snowfall and snowmelt (Table 3), leading to satisfactory results. Comparison of the results before and after the model improvement is clearly delineated in Table 1. From the perspective of the NSE and R2 evaluations, the simulation results of the modified model were found to be better than those of the original model. The PBIAS values indicated that the simulation results during the verification period and overall were much better in the modified model. This may be due to the modified degree-day factor, as well as the differentiation of rainfall and snowfall.
In the Tizinafu River Basin, temperatures usually begin to increase at the end of the March, and snow at the lower elevations starts to melt into the streamflow [8]. This leads to a rapid increase in the water level of the river, an increase in water flow, and a tendency for snow-melting floods [37,91,92,93]. The contribution of snowmelt to runoff during the non-snow-melting season was limited in the modified degree-day method, which increased peak flooding during the snow-melting season and brought it closer to the measured discharge values. The differentiation of rain and snow in precipitation reduced the contribution of rainfall to runoff and increased the contribution of snowmelt [79], results that were also in line with the actual conditions occurring in the Kunlun Mountains of the Xinjiang region. In most mountainous areas of Xinjiang, especially in the Kunlun Mountains of southern Xinjiang, such as the Tizinafu River, there is more snowfall, and the streamflow originates mainly from the annual snow cover and glaciers of high-altitude mountainous areas [38].
Figure 5 presents the simulation results more intuitively. In March 2013 and April 2014, the runoff of the Tizinafu River began to increase. As there was little rainfall in this basin of southern Xinjiang, it can be assumed that the increase in river flow was due to melting snow [45]. For the spring season, the modified model performed more accurately than the original version, fully embodying the characteristics of rapid snow-melting-type flooding [94]. During the summer, as temperatures rose, the amount of snowmelt increased [95]. Under the same rainfall conditions, the snowmelt simulation of the modified model was significantly better than that of the original version. Peak flood flow increased, bringing it closer to the measured values.
During the snowmelt season, the average daily flow in 2014 was 42.28 m3/s, which was significantly lower than the 90.03 m3/s observed in 2013, a difference that may be related to climate change. The AT and the MT during the 2013 snowmelt season was 44.25 °C and 18.08 °C, respectively, which was significantly higher than the corresponding 2014 values of 41.73 °C and 15.79 °C, respectively. Global temperature changes and the impact of human activities led to a significant decline in 2014 temperatures compared to 2013 values [96], resulting in a reduction of snowmelt volume and runoff.
Through the improvement of the model, the contribution of snowmelt to runoff has been significantly enhanced, increasing approximately 10% compared to the contribution from the original model. This is primarily due to the increased calculation accuracy of the snowmelt associated with the improvement of the traditional degree-day factor. In addition, the calculation of precipitation type has been enhanced, and the accuracy of precipitation type differentiation has improved, which affected the contribution of snow melting to runoff. Therefore, this study has provided a new method for improving the accuracy of the snowmelt calculation.
To obtain the significance of the proposed model parameters on the model results, sensitivity analysis of the original model and modified model was performed (Table 4). As an optimization method for parameter estimation, the Sequential Uncertainty Fitting (SUFI-2) [97] algorithm considers the uncertainties of input data, model structure, parameters, and observation data, and reflects them in the range of parameters after the rate is fixed. The sensitivity of the parameters was ranked for both models. In the traditional model, the parameters SMTMP and the initial snow water content [mm H2O] (SNO_SUB) showed strong sensitivity, but the parameter melt factor for snow on 21 December (SMFMN) showed low sensitivity. In fact, the entire original snowmelt module had low responses to the calibration processes. In the modified model, the parameters SMTMP, temperature lapse rate (TLAPS), SFTMP also showed strong sensitivity, whilst the sensitivity of most parameters related to snowmelt was greatly improved, such as TLAPS, SFTMP, precipitation lapse rate (PLAPS), SMFMN. The newly added model parameters SMTMP_accu and SFTMP_accu also showed strong sensitivity, which also played an important role in the snowmelt calculation in the model. Therefore, through the improvement of the snow melt module, the sensitivity of the snowmelt related parameters has been greatly improved, as well as the accuracy and reliability.
5.3. Snowmelt and AT
The runoff simulation results of the modified model during the spring are significantly better than those of the traditional model (Figure 5). In the traditional model, spring runoff increased earlier than the measured data. This was mainly due to an inherent limitation of the traditional degree-day factor, which only used the daily average temperature in its calculations [93]. After improvement of the degree-day factor method via the addition of the AT condition, the model could now better simulate the spring runoff, yielding results closer to measured values. In the modified model, snow melting occurs rapidly, but only after reaching the AT and MT conditions. In response to this rapid snowmelt, river runoff increases quickly within a short period of time, oftentimes leading to a flood peak. This process may occur within a single day, which is a characteristic of springtime snow-melting floods [21]. Since the modified degree-day factor method increases the snowmelt condition limit of the accumulated temperature, in situations during which there is snowmelt, the MT used for calculation in the modified model is higher than that from the traditional degree-day factor method, resulting in more snowmelt than the original model. When the snowmelt calculation is carried out, the snow produces more runoff than the original model. By changing the degree-day factor and increasing the AT limit condition, in situations when the snow-melting condition is reached, the snowmelt and the snowmelt runoff increase correspondingly due to the increased amount of snow. In addition, the modified model more accurately and prominently simulates the characteristics of flood peaks, especially in the case of simultaneous snowmelt floods and rainfall floods that occur during the summer.
Through calculation and verification, the AT threshold value of snow melting was determined to be 17 °C, a value that improved the calculation accuracy of snow melting. When correlated with the AT data, it was found that the correlation between the snow melting and the AT calculated by the modified degree-day factor method was higher (Figure 8). During the non-snow-melting months of November 2013 and 2014, discharge modelled by the traditional degree-day factor method produced snowmelt, which was inconsistent with the observations. After model improvement, this erroneous phenomenon was eliminated. This illustrates, to some extent, the feasibility of the modified model.
6. Conclusions
In this study, a new algorithm for the calculation of snow melting in the SWAT model was proposed. The highlight of this study was the addition of precipitation type differentiation in the SWAT model and the associated improvement of the existing degree-day factor method, enhancements that made it more suitable for high-altitude regions. By adding the determination of AT conditions, the accuracy of the traditional degree-day method was modified. The new method was used to calculate and simulate the snow-melting process in the Tizinafu River Basin, providing more accurate discharge values and snowmelt contributions to the river. The results indicated that the AT is an important and effective index, which can better express changes in discharge and snow melting. The main findings of this study include:
The MT thresholds for rainfall and snowfall obtained at the three stations of Momuke, Kudi, and Xihexiu were 16.29 °C, 16.92 °C; 14.04 °C, 11.7 °C; and 8.69 °C, 3.6 °C, respectively. The corresponding AT thresholds were 41.27 °C, 34.62 °C; 32.38 °C, 23.33 °C; and 18.63 °C, 7.08 °C, respectively. Moreover, the accuracies of the Momuke, Kudi, and Xihexiu stations were 92.86%, 79.49%, and 88.3%, respectively. When the accumulated snow temperature threshold was set to 17 °C, the model achieved better results.
When the modified model was used to simulate the Tizinafu River, R2 increased from 0.66 to 0.7 and the NSE improved from 0.8 to 0.84. A comparative analysis of the 17 flood peaks during the calibration and validation periods was performed. The modified model increased the calculation of flood peaks by 43%, bringing them closer to the observed values and making them more consistent with the characteristics of the snow-melt flooding in the Xinjiang region.
During the snow-melting season, utilization of the modified melting calculation algorithm increased the simulated amount of melting snow by 45%. Especially during the spring, which is the snow-melting flood-prone period, the model’s simulated accuracy of snow-melting floods was significantly improved. The contribution of snowmelt to runoff increased from 44.7% to 54.07%.
By improving the traditional degree-day factor method, the addition of the AT conditions, the setting of the AT threshold value for snowmelt, and the limiting snowmelt to reasonable times of the year, were controlled. The occurrence of snowmelt during unreasonable times of the year can also now be avoided. By determining the precipitation type, it provides a new method for rain and snow differentiation. The enhanced degree-day factor method improves the accuracy of model application in non-plain areas such as mountainous regions. This study provides new ideas for other researchers attempting to attain better results when simulating snow melting in high-altitude areas. This investigation also provides a certain theoretical and practical basis for the development of a late ice-melting module.
Author Contributions
Conceptualization, Y.D., T.L. and F.M.; Methodology, Y.D., T.L. and M.L.; Software, M.L.; Validation, F.M. and M.L.; Formal Analysis, Y.D., T.L. and A.F.; Investigation, P.D.M.; Resources, T.L.; Data Curation, X.F.; Writing-Original Draft Preparation, P.D.M. and A.F.; Writing-Review & Editing, P.D.M.; Visualization, A.K.; Supervision, A.B.; Project Administration, T.L. and A.B.; Funding Acquisition, T.L. and A.B.
Funding
This study was supported by the Strategic Priority Research Program of Chinese Academy of Sciences (XDA20060303), the State’s Key Project of Research and Development Plan (2017YFC0404501), International cooperation project of national natural science foundation of China (41761144079), the Project of Tianshan Innovation Team (Y744261) and the International Partnership Program of the Chinese Academy of Sciences (131551KYSB20160002).
Acknowledgments
The authors would like to express their gratitude to the China Meteorological Data Sharing Service System and Xinjiang Tarim River Basin Management Bureau for providing the climate and river flow data, respectively. We are very appreciative of the Key Laboratory of Remote Sensing and Geographic Information System, Xinjiang Institute of Ecology and Geography for providing the LUCC data and the Food and Agriculture Organization (FAO) for providing the soil map. We thank LetPub (www.letpub.com) for its linguistic assistance during the preparation of this manuscript.
Conflicts of Interest
The authors declare no conflict of interest.
References
- Gascoin, S.; Kinnard, C.; Ponce, R.; Lhermitte, S. Glacier Contribution to Streamflow in two Headwaters of the Huasco River, Dry Andes of Chile. Cryosphere Discuss. 2010, 4, 1099–1113. [Google Scholar] [CrossRef]
- Pelto, M.S. Quantifying Glacier Runoff Contribution to Nooksack River, Wa in 2013–15. In Proceedings of the AGU Fall Meeting, San Francisco, CA, USA, 14–18 December 2015. [Google Scholar]
- Swick, M. Partitioning the Contribution of Light Absorbing Aerosols to Snow and Glacier Melt Using a Novel Hyperspectral Microscopy Method. In Proceedings of the AGU Fall Meeting, New Orleans, LA, USA, 11–15 December 2017. [Google Scholar]
- Blöschl, G.; Reszler, C.; Komma, J. A Spatially Distributed Flash Flood Forecasting Model. Environ. Model. Softw. 2008, 23, 464–478. [Google Scholar] [CrossRef]
- Ye, J.; Li, Z.; Wang, Y. Study and Application of Flash Flood Warning Method for Ungauged Basins. J. Hydroelectr. Eng. 2013, 32, 15–19. [Google Scholar]
- Maidment, D.R. Developing a Spatially Distributed Unit Hydrograph by Using Gis. In Application of Geographic Information Systems in Hydrology and Water Resources Management; IAHS Publication: Vienna, Austria, 1993; pp. 181–192. [Google Scholar]
- Hock, R.; Rees, G.; Williams, M.W.; Ramirez, E. Contribution from Glaciers and Snow Cover to Runoff from Mountains in Different Climates. Hydrol. Process. 2010, 20, 2089–2090. [Google Scholar] [CrossRef]
- Luo, Y.; Arnold, J.; Liu, S.; Wang, X.; Chen, X. Inclusion of Glacier Processes for Distributed Hydrological Modeling at Basin Scale with Application to a Watershed in Tianshan Mountains, Northwest China. J. Hydrol. 2013, 477, 72–85. [Google Scholar] [CrossRef]
- Li, X.M.; Ma, Y.; Sun, Y.H.; Gong, H.; Li, X. Flood Hazard Assessment in Pakistan at Grid Scale. J. Geo-Inf. Sci. 2013, 15, 314–320. [Google Scholar] [CrossRef]
- Lian, J.; Gong, H.; Li, X.; Zhao, W.; Hu, Z. Design and Development of Flood/Waterlogging Disaster Risk Model Based on Arcobjects. J. Geo-Inf. Sci. 2009, 11, 376–381. [Google Scholar] [CrossRef]
- Chen, G. Chinese Mountain Development Report; The Commercial Press: Beijing, China, 2010. [Google Scholar]
- Gang, Z.; Pang, B.; Xu, Z.; Wang, Z.; Shi, R. Assessment on the Hazard of Flash Flood Disasters in China. J. Hydraul. Eng. 2016, 47, 1133–1142. [Google Scholar]
- Verdhen, A.; Chahar, B.R.; Sharma, O.P. Snowmelt Modelling Approaches in Watershed Models: Computation and Comparison of Efficiencies under Varying Climatic Conditions. Water Resour. Manag. 2014, 28, 3439–3453. [Google Scholar] [CrossRef]
- Tahir, A.A.; Chevallier, P.; Arnaud, Y.; Neppel, L.; Ahmad, B. Modeling Snowmelt-Runoff under Climate Scenarios in the Hunza River Basin, Karakoram Range, Northern Pakistan. J. Hydrol. 2011, 409, 104–117. [Google Scholar] [CrossRef]
- Gan, R.; Luo, Y.; Zuo, Q.; Sun, L. Effects of Projected Climate Change on the Glacier and Runoff Generation in the Naryn River Basin, Central Asia. J. Hydrol. 2015, 523, 240–251. [Google Scholar] [CrossRef]
- Troin, M.; Poulin, A.; Baraer, M.; Brissette, F. Comparing Snow Models under Current and Future Climates: Uncertainties and Implications for Hydrological Impact Studies. J. Hydrol. 2016, 540, 588–602. [Google Scholar] [CrossRef]
- Jost, G.; Moore, R.D.; Weiler, M.; Gluns, D.R.; Alila, Y. Use of Distributed Snow Measurements to Test and Improve a Snowmelt Model for Predicting the Effect of Forest Clear-Cutting. J. Hydrol. 2009, 376, 94–106. [Google Scholar] [CrossRef]
- Flynn, K.F. Evaluation of Swat for Sediment Prediction in a Mountainous Snowmelt-Dominated Catchment. Trans. Asabe 2011, 54, 113–122. [Google Scholar] [CrossRef]
- Kim, S.B.; Shin, H.J.; Park, M.; Kim, S.J. Assessment of Future Climate Change Impacts on Snowmelt and Stream Water Quality for a Mountainous High-Elevation Watershed Using Swat. Paddy Water Environ. 2015, 13, 557–569. [Google Scholar] [CrossRef]
- Millares, A.; Polo, M.J.; Moñino, A.; Herrero, J.; Losada, M.A. Bedload Dynamics and Associated Snowmelt Influence in Mountainous and Semiarid Alluvial Rivers. Geomorphology 2014, 206, 330–342. [Google Scholar] [CrossRef]
- Xie, Y. Analysis of Flood Causes and Classification Characteristics of the Tizinafu River. China Water Transp. 2014, 14, 221–222. [Google Scholar]
- Zhang, H.; Wei, W. Application of Weather Radar in Flood Early Warning. Adv. Sci. Technol. Water Resour. 1996, 3, 21–25. [Google Scholar]
- Zhang, X.Y.; Jia, L.I.; Yang, Y.Z.; You, Z. Runoff Simulation of the Catchment of the Headwaters of the Yangtze River Based on Swat Model. J. Northwest For. Univ. 2012, 5, 009. [Google Scholar] [CrossRef]
- Tian, Y.; Peterslidard, C.D.; Eylander, J.B.; Joyce, R.J.; Huffman, G.J.; Adler, R.F.; Hsu, K.; Turk, F.J.; Garcia, M.; Zeng, J. Parameter Values for Snowmelt Runoff Modelling. J. Hydrol. 1986, 84, 197–219. [Google Scholar]
- Anderson, E.A. A Point of Energy and Mass Balance Model of Snow Cover; National Oceanic and Atmospheric Administration Technical Report NWS 19; US Department of Commerce: Silver Springs, MD, USA, 1976; pp. 1–150.
- He, Z.H.; Parajka, J.; Tian, F.Q.; Blöschl, G. Estimating Degree-Day Factors from Modis for Snowmelt Runoff Modeling. Hydrol. Earth Syst. Sci. 2014, 11, 4773–4789. [Google Scholar] [CrossRef]
- Jones, H.G.; Sochanska, W.; Stein, J.; Roberge, J.; Plamondon, A.P.; Charette, J.Y. Snowmelt in a Boreal Forest Site: An Integrated Model of Meltwater Quality (Snoqual1); Springer: Dordrecht, The Netherlands, 1986. [Google Scholar]
- Larson, L.; Singh, V.P.; Frevert, D. National Weather Service River Forecast System (Nwsrfs); National Weather Service: Silver spring, MD, USA, 2002.
- Shimamura, Y.; Izumi, T.; Matsuyama, H. Remote Sensing of Areal Distribution of Snow Cover and Snow Water Resources in Mountains Based on Synchronous Observations of Landsat-7 Satellite: A Case Study around the Joetsu Border of Niigata Prefecture in Japan. Proc. Gen. Meet. Assoc. Jpn. Geogr. 2004. [Google Scholar] [CrossRef]
- Herrero, J.; Polo, M.J.; Moñino, A.; Losada, M.A. An Energy Balance Snowmelt Model in a Mediterranean Site. J. Hydrol. 2009, 371, 98–107. [Google Scholar] [CrossRef]
- Anderton, S.P.; White, S.M.; Alvera, B. Micro-Scale Spatial Variability and the Timing of Snow Melt Runoff in a High Mountain Catchment. J. Hydrol. 2002, 268, 158–176. [Google Scholar] [CrossRef]
- Snauffer, A.M.; Hsieh, W.W.; Cannon, A.J. Comparison of Gridded Snow Water Equivalent Products with in Situ Measurements in British Columbia, Canada. J. Hydrol. 2016, 541, 714–726. [Google Scholar] [CrossRef]
- Dziubanski, D.; Franz, K. Assimilation of Amsr-E Snow Water Equivalent Data in a Spatially-Lumped Snow Model. In Proceedings of the AGU Fall Meeting, San Francisco, CA, USA, 14–18 December 2015. [Google Scholar]
- Feng, T.; Feng, S. An Energy Balance Snowmelt Model for Application at a Continental Alpine Site. Procedia Eng. 2012, 37, 208–213. [Google Scholar] [CrossRef]
- Yu, W.; Zhao, Y.; Nan, Z.; Li, S. Improvement of Snowmelt Implementation in the Swat Hydrologic Model. Acta Ecol. Sin. 2013, 33, 6992–7001. [Google Scholar]
- Arnold, J.G.; Fohrer, N. Swat2000: Current Capabilities and Research Opportunities in Applied Watershed Modelling. Hydrol. Process. 2005, 19, 563–572. [Google Scholar] [CrossRef]
- Fontaine, T.A.; Cruickshank, T.S.; Arnold, J.G.; Hotchkiss, R.H. Development of a Snowfall–Snowmelt Routine for Mountainous Terrain for the Soil Water Assessment Tool (Swat). J. Hydrol. 2002, 262, 209–223. [Google Scholar] [CrossRef]
- Xu, C.; Chen, Y.; Hamid, Y.; Tashpolat, T.; Chen, Y.; Ge, H.; Li, W. Long-Term Change of Seasonal Snow Cover and Its Effects on River Runoff in the Tarim River Basin, Northwestern China. Hydrol. Process. 2010, 23, 2045–2055. [Google Scholar] [CrossRef]
- Arnold, J.G.; Muttiah, R.S.; Srinivasan, R.; Allen, P.M. Regional Estimation of Base Flow and Groundwater Recharge in the Upper Mississippi River Basin. J. Hydrol. 2000, 227, 21–40. [Google Scholar] [CrossRef]
- Zhang, Y.; Liu, S.; Ding, Y. Spatial Variation of Degree-Day Factors on the Observed Glaciers in Western China. Acta Geogr. Sin. 2006, 61, 89–98. [Google Scholar] [CrossRef]
- Zhang, Y.; Suzuki, K.; Kadota, T.; Ohata, T. Sublimation from Snow Surface in Southern Mountain Taiga of Eastern Siberia. J. Geophys. Res. Atmos. 2004, 109D21. [Google Scholar] [CrossRef]
- Wang, X.; Melesse, A.M. Evaluation of the Swat Model’s Snowmelt Hydrology in a Northwestern Minnesota Watershed. Trans. Asabe 2005, 48, 1359–1376. [Google Scholar] [CrossRef]
- Kumar, M.; Marks, D.; Dozier, J.; Reba, M.; Winstral, A. Evaluation of Distributed Hydrologic Impacts of Temperature-Index and Energy-Based Snow Models. Adv. Water Resour. 2013, 56, 77–89. [Google Scholar] [CrossRef]
- Jost, G.; Moore, R.D.; Smith, R.; Gluns, D.R. Distributed Temperature-Index Snowmelt Modelling for Forested Catchments. J. Hydrol. 2012, 420, 87–101. [Google Scholar] [CrossRef]
- Regine, H. A Distributed Temperature-Index Ice- and Snowmelt Model Including Potential Direct Solar Radiation. J. Glaciol. 1999, 45, 101–111. [Google Scholar]
- Cao, K.; Long, A.; Wang, J.; Liu, Y.; Cai, S.; Li, Y. Research and Application on Basin Accumulated Temperature Distribution (Atd) Model at the Snowmelt Flood Magnitude. J. North China Univ. Water Resour. Electr. Power (Nat. Sci. Ed.) 2017, 38, 10–18. [Google Scholar]
- Qi, L.; Ying, Z. Research on Winter Precipitation Types’ Discrimination Criterion in Eastern China. Meteorol. Mon. 2012, 38, 96–102. [Google Scholar]
- Zhang, F.; Zhang, H.; Hagen, S.C.; Ye, M.; Wang, D.; Gui, D.; Zeng, C.; Tian, L.; Liu, J. Snow Cover and Runoff Modelling in a High Mountain Catchment with Scarce Data: Effects of Temperature and Precipitation Parameters. Hydrol. Process. 2015, 29, 52–65. [Google Scholar] [CrossRef]
- Meng, X.; Ji, X.; Liu, Z.; Xiao, J.; Chen, X.; Wang, F. Research on Improvement and Application of Snowmelt Module in Swat. J. Nat. Resour. 2014, 29, 528–539. [Google Scholar]
- Braud, I.; Roux, H.; Anquetin, S.; Maubourguet, M.M.; Manus, C.; Viallet, P.; Dartus, D. The Use of Distributed Hydrological Models for the Gard 2002 Flash Flood Event: Analysis of Associated Hydrol. Process. J. Hydrol. 2010, 394, 162–181. [Google Scholar] [CrossRef] [Green Version]
- Vincendon, B.; Ducrocq, V.; Saulnier, G.M.; Bouilloud, L.; Chancibault, K.; Habets, F.; Noilhan, J. Benefit of Coupling the Isba Land Surface Model with a Topmodel Hydrological Model Version Dedicated to Mediterranean Flash-Floods. J. Hydrol. 2010, 394, 256–266. [Google Scholar] [CrossRef]
- Fuka, D.R.; Easton, Z.M.; Brooks, E.S.; Boll, J.; Steenhuis, T.S.; Walter, M.T. A Simple Process-Based Snowmelt Routine to Model Spatially Distributed Snow Depth and Snowmelt in the Swat Model. Jawra J. Am. Water Resour. Assoc. 2012, 48, 1151–1161. [Google Scholar] [CrossRef]
- Green, C.H.; Van Griensven, A. Autocalibration in Hydrologic Modeling: Using Swat2005 in Small-Scale Watersheds. Environ. Model. Softw. 2008, 23, 422–434. [Google Scholar] [CrossRef]
- Ahl, R.S.; Woods, S.W.; Zuuring, H.R. Hydrologic Calibration and Validation of Swat in a Snow-Dominated Rocky Mountain Watershed, Montana, U.S.A. Jawra J. Am. Water Resour. Assoc. 2010, 44, 1411–1430. [Google Scholar] [CrossRef]
- Engelhardt, M.; Schuler, T.V.; Andreassen, L.M. Runoff Modelling and the Contribution of Snow and Glacier Melt to the Discharge for Highly Glacierized Catchments in Norway. In Proceedings of the EGU General Assembly Conference 2013, Vienna, Austria, 7–12 April 2013. [Google Scholar]
- Haq, M. Snowmelt Runoff Investigation in River Swat Upper Basin Using Snowmelt Runoff Model, Remote Sensing and GIS Techniques; The International Institute for Geo-information Science and Earth: Enschede, The Netherlands, 2008. [Google Scholar]
- Dudley, R.W.; Hodgkins, G.A.; Mchale, M.R.; Kolian, M.J.; Renard, B. Trends in Snowmelt-Related Streamflow Timing in the Conterminous United States. J. Hydrol. 2017, 547, 208–221. [Google Scholar] [CrossRef]
- Tiwari, S.; Kar, S.C.; Bhatla, R. Snowfall and Snowmelt Variability over Himalayan Region in Inter-Annual Timescale. Aquat. Procedia 2015, 4, 942–949. [Google Scholar] [CrossRef]
- Huber, W.C.; Dickinson, R.E.; Barnwell, T.O. Storm Water Management Model, Version 4; U.S. Environmental Protection Agency: Washington, DC, USA, 1992.
- Ghodrati, B. Snowmelt runoff from Porsön residential area, Luleå. In Proceedings of the International Conference on Urban Storm Drainage, Gothenburg, Sweden, 4–6 June 1984. [Google Scholar]
- Bengtsson, L.; Westerström, G. Urban Snowmelt and Runoff in Northern Sweden. Int. Assoc. Sci. Hydrol. Bull. 1992, 37, 263–275. [Google Scholar] [CrossRef]
- Pomeroy, J.W.; Marks, D.; Link, T.; Ellis, C.; Hardy, J.; Rowlands, A.; Granger, R. The Impact of Coniferous Forest Temperature on Incoming Longwave Radiation to Melting Snow. Hydrol. Process. 2010, 23, 2513–2525. [Google Scholar] [CrossRef]
- Wang, X.; Luo, Y.; Sun, L.; Zhang, Y. Assessing the Effects of Precipitation and Temperature Changes on Hydrol. Process. in a Glacier-Dominated Catchment. Hydrol. Process. 2015, 29, 4830–4845. [Google Scholar] [CrossRef]
- Xiao, Y. A Method of Calculating Effective Accumulated Temperature Is Introduced Based on Daily Maximum and Minimum Temperature. Plant Prot. 1983, 9, 43–45. [Google Scholar]
- Watanabe, N.; Xiao, Y.Y. A Simple Method for Calculating Effective Accumulated Temperature Based on Daily Maximum and Minimum Temperature. Plant Prot. 1981, 2, 39–44. [Google Scholar]
- You, F.; Guo, L.; Shi, Y.; Zeng, J. Discrimination Index of Precipitation Phase State and Its Verification in Beijing. J. Meteorol. Environ. 2013, 29, 49–54. [Google Scholar]
- Li, J.; Li, G.; Pei, J.; Wang, F.; Wang, X.; Wen, J. Analysis on the Phase Transformation of Precipitation During a Strong Cold Wave Happened in Spring. Meteorol. Mon. 2009, 35, 87–94. [Google Scholar]
- Liu, J. The Study on the Application of Weather Radar Precipitation in Real-Time Flood Forecasting. Master’s Thesis, Hehai University, Nanjing, China, 2003. [Google Scholar]
- Zhang, L.; Guo, R.; Zeng, J.; Lu, B.; Duan, L.; Liu, L.; Sun, Z. Research on Discrimination Criterion of Precipitation Types in Beijing in Winter. Plateau Meteorol. 2013, 32, 1780–1786. [Google Scholar]
- Nash, J.E.; Sutcliffe, J.V. River Flow Forecasting through Conceptual Models Part I—A Discussion of Principles. J. Hydrol. 1970, 10, 282–290. [Google Scholar] [CrossRef]
- Moriasi, D.N.; Arnold, J.G.; Van Liew, M.W.; Bingner, R.L.; Harmel, R.D.; Veith, T.L. Model Evaluation Guidelines for Systematic Quantification of Accuracy in Watershed Simulations. Trans. Asabe 2007, 50, 885–900. [Google Scholar] [CrossRef]
- Clow, D.W. Changes in the Timing of Snowmelt and Streamflow in Colorado: A Response to Recent Warming. J. Clim. 2010, 23, 2293–2306. [Google Scholar] [CrossRef]
- Stone, R.S.; Dutton, E.G.; Harris, J.M.; Longenecker, D. Earlier Spring Snowmelt in Northern Alaska as an Indicator of Climate Change. J. Geophys. Res. Atmos. 2002, 107. [Google Scholar] [CrossRef]
- Ficklin, D.L.; Barnhart, B.L. Corrigendum to “Swat Hydrologic Model Parameter Uncertainty and Its Implications for Hydroclimatic Projections in Snowmelt-Dependent Watersheds. J. Hydrol. 2015, 527, 1189. [Google Scholar] [CrossRef]
- Dahri, Z.H.; Ahmad, B.; Leach, J.H.; Ahmad, S. Satellite-Based Snowcover Distribution and Associated Snowmelt Runoff Modeling in Swat River Basin of Pakistan. Proc. Pak. Acad. Sci. 2011, 48, 19–32. [Google Scholar]
- Engelhardt, M.; Schuler, T.V.; Andreassen, L.M. Contribution of Snow and Glacier Melt to Discharge for Highly Glacierised Catchments in Norway. Hydrol. Earth Syst. Sci. 2014, 18, 511–523. [Google Scholar] [CrossRef]
- Wang, L.; Zhang, X.H.; Liu, Z. Calculation Method of Snow Melting Flood in the Middle and High Mountain Area Xinjiang. Electr. Power Surv. Des. 2016, 10, 72–75. [Google Scholar]
- Bowyer, A. Variation Trends and Multi-Scale Analysis of Flood Affected Area in Various Regions of Xinjiang. Acta Geogr. Sin. 2008, 63, 769–779. [Google Scholar]
- Tan, Y.; Mao, W.; Li, X.; Wang, H. Study on the Models of Predicting the Annual Accumulated Temperature in the Main Cotton-Production Regions in Xinjiang. Arid Zone Res. 2005, 22, 259–263. [Google Scholar]
- Zhou, Z.; Bi, Y. Improvement of Swat Model and Its Application in Simulation of Snowmelt Runoff. In Proceedings of the National Symposium on Ice Engineering, Hohhot, China, 1 July 2011. [Google Scholar]
- Sexton, A.M.; Sadeghi, A.M.; Zhang, X.; Srinivasan, R.; Shirmohammadi, A. Using Nexrad and Rain Gauge Precipitation Data for Hydrologic Calibration of Swat in a Northeastern Watershed. Trans. ASABE 2010, 53, 1501–1510. [Google Scholar] [CrossRef]
- Richard, C.; Gratton, D.J. The Importance of the Air Temperature Variable for the Snowmelt Runoff Modelling Using SRM. Hydrol. Process. 2010, 15, 3357–3370. [Google Scholar] [CrossRef]
- Mernild, S.H.; Liston, G.E. The Influence of Air Temperature Inversions on Snowmelt and Glacier Mass Balance Simulations, Ammassalik Island, Southeast Greenland. J. Appl. Meteorol. Climatol. 2010, 49, 47–67. [Google Scholar] [CrossRef]
- Cazorzi, F.; Dalla Fontana, G. Snowmelt Modelling by Combining Air Temperature and a Distributed Radiation Index. J. Hydrol. 1996, 181, 169–187. [Google Scholar] [CrossRef]
- Lu, X.Y.; Xie, G.H.; Li, Y.; Chen, S.J. Variation Characteristics of Snow Cover and the Relation to Air Temperature and Precipitation in Manasi River Basin. Desert Oasis Meteorol. 2010, 4, 35–39. [Google Scholar]
- Zhao, C.Y.; Yan, X.Y.; Li, D.L.; Wang, Y.; Luo, Y. The Variation of Snow Cover and Its Relationship to Air Temperature and Precipitation in Liaoning Province During 1961–2007. J. Glaciol. Geocryol. 2010, 32, 461–468. [Google Scholar]
- Xu, L.; Wu, B. Relationship between Eurasian Snow Cover and Late-Spring and Early-Summer Rainfall in China in 2010. Plateau Meteorol. 2012, 31, 706–714. [Google Scholar]
- Fu, H.; Jia, H. Snowfall Estimation of Maximum Possible Snow Melt in Midsummer in Kumalake River Basin. Arid Land Geogr. 2012, 35, 193–199. [Google Scholar]
- Wang, P.; Mu, Z. Study on Relationship of Snowmelt Runoff with Snow Area and Temperature in Km River Basin. J. Water Resour. Water Eng. 2013, 24, 28–31. [Google Scholar]
- Zhou, Y.; Xu, W.; Zhang, J.; Bai, A.; Liu, X.; Xu, G. A Comparative Analysis of the Two Dynamic Snow-Melting Process and Their Relationship with Air Temperature During 2013–2015 in the Area of Maduo, Tibetan Plateau. J. Nat. Resour. 2017, 32, 101–113. [Google Scholar]
- Aizen, V.B.; Aizen, E.M.; Nesterov, V.N.; Sexton, D.D. A Study of Glacial Runoff Regime in Central Tien Shan During 1989–1990. J. Glaciol. Geocryol. 1993, 3, 442–459. [Google Scholar]
- Zhang, Y.; Luo, Y.; Sun, L. Quantifying Future Changes in Glacier Melt and River Runoff in the Headwaters of the Urumqi River, China. Environ. Earth Sci. 2016, 75, 770. [Google Scholar] [CrossRef]
- Rulin, O.; Liliang, R.; Weiming, C.; Zhongbo, Y. Application of Hydrological Models in a Snowmelt Region of Aksu River Basin. Water Sci. Eng. 2008, 1, 1–13. [Google Scholar]
- Hock, R.; Jansson, P.; Braun, L.N. Modelling the Response of Mountain Glacier Discharge to Climate Warming; Springer: Dordrecht, The Netherlands, 2005. [Google Scholar]
- Hock, R. Temperature Index Melt Modelling in Mountain Areas. J. Hydrol. 2003, 282, 104–115. [Google Scholar] [CrossRef]
- Zhang, R.; Liang, T.; Guo, J.; Xie, H.; Feng, Q.; Aimaiti, Y. Grassland Dynamics in Response to Climate Change and Human Activities in Xinjiang from 2000 to 2014. Sci. Rep. 2018, 8, 2888. [Google Scholar] [CrossRef] [PubMed]
- Iwata, Y.; Nemoto, M.; Hasegawa, S.; Yanai, Y.; Kuwao, K.; Hirota, T. Influence of Rain, Air Temperature, and Snow Cover on Subsequent Spring-Snowmelt Infiltration into Thin Frozen Soil Layer in Northern Japan. J. Hydrol. 2011, 401, 165–176. [Google Scholar] [CrossRef]
Figure 1.
Digital elevation of the Tizinafu River Basin, Kunlun Mountains, Western China.

Figure 2.
Measured and simulated temperature change curves.

Figure 3.
Relationship between temperature and snow cover in 2013.

Figure 4.
Framework of the modified degree-day factor method. Tmax means daily maximum temperature, SFTMP means snowfall temperature, SFTMP_accu means snowfall accumulated temperature, Taccu means daily accumulated temperature, SMTMP means snow melt base temperature, SMTMP_accu means snow melt base accumulated temperature.

Figure 5.
Comparison of simulated with measured streamflow processes during the calibration and validation periods (2013–2014).
Figure 5.
Comparison of simulated with measured streamflow processes during the calibration and validation periods (2013–2014).

Figure 6.
Comparison of calculated snowmelt volume from the original and modified model during the calibration and validation periods (2013 and 2014).
Figure 6.
Comparison of calculated snowmelt volume from the original and modified model during the calibration and validation periods (2013 and 2014).

Figure 7.
Comparison among 8 days’ calculated snowmelt volume from the original and modified model and snow cover area during the snowmelt season.
Figure 7.
Comparison among 8 days’ calculated snowmelt volume from the original and modified model and snow cover area during the snowmelt season.

Figure 8.
The relationship between monthly snow melting and accumulated temperature (AT), maximum temperature (MT) at the calibration and validation stage (2013–2014) (The red line in the figure represents the cumulative temperature threshold of snow melting.
Figure 8.
The relationship between monthly snow melting and accumulated temperature (AT), maximum temperature (MT) at the calibration and validation stage (2013–2014) (The red line in the figure represents the cumulative temperature threshold of snow melting.

Figure 9.
Correlation between monthly snow melting and AT (a) using the modified model and (b) using the original model.
Figure 9.
Correlation between monthly snow melting and AT (a) using the modified model and (b) using the original model.


Table 1.
The temperature conditions of rain and snow separation in climatic sites.
| Sites | Momuke | Kudi | Xihexiu | |||||||||
|---|---|---|---|---|---|---|---|---|---|---|---|---|
| Rainfall Temperature/°C | Snowfall Temperature/°C | Rainfall Temperature/°C | Snowfall Temperature/°C | Rainfall Temperature/°C | Snowfall Temperature/°C | |||||||
| AT | MT | AT | MT | AT | MT | AT | MT | AT | MT | AT | MT | |
| 2013 | 41.68 | 16.22 | 30.03 | 14.97 | 28.8 | 13.03 | 18.08 | 9.37 | 26.05 | 11.73 | 2.9 | 1.41 |
| 2014 | 40.86 | 16.37 | 39.21 | 18.87 | 35.96 | 15.04 | 28.59 | 14.03 | 11.21 | 5.65 | 11.25 | 5.79 |
| Average | 41.27 | 16.29 | 34.62 | 16.92 | 32.38 | 14.04 | 23.33 | 11.7 | 18.63 | 8.69 | 7.08 | 3.6 |
Table 2.
Calibrated values of key parameters in the Soil and Water Assessment Tool Model (SWAT) simulation for the Tizinafu River Basin, Kunlun Mountains, Western China.
Table 2.
Calibrated values of key parameters in the Soil and Water Assessment Tool Model (SWAT) simulation for the Tizinafu River Basin, Kunlun Mountains, Western China.
| Parameter | Unit | Description | Calibrated Value |
|---|---|---|---|
| SFTMP | °C | Snowfall temperature | 3.24 |
| SFTMP_accu | °C | Snowfall AT | 23 |
| SMTMP | °C | Snow melt base temperature | 2.97 |
| SMTMP_accu | °C | Snow melt base AT | 17 |
| SMFMX | mm H2O/°C-day | Melt factor for snow on 21 June | 7.87 |
| SMFMN | mm H2O/°C-day | Melt factor for snow on 21 December | 9.49 |
| TPLAS | °C·km−1 | Temperature lapse rate | −7.31 |
| PLAPS | mm·km−1 | Precipitation lapse rate | 21 |
Table 3.
Daily streamflow calibration and validation results for the Tizinafu River Basin, Kunlun Mountains, Western China.
Table 3.
Daily streamflow calibration and validation results for the Tizinafu River Basin, Kunlun Mountains, Western China.
| NSE | R2 | PBIAS (%) | |
|---|---|---|---|
| Original | |||
| Calibration (2013) | 0.71 | 0.89 | 5.79 |
| Validation (2014) | 0.64 | 0.75 | −18.04 |
| Overall (2013–2014) | 0.66 | 0.80 | 7.30 |
| Modified | |||
| Calibration (2013) | 0.75 | 0.89 | 7.30 |
| Validation (2014) | 0.69 | 0.81 | 2.89 |
| Overall (2013–2014) | 0.70 | 0.84 | 6.79 |
Table 4.
Parameters used in the sensitivity analysis and the sensitivity analysis results, the SNO_SUB means initial snow water content [mm H2O], the SNOCOVMX means minimum snow water content that corresponds to 100% snow cover [mm], the SMFMX means melt factor for snow on 21 June [mm H2O/°C-day], the ESCO means soil evaporation compensation factor, the SOL_AWC means soil evaporation compensation factor.
| Sort | Original Model | Modified Model | ||||
|---|---|---|---|---|---|---|
| Parameter | T-Stat | P-Value | Parameter | T-Stat | P-Value | |
| 1 | SMTMP | 0.05 | 0.86 | SMTMP | 0.04 | 0.94 |
| 2 | SNO_SUB | −0.08 | 0.83 | TLAPS | 0.04 | 0.93 |
| 3 | TLAPS | −0.33 | 0.74 | SMTMP_accu | −0.1 | 0.92 |
| 4 | SNOCOVMX | −0.34 | 0.68 | SFTMP_accu | 0.14 | 0.88 |
| 5 | SFTMP | −0.37 | 0.64 | SFTMP | 0.19 | 0.86 |
| 6 | SMFMX | 0.40 | 0.58 | SNO_SUB | 0.23 | 0.81 |
| 7 | PLAPS | −0.49 | 0.55 | PLAPS | 0.32 | 0.74 |
| 8 | ESCO | −0.79 | 0.43 | SMFMN | 0.67 | 0.68 |
| 9 | SOL_AWC | 0.83 | 0.41 | SNOCOVMX | 0.62 | 0.62 |
| 10 | SMFMN | 2.78 | 0.01 | SMFMX | 0.58 | 0.59 |
© 2018 by the authors. Licensee MDPI, Basel, Switzerland. This article is an open access article distributed under the terms and conditions of the Creative Commons Attribution (CC BY) license (http://creativecommons.org/licenses/by/4.0/).
Share and Cite
MDPI and ACS Style
Duan, Y.; Liu, T.; Meng, F.; Luo, M.; Frankl, A.; De Maeyer, P.; Bao, A.; Kurban, A.; Feng, X. Inclusion of Modified Snow Melting and Flood Processes in the SWAT Model. Water 2018, 10, 1715. https://doi.org/10.3390/w10121715
AMA Style
Duan Y, Liu T, Meng F, Luo M, Frankl A, De Maeyer P, Bao A, Kurban A, Feng X. Inclusion of Modified Snow Melting and Flood Processes in the SWAT Model. Water. 2018; 10(12):1715. https://doi.org/10.3390/w10121715
Chicago/Turabian StyleDuan, Yongchao, Tie Liu, Fanhao Meng, Min Luo, Amaury Frankl, Philippe De Maeyer, Anming Bao, Alishir Kurban, and Xianwei Feng. 2018. "Inclusion of Modified Snow Melting and Flood Processes in the SWAT Model" Water 10, no. 12: 1715. https://doi.org/10.3390/w10121715
Note that from the first issue of 2016, this journal uses article numbers instead of page numbers. See further details here.