Establishing Sustainable Development Goal Baselines for Household Drinking Water, Sanitation and Hygiene Services
by
 , ,
, ,
Robert Bain
1,* ,
,
Richard Johnston
2,
Francesco Mitis
2,
Christie Chatterley
1 and
Tom Slaymaker
1 1
Division of Data, Research and Policy, United Nations Children’s Fund (UNICEF), New York, NY 10017, USA
2
Department of Public Health, Environmental and Social Determinants of Health, World Health Organization, 1211 Geneva, Switzerland
*
Author to whom correspondence should be addressed.
Water 2018, 10(12), 1711; https://doi.org/10.3390/w10121711
Submission received: 10 October 2018
/
Revised: 11 November 2018
/
Accepted: 15 November 2018
/
Published: 23 November 2018
(This article belongs to the Special Issue Monitoring and Governance of Water and Sanitation Services and Water Resources for Sustainable Development)
Abstract
:The World Health Organization (WHO) and United Nations Children’s Fund (UNICEF), through the Joint Monitoring Programme (JMP), are responsible for global monitoring of the Sustainable Development Goal (SDG) targets for drinking water, sanitation and hygiene (WASH). The SDGs represent a fundamental shift in household WASH monitoring with a new focus on service levels and the incorporation of hygiene. This article reflects on the process of establishing SDG baselines and the methods used to generate national, regional and global estimates for the new household WASH indicators. The JMP 2017 update drew on over 3000 national data sources, primarily household surveys (n = 1443), censuses (n = 309) and administrative data (n = 1494). Whereas most countries could generate estimates for basic drinking water and basic sanitation, fewer countries could report on basic handwashing facilities, water quality and the disposal of waste from onsite sanitation. Based on data for 96 and 84 countries, respectively, the JMP estimates that globally 2.1 billion (29%) people lacked safely managed drinking water services and 4.5 billion (61%) lacked safely managed sanitation services in 2015. The expanded JMP inequalities database also finds substantial disparities by wealth and sub-national regions. The SDG baselines for household WASH reveal the scale of the challenge associated with achieving universal safely managed services and the substantial acceleration needed in many countries to achieve even basic services for everyone by 2030. Many countries have begun to localise the global SDG targets and are investing in data collection to address the SDG data gaps, whether through the integration of new elements in household surveys or strengthening collection and reporting of information through administrative and regulatory systems.
Keywords:
WASH; Sustainable Development Goals; monitoring; equity; drinking water; sanitation; hygiene; handwashing1. From Millennium Development Goal (MDG) to Sustainable Development Goal (SDG) Water, Sanitation and Hygiene (WASH) Monitoring
The Millennium Development Goals (MDGs) represented a focus for global development at the start of the new millennium, with international attention on 8 global goals [1]. MDG target 7c aimed, by 2015, to halve the proportion of the population without sustainable access to safe drinking water and basic sanitation [1]. World Health Organization (WHO) and United Nations Children’s Fund (UNICEF), through the Joint Monitoring Programme (JMP) for Water Supply and Sanitation, tracked progress towards the target using facility type classifications, recording the population using improved drinking water sources and improved sanitation facilities. At the end of the MDGs, the JMP reported that 2.3 billion and 2.6 billion people, respectively, had gained access to improved drinking water and improved sanitation between 1990 and 2015 [2]. Globally, the water target had been declared met—in 2010—but the sanitation target had been missed by over 700 million people [2].
The history, methods and limitations of global drinking water, sanitation and hygiene (WASH) monitoring prior to the Sustainable Development Goals (SDGs) were reviewed by Bartram et al. [3]. Common critiques of the approach used for MDG monitoring included: insufficient attention to safety, with no direct measurement of water quality [4] or consideration of treatment of wastewater [5]; the use of a binary improved/unimproved indicator which poorly reflects the wide range of service levels people actually receive [6]; a focus on national averages without consideration of the most marginalised in society [7]; and an exclusive focus on household WASH [8].
In 2011 WHO and UNICEF established four technical working groups and held a series of consultations to develop proposals for enhanced WASH monitoring post-2015. Working groups on drinking water, sanitation, hygiene, and equity and non-discrimination identified the strengths and weaknesses of MDG monitoring and developed technical recommendations for future global targets and indicators. The recognition of the Human Rights to Water and Sanitation in 2010 [9] and the involvement of human rights advocates played a critical role in shaping this process and informing subsequent political negotiations between UN Member States on the Sustainable Development Goals, targets and indicators.
The 2030 agenda, adopted by the UN General Assembly in September 2015, established a dedicated goal for water and sanitation (SDG 6) which included targets for drinking water (SDG 6.1), sanitation and hygiene (SDG 6.2) and explicitly referred to the Human Rights to Water and Sanitation [10] (Table 1). The SDGs are broader and more ambitious that preceding development goals and comprise 17 interdependent goals including ending poverty (SDG 1) and hunger (SDG 2), improving health (SDG 3) and education (SDG 4), reducing inequalities (SDG 10) all of which are closely related to progress on WASH. The UN Statistical Commission tasked the Inter-Agency Expert Group on SDG Indicators (IAEG-SDGs), composed of representatives from national statistical offices, with the development of a global indicator framework to track progress for the 169 targets and the identification of custodian agencies responsible for global reporting. Based on their experience of monitoring the MDGs and role in defining monitoring indicators, WHO and UNICEF were chosen as co-custodian agencies for SDG targets 6.1 and 6.2.
In this review article, current members of the WHO/UNICEF JMP team describe the new SDG indicators for WASH, the process of establishing the baseline estimates for the year 2015, and discuss the outlook for SDG WASH monitoring at national, regional and global levels.
2. SDG WASH Targets and Indicators
Table 1 lists the SDG targets for WASH under Goal 6 together with the indicators selected for global reporting by UN member states through the IAEG-SDG [11]. In addition to these official global indicators, the JMP tracks progress against lower rungs in the “service ladders” (Table 2) as well as generating estimates for specific types of improved drinking water sources (piped vs non-piped) and sanitation facilities (sewer, septic, latrines and other) which form part of the JMP methodology for calculating safely managed services and informing sector progress. These indicators include open defecation, which is explicitly mentioned in target SDG 6.2 and has been listed as a supplementary indicator for global reporting and included in the global SDG database, and basic drinking water, sanitation and hygiene services which will contribute to monitoring progress towards universal access to basic services (SDG 1.4).
The JMP has developed updated service ladders for global monitoring of WASH during the SDG period. Table 2 provides definitions of the “rungs” in the SDG ladders including the new ladder for hygiene and new “safely managed” rungs at the top of the drinking water and sanitation ladders. The “safely managed” indicator combines information about the type of facility used by households with the level of service. The new ladders build on the established improved/unimproved facility type classification used for MDG monitoring [3] and seek to address some of the limitations of these binary indicators [6].
The safely managed drinking water services indicator takes into account the quality of drinking water, its availability and whether it is accessible on premises. As such it goes beyond an assessment of the type of drinking water source as a proxy for safety, recognising that all water source types including piped water can potentially be contaminated [12,13]. The indicator also takes into consideration the availability of drinking water, either through information on the number of hours of service or questions to households to determine whether sufficient quantities were available when needed. In doing so, it seeks to address interruptions in service that may prevent households from having sufficient quantities of water for consumption and other domestic uses [14]. Finally, the indicator is based on drinking water sources located on premises in light of the benefits of having water that is easily accessible at home [15,16]. The safely managed sanitation services indicator includes not only the type of sanitation facility but also how excreta are disposed of and whether they are treated. This reflects concerns relating to faecal sludge management in many parts of the world [17,18] and the recognition that a large proportion of wastewater collected by sewer networks is not treated at all or receives insufficient treatment to protect public health [5].
The basic service levels for drinking water and sanitation represent an important step towards achieving safely managed services for all and are among the indicators used for tracking progress towards universal access to basic services under the poverty reduction goal (SDG 1). The basic level for drinking water is closely related to the improved drinking water metric used during the MDGs but with two important changes. Firstly, households collecting water from sources with a roundtrip travel time of greater than 30 min are not counted as having a basic service. Secondly, packaged water and delivered water are considered as improved sources and can count towards basic provided they meet the 30 min accessibility criterion. This change in the improved classification was made since these two types of water source have the potential to be safely managed [19]. A basic sanitation service is equivalent to the MDG improved indicator and continues to exclude shared facilities of an improved type, which are termed “limited” services [20]. The basic hygiene service is entirely new for the SDGs and draws on data generated through a standardised handwashing module used in Multiple Indicator Cluster surveys (MICS) and Demographic and Health surveys (DHS) since 2009 [21].
The SDGs also include a target (SDG 4.a) under the education goal which calls attention to the importance of WASH in schools as part of a “safe, inclusive and effective learning environment” and is aligned with the understanding that “universal” in the target language under goal 6 implies access to services both at home and away from home [22]. Top priorities for global monitoring of non-household WASH include schools and health care facilities. The JMP has convened expert working groups to define basic services in these settings and to develop corresponding questions to be included in facility surveys or administrative information systems [23,24]. Baseline estimates for WASH in schools were published by the JMP in 2018 [25] and estimates for health care facilities are expected in early 2019.
3. JMP Estimation Methodology
A methodology note for the JMP 2017 report provides a detailed description of the methods used to calculate baselines for the SDGs [26]. Here we briefly describe the main steps in preparing national and regional estimates for basic services and safely managed services. Data from this article can be accessed from the WHO/UNICEF JMP website (washdata.org).
3.1. Data Drive and Country Consultation
To prepare SDG baselines, in 2016 the JMP launched a “data drive”, coordinated by WHO and UNICEF regional and country offices to request new sources of information on basic services as well as any data available on the new criteria related to safely managed services. Following the incorporation of these new data sources and restructuring of the databases to integrate the new SDG indicators, preliminary estimates were prepared and shared with national authorities as part of a formal 8-week country consultation process. Feedback was received from over 120 countries.
3.2. Estimates for Basic Services
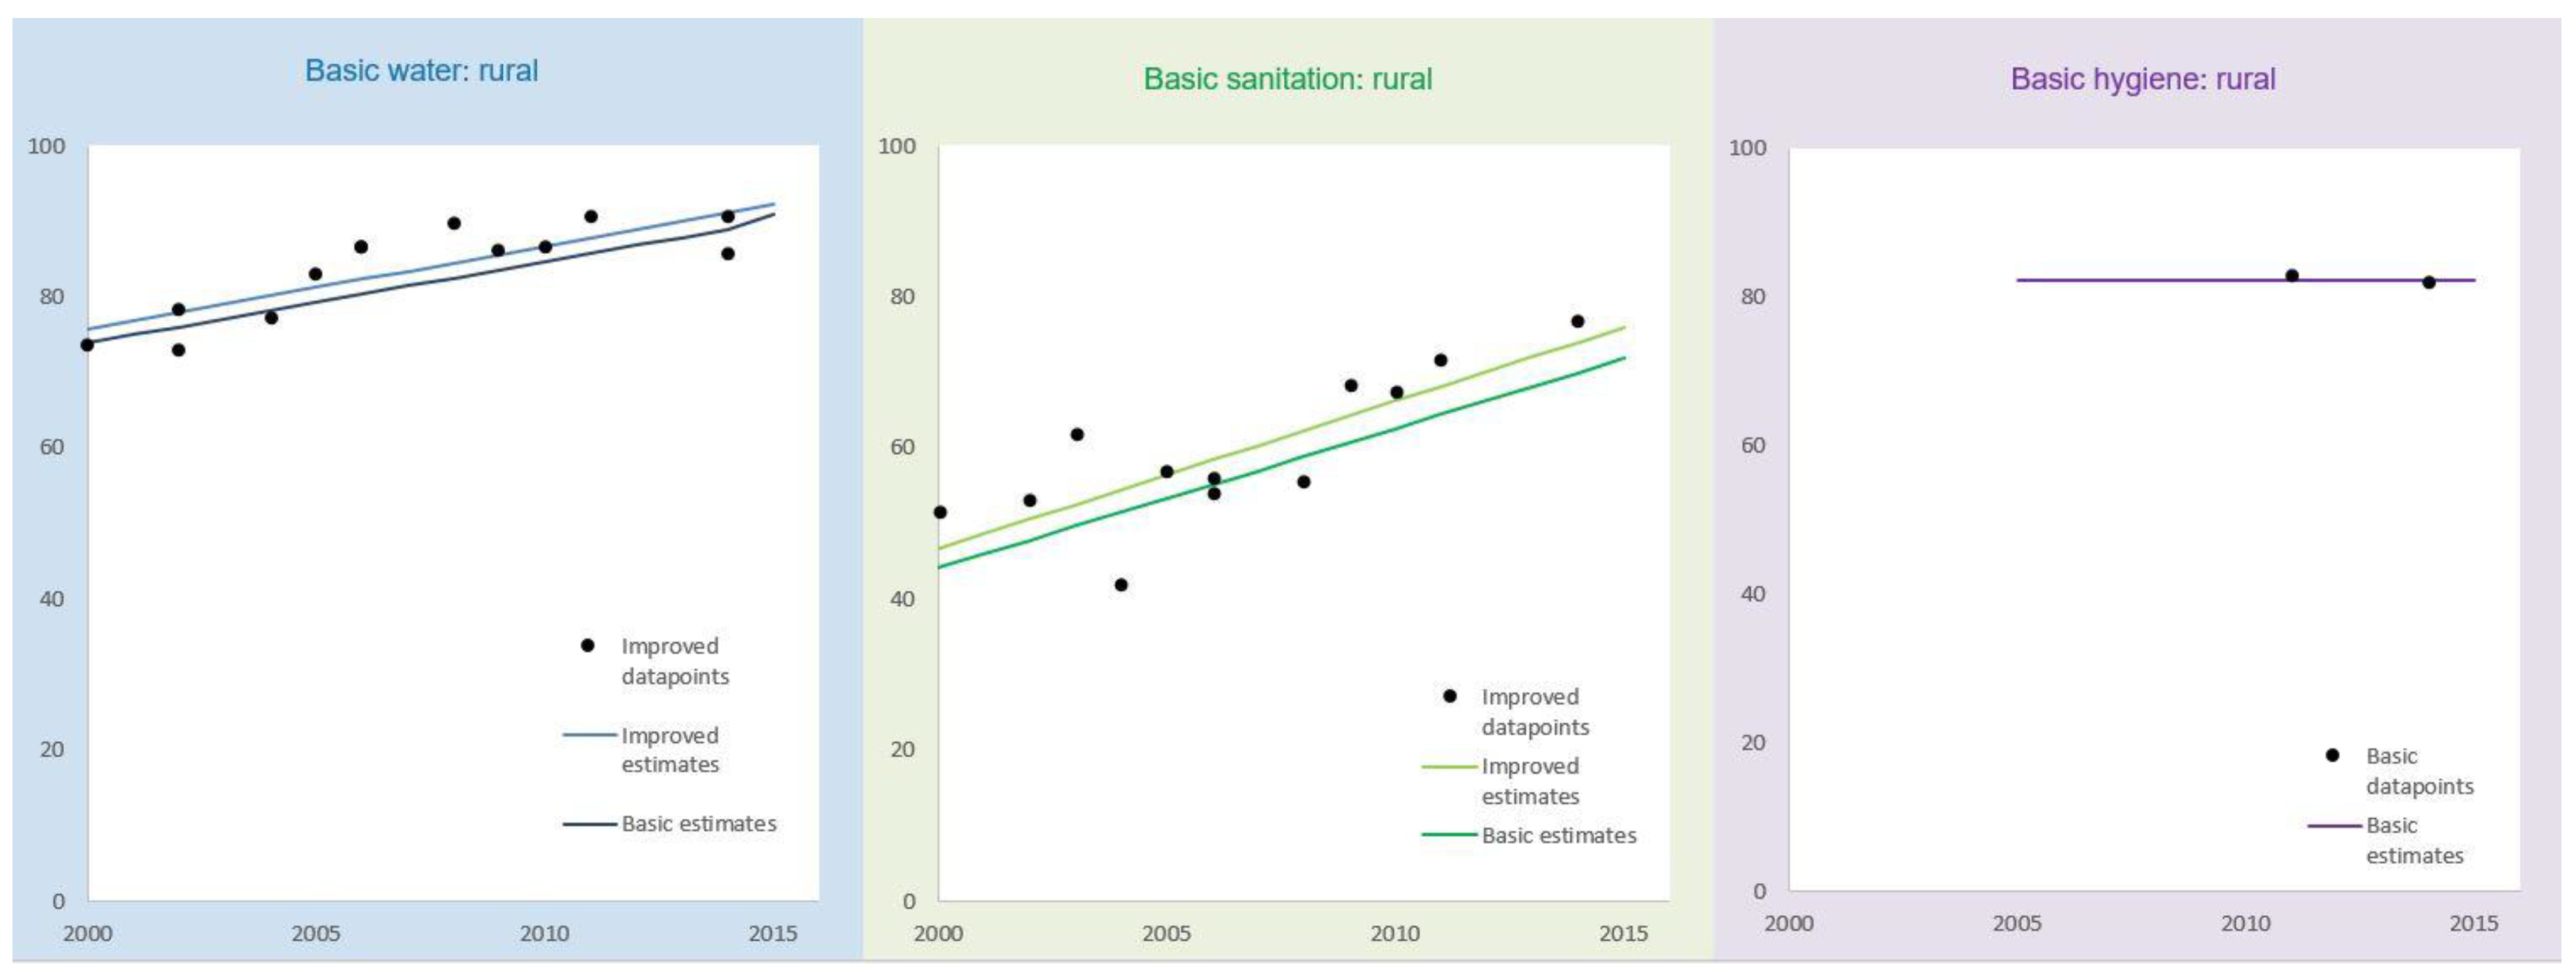
At the core of the JMP estimates for SDG monitoring are data on the types of drinking water, sanitation and hygiene facilities used by households. Following the approaches taken for MDG monitoring, original definitions used in surveys were matched to the JMP international standard classification. Where there were inconsistencies between contemporary surveys or ambiguous categories (e.g., “latrines” or “wells”) adjustments were made or datasets were excluded from further analysis. Trends between 2000 and 2015 were then estimated by plotting coverage of improved drinking water sources and improved sanitation facilities in urban and rural areas and utilising a customised least squares linear regression (Figure 1). An average of all available ratios for the proportion of the population using drinking water sources exceeding 30 min collection time was used to calculate trends for basic drinking water services (dark blue line) based on improved sources (light blue line). Similarly, for sanitation an average of available ratios for the proportion of population sharing sanitation facilities with other households was used to calculate trends for basic sanitation services. In addition to estimates for improved facilities and basic services, the linear regression model was also used to calculate trends for the population practising open defecation and using surface water. The populations using unimproved sources and unimproved sanitation facilities were then calculated by difference.
National estimates were produced by weighting rural and urban estimates using the latest population data from the UN Population Division World Population Prospects and World Urbanization Prospects [27,28]. Regional estimates for basic services were calculated by summing urban and rural estimates from individual countries provided data covered at least 50% of the population. For countries lacking data in a given year, a value was imputed based on the average for that m49 level 2 region [29] in order to ensure that different regional groupings would yield estimates that were consistent with the global estimates. The imputed values were only used for producing regional and global estimates and were not published for individual countries. For basic drinking water and basic sanitation imputed values were used for 4 and 8 countries, areas or territories respectively (out of 232 in total).
3.3. Estimates for Safely Managed Drinking Water Services
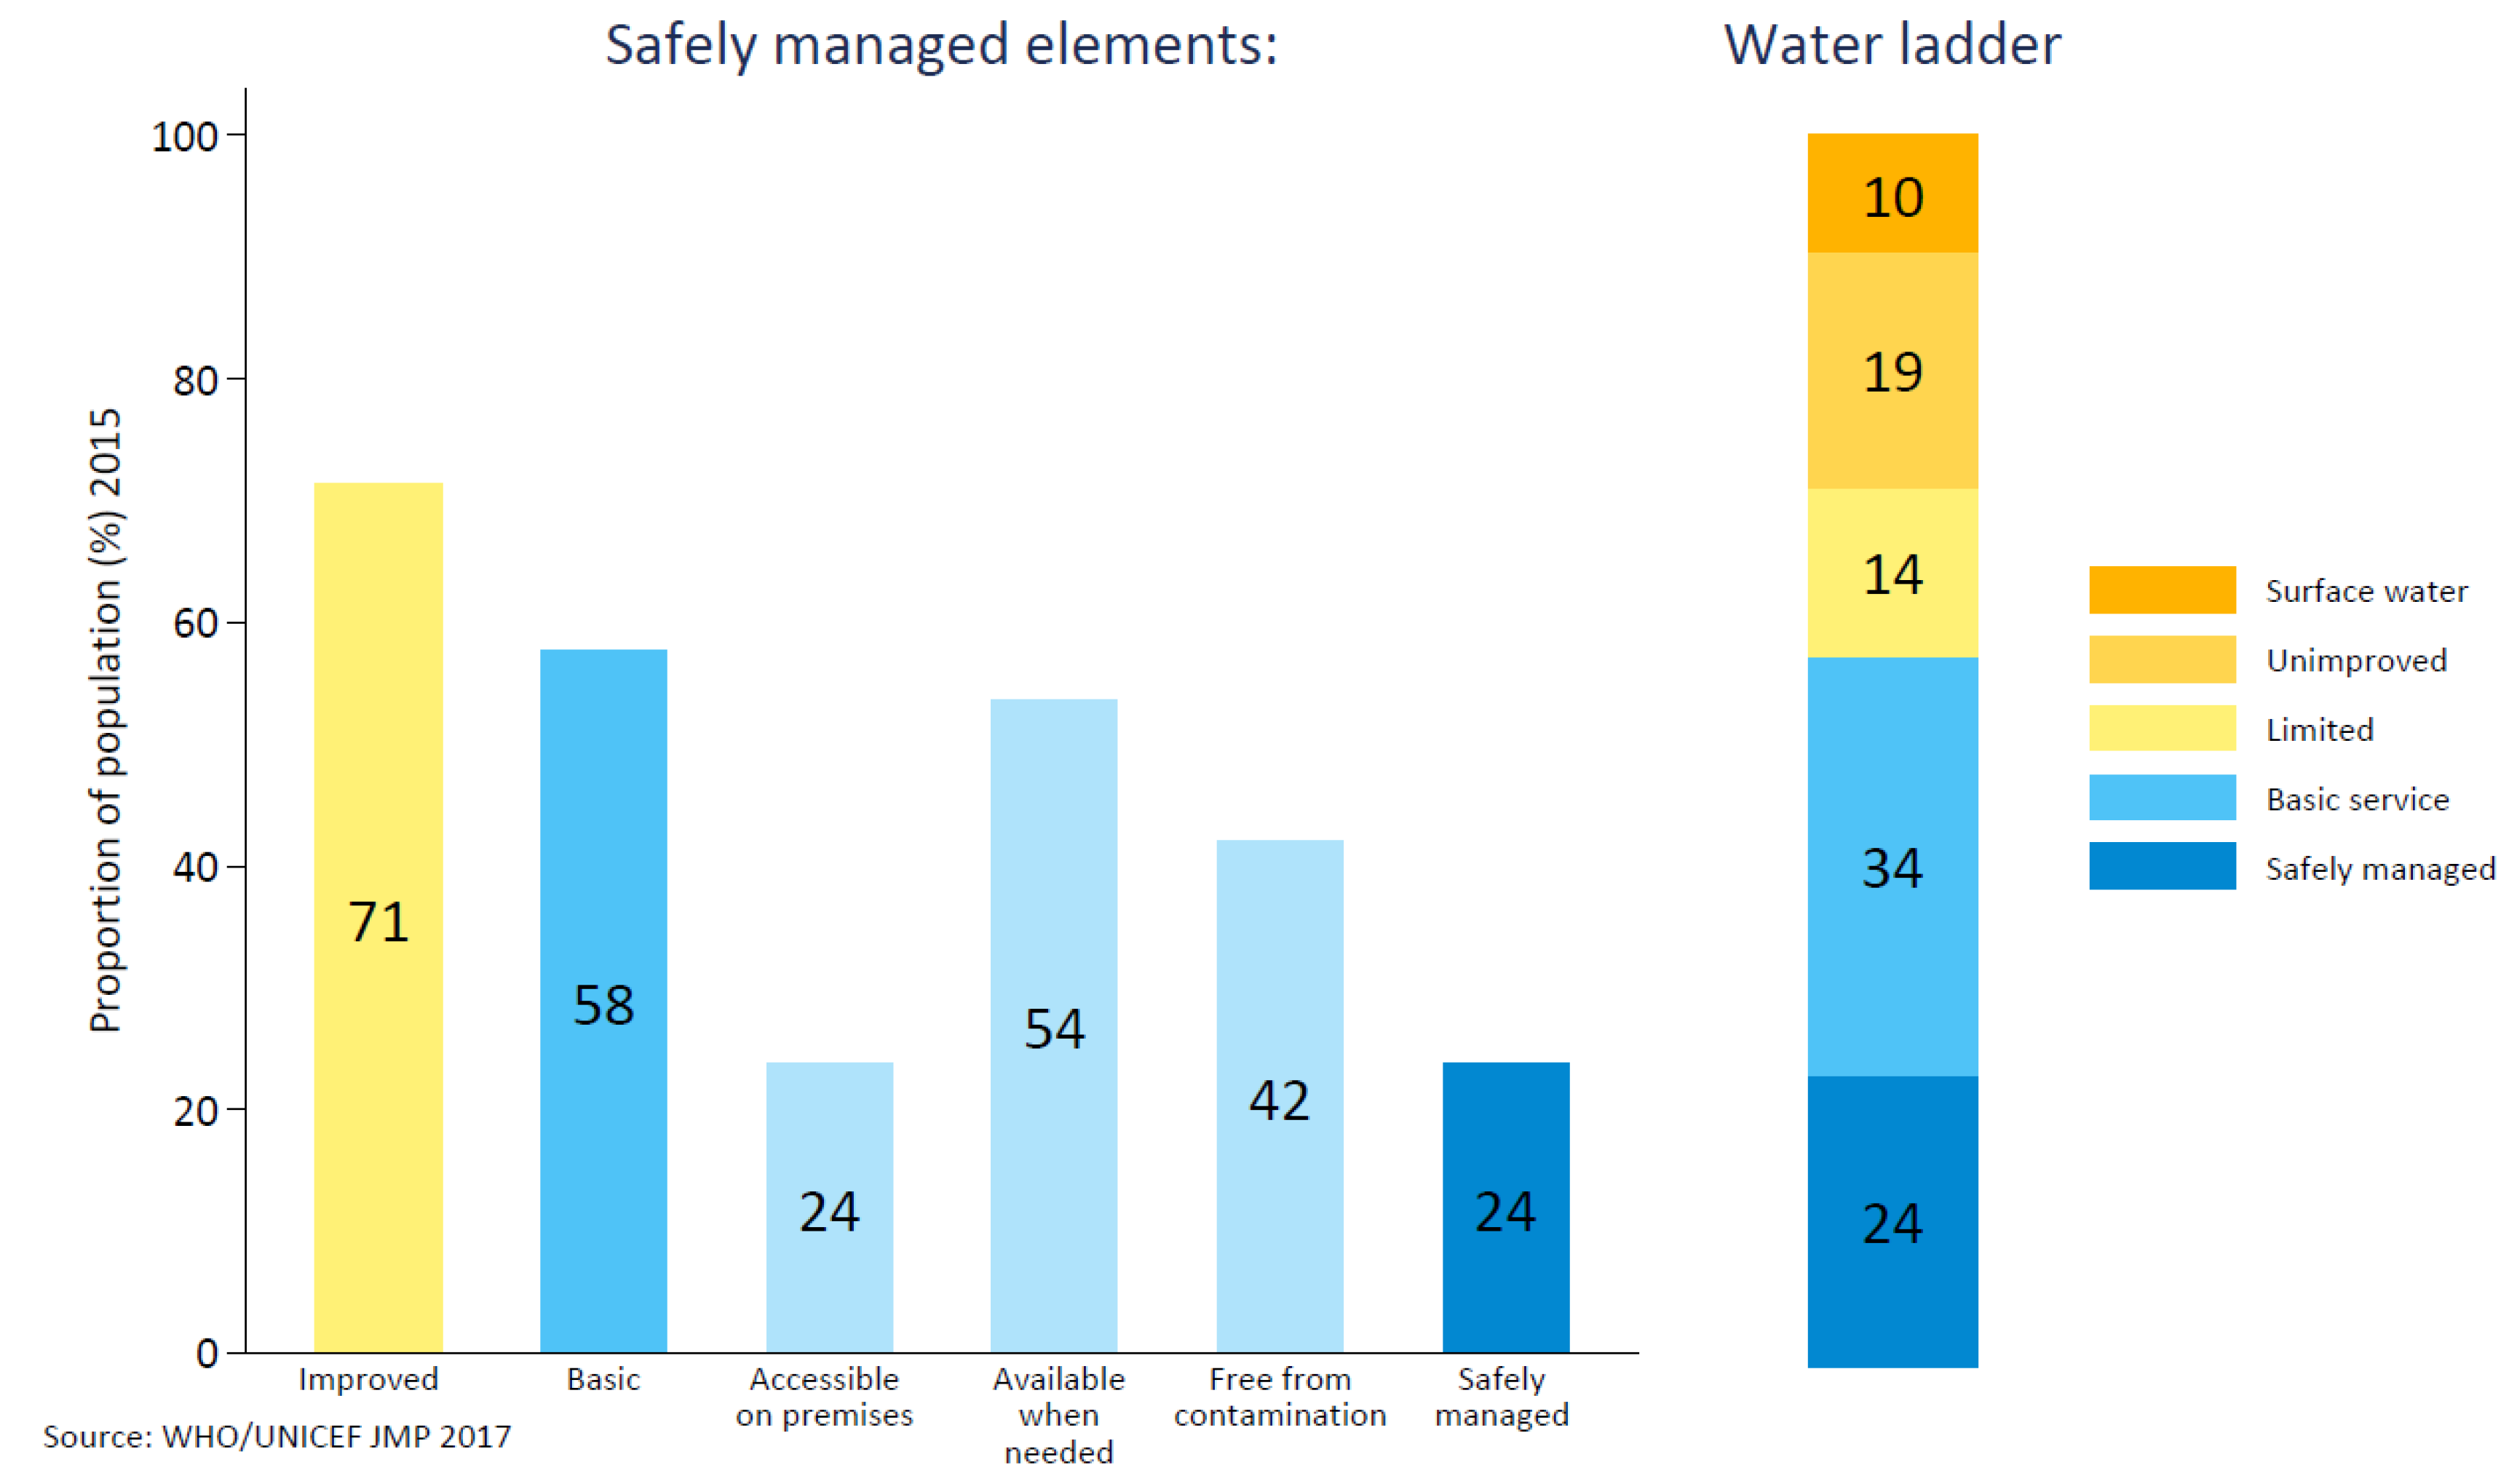
Safely managed drinking water services were calculated provided data were available on drinking water quality (E. coli or thermotolerant coliform, and priority chemicals where applicable) and either the availability or accessibility of drinking water services for at least 80% of the population using improved drinking water sources. Firstly, the proportion of the population with improved drinking water sources that were: (i) accessible on premises, (ii) available when needed and (iii) free from contamination were calculated, where possible for rural and urban areas. The estimates for free from contamination are based on compliance with WHO guidelines for drinking water quality [30]. These estimates were drawn from a combination of household surveys and administrative data systems (Table 3). Since information was not usually available from the same data source, the minimum value for the three elements was used to estimate the safely managed indicator. A similar approach was taken for regional and global estimates, provided data were available for at least 30% of the relevant regional population (those using improved drinking water sources). The elements of safely managed drinking water services were calculated separately for urban and rural areas and, where possible, a weighted average used for total estimates for the region or world.
Figure 2 shows an example of calculating safely managed drinking water services at a regional level and the construction of the full SDG ladders. The estimate for safely managed drinking water services in sub-Saharan Africa is calculated based on the minimum of the proportion of the population with improved drinking water services (yellow bar) which are (i) accessible on premises, (ii) available when needed and (iii) free from contamination. In this example contamination of drinking water was found to be the limiting factor at 24% and was taken to be the estimate for safely managed drinking water services (dark blue).
3.4. Estimates for Safely Managed Sanitation Services
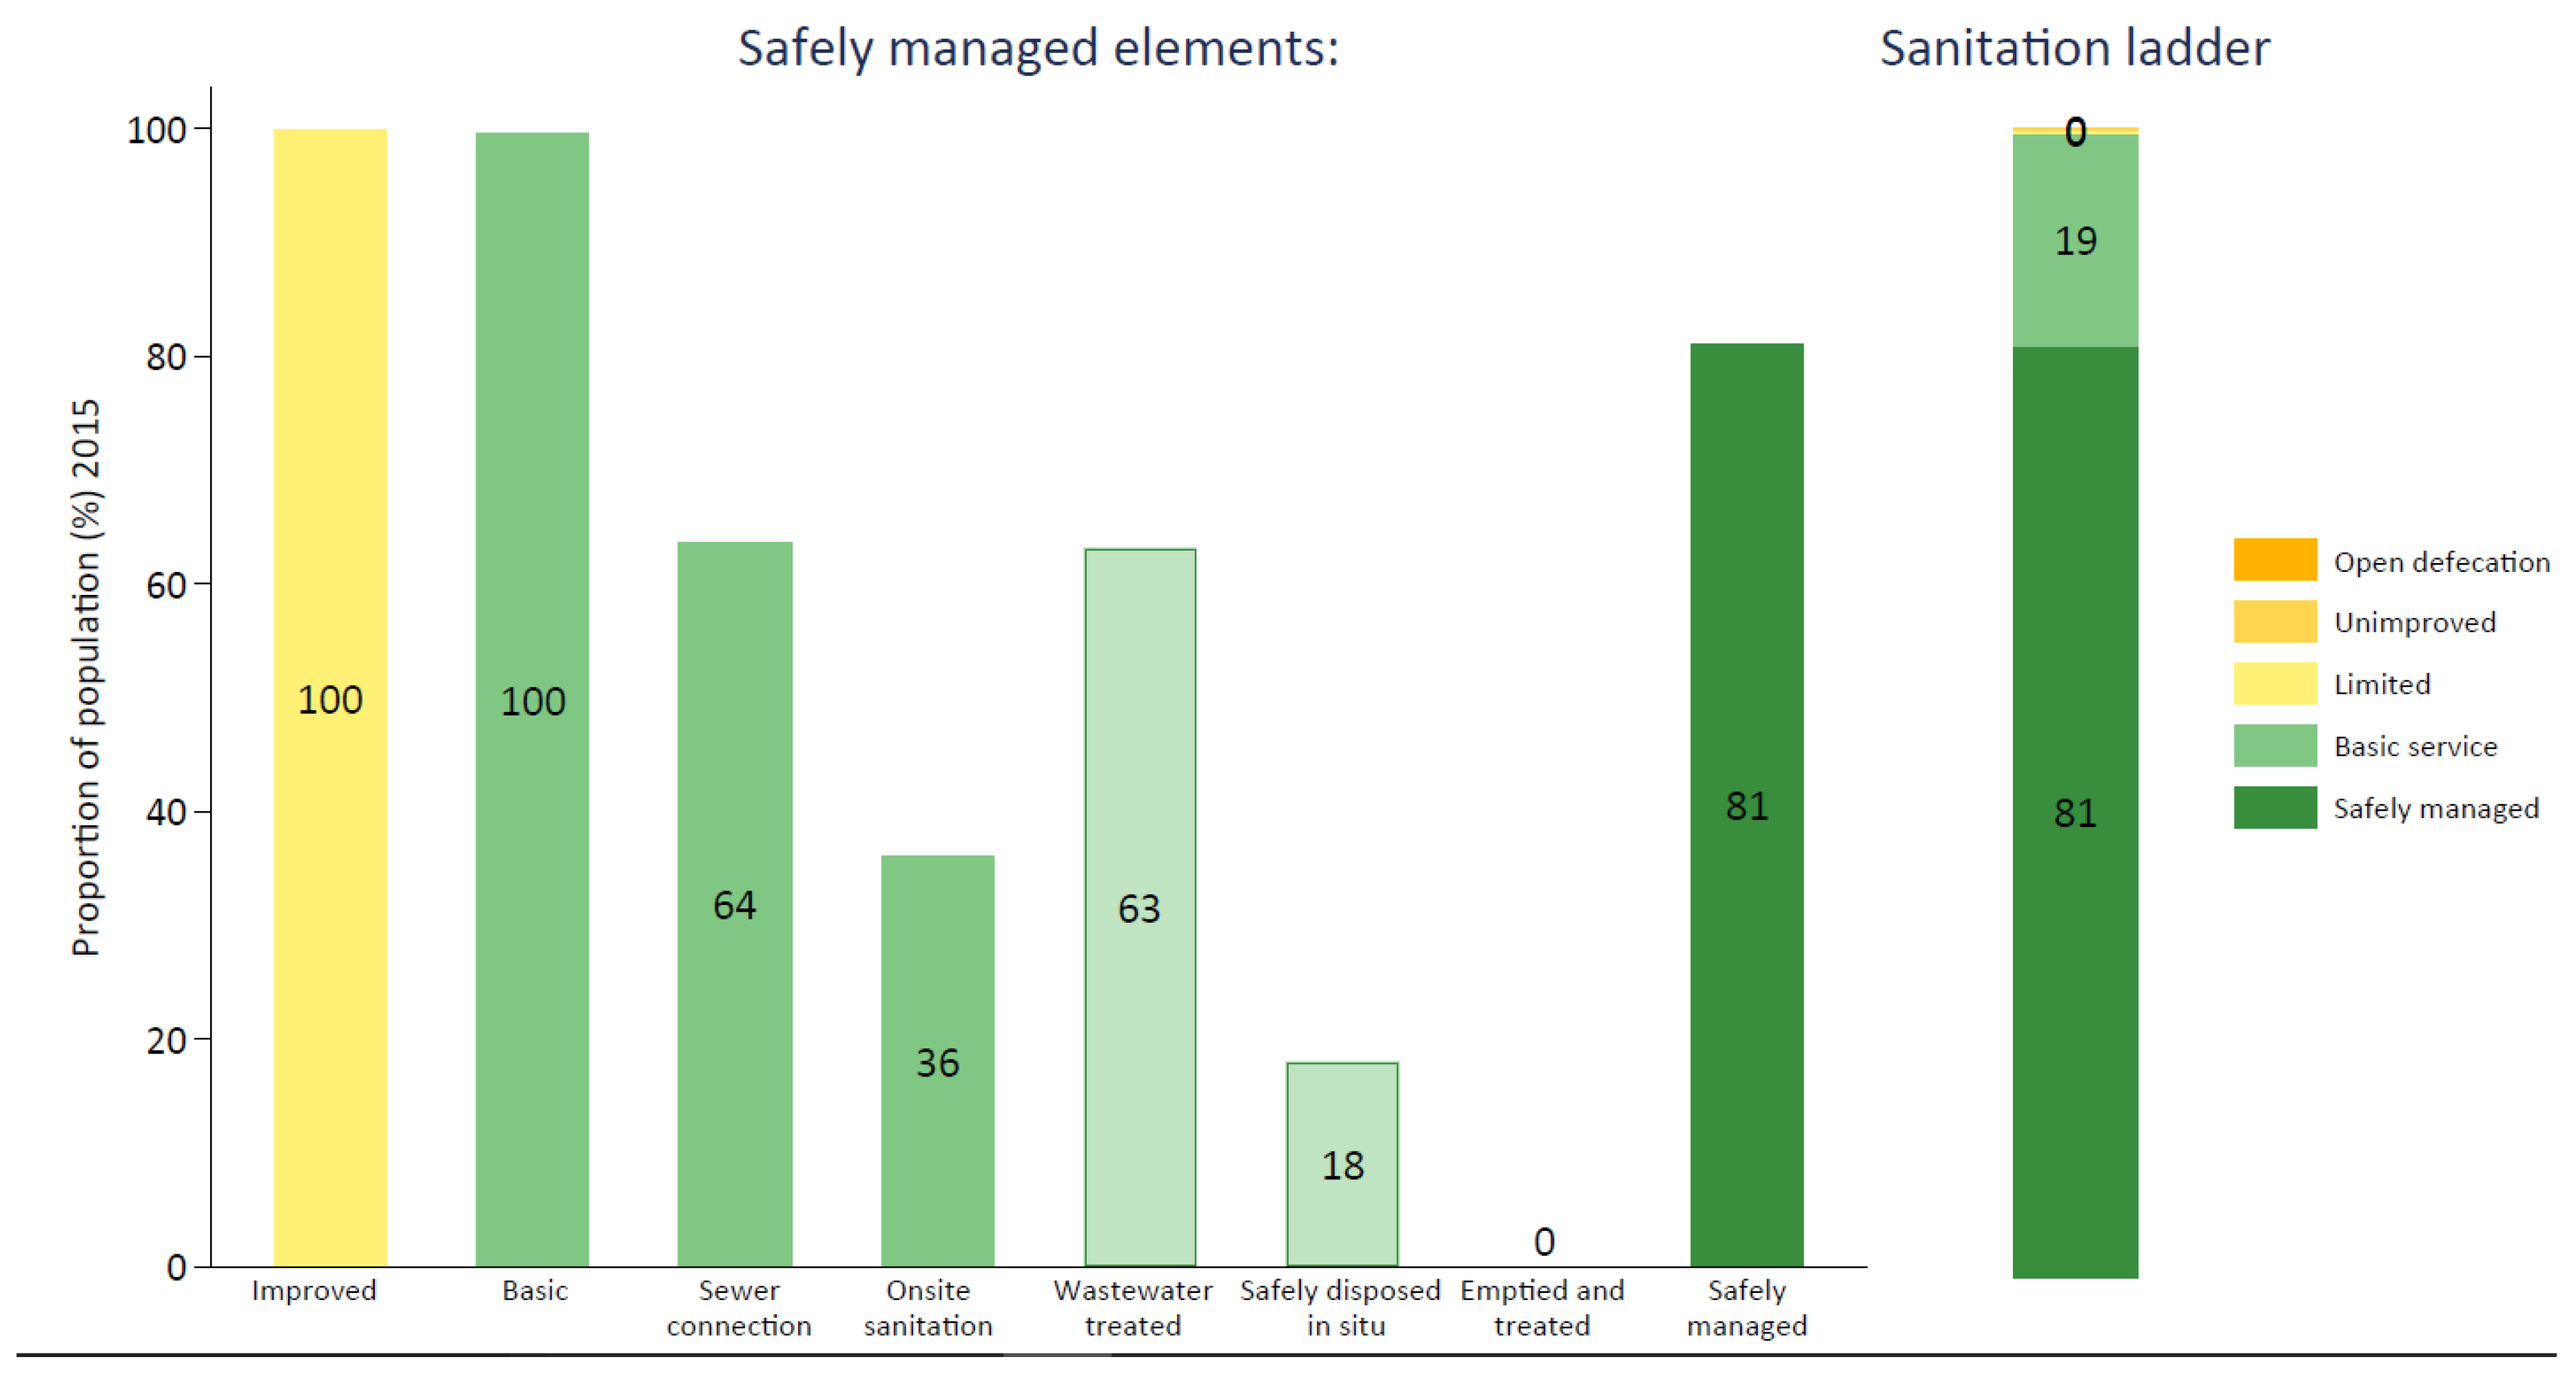
Safely managed sanitation services were calculated provided data were available for the dominant form of improved sanitation (either improved onsite sanitation facilities or sewer-connected facilities) and estimates were weighted by the populations using these facilities. Estimates could be drawn from household surveys or administrative data for the management of onsite sanitation but data on wastewater treatment are only available from administrative sources (Table 3). For onsite sanitation facilities, such as septic tanks and improved latrines, excreta can be treated and disposed in situ or emptied and treated offsite. For sewer-connected facilities, data on the proportion of wastewater which received at least secondary treatment was multiplied by the proportion of the population using sewer-connected sanitation. For national estimates, where insufficient data were available for the non-dominant form of improved sanitation, estimates were based principally on the dominant form of sanitation, with the assumption that 50% of the non-dominant form of sanitation facilities were also safely managed. Regional and global estimates were calculated provided data were available for at least 30% of the population using the dominant form of improved sanitation. The regional and global estimates were then calculated by summing the populations whose sanitation facilities were safely managed and, in effect, treating a lack of data as evidence of a lack of safe management.
Figure 3 shows an example of calculating safely managed sanitation services at a country level and the construction of the full SDG ladder. The estimate for safely managed sanitation services in rural Estonia requires information on the proportion of the population using basic sanitation services which are connected to sewer networks (64%) or onsite sanitation systems (36%). Data on treatment of wastewater (>95% at least secondary) were applied to the population using sewer connections to calculate “wastewater treated” (63%). Although no data were available on disposal in situ and emptying and treatment, an estimate for onsite sanitation services was made since most of the rural population of Estonia uses sewer-connected sanitation. Half of the population using onsite sanitation facilities was considered “safely disposed in situ” (18%) and in the absence of data none was considered “emptied and treated” (0%). Combining these the pathways yields the estimate for safely managed sanitation services in rural Estonia (81%). An estimated 19% of the rural population lacks a safely managed service and uses a basic sanitation service.
3.5. Inequalities by Wealth and Sub-national Region
Inequalities in access to basic services were assessed using customised urban, rural and national asset indices excluding WASH variables. The decision to customise the wealth index was based on an examination of the sensitivity to the inclusion of these variables and concerns of overestimation of inequalities in WASH services where these variables are also included as assets [31]. For countries where the wealth quintile analysis could be conducted (due to the availability of analytical scripts) inequalities were also examined by sub-national region based on the domains for which the household surveys were representative. The number of regions ranged from 4 to 30 usually corresponding to the first administrative level in each country. Estimates for these inequalities were calculated for all rungs in the JMP ladder up to “basic” and were based on individual surveys rather than trends.
4. Data Sources and Data Coverage
The JMP 2017 baseline report drew on over 3000 national data sources, primarily household surveys (n = 1443), censuses (n = 309) and administrative data (n = 1494). The inclusion of administrative data enabled estimates to be produced for safely managed services and considerably increased the size of the JMP database.
Table 4 describes data coverage for SDG indicators based on the proportion of the population and the number of countries for which data were available. Estimates were generated providing data were available for at least 30% of the relevant population for the new safely managed indicators and at least 50% of the total population for basic services.
Almost all countries could produce estimates for basic drinking water and basic sanitation services but comparatively few had data on the availability of handwashing facilities with water and soap (n = 70) (Table 4). Most countries with data on handwashing were in sub-Saharan Africa or Latin America and the Caribbean where this information had been collected as part of a standardised handwashing module implemented in MICS or DHS surveys. Very few high-income countries routinely collect this information.
A total of 96 countries could produce estimates for safely managed drinking water services. Data were generally available for the location of drinking water sources (“accessible on premises”) but fewer countries had data for drinking water quality or the availability of drinking water when needed.
A total of 84 countries could produce estimates for safely managed sanitation services. Data on wastewater treatment were available for many countries but there remains a major data gap for the management of excreta from onsite sanitation systems. Very few countries had nationally representative data on the emptying, transport and treatment of faecal sludge.
Sufficient data were available to produce global as well as urban and rural estimates for safely managed drinking water and safely managed sanitation services but not for basic hygiene services. Regional estimates could be produced for 4 out of 8 and 5 out of 8 SDG regions for safely managed drinking water and sanitation services, respectively. Regional estimates could be produced for all SDG regions for basic drinking water and sanitation but only two regions for basic hygiene.
5. Baselines for Basic Services
Table 5 includes baseline estimates for the proportion of the population using basic drinking water, sanitation and hygiene services at a global level, for rural and urban areas and by SDG region. Table 4 also includes the population without basic services and a metric termed the annual rate of change (ARC) which was calculated based on the average annual percentage point change between 2000 and 2015.
An estimated 89% of the global population used at least basic drinking water services in 2015 meaning that 663 million lacked a basic service. Of these, the majority lived in sub-Saharan Africa (408 m) and Central and Southern Asia (219 m). Those lacking basic services relied on improved water sources more than 30 min roundtrip (263 m; 4%), used unimproved sources of drinking water (423 m; 6%), or had no drinking water service and relied on the direct collection of surface water (159 m; 2%).
An estimated 68% of the global population used at least basic sanitation services in 2015 and a total of 2.3 billion people lacked a basic service. Of these, the majority lived in Central and Southern Asia (944 m), sub-Saharan Africa (692 m) and Eastern and South-eastern Asia (517 m). Those without basic sanitation services relied on improved sanitation facilities shared with other households (600 million; 8%), used unimproved sanitation facilities (856 m; 12%), or continued to practise open defecation (892 m; 12%).
No global estimate was available for basic hygiene due to data coverage of less than 50% of the global population. Estimates were available for sub-Saharan Africa and North Africa and Western Asia as well as for Least Developed Countries. Just 27% of the population of the Least Developed Countries had a handwashing facility with water and soap at home.
Table 5 also demonstrates that there continue to be striking disparities between rural and urban areas both in terms of coverage of basic services and the types of facilities used by households in these areas. Of the 844 million without basic drinking water services 8 out of 10 (79%) lived in rural areas and of the 2.3 billion without basic sanitation, 7 out of 10 (72%) lived in rural areas. Gaps between urban and rural areas have, however, been closing: the annual rates of change in rural areas were 0.79% points per year for drinking water and 0.71% points per year for basic sanitation compared with 0.0% points and 0.20% points respectively in urban areas where coverage has stagnated, due in part to rapid urbanization (the proportion of the global population living in urban areas increased from 46.7% in 2000 to 53.9% in 2015 [29]).
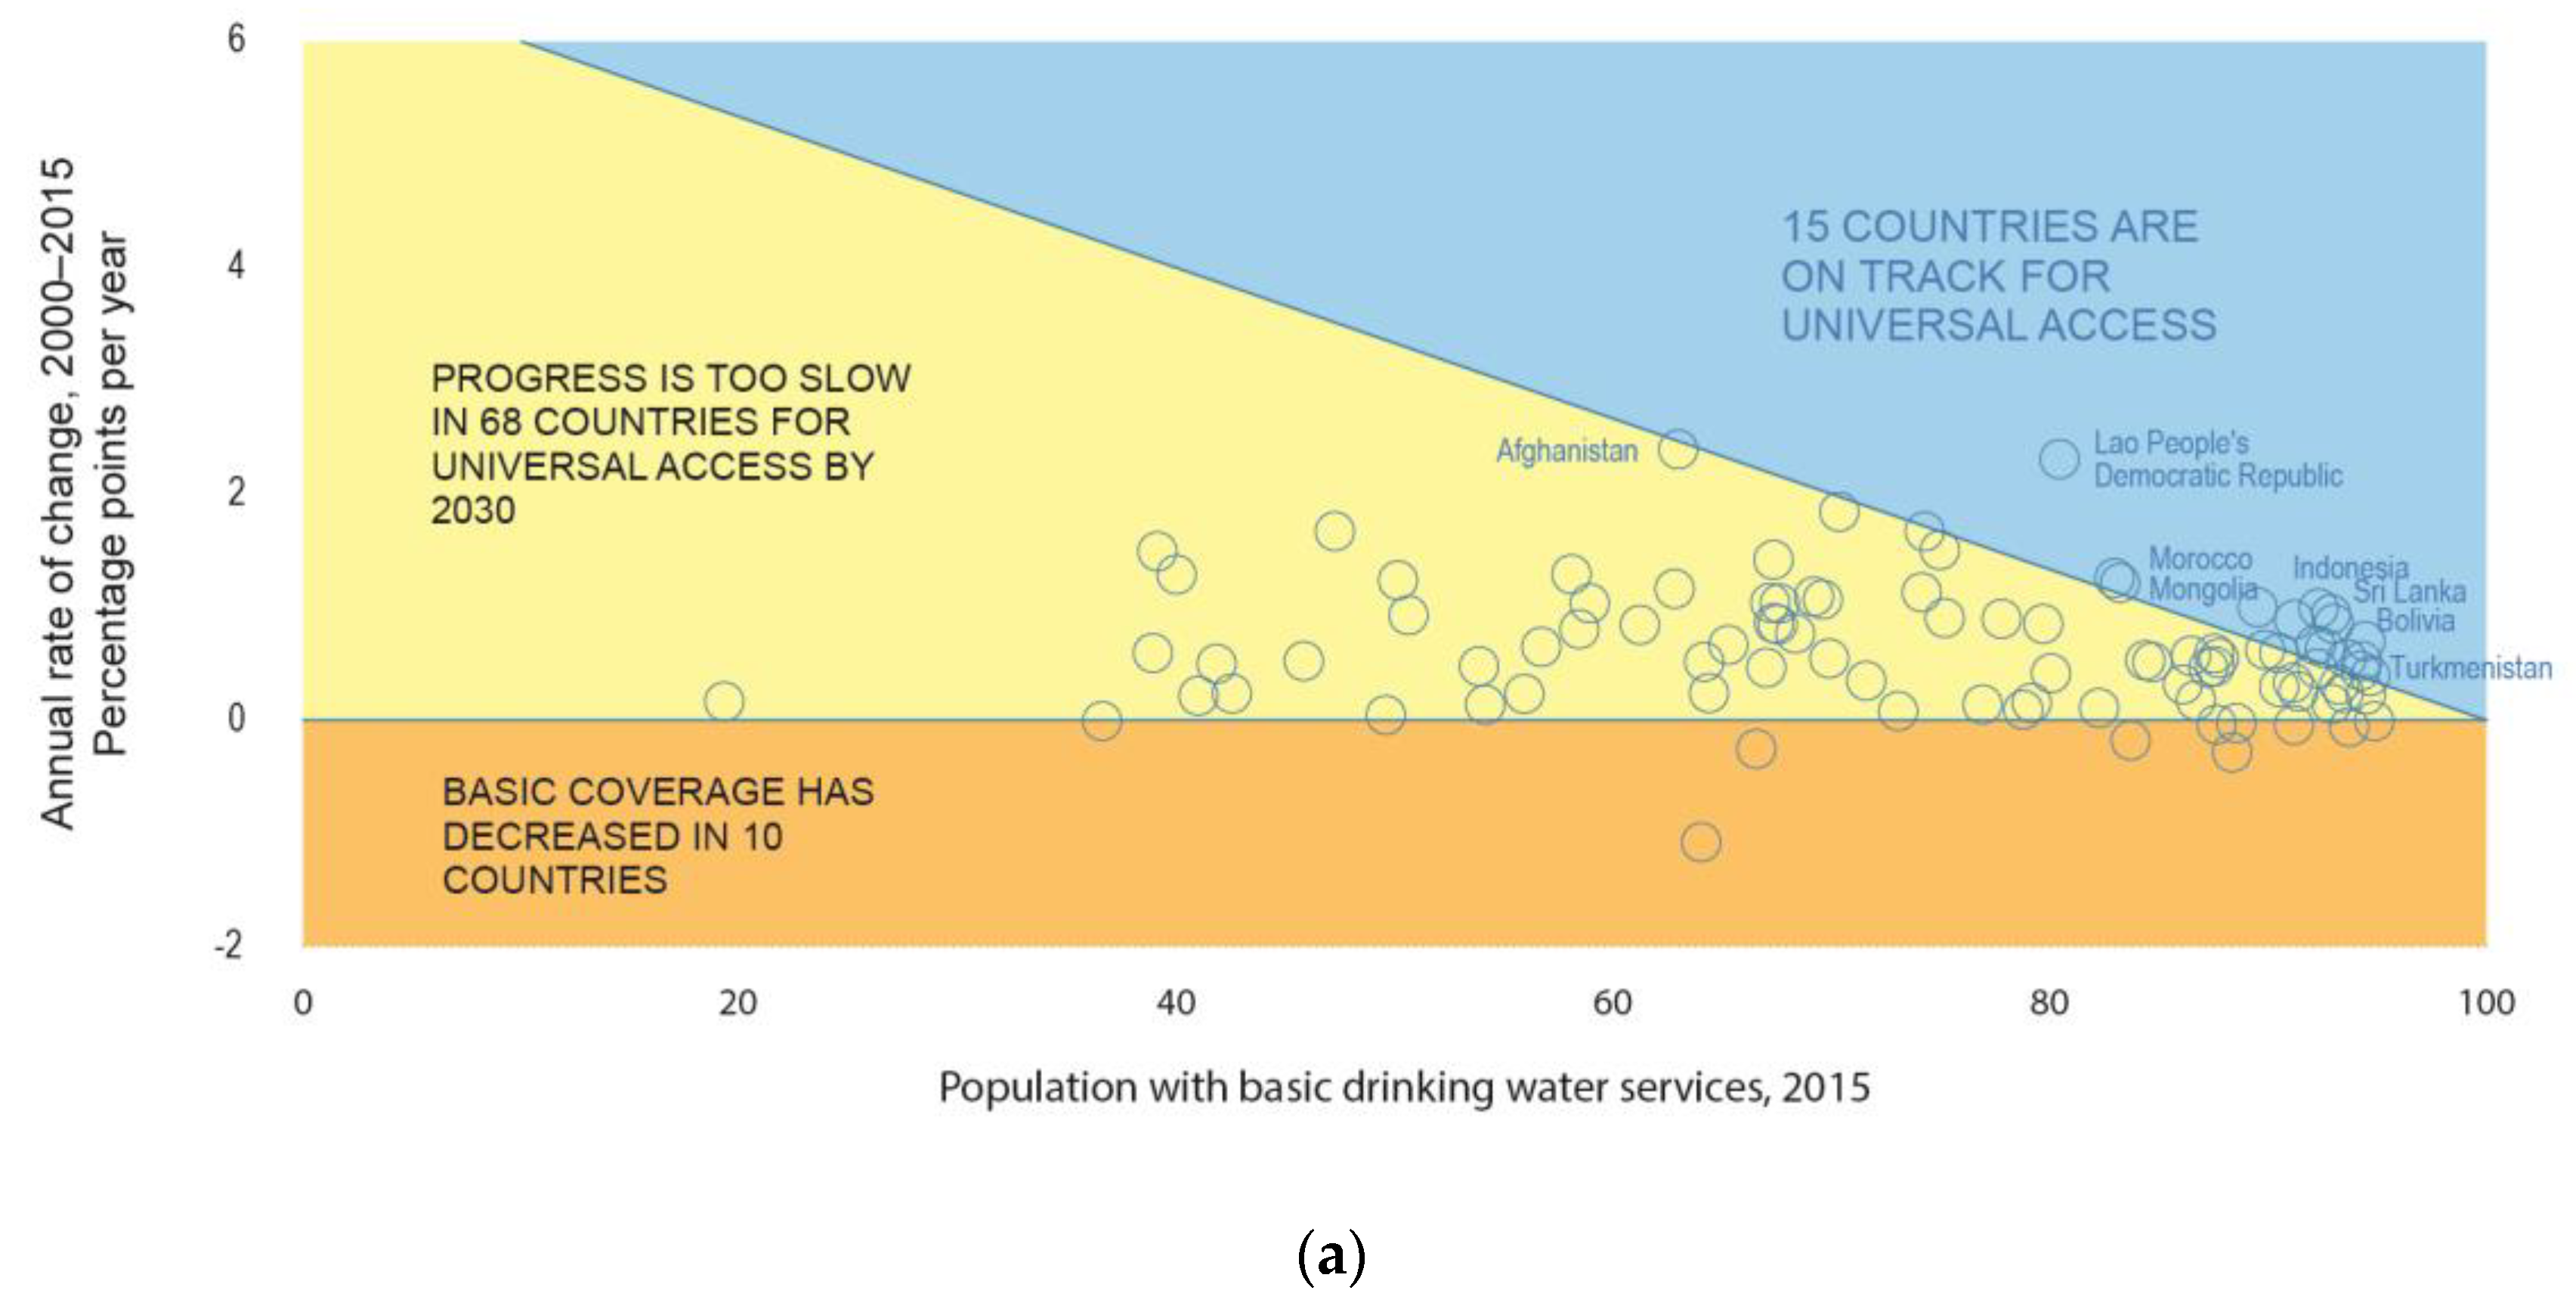
Examining the progress made from 2000 to 2015, the JMP 2017 report examined whether progress during the MDG period would be sufficient to achieve universal access to basic services by 2030 and estimated which countries would be “on track”, assuming that these rates could be sustained during the next 15 years. Such an assessment inherently assumes that these rates of progress can be sustained which may be challenging as those who have yet to gain access tend to be poorer and more marginalised.
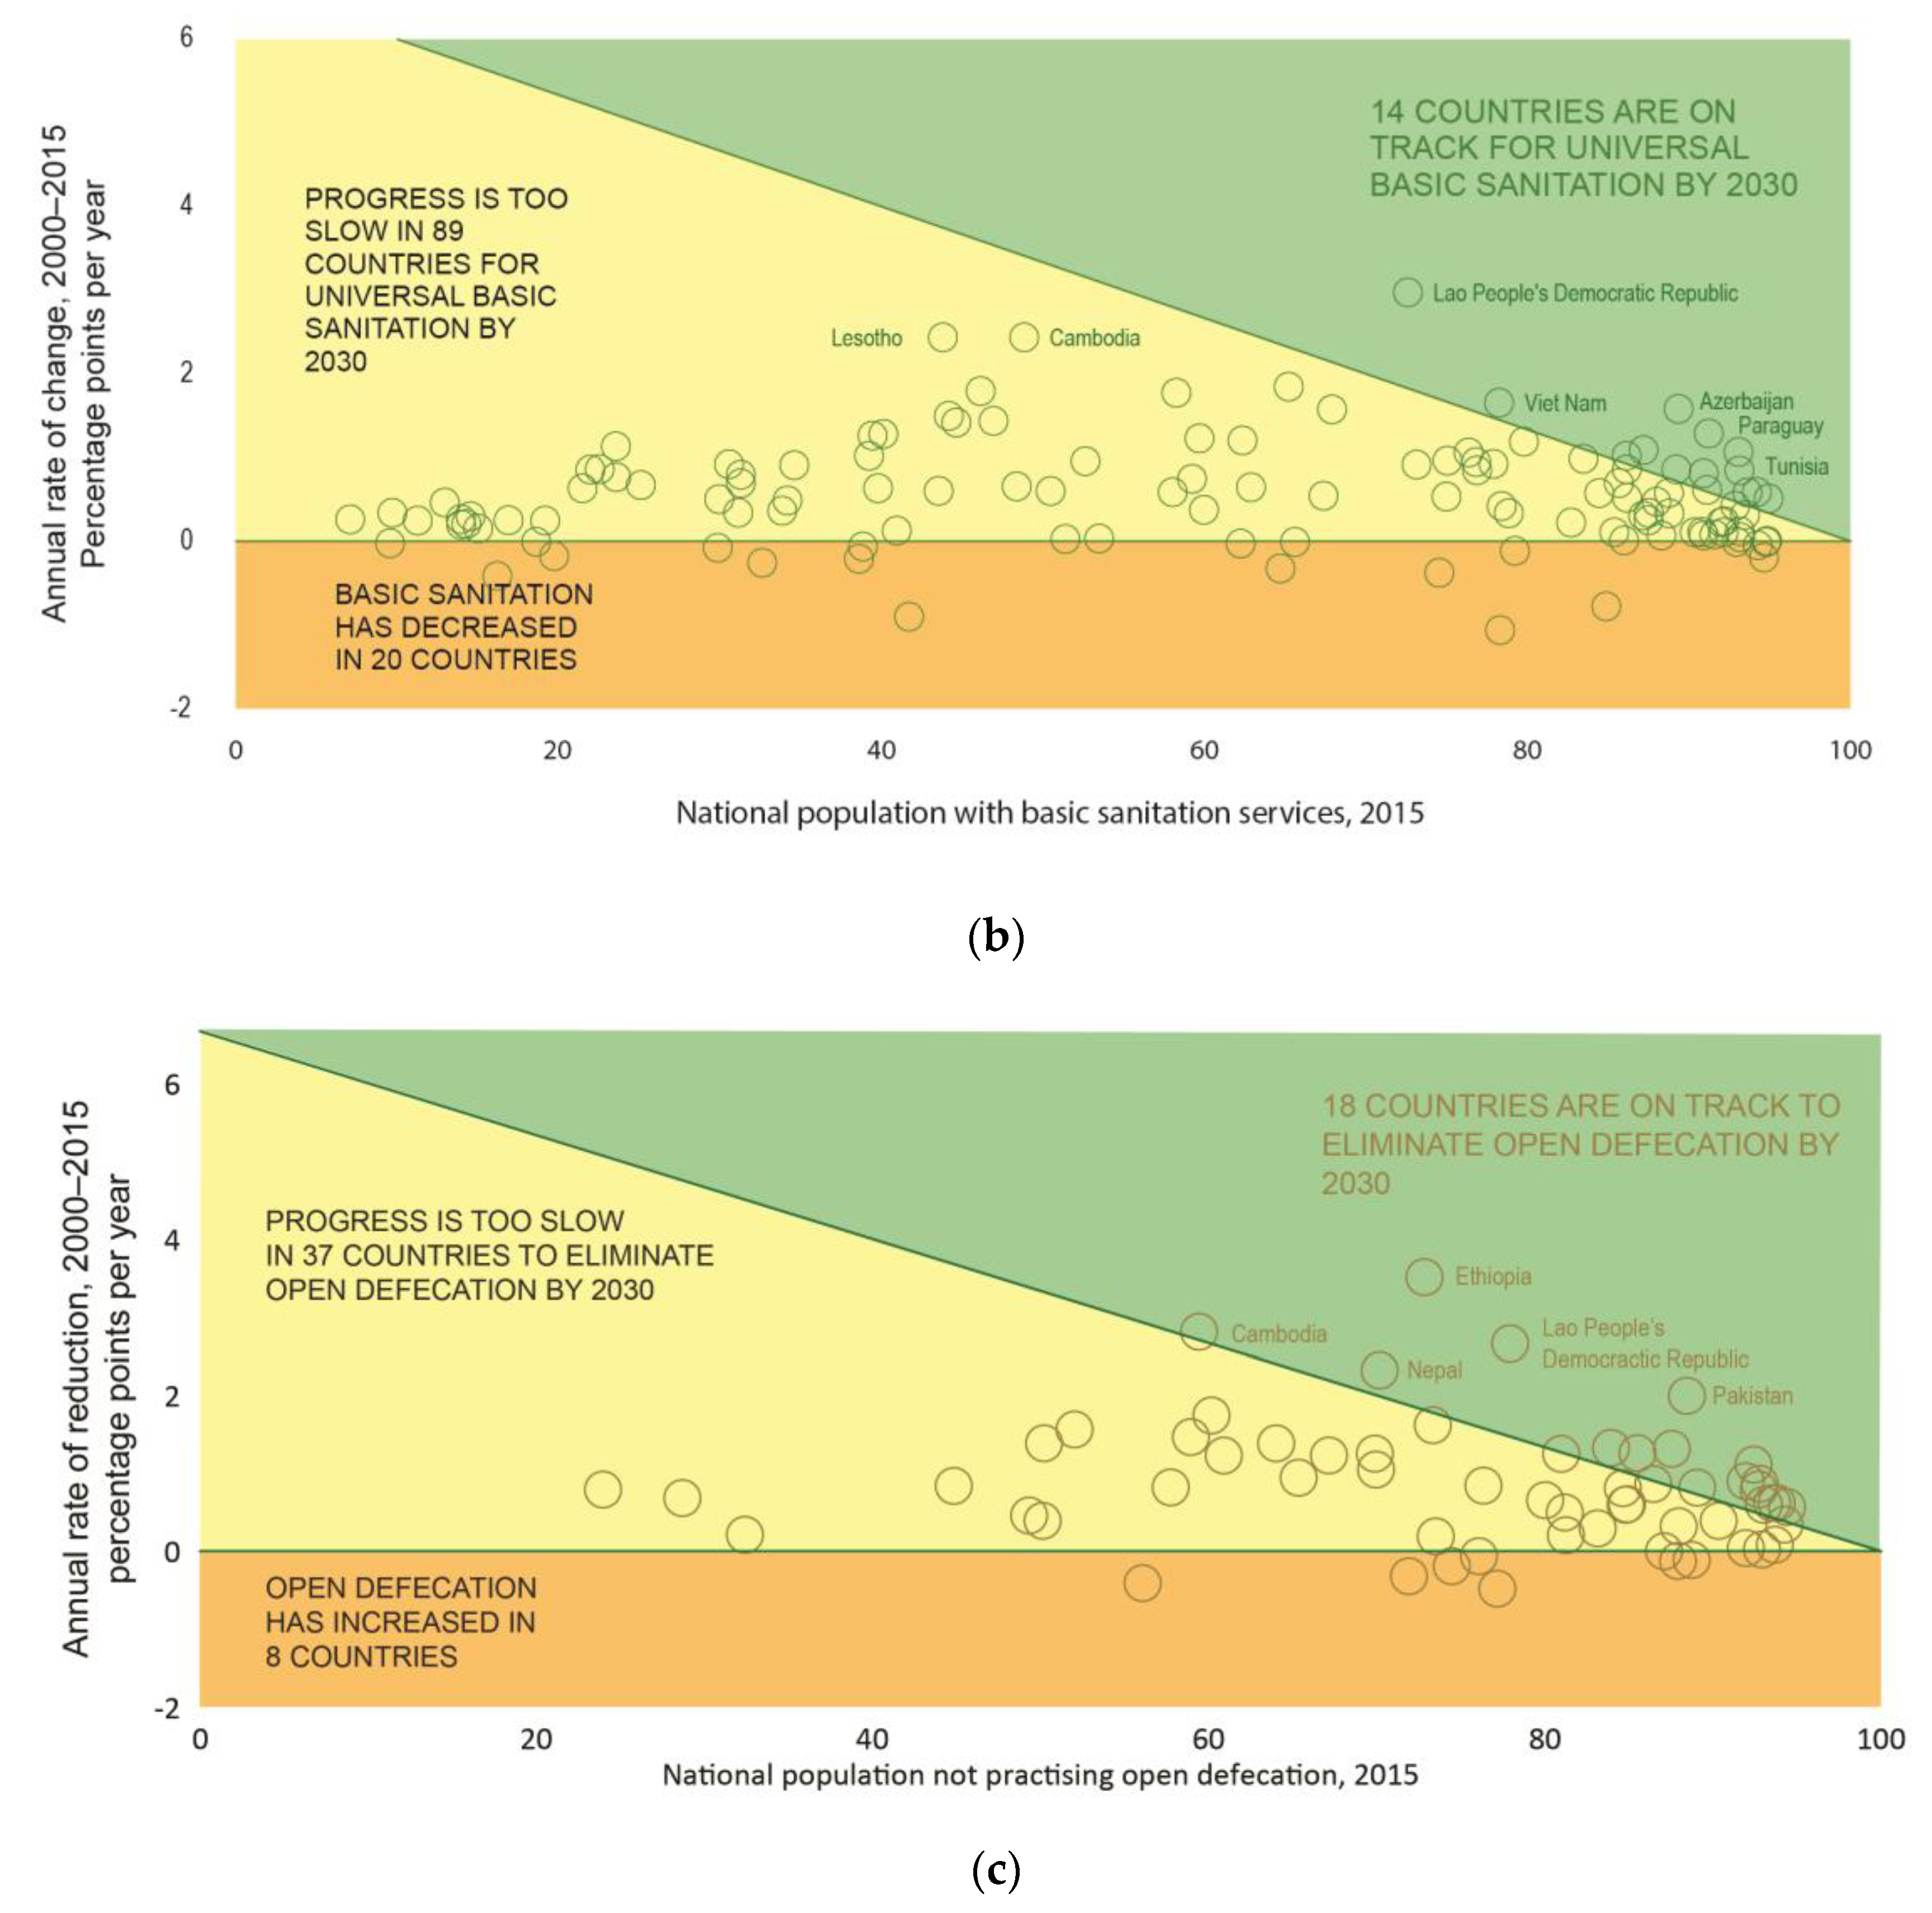
Figure 4 shows the results of this analysis for three indicators for which trend data were available for most countries: basic drinking water, basic sanitation and open defecation. These data show that impressive rates of progress were made in several countries: Lesotho, Cambodia and Lao PDR stand out for basic sanitation (>2 percentage points per year, ppy) and Afghanistan and Lao PDR for basic drinking water (>2 ppy). The greatest annual reductions in open defecation were observed in Ethiopia (3.5 ppy), Cambodia (2.8 ppy), Lao PDR (2.7 ppy) Nepal (2.3 ppy) and Pakistan (2 ppy).
The analysis of Annual Rates of Change (ARCs) also serves to highlight the number of countries where an acceleration would be needed to achieve universal basic water and sanitation and to eliminate open defecation by 2030. Of the 93 countries with >5% of the population lacking basic drinking water services, only 15 were on track. Only 14 out of 122 countries were on track for achieving universal basic sanitation services and 18 out of 63 for the elimination of open defecation. Furthermore, there are several countries where coverage has remained virtually unchanged between 2000 and 2015 and others where coverage has even declined.
6. Baselines for Safely Managed Services
Table 6 includes baseline estimates for safely managed drinking water and sanitation services along with their constituent elements. The former is calculated based on the minimum of the three criteria for safely managed services whereas the latter is calculated by summing the three types of safely managed services. Regional and global totals are calculated based on weighted averages for rural and urban populations.
At a global level, whereas 11% of the population lacked basic services in 2015, 29% were found to lack safely managed drinking water services, equating to 2.1 billion people. There are pronounced differences between regions: for example, just one in four people in sub-Saharan Africa used an improved water source located on premises compared with over 90% in Australia and New Zealand, Europe and North America and Latin America and the Caribbean.
Four out of ten people—39% of the global population—were estimated to use a safely managed sanitation service. This equates to 4.5 billion people without safely managed services in 2015. Data were available on the population with a sewer connection with wastewater treated for 7 out of 8 regions. Wastewater treated ranged from around 3% in Oceania and Central and Southern Asia to 78% in Europe and North America, reflecting differences in the coverage of sewer networks and the proportion of wastewater receiving at least secondary level treatment. Data were not available on emptying and treatment of excreta from onsite sanitation facilities for any regions and only Eastern and south-Eastern Asia had sufficient data on treatment and disposal in situ.
Unlike for basic services, reliable trend data for safely managed services are available for a comparatively small number of countries where time series were available from national authorities for drinking water quality and/or wastewater treatment. Among the 96 countries with estimates for safely managed drinking water in 2015, just 63 had more than 2 data points on drinking water quality since 2000. The average number of data points on wastewater treatment, among the 84 countries with estimates for safely managed sanitation, was 5.
7. Expanded Monitoring of Inequalities
The 2030 Agenda places considerable emphasis on addressing inequalities and commits member states to leave no one behind. UN Member States have recommended that SDG indicators should be disaggregated, where relevant, by ‘income, sex, age, race, ethnicity, migratory status, disability and geographic location, or other characteristics’ [32].
During the MDG period, national, regional and global estimates were routinely disaggregated by urban and rural populations and estimates were made for an increasing number of countries by household socio-economic status. In 2008, the JMP used “ladders” to further disaggregate populations by service levels, including those with no sanitation service at all who still practised open defecation [33]. Exploratory analysis in specific countries also served to highlight other dimensions of inequality—such as disparities in services between slums and formal urban areas of Mombasa, Kenya and in rates of open defecation between different religious groups in the Democratic Republic of the Congo [34]—and to generate greater demand for disaggregated data.
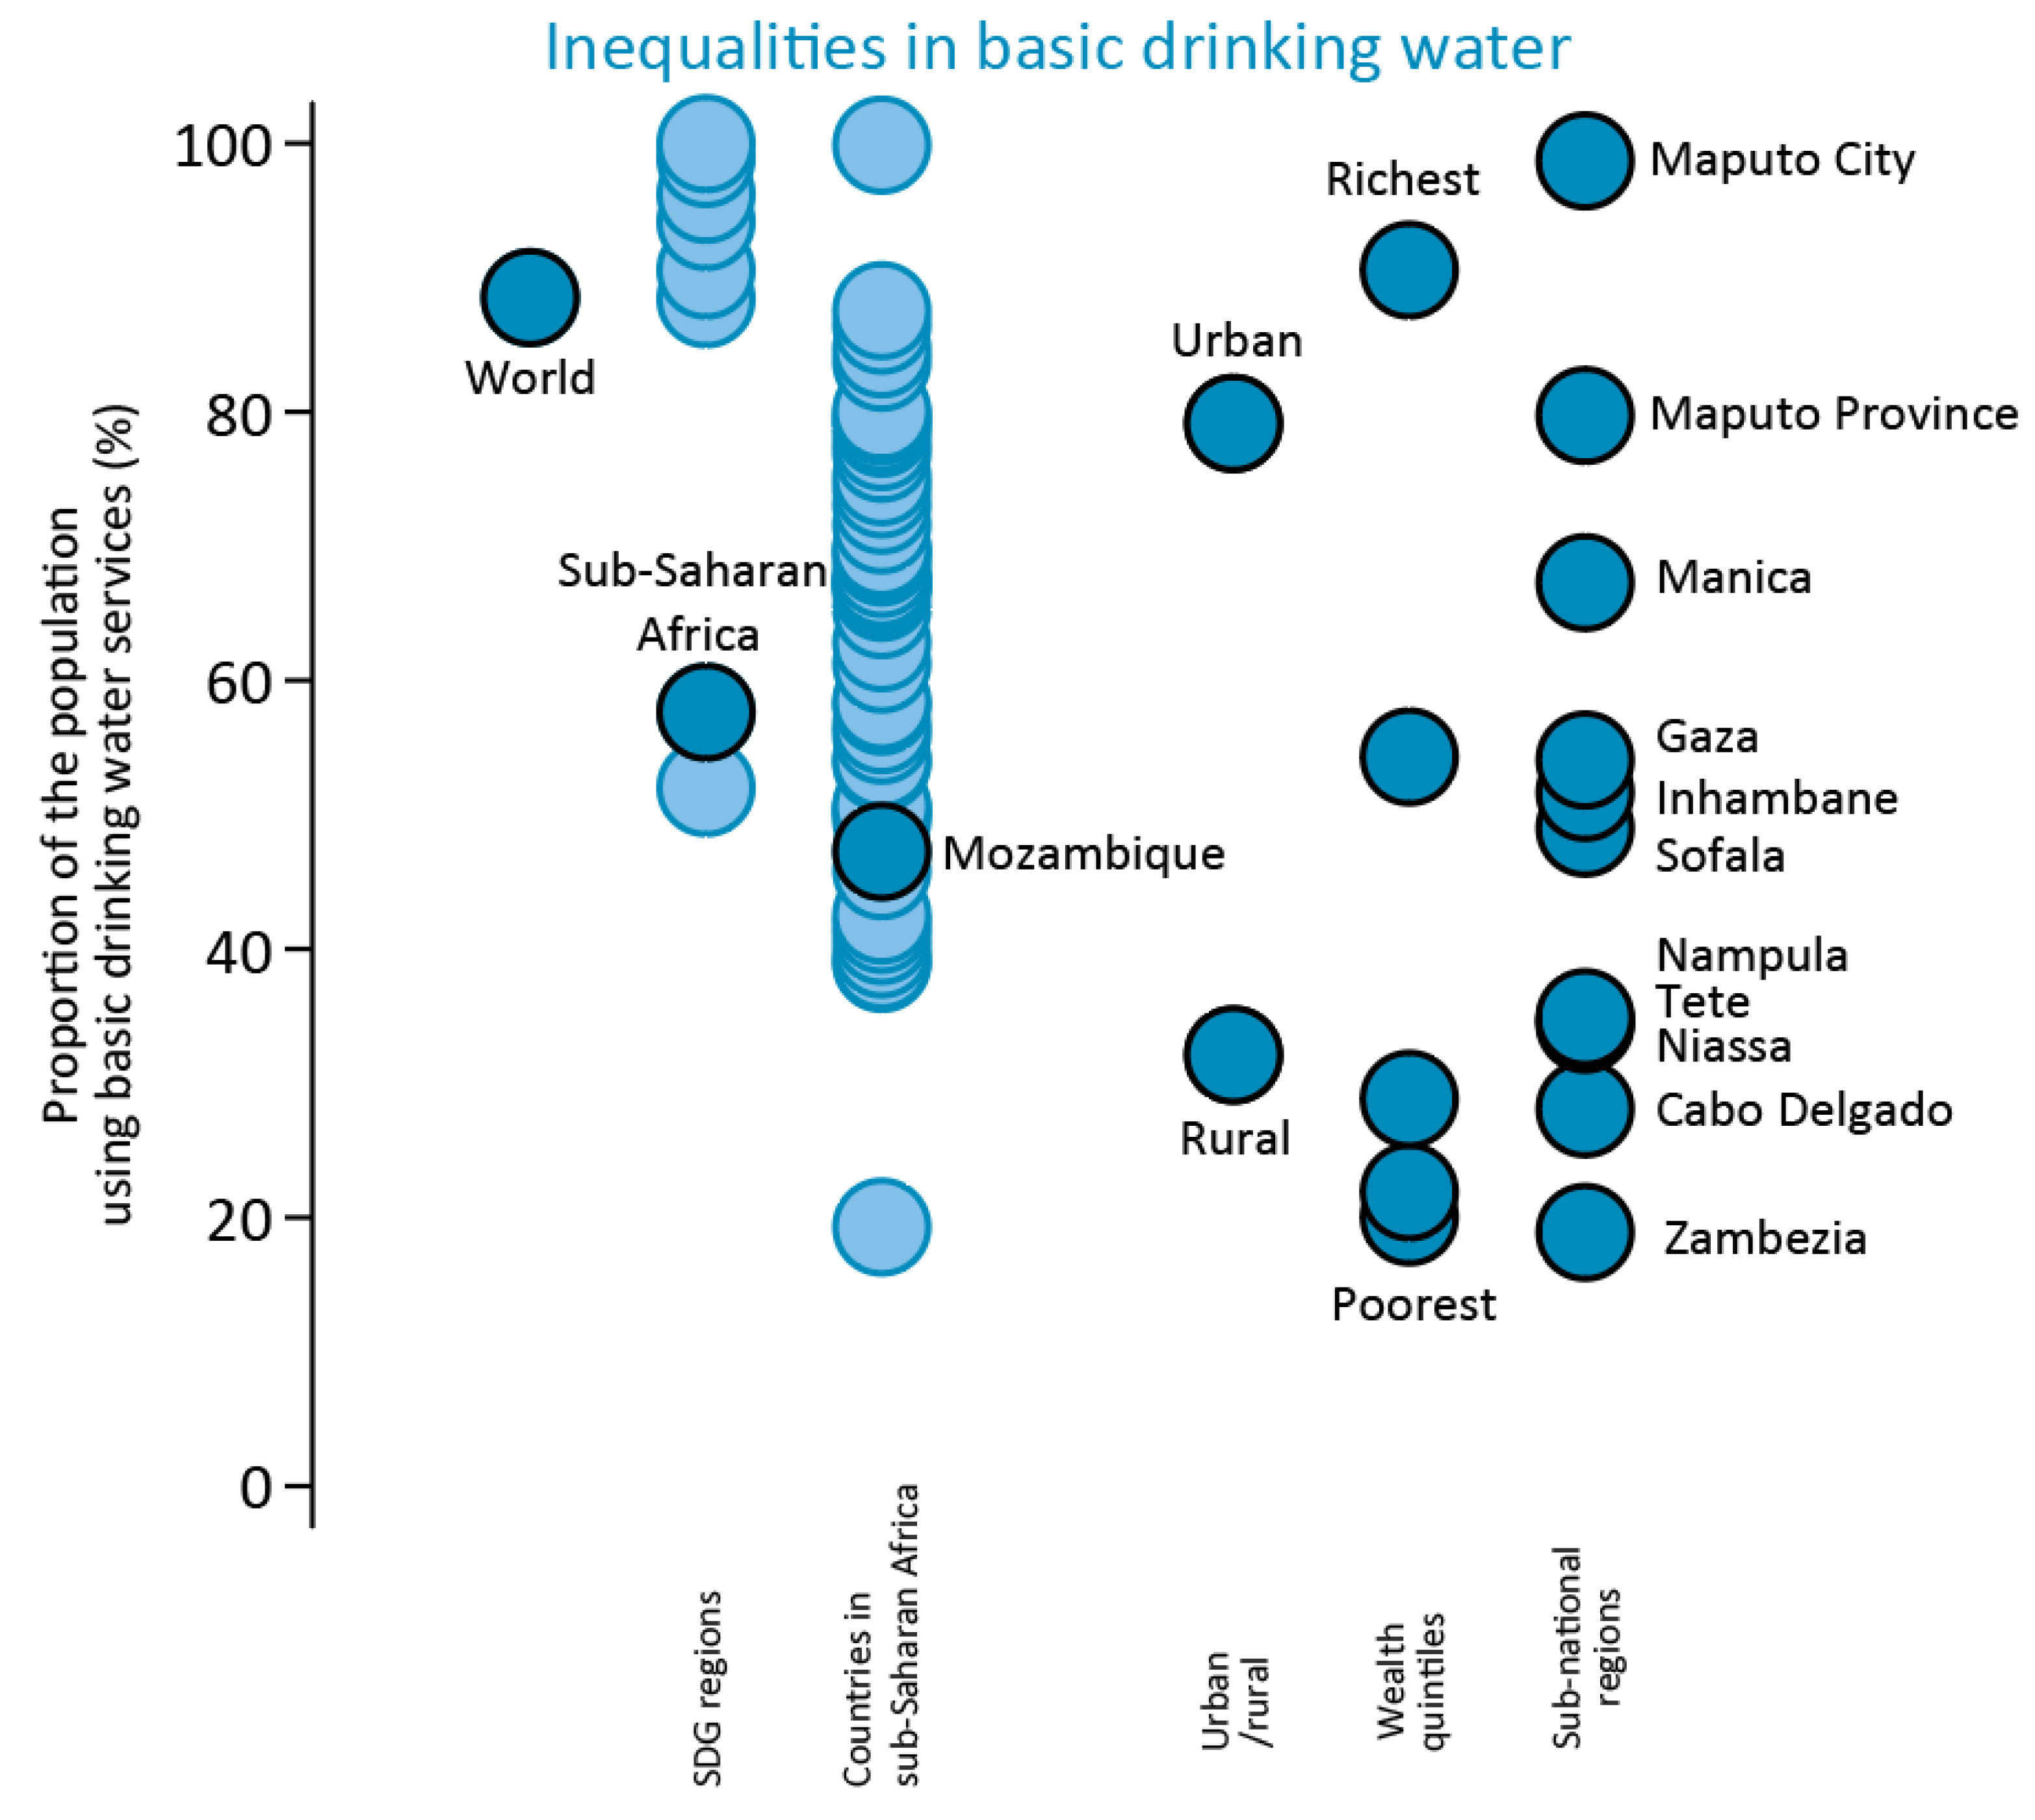
The JMP 2017 update aimed to more systematically report on inequalities: estimates were produced by wealth quintiles (for national, urban and rural settings) as well as sub-national regions for 80 countries. In the great majority of these countries, substantial gaps in coverage were found between richest and poorest and between lowest and highest performing regions. These inequalities can be explored on the JMP website data portal (washdata.org). Figure 5 shows an illustrative example of the inequality data available from the JMP 2017 report. In 2015, the coverage of basic drinking water sources was substantially higher for the World (89%) than in sub-Saharan Africa (58%). Mozambique (47%) was below the average for countries in sub-Saharan Africa, and just one in three (32%) use a basic drinking water service in rural areas of Mozambique. Sub-national inequalities by wealth quintile and subnational region based on DHS 2011 demonstrate that the coverage is much lower in the bottom three wealth quintiles and that coverage ranges from 99% (city of Maputo) to 19% (Zambézia)—a gap of 80 percentage points. People living in the capital were five times as likely to use basic drinking water services compared with people living in Zambézia in 2011.
Limitations of existing datasets used by the JMP include the fact that WASH data are typically collected at household rather than individual level and that, apart from census data, it is often difficult to disaggregate data for lower administrative units and/or smaller population sub-groups. Apart from data on the burden of water collection, and the increasing number of surveys that record aspects of menstrual hygiene management, data on the use of WASH services generally cannot be disaggregated by sex. Studies have shown that specific additional questions may be required for disability surveys: surveys of people with disabilities in four countries found that they usually used the same facilities as other household members but often faced difficulties in doing so [35]. Innovative data collection methods will be required to more comprehensively address inequalities relating to individual characteristics including sex and disability. There have been advances in small area estimation for household surveys which may enable disaggregation below the domains of the sample and more granular exploration of inequalities [36]. Oversampling of disadvantaged populations (e.g., Roma in Serbia MICS) will be required to generate estimates for small population groups.
A further form of inequality which in many cases intersects with the inequalities described above is affordability of WASH services. The JMP has convened an expert working group to explore the challenge of defining and monitoring affordability with a view to identifying measures that could be used to assess financial barriers to access at national and sub-national levels and, ideally, to compare affordability between countries. The widely-used measure to assess affordability—based on the proportion of a household’s budget spent on water—has been critiqued for neither capturing unaffordability of services for households that are not paying for services because they are too expensive nor distinguishing households that may be wealthy enough to meet their basic needs despite paying a large proportion of their budget on WASH services [37].
8. Challenges and Opportunities in Monitoring of SDG Targets
The SDG baselines for household WASH demonstrate the scale of the challenge associated with achieving universal safely managed services and the substantial acceleration needed in many countries to achieve even basic services for everyone by 2030. The process of establishing the SDG baselines has also underlined the implications of the shift in focus from the types of facilities people use to the level of service they receive. The new “safely managed” indicators represent a much higher level of service than “improved” facilities and many countries will need to collect more and better data in order to monitor progress. Although globally it was possible to establish global baselines for safely managed drinking water and safely managed sanitation services, major data gaps exist for several regions and many countries. Data availability for hygiene remains limited, especially in middle- and high-income countries.
Key priorities for monitoring of household WASH during the SDG era will include: (i) localising SDG targets, aligning monitoring systems and addressing data gaps, and (ii) integrated analysis at regional and global level.
8.1. Localising SDG Targets, Aligning Monitoring Systems and Addressing Data Gaps
Target setting and alignment of monitoring systems: The SDGs call for Governments to set national targets inspired by the global level of ambition [10]. This implies a process to establish targets that are aligned with national development plans, informed by data on coverage and trends and consider existing and potential resources. The service ladder developed by the JMP may be useful in informing these discussions since targets can be set for different rungs in the ladder (e.g., reducing open defecation or extending basic services) or aspects of safely managed services (e.g., reducing contamination of drinking water or increasing treatment of faecal sludge). Examples of countries setting local SDG-related targets might include focusing on the availability and quality of drinking water but setting a less stringent target for accessibility (<100 m) or, especially in informal urban areas, setting targets for improved sanitation (including shared facilities). National monitoring systems should first and foremost be aligned with these national targets and associated indicators. The JMP has provided guidance to countries and promoted harmonised approaches for monitoring core indicators of household WASH, notably through the introduction of core question for use in household surveys [38], and supports countries to benchmark and compare progress with reference to the WASH service ladders used for global SDG monitoring.
Filling data gaps: Establishing baselines for the SDG WASH targets has identified the main data gaps for countries, regions and globally. These include the management of onsite sanitation facilities (containment, emptying, transport and treatment), drinking water quality, the availability of drinking water when needed and the availability of handwashing facilities with water and soap in the home. Many countries are investing in data collection to address the SDG data gaps, whether through integration of the new elements in household surveys or strengthening collection and reporting of information through administrative and regulatory systems. For example, in the Democratic People’s Republic of Korea, a MICS survey in 2017 included questions relating to the management of onsite sanitation as well as modules on handwashing with water and soap and testing drinking water quality [39]. The Republic of Ireland Environmental Protection Agency regularly conducts inspections of a sample of septic tanks, identifying systems that may present a risk to public health and supporting the identification of suitable mitigation measures [40].
Methodological development: The development of methodologies for monitoring aspects of safely managed service will require new approaches which need to be piloted and validated prior to adoption in national data systems. There has been progress in identifying ways to collect information through household surveys [41] but further work is needed in evaluating different approaches for administrative data systems, especially for monitoring the collection and treatment of waste from onsite sanitation systems. Methodological development is also required to explore different approaches for integrating population-based data from household surveys with service provider and regulatory data from administrative sources to generate estimates for safely managed services.
New data collection approaches will be required to collect information on the experiences of women and adolescent girls, including in relation to menstrual hygiene, and vulnerable groups such as people living with disabilities. As disadvantaged groups vary between countries, a participatory process to identify these groups is an important first step for determining who is left behind and to identify suitable monitoring mechanisms where these groups are a small proportion of the national population. In many countries such definitions already exist and further work is needed to disaggregate existing data, for example, by race, ethnicity and/or mother tongue. Other areas requiring methodological development include the development of comparable metrics for subnational regions [42], benchmarking progress for countries at different stages of development [43] and affordability of WASH services [37].
8.2. Integrated Analysis at Regional and Global Levels
Follow up and review: At regional and global levels, databases drawing on national data facilitate international comparisons through a process known as “follow up and review”. This includes benchmarking of progress across countries and inputs to various political processes including regional initiatives (e.g., African Ministers’ Council on Water) and global initiatives (e.g., Sanitation and Water for All partnership). In addition to focusing on comparisons of national coverage between countries, these initiates should strive to embed review of inequalities and, particularly at the start of the SDG era, data availability on the new aspects of SDG WASH monitoring.
Integration: The availability of harmonised datasets on the new SDG indicators for WASH and increasing availability of data for other SDG 6 indicators has generated interest in the possibility of integrated analysis. The SDG 6 synthesis report prepared in advance of the High-level Political Forum in 2018 sought to bring together information from the whole of goal 6 [44]. Further research is required to explore the links between WASH services at home and WASH in schools and in health care facilities as well as links with other SDG 6 targets. For example data on safely managed sanitation services are critical inputs to the domestic component of SDG 6.3 on safely treated wastewater [44].
There is also scope for integrated analysis of links with other SDG goals and targets. For example, the WASH sector data on basic WASH services will contribute towards monitoring “universal access to basic services” (SDG 1.4) under the poverty reduction goal (SDG 1) and a methodology to combine these data with other basic services needs to be developed. Within the health goal, SDG 3.9.1 tracks the disease burden attributable to WASH. To prepare estimates for this indicator, WHO has combined information on the use of WASH services with relative risk factors, including estimates for higher levels of services [45]. Updated meta-regressions to calculate these risk factors suggest an important role for community-level sanitation coverage [46] and may create demand for additional indicators such as community-scale basic sanitation coverage. WASH services in schools (SDG 4.a.1) and health care centres (related to universal health coverage SDG 3.8.1) are also top priorities for SDG WASH monitoring and represent contributions beyond SDG 6.
Methodological development: The JMP should continue to explore methods for assessing the quality of data from diverse sources, especially focusing on administrative data used to estimate safely managed services. The JMP does not currently report uncertainty bounds as part of the global databases. This is in part due to concerns that non-sampling errors are likely to dominate sampling errors, especially since the underlying household survey data used to assess basic services often have large sample sizes for household living conditions. Although it is possible to use bootstrapping approaches (e.g., Wolf et al. [47] (2013)) this only captures model uncertainty and is not appropriate for the new SDG indicators which are data-sparse. The use of linear regression methods could be revisited as more datasets become available for the new indicators and to enable assessment of rates of progress for countries nearing universal access (or elimination of open defecation) [48]. Additionally, proxies may need to be developed to address data gaps for handwashing facilities in high-income countries, where data from observation of facilities with water and soap are rare.
Monitoring inequalities: At the global level, further work is required to systematically expand the availability of disaggregated data on WASH and to increase the number of countries for which such data are available. In the short term, this is likely to be limited to assessments up to the basic level given the existing data gaps and difficulties in integrating administrative data on safely managed services for sub-national regions or for different populations defined by wealth. In the medium term, additional stratifiers of inequality should include informal urban settlements and disadvantaged groups, which will require coordinated efforts by the WASH sector and others to establish definitions that can be used for international monitoring. Regional analysis of inequalities for disadvantaged groups will play an important role particularly, where disadvantaged groups are common between groups of countries (e.g., indigenous in central and south America). Disadvantaged groups need to make faster progress than advantaged groups (and the national average) to eliminate inequalities and reach universal access by 2030. Inequality analysis should extend to comparisons of rates of progress, for example using ARCs, and the rates required for different groups to achieve universal access.
Author Contributions
Conceptualization, R.B., F.M., C.C., R.J. and T.S.; methodology, R.B., F.M., C.C., R.J. and T.S.; data curation and analysis, R.B. and F.M.; writing–original draft preparation, R.B.; writing–review & editing, R.B., F.M., C.C., R.J. and T.S.; supervision, R.J. and T.S.
Funding
The JMP team is very grateful for the generous support it receives from external donors and from within WHO and UNICEF. During 2017 the JMP received support from AFD, BMGF, DFAT, DFID, DGIS, SDC and USAID. For further details see JMP 2017 annual report.
Acknowledgements
We would like to thank the many experts who have contributed to defining SDG WASH monitoring through the post-2015 working groups, JMP taskforces and Strategic Advisory Group. We are also grateful to WHO and UNICEF regional and country offices for their engagement in the process of setting SDG baselines as well as national authorities who generate the national data used in JMP reports and took part in the country consultation.
Conflicts of Interest
All authors work for WHO and UNICEF as part of the Joint Monitoring Programme for Water Supply, Sanitation and Hygiene.
Abbreviations
| ARC | Annual Rate of Change |
| DHS | Demographic and Health Surveys |
| JMP | Joint Monitoring Programme for Water Supply, Sanitation and Hygiene |
| MDG | Millennium Development Goals |
| MICS | Multiple Indicator Cluster Surveys |
| SDG | Sustainable Development Goals |
| UNICEF | United Nations Children’s Fund |
| WASH | Water, Sanitation and Hygiene |
| WHO | World Health Organization |
References
- UNGA Road Map Towards the Implementation of the United Nations Millennium Declaration. Available online: http://www.un.org/millenniumgoals/environ.shtml (accessed on 1 September 2018).
- World Health Organization (WHO); United Nations Children’s Fund (UNICEF). Progress on Sanitation and Drinking Water—2015 Update and MDG Assessment; WHO: Geneva, Switzerland, 2015. [Google Scholar]
- Bartram, J.; Luyendijk, R.; Hossain, R.; Fisher, M.; Gordon, B.; Wardlaw, T.; Brocklehurst, C. Global Monitoring of Water Supply and Sanitation: History, methods and future challenges. IJERPH 2014, 11, 8137–8165. [Google Scholar] [CrossRef] [PubMed]
- Bain, R.E.S.; Gundry, S.W.; Wright, J.A.; Yang, H.; Pedley, S.; Bartram, J.K. Accounting for water quality in monitoring access to safe drinking-water as part of the millennium development goals: Lessons from fve countries. Bull. World Health Organ. 2012, 90. [Google Scholar] [CrossRef] [PubMed] [Green Version]
- Baum, R.; Luh, J.; Bartram, J. Sanitation: A global estimate of sewerage connections without treatment and the resulting impact on MDG progress. Environ. Sci. Technol. 2013, 47, 1994–2000. [Google Scholar] [CrossRef] [PubMed]
- Bartram, J. Improving on haves and have-nots. Nature 2008, 452, 283–284. [Google Scholar] [CrossRef] [PubMed]
- De Albuquerque, C. Integrating Non-Discrimination and Equality into the Post-2015 Development Agenda for Water, Sanitation and Hygiene; Report A/67/270; United Nations General Assembly (UNGA): New York, NY, USA, 2011. [Google Scholar]
- Cronk, R.; Slaymaker, T.; Bartram, J. Monitoring drinking water, sanitation, and hygiene in non-household settings: Priorities for policy and practice. Int. J. Hyg. Environ. Health 2015, 218, 694–703. [Google Scholar] [CrossRef] [PubMed]
- United Nations General Assembly (UNGA). Human Rights and Access to Safe Drinking Water and Sanitation; UNGA: New York, NY, USA, 2010. [Google Scholar]
- United Nations. Transforming Our World: The 2030 Agenda for Sustainable Development; United Nations: New York, NY, USA, 2016. [Google Scholar]
- United Nations. Global Indicator Framework for the Sustainable Development Goals and Targets of the 2030 Agenda for Sustainable Development; United Nations: New York, NY, USA, 2018. [Google Scholar]
- Onda, K.; LoBuglio, J.; Bartram, J. Global access to safe water: Accounting for water quality and the resulting impact on MDG progress. Int. J. Environ. Res. Public Health 2012, 9, 880–894. [Google Scholar] [CrossRef] [PubMed]
- Bain, R.; Cronk, R.; Wright, J.; Yang, H.; Slaymaker, T.; Bartram, J. Fecal contamination of drinking-water in low- and middle-income countries: A systematic review and meta-analysis. PLoS Med. 2014, 11. [Google Scholar] [CrossRef] [PubMed]
- Kumpel, E.; Nelson, K.L. Intermittent water supply: Prevalence, practice, and microbial water quality. Environ. Sci. Technol. 2016, 50, 542–553. [Google Scholar] [CrossRef] [PubMed]
- Overbo, A.; Williams, A.R.; Evans, B.; Hunter, P.R.; Bartram, J. On-plot drinking water supplies and health: A systematic review. Int. J. Hyg. Environ. Health 2016, 219, 317–330. [Google Scholar] [CrossRef] [PubMed] [Green Version]
- Brown, J.; Hien, V.T.; McMahan, L.; Jenkins, M.W.; Thie, L.; Liang, K.; Printy, E.; Sobsey, M.D. Relative benefits of on-plot water supply over other “improved” sources in rural Vietnam. Trop. Med. Int. Health 2013, 18, 65–74. [Google Scholar] [CrossRef] [PubMed]
- Peal, A.; Evans, B.; Blackett, I.; Hawkins, P.; Heymans, C. Fecal sludge management: A comparative analysis of 12 cities. J. Water Sanit. Hyg. Dev. 2014, 4, 563–575. [Google Scholar] [CrossRef]
- Berendes, D.M.; Sumner, T.A.; Brown, J.M. Safely managed sanitation for all means fecal sludge management for at least 1.8 billion people in low and middle income countries. Environ. Sci. Technol. 2017, 51, 3074–3083. [Google Scholar] [CrossRef] [PubMed]
- World Health Organization (WHO); United Nations Children’s Fund (UNICEF). Safely Managed Drinking Water—Thematic Report on Drinking Water; WHO: Geneva, Switzerland, 2017. [Google Scholar]
- Evans, B.; Hueso, A.; Johnston, R.; Norman, G.; Pérez, E.; Slaymaker, T.; Trémolet, S. Limited services? The role of shared sanitation in the 2030 Agenda for Sustainable Development. J. Water Sanit. Hyg. Dev. 2017, 7, 349–351. [Google Scholar] [CrossRef] [Green Version]
- Kumar, S.; Loughnan, L.; Luyendijk, R.; Hernandez, O.; Weinger, M.; Arnold, F.; Ram, P.K. Handwashing in 51 countries: Analysis of proxy measures of handwashing behavior in multiple indicator cluster surveys and demographic and health surveys, 2010–2013. Am. J. Trop. Med. Hyg. 2017, 97, 447–459. [Google Scholar] [CrossRef] [PubMed]
- Chatterley, C.; Slaymaker, T.; Badloe, C.; Nouvellon, A.; Bain, R.; Johnston, R. Institutional WASH in the SDGs: Data gaps and opportunities for national monitoring. J. Water Sanit. Hyg. Dev. 2018. [Google Scholar] [CrossRef]
- World Health Organization (WHO); United Nations Children’s Fund (UNICEF). Core Questions and Indicators for Monitoring WASH in Schools in the Sustainable Development Goals; WHO: Geneva, Switzerland, 2016. [Google Scholar]
- World Health Organization (WHO); United Nations Children’s Fund (UNICEF). Core Questions and Indicators for Monitoring WASH in Health Care Facilities in the Sustainable Development Goals; WHO: Geneva, Switzerland, 2018. [Google Scholar]
- United Nations Children’s Fund (UNICEF); World Health Organization (WHO). Drinking Water, Sanitation and Hygiene in Schools: Global Baseline Report 2018; WHO: Geneva, Switzerland, 2018. [Google Scholar]
- World Health Organization (WHO); United Nations Children’s Fund (UNICEF). JMP Methodology 2017 Update and SDG Baselines; WHO: Geneva, Switzerland, 2018. [Google Scholar]
- United Nations Department of Economic and Social Affairs (UN DESA). World Population Prospects: 2015 Revison; United Nations: New York, NY, USA, 2015. [Google Scholar]
- United Nations Department of Economic and Social Affairs (UN DESA). World Urbanization Prospects: 2014 Revision; United Nations: New York, NY, USA, 2014. [Google Scholar]
- UNSD Standard Country or Area Codes for Statistical Use. Available online: https://unstats.un.org/unsd/methodology/m49/ (accessed on 1 September 2018).
- World Health Organization (WHO). Guidelines for Drinking-Water Quality, 4th ed.; WHO: Geneva, Switzerland, 2011; Volume 1. [Google Scholar]
- Martel, P. Review of Options for Reporting Water, Sanitation and Hygiene Coverage by Wealth Quintile; MICS Methodological Paper No. 4, 2016; United Nations Children’s Fund (UNICEF): New York, NY, USA, 2016. [Google Scholar]
- United Nations Statistics Division (UNSD). Report of the Inter-Agency and Expert Group on Sustainable Development Goal Indicators UN Statistical Commission; UNSD: New York, NY, USA, 2017. [Google Scholar]
- World Health Organization (WHO); United Nations Children’s Fund (UNICEF). Progress on Drinking Water and Sanitation: Special Focus on Sanitation; WHO: Geneva, Switzerland, 2008. [Google Scholar]
- World Health Organization (WHO); United Nations Children’s Fund (UNICEF). Progress on Drinking Water and Sanitation—2014 Update; WHO: Geneva, Switzerland, 2014. [Google Scholar]
- Mactaggart, I.; Schmidt, W.-P.; Bostoen, K.; Chunga, J.; Danquah, L.; Halder, A.K.; Parveen Jolly, S.; Polack, S.; Rahman, M.; Snel, M.; et al. Access to water and sanitation among people with disabilities: Results from cross-sectional surveys in Bangladesh, Cameroon, India and Malawi. BMJ Open 2018, 8, e020077. [Google Scholar] [CrossRef] [PubMed]
- Pullan, R.L.; Freeman, M.C.; Gething, P.W.; Brooker, S.J. Geographical inequalities in use of improved drinking water supply and sanitation across sub-Saharan Africa: Mapping and spatial analysis of cross-sectional survey data. PLoS Med. 2014, 11, e1001626. [Google Scholar] [CrossRef] [PubMed]
- Hutton, G.; Andres, L. Counting the costs and benefits of equitable WASH service provision. In Equality in Water and Sanitation Services; Cumming, O., Slaymaker, T., Eds.; Routledge: London, UK, 2018. [Google Scholar]
- World Health Organization (WHO); United Nations Children’s Fund (UNICEF). Core Questions on Drinking-Water and Sanitation for Household Surveys; WHO: Geneva, Switzerland, 2006. [Google Scholar]
- Centrall Statistical Bureau; United Nations Children’s Fund (UNICEF). Multiple Indicator Cluster Survey 2017—Survey Findings Report; Centrall Statistical Bureau: Pyongyang, Korea, 2017. [Google Scholar]
- Environment Protection Agency. National Inspection Plan 2015–2017 Domestic Waste Water Treatment Systems; Environment Protection Agency: Wexford, Ireland, 2017.
- Khan, S.M.; Bain, R.E.S.; Lunze, K.; Unalan, T.; Beshanski, B.; Slaymaker, T.; Johnston, R.; Hancioglu, A. Optimizing household survey methods to monitor the Sustainable Development Goals sanitation and hygiene: A mixed-methods field-test in Belize. PLoS ONE 2017, 12, e0189089. [Google Scholar] [CrossRef] [PubMed]
- Hosseinpoor, A.R.; Bergen, N.; Barros, A.J.D.; Wong, K.L.M.; Boerma, T.; Victora, C.G. Monitoring subnational regional inequalities in health: Measurement approaches and challenges. Int. J. Equity Health 2016, 15, 18. [Google Scholar] [CrossRef] [PubMed]
- Luh, J.; Baum, R.; Bartram, J. Equity in water and sanitation: Developing an index to measure progressive realization of the human right. Int. J. Hyg. Environ. Health 2013, 216, 662–671. [Google Scholar] [CrossRef] [PubMed]
- UN-Water. SDG 6 Synthesis Report 2018 on Water and Sanitation; UN-Water: Geneva, Switzerland, 2018. [Google Scholar]
- Pruss-Ustun, A.; Bartram, J.; Clasen, T.; Colford, J.M., Jr.; Cumming, O.; Curtis, V.; Bonjour, S.; Dangour, A.D.; De France, J.; Fewtrell, L.; et al. Burden of disease from inadequate water, sanitation and hygiene in low- and middle-income settings: A retrospective analysis of data from 145 countries. Trop. Med. Int. Health 2014, 19, 894–905. [Google Scholar] [CrossRef] [PubMed] [Green Version]
- Wolf, J.; Hunter, P.R.; Freeman, M.C.; Cumming, O.; Clasen, T.; Bartram, J.; Higgins, J.P.T.; Johnston, R.; Medlicott, K.; Boisson, S.; et al. Impact of drinking water, sanitation and handwashing with soap on childhood diarrhoeal disease: Updated meta-analysis and meta-regression. Trop. Med. Int. Health 2018, 23, 508–525. [Google Scholar] [CrossRef] [PubMed]
- Wolf, J.; Bonjour, S.; Pruss-Ustun, A. An exploration of multilevel modeling for estimating access to drinking-water and sanitation. J. Water Health 2013, 11, 64–77. [Google Scholar] [CrossRef] [PubMed]
- Fuller, J.A.; Goldstick, J.; Bartram, J.; Eisenberg, J.N.S. Tracking progress towards global drinking water and sanitation targets: A within and among country analysis. Sci. Total Environ. 2016, 541, 857–864. [Google Scholar] [CrossRef] [PubMed]
Figure 1.
Example of JMP linear regression method using rural Viet Nam data: (a) Drinking water (b) sanitation and (c) hygiene. Source: WHO/UNICEF JMP (2017).
Figure 1.
Example of JMP linear regression method using rural Viet Nam data: (a) Drinking water (b) sanitation and (c) hygiene. Source: WHO/UNICEF JMP (2017).

Figure 2.
Estimation of safely managed drinking water services in sub-Saharan Africa. Source: WHO/UNICEF JMP (2017).
Figure 2.
Estimation of safely managed drinking water services in sub-Saharan Africa. Source: WHO/UNICEF JMP (2017).

Figure 3.
Estimation of safely managed sanitation services in rural Estonia. Source: WHO/UNICEF JMP (2017).
Figure 3.
Estimation of safely managed sanitation services in rural Estonia. Source: WHO/UNICEF JMP (2017).

Figure 4.
Progress towards universal (a) basic drinking water and (b) basic sanitation services and (c) elimination of open defecation by 2030. Charts show countries where at least 5% of the population lacked basic services or practised open defecation in 2015. Source: WHO/UNICEF JMP 2017.
Figure 4.
Progress towards universal (a) basic drinking water and (b) basic sanitation services and (c) elimination of open defecation by 2030. Charts show countries where at least 5% of the population lacked basic services or practised open defecation in 2015. Source: WHO/UNICEF JMP 2017.


Figure 5.
Inequalities in basic drinking water services comparing the world, countries in sub-Saharan Africa and sub-national inequalities by urban/rural, wealth quintiles and sub-national regions in Mozambique. (Wealth quintiles and sub-national regions based on 2011 data from DHS 2011). Source: washdata.org.


Table 1.
SDG targets and global indicators for household WASH.
| SDG 6 Target | SDG 6 Indicator | Additional Global Indicators Tracked by JMP |
|---|---|---|
| SDG 6.1: By 2030, achieve universal and equitable access to safe and affordable drinking water for all | SDG 6.1.1 Proportion of the population using safely managed drinking water services | Service levels: Basic service 1, Limited service, Surface water Facility types: Piped water, Non-piped improved |
| SDG 6.2: By 2030, achieve access to adequate and equitable sanitation and hygiene for all and end open defecation, paying special attention to the needs of women and girls and those in vulnerable situations | SDG 6.2.1.a Proportion of the population using safely managed sanitation services | Service levels: Basic service 1, Limited service, Open defecation 2 Facility types: Sewer, Septic, Latrines and other improved |
| SDG 6.2.1.b Proportion of the population with a handwashing facility with water and soap (also tracked as basic service 1) | Service levels: Basic service 1, Limited service, No service |
1 SDG sub-indicator for global reporting on SDG 1.4; 2 Supplementary indicator for global reporting on SDG 6.2. Source: United Nations (2018) and WHO/UNICEF JMP (2017).
Table 2.
Drinking water, sanitation and hygiene service ladders for household WASH monitoring.
| Service Level | Drinking Water Ladder | Sanitation Ladder | Hygiene Ladder |
|---|---|---|---|
| Safely managed | Drinking water from an improved water source that is located on premises, available when needed and free from faecal and priority chemical contamination | Use of improved facilities that are not shared with other households and where excreta are safely disposed of in situ or transported and treated offsite | N/A |
| Basic | Drinking water from an improved source, provided collection time is not more than 30 min for a round trip, including queuing | Use of improved facilities that are not shared with other households | Availability of a handwashing facility on premises with soap and water |
| Limited | Drinking water from an improved source for which collection time exceeds 30 min for a round trip, including queuing | Use of improved facilities shared between two or more households | Availability of a handwashing facility on premises without soap and water |
| Unimproved | Drinking water from an unprotected dug well or unprotected spring | Use of pit latrines without a slab or platform, hanging latrines or bucket latrines | N/A |
| No service | Drinking water directly from a river, dam, lake, pond, stream, canal or irrigation channel | Disposal of human faeces in fields, forests, bushes, open bodies of water, beaches or other open spaces, or with solid waste 1 | No handwashing facility on premises |
| Notes | Improved sources include piped water, boreholes or tubewells, protected dug wells, protected springs, rainwater, and packaged or delivered water | Improved facilities include flush/pour flush to piped sewer systems, septic tanks or pit latrines; ventilated improved pit latrines, composting toilets or pit latrines with slabs | Handwashing facilities may be fixed or mobile and include a sink with tap water, buckets with taps, tippy-taps, and jugs or basins designated for handwashing. Soap includes bar soap, liquid soap, powder detergent, and soapy water |
1 Known as “open defecation”; N/A—not applicable. Source: WHO/UNICEF JMP (2017)
Table 3.
Safely managed elements and examples from household surveys and administrative systems.
| Safely Managed Element | Household Survey Example | Administrative Data Example |
|---|---|---|
| Drinking water | ||
| Accessible on premises | Water source reported as on-premises or <1 min collection time | % of population in service area with household connections |
| Available when needed | Household reports availability of sufficient drinking water in last month | Service hours ≥12 h per day on average |
| Free from contamination | Water quality testing for E. coli where drinking water is collected | Water quality surveillance data from regulator or Ministry of Health showing compliance with bacteriological standards |
| Water quality testing for arsenic or fluoride where drinking water is collected | Water quality surveillance data from regulator or Ministry of Health showing compliance with chemical standards | |
| Sanitation | ||
| Treated and disposed of in situ | On-site sanitation facility reported as never emptied | Inspections of septic tanks |
| Emptied and treated | On-site sanitation facilities reported as emptied and excreta removed by the household or a service provider | Data recording the collection and disposal of night soil |
| Wastewater treated | N/A 1 | Data on the proportion of wastewater treated to at least secondary levels |
1 N/A—not available.
Table 4.
SDG baseline data coverage for drinking water, sanitation and hygiene services.
| Region | Safely Managed Drinking Water Services | Safely Managed Sanitation Services | Basic Drinking Water Services | Basic Sanitation Services | Basic Hygiene Services | |||||
|---|---|---|---|---|---|---|---|---|---|---|
| % 1 | n 2 | % 1 | n 2 | % 1 | n 2 | % 1 | n 2 | % 1 | n 2 | |
| World | 34.4 | 96 | 47.7 | 84 | 99.6 | 228 | 100.0 | 224 | 29.7 | 70 |
| Urban | 43.4 | 43 | 43.2 | 68 | 52.4 | 181 | 93.3 | 178 | 23.9 | 70 |
| Rural | 39.8 | 20 | 34.6 | 32 | 54.3 | 174 | 98.9 | 173 | 36.4 | 70 |
| SDG regions | ||||||||||
| Australia and New Zealand | 15.9 | 1 | 100.0 | 2 | 100.0 | 2 | 100.0 | 2 | 0.0 | 0 |
| Central and Southern Asia | 74.2 | 8 | 0.0 | 0 | 100.0 | 13 | 100.0 | 14 | 23.7 | 8 |
| Eastern and South-eastern Asia | 10.7 | 7 | 71.8 | 6 | 87.2 | 18 | 100.0 | 17 | 19.1 | 5 |
| Latin America and the Caribbean | 49.3 | 10 | 87.1 | 13 | 98.9 | 46 | 100.0 | 46 | 34.0 | 14 |
| Europe and Northern America | 96.7 | 48 | 82.2 | 41 | 96.5 | 52 | 100.0 | 49 | 0.7 | 2 |
| Oceania | 5.5 | 3 | 0.3 | 2 | 75.3 | 21 | 99.0 | 20 | 0.0 | 0 |
| Sub-Saharan Africa | 40.6 | 7 | 4.8 | 3 | 99.7 | 51 | 100.0 | 51 | 86.8 | 34 |
| Northern Africa and Western Asia | 19.4 | 12 | 77.7 | 17 | 85.1 | 24 | 99.9 | 24 | 51.7 | 7 |
1 Proportion of the population for which data were available in the JMP 2017 update; 2 Number of countries, areas and territories with data out of a total of N = 232 in the JMP 2017 update. Note: Highlighted cells indicate sufficient data to generate regional and global estimates for basic services (>50%) and safely managed services (>30%).
Table 5.
Populations using basic services or practising open defecation in 2015 and annual rate of change (2000–2015) globally and by SDG region.
Table 5.
Populations using basic services or practising open defecation in 2015 and annual rate of change (2000–2015) globally and by SDG region.
| Region | Basic Drinking Water Service | Basic Sanitation Service | Basic Hygiene Service | Open Defecation | ||||||||
|---|---|---|---|---|---|---|---|---|---|---|---|---|
| % | Pop w/out | ARC | % | Pop w/out | ARC | % | Pop w/out | ARC | % | Pop | ARC | |
| World | 88.5 | 844 | 0.49 | 68.1 | 2348 | 0.63 | - | - | - | 12.1 | 892 | −0.53 |
| Urban | 95.4 | 181 | 0.00 | 83.2 | 667 | 0.20 | - | - | - | 2.0 | 80 | −0.16 |
| Rural | 80.4 | 663 | 0.79 | 50.4 | 1680 | 0.71 | - | - | - | 24.0 | 812 | −0.65 |
| SDG regions | ||||||||||||
| Australia and New Zealand | 100.0 | 0 | 0.01 | 100.0 | 0 | 0.00 | - | - | - | 0.0 | 0 | 0.00 |
| Central and Southern Asia | 88.4 | 219 | 0.40 | 50.1 | 944 | 1.39 | - | - | - | 29.5 | 558 | −1.56 |
| Eastern and South-eastern Asia | 94.2 | 131 | 0.97 | 77.0 | 517 | 0.87 | - | - | - | 3.3 | 74 | −0.25 |
| Latin America and the Caribbean | 96.2 | 24 | 0.38 | 85.7 | 91 | 0.70 | - | - | - | 3.0 | 19 | −0.44 |
| Europe and Northern America | 98.9 | 12 | 0.02 | 97.2 | 31 | 0.10 | - | - | - | 0.0 | 0 | 0.00 |
| Oceania | 52.0 | 5 | −0.21 | 35.7 | 7 | −0.04 | - | - | - | 12.1 | 1 | −0.06 |
| Sub-Saharan Africa | 57.6 | 408 | 0.88 | 28.1 | 692 | 0.23 | 15.4 | 814 | - | 22.9 | 220 | −0.59 |
| Northern Africa and Western Asia | 90.6 | 45 | 0.40 | 86.1 | 67 | 0.51 | 76.3 | 228 | - | 4.1 | 20 | −0.35 |
Pop w/out: population without basic service in millions; Pop: population practising open defecation in millions; ARC: annual rate of change between 2000 and 2015 in % points per year; “-”insufficient data coverage to generate a baseline estimate or trends. Source: WHO/UNICEF JMP (2017).
Table 6.
Safely managed elements and estimates globally and by SDG region.
| Region | Drinking Water | Sanitation | ||||||
|---|---|---|---|---|---|---|---|---|
| Accessible on Premises | Available When Needed | Free from Contamination | Safely Managed Drinking Water 1 | Treated and Disposed of in Situ | Emptied and Treated | Wastewater Treated | Safely Managed Sanitation 2 | |
| World | 73.7 | 79.1 | 73.2 | 71.2 | 12.8 | - | 26.5 | 39.3 |
| Urban | 85.5 | 85.1 | 88.9 | 85.1 | - | - | 43.2 | 43.2 |
| Rural | 59.9 | 72.0 | 54.8 | 54.8 | 27.8 | - | 6.8 | 34.6 |
| SDG regions | ||||||||
| Australia and New Zealand | 98.1 | 96.4 | - | - | - | - | 68.2 | 68.2 |
| Central and Southern Asia | 62.8 | 80.8 | 60.4 | 57.1 | - | - | 3.2 | - |
| Eastern and South-eastern Asia | 86.9 | - | - | - | 23.8 | - | 31.5 | 55.3 |
| Latin America and the Caribbean | 93.0 | 73.7 | 65.4 | 65.4 | - | - | 22.4 | 22.4 |
| Europe and Northern America | 94.2 | 97.8 | 97.5 | 94.2 | - | - | 77.9 | 77.9 |
| Oceania | 35.3 | - | - | - | - | - | 3.3 | - |
| Sub-Saharan Africa | 23.7 | 53.5 | 42.0 | 23.7 | - | - | - | - |
| Northern Africa and Western Asia | 81.9 | 78.1 | - | - | - | - | 32.8 | 32.8 |
1 Calculated based on the minimum of the three criteria for safely managed services; 2 Calculated by summing the three types of safely managed services; “-” insufficient data coverage to generate a baseline estimate. Source: WHO/UNICEF JMP (2017)
© 2018 by the authors. Licensee MDPI, Basel, Switzerland. This article is an open access article distributed under the terms and conditions of the Creative Commons Attribution (CC BY) license (http://creativecommons.org/licenses/by/4.0/).
Share and Cite
MDPI and ACS Style
Bain, R.; Johnston, R.; Mitis, F.; Chatterley, C.; Slaymaker, T. Establishing Sustainable Development Goal Baselines for Household Drinking Water, Sanitation and Hygiene Services. Water 2018, 10, 1711. https://doi.org/10.3390/w10121711
AMA Style
Bain R, Johnston R, Mitis F, Chatterley C, Slaymaker T. Establishing Sustainable Development Goal Baselines for Household Drinking Water, Sanitation and Hygiene Services. Water. 2018; 10(12):1711. https://doi.org/10.3390/w10121711
Chicago/Turabian StyleBain, Robert, Richard Johnston, Francesco Mitis, Christie Chatterley, and Tom Slaymaker. 2018. "Establishing Sustainable Development Goal Baselines for Household Drinking Water, Sanitation and Hygiene Services" Water 10, no. 12: 1711. https://doi.org/10.3390/w10121711
Note that from the first issue of 2016, this journal uses article numbers instead of page numbers. See further details here.