An Experimental and Theoretical Study on Separations by Vacuum Membrane Distillation Employing Hollow-Fiber Modules


1
Chemical Process Engineering Research Institute, Centre for Research and Technology—Hellas, P.O. Box 60361, GR57001 Thermi-Thessaloniki, Greece
2
Division of Chemical Technology, Department of Chemistry, Aristotle University of Thessaloniki, Univ. Box 116, GR54124 Thessaloniki, Greece
*
Author to whom correspondence should be addressed.
Water 2018, 10(7), 947; https://doi.org/10.3390/w10070947
Submission received: 24 May 2018
/
Revised: 13 July 2018
/
Accepted: 13 July 2018
/
Published: 16 July 2018
(This article belongs to the Special Issue Recent Advances in Water and Wastewater Treatment with Emphasis in Membrane Treatment Operations)
Abstract
:Vacuum membrane distillation (VMD) is an attractive variant of the novel membrane distillation process, which is promising for various separations, including water desalination and bioethanol recovery through fermentation of agro-industrial by-products. This publication is part of an effort to develop a capillary membrane module for various applications, as well as a model that would facilitate VMD process design. Experiments were conducted in a laboratory pilot VMD unit, comprising polypropylene capillary-membrane modules. Performance data, collected at modest temperatures (37 °C to 65 °C) with deionized and brackish water, confirmed the improved system productivity with increasing feed-water temperature; excellent salt rejection was obtained. The recovery of ethanol from ethanol-water mixtures and from fermented winery by-products was also studied, in continuous, semi-continuous, and batch operating modes. At low-feed-solution temperature (27–47 °C), ethanol-solution was concentrated 4 to 6.5 times in continuous operation and 2 to 3 times in the semi-continuous mode. Taking advantage of the small property variation in the module axial-flow direction, a simple VMD process model was developed, satisfactorily describing the experimental data. This VMD model appears to be promising for practical applications, and warrants further R&D work.
1. Introduction
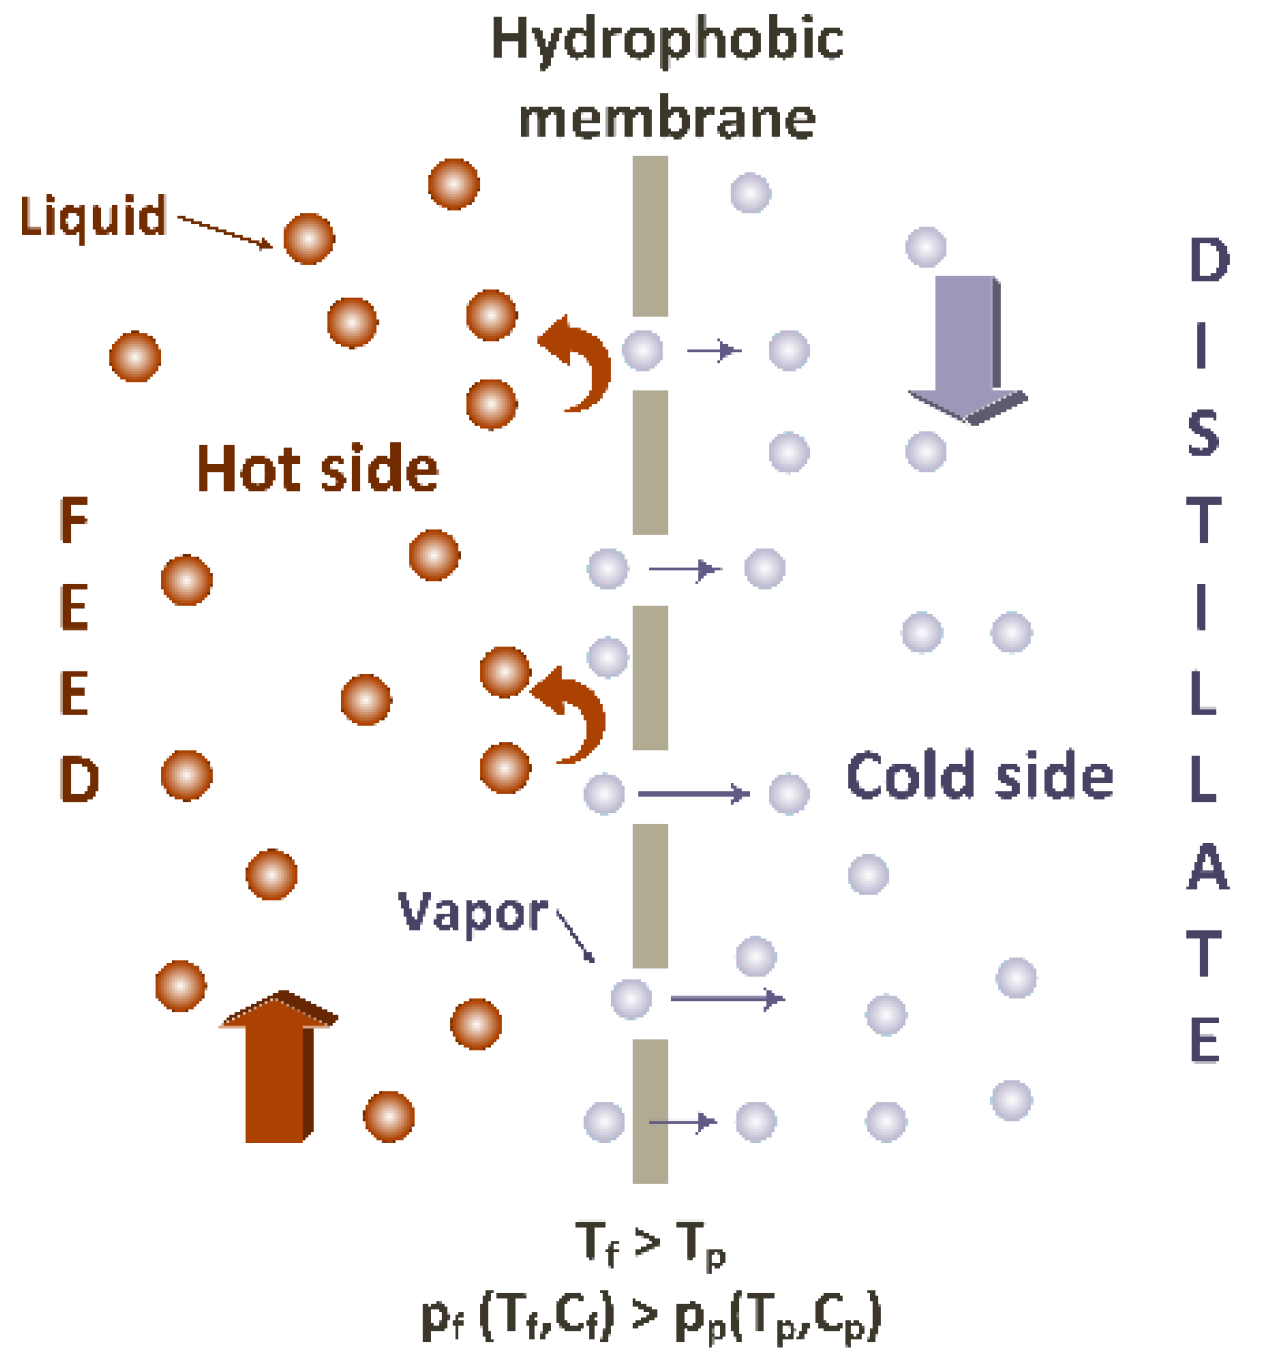
In membrane distillation (MD) the temperature difference between the warm feed and the cooler permeate side (Figure 1) drives the separation process. Vacuum membrane distillation (VMD) is a significant variant of the MD process, where the permeation of volatile compound through the membrane is enhanced by applying vacuum at the permeate side. Vacuum membrane distillation is applicable to single component separation (e.g., water treatment, desalination), binary mixture separations (e.g., concentration of dilute ethanol solutions), and separation of volatile compounds from multi-component mixtures (e.g., recovery of flavors from aqueous solutions). Due to the relatively low-suction pressure applied at the permeate side, and the membrane hydrophobicity, molecules of the volatile compound evaporate at the warmer feed-side of the membrane, move as vapor though the membrane pores, and are condensed in an external condenser [1,2,3]. The VMD mode of operation is considered [4,5,6] to have two advantages, in comparison to other MD variants: (a) relatively low-conductive heat loss and (b) reduced resistance to mass transfer.
Despite the above potential benefits, the development of VMD for large-scale applications appears to be lagging behind other MD versions, notably direct contact membrane distillation (DCMD) [4,7]. As in all types of MD, key issues for VMD implementation and development are the membrane type and the module design. For VMD, the application of vacuum clearly favors a shell-and-tube type of module, comprised of a multitude of hollow fiber, capillary or tubular membranes. A criterion for classifying these membrane types is the lumen diameter; characteristic sizes are <0.5 mm for hollow fiber (HF), 0.5 to ~2 mm for capillary, and > ~2 mm for tubular [4,7]. With HF and tubular membranes one can achieve, respectively, the greatest and smallest membrane surface area per unit volume. For this reason, HF membranes tend to be favored for module development [8,9]. However, the small hollow-fiber diameter and the densely packed bundle of HF lead to operating problems; (i.e., flow maldistribution at shell-side, increased pressure drop and related energy consumption, increased fouling, and difficulty of membrane cleaning) [4,10]. Therefore, overall, capillary membranes seem to hold advantages over other types for developing VMD modules for practical applications of a broad spectrum, including processing and separations of various aqueous product and effluent streams [4,7]. In general, very recent studies (e.g., [8,9,10]) suggest that further R&D work is needed to develop HF modules for practical applications.
A significant number of experimental studies have reported on various applications of VMD. These studies include the treatment of high-salinity solutions [11], desalination brines [12,13], ethanol-water separation [14,15], recovery of volatile organic compounds (e.g., ethanol, butanol, tert-methyl-butyl-ester, ethyl acetate, chloroform) from water [16,17,18], recovery of aromatic compounds from fruit [19,20], the concentration of juices [20] and of ginseng extracts [21,22], and the removal of radioactive compounds (e.g., cesium, strontium) [23,24], fluoride [25], arsenic [26,27], and pesticides [28] from water. Vacuum membrane distillation has also been tested for the treatment of heavily polluted wastewater such as olive mill waste-water [29], mining water [30,31], and dye solutions [32]. Although useful insights have been gained from the above studies, the aforementioned issues of selecting appropriate membrane type and module design for VMD have not been resolved.
The above considerations have motivated the authors’ work toward development of a VMD module employing capillary membranes, for various applications. Experiments reported herein, to explore such VMD applications, include water desalination, ethanol-water separation, and recovery of a concentrated natural bio-ethanol solution from fermented winery by-products. A simple model of the VMD process was also developed focusing on utilization of the experimental data for assessment of the membrane properties. Temperature polarization was taken into account, whereas a linearization of the temperature profile along the flow allowed the use of the average temperature in the model, leading to a dimensionality reduction. The model was employed to interpret the experimental data and extract appropriate membrane permeability values [4,7].
2. Materials and Methods
2.1. Membrane Module
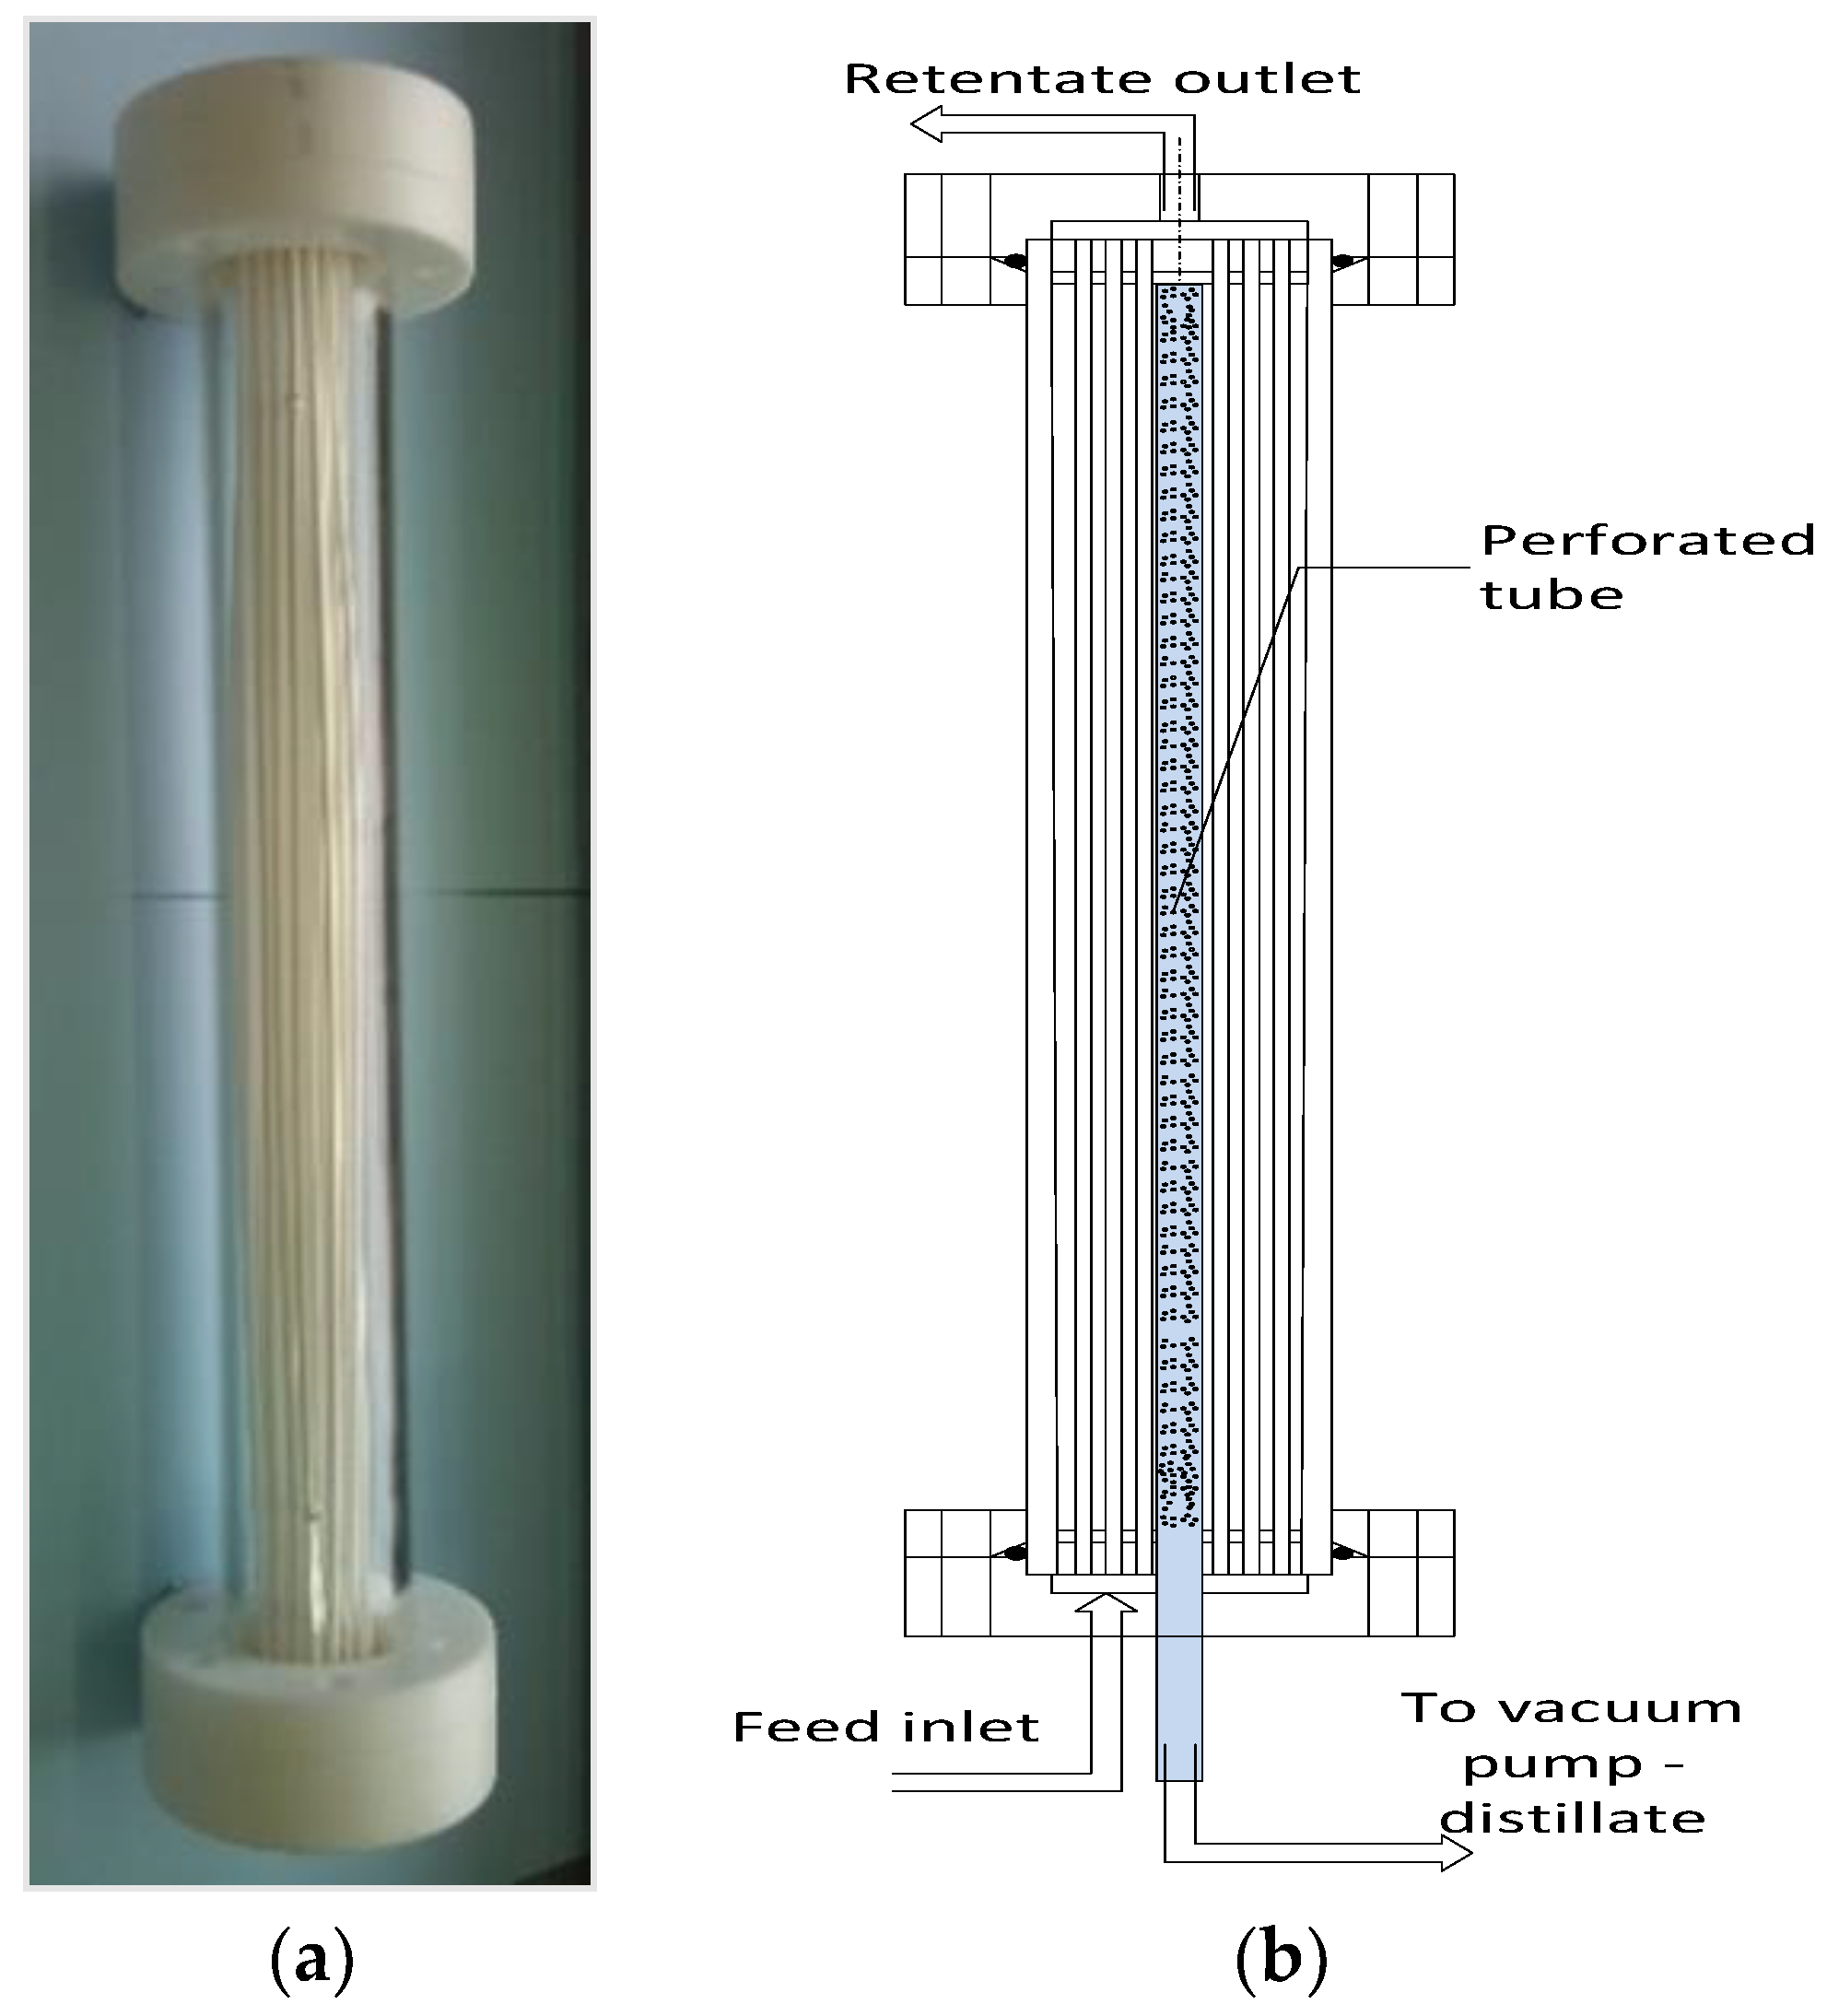
Commercial microporous hydrophobic polypropylene capillary membranes (Accurel® PP S6/2, Membrana Gmbh, Wuppertal, Germany) were employed in this study. The particular membranes, characterized by satisfactory durability and overall good performance, have been widely used in various literature studies [33,34,35,36,37,38,39]. The characteristics of the membranes as provided by the manufacturer and related literature [40] are summarized in Table A1 of the Appendix A. The MD experiments were performed with custom-made membrane contactors. The type of membrane module used is considered to be of practical interest as it can be readily up-scaled to a larger size and exhibits a rather small module-volume to membrane-surface ratio [3]. Two types of membrane modules were constructed with Plexiglas (poly-methyl methacrylate (PMMA)) housing. In the first module (M1), the vacuum was applied at the side of the shell, whereas in the second (M2), a perforated tube was placed in the core of the module for the suction of vapors. In some cases, a certain number of fibers of the membrane module M1 had to be inactivated to reduce the active membrane surface (M1A and M1B) for parametric studies. The feed solution (hot stream) was fed in the lumen of the membrane fibers. The technical data of the membrane modules are listed in Table A1 (Appendix A). A picture and a sketch of the membrane modules are included in Figure 2.
2.2. Experimental Set-Up and Experimental Protocol
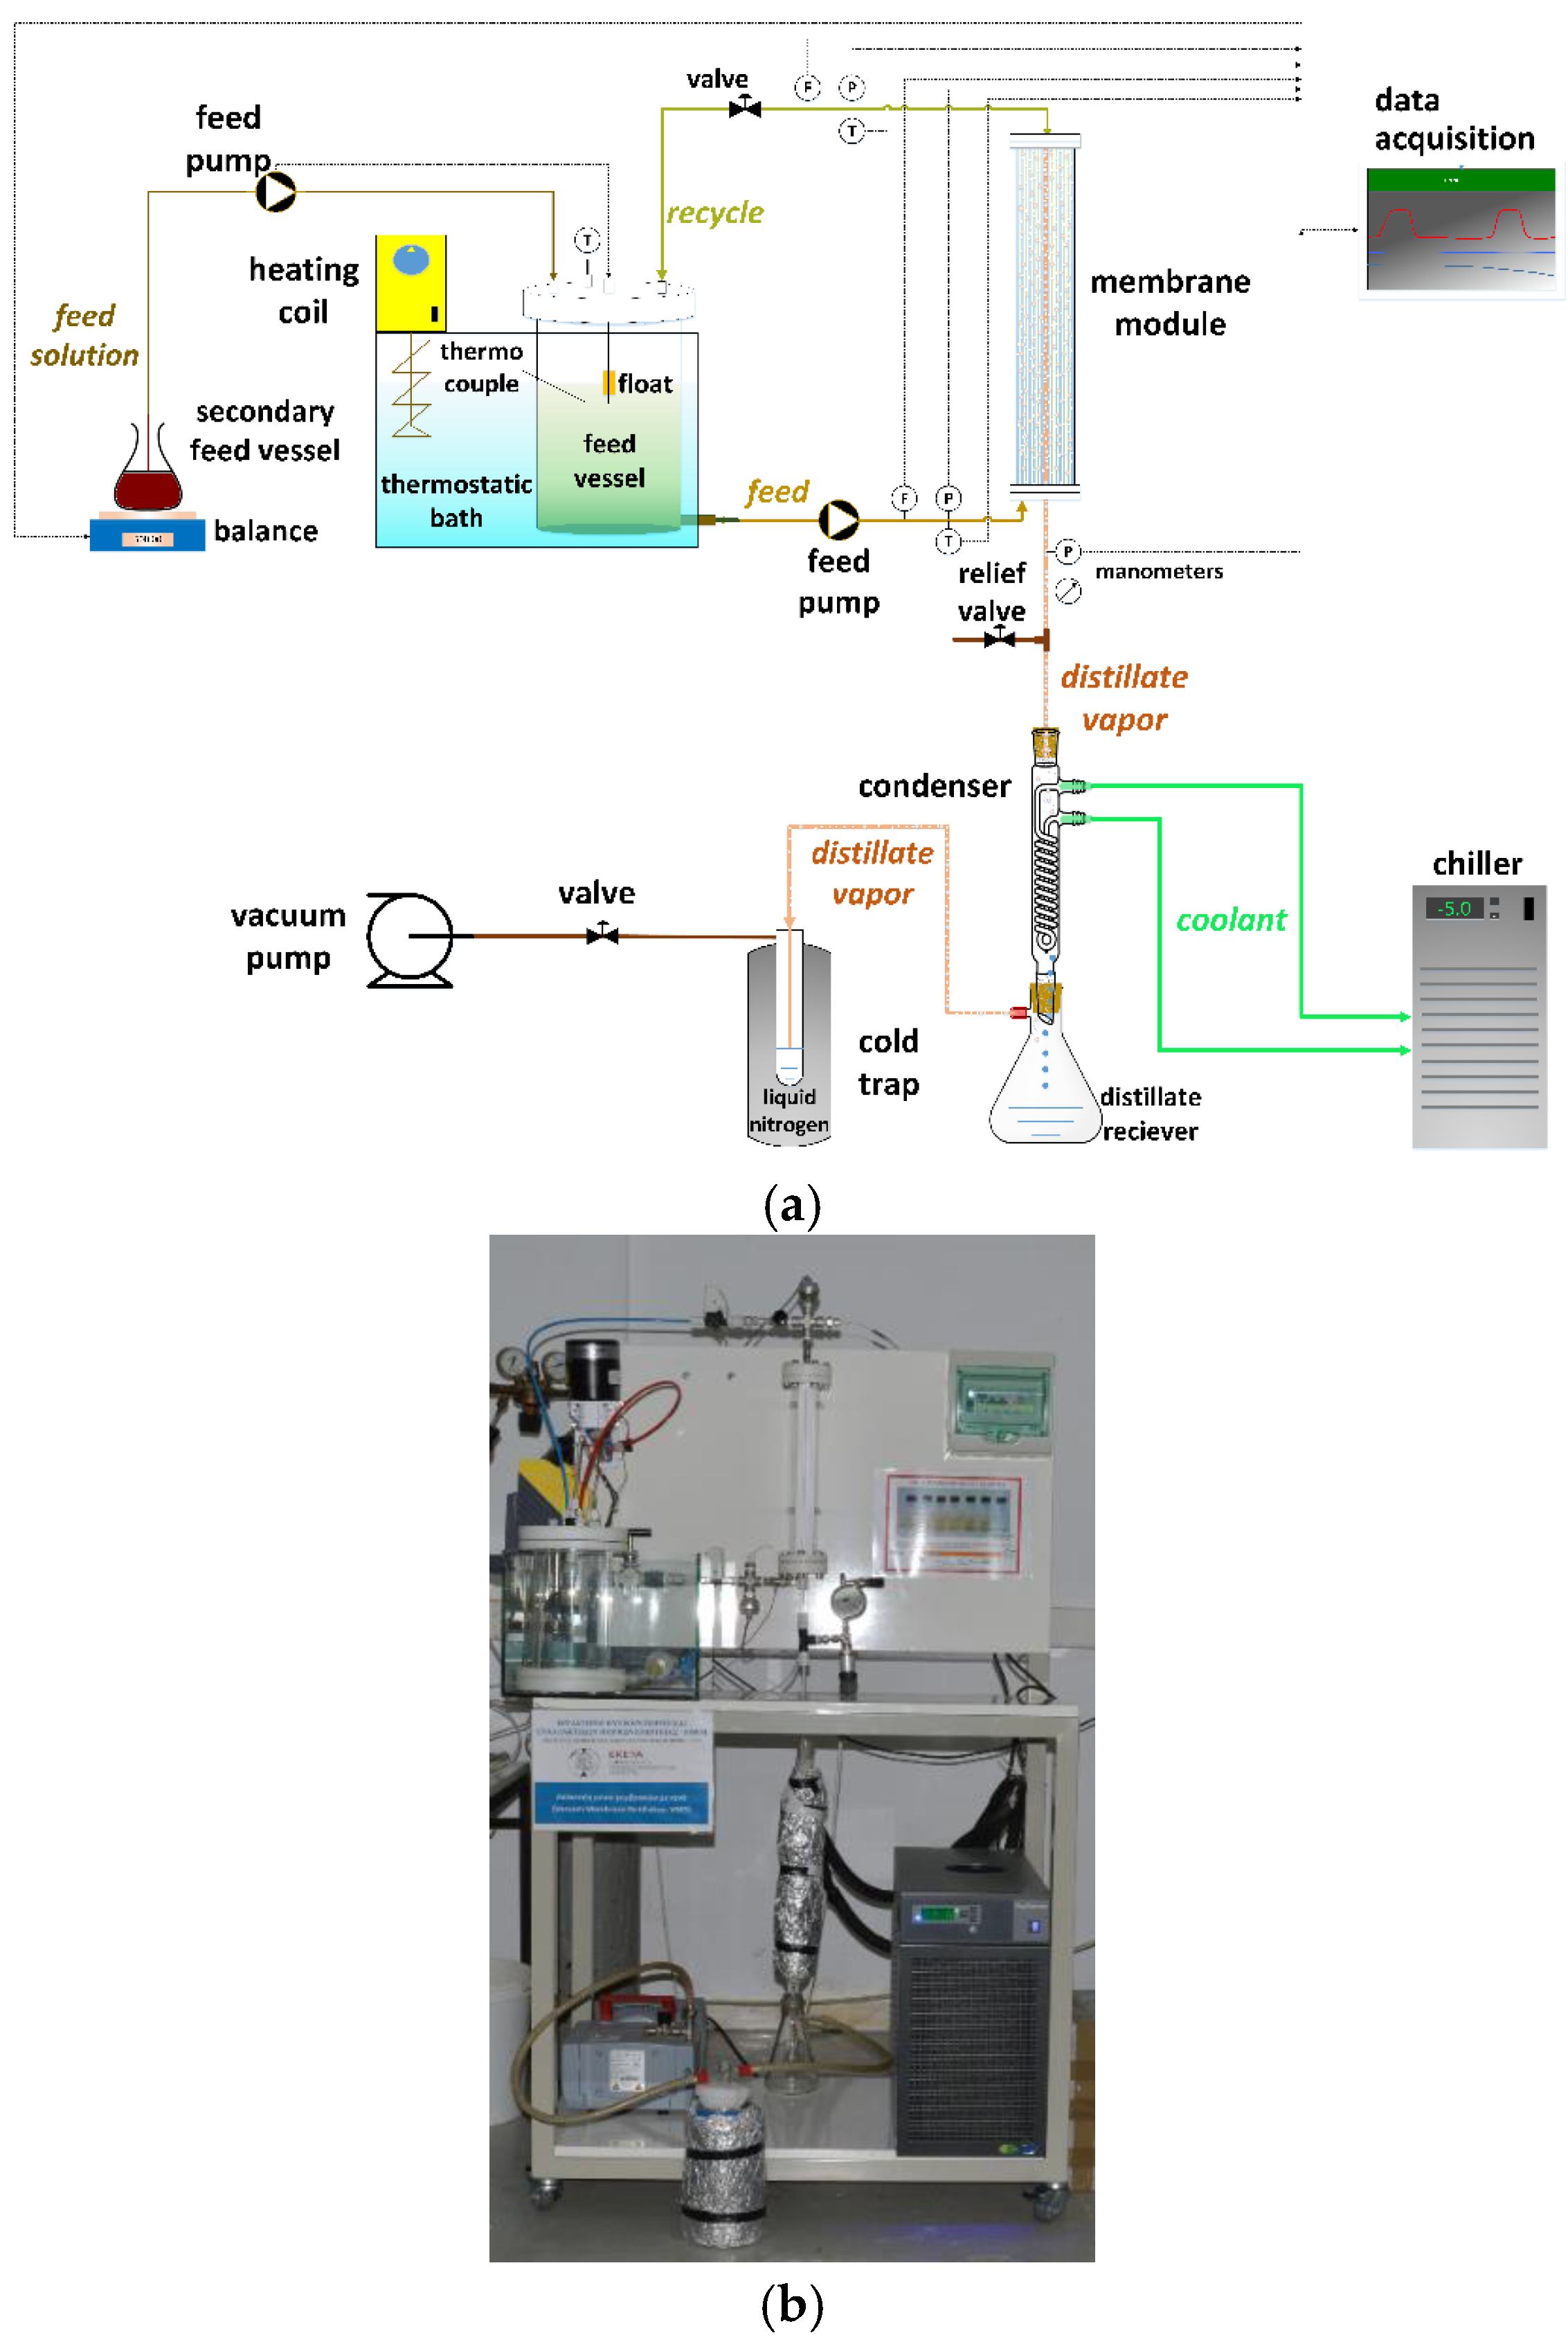
All VMD experiments were conducted in a laboratory-pilot experimental set-up, which is shown in Figure 3. This experimental set-up consisted of the “warm loop” of the feed solution and the “vacuum loop” for the recovery of the volatile component vapors from the membrane module. The warm loop was comprised of a thermostatic bath heated with a heating coil (D-79219, IKA® WERKE GMBH KG, Staufen, Germany), a primary and a secondary feed vessel, a magnetic centrifugal pump (MD-15R-230QS, IWAKI Co. Ltd., Tokyo, Japan), and a piston pump (QD, Fluid Metering Inc., Syosset, Long Island, NY, USA). The distillate side consisted of a diaphragm vacuum pump (MVP 070-3, Pfeifer Vacuum GmbH, Aßlar, Germany), a condenser where a refrigerant (ethylene glycol solution) was circulated through a chiller (LS52M21A110E, PolyScience, Niles, IL, USA), and a liquid nitrogen cold trap. Parameters such as inlet and outlet temperature, pressure, and flow rates were monitored and recorded employing a data acquisition program (GeniDAQ, Advantech Co. Ltd., Taipei, Taiwan). The membrane module was also connected to a nitrogen gas supply for drying.
The feed solution to be separated was placed in the primary feed tank, which was kept at a constant temperature using a water bath. This container could also be used as a bioreactor for continuous fermentation and in situ separation of the produced bioethanol from the fermentation broth. The feed solution was pumped via a centrifugal pump to the membrane module, passing through the fiber lumen and returned to the container. The volatile components of the feed solution tended to evaporate at the membrane surface, and the vapors were transferred (through the membrane pores) to the shell side of the membrane module by the action of vacuum. The vapor was condensed by means of a condenser and a liquid nitrogen cold-trap. The distillate solution was collected in a closed container. Due to the removal of distillate, the level in the main feed tank decreased; therefore, a level sensor, fitted to the main tank, activated the piston pump to draw solution from the auxiliary container and maintain a constant level. The fluid mass of the auxiliary container, continuously recorded with an electronic balance, provided the data required to determine the system productivity. Specifically, the permeate flux, providing a measure of system productivity, was computed as follows:
where mi is the mass in the secondary vessel at time ti, mi+1 is the mass in the auxiliary vessel at time ti+1, and A the active membrane surface area of the module.
Usually, in the auxiliary container, a solution with the characteristics of the distillate was placed so that the concentration in the main container remained nearly constant, thus facilitating continuous operation. In some cases, the same feed solution was also placed in the auxiliary vessel (semi-continuous operation) or there was no supply to the primary vessel (batch operation). In the batch experiment, the permeate flux was determined by the overall reduction of the feed solution.
2.3. Types of Feed-Solutions and Experimental Conditions
To assess the VMD process, various types of feed solutions were used, such as deionized water, synthetic brackish water, ethanol binary solution, and products of fermentation of winemaking by-products for the recovery of bioethanol, as listed in Table 1. The synthetic brackish water solutions were prepared by dissolving ACS grade NaCl (Sigma–Aldrich Co., St. Louis, MO, USA) in deionized (Milli-Q, Merck Millipore, Burlington, MA, USA) water. The binary ethanol-water mixtures were prepared by dissolving denatured ethanol (Sigma–Aldrich Co., St. Louis, MO, USA) in deionized (Milli-Q) water.
2.4. Cleaning Procedure
After the MD tests, the experimental set-up was thoroughly rinsed with deionized (DI) water for 30 min. At the end of the fermented broth experiments, the equipment was cleaned with sodium hydroxide solution (10 g/L NaOH) for 15 min and then rinsed with deionized water until the rinsing water became neutral for about half an hour. This protocol, employed in previous studies [37,41], aimed to remove organic foulants from the membranes. After the cleaning procedure, the membrane module was dried with air or dinitrogen [40].
2.5. Analytical Methods
During the VMD tests, samples from the feed, the distillate, and the concentrate were collected. The conductivity was measured via a laboratory multi-parameter meter (inoLab 750 pH/ION/Cond multilab, WTW, Weilheim, Germany). The concentration of ethanol (% EtOH v/v) was analyzed with high-pressure liquid chromatography (HPLC, Agilent Technologies, Santa Clara, CA, USA) employing a Refractive Index Detector and Hi-Plex H, 300 × 7.7 mm column (Agilent Technologies). The membrane salt rejection R is given as [42]:
where Cp and Cf are the permeate and the feed conductivities, respectively.
The selectivity of the volatile component A from a mixture is given as follows [43]:
where wt. % A and wt. % Β are the mass fraction of component A and B, respectively.
3. Results
3.1. Deionized Water
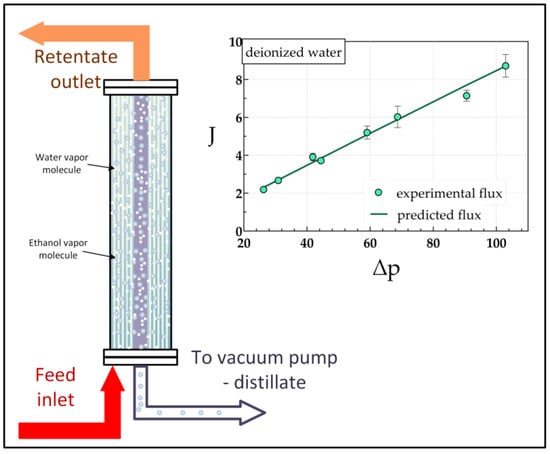
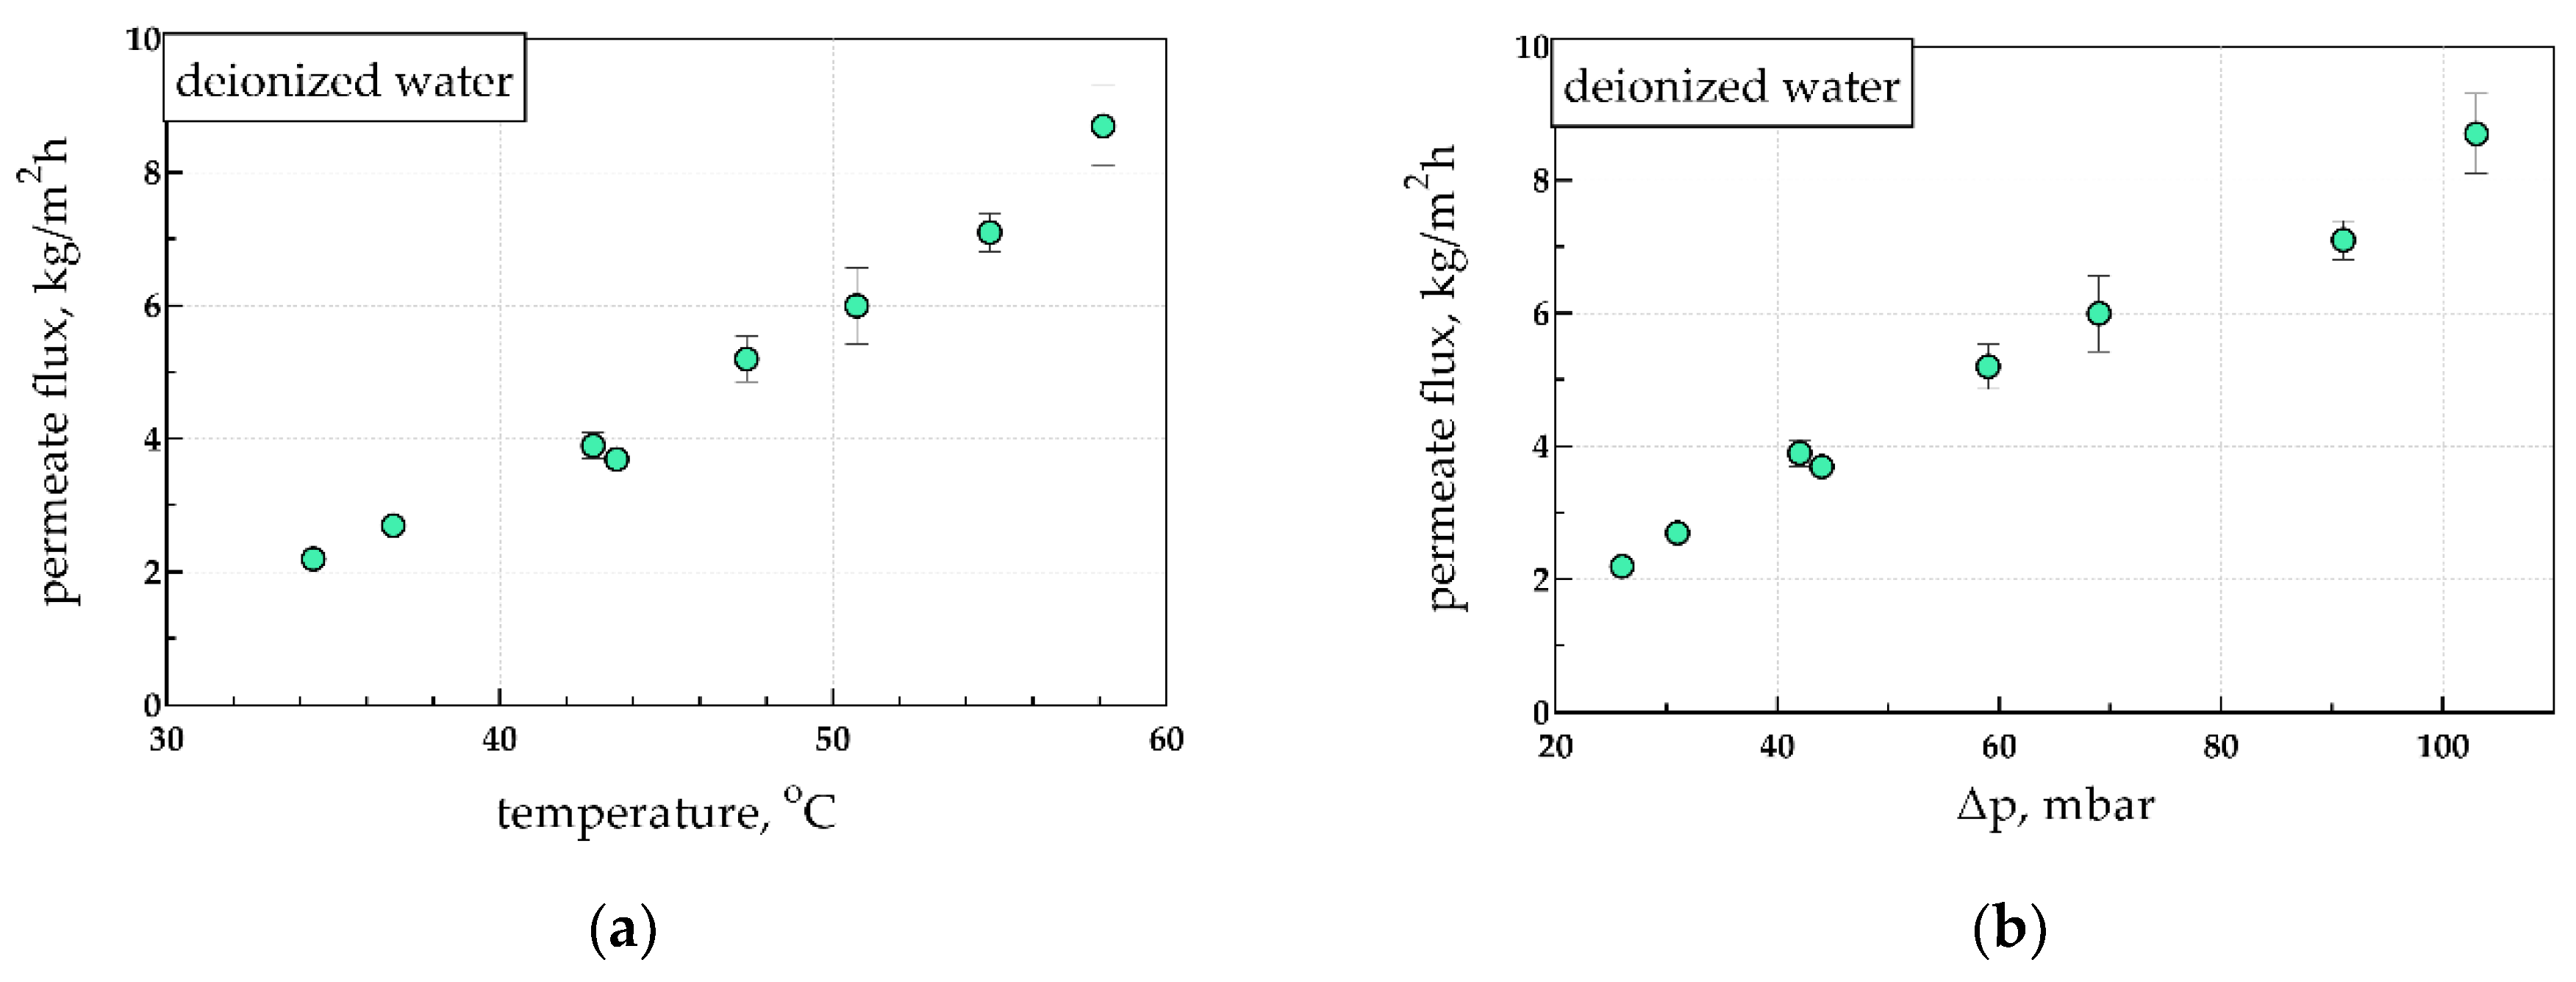
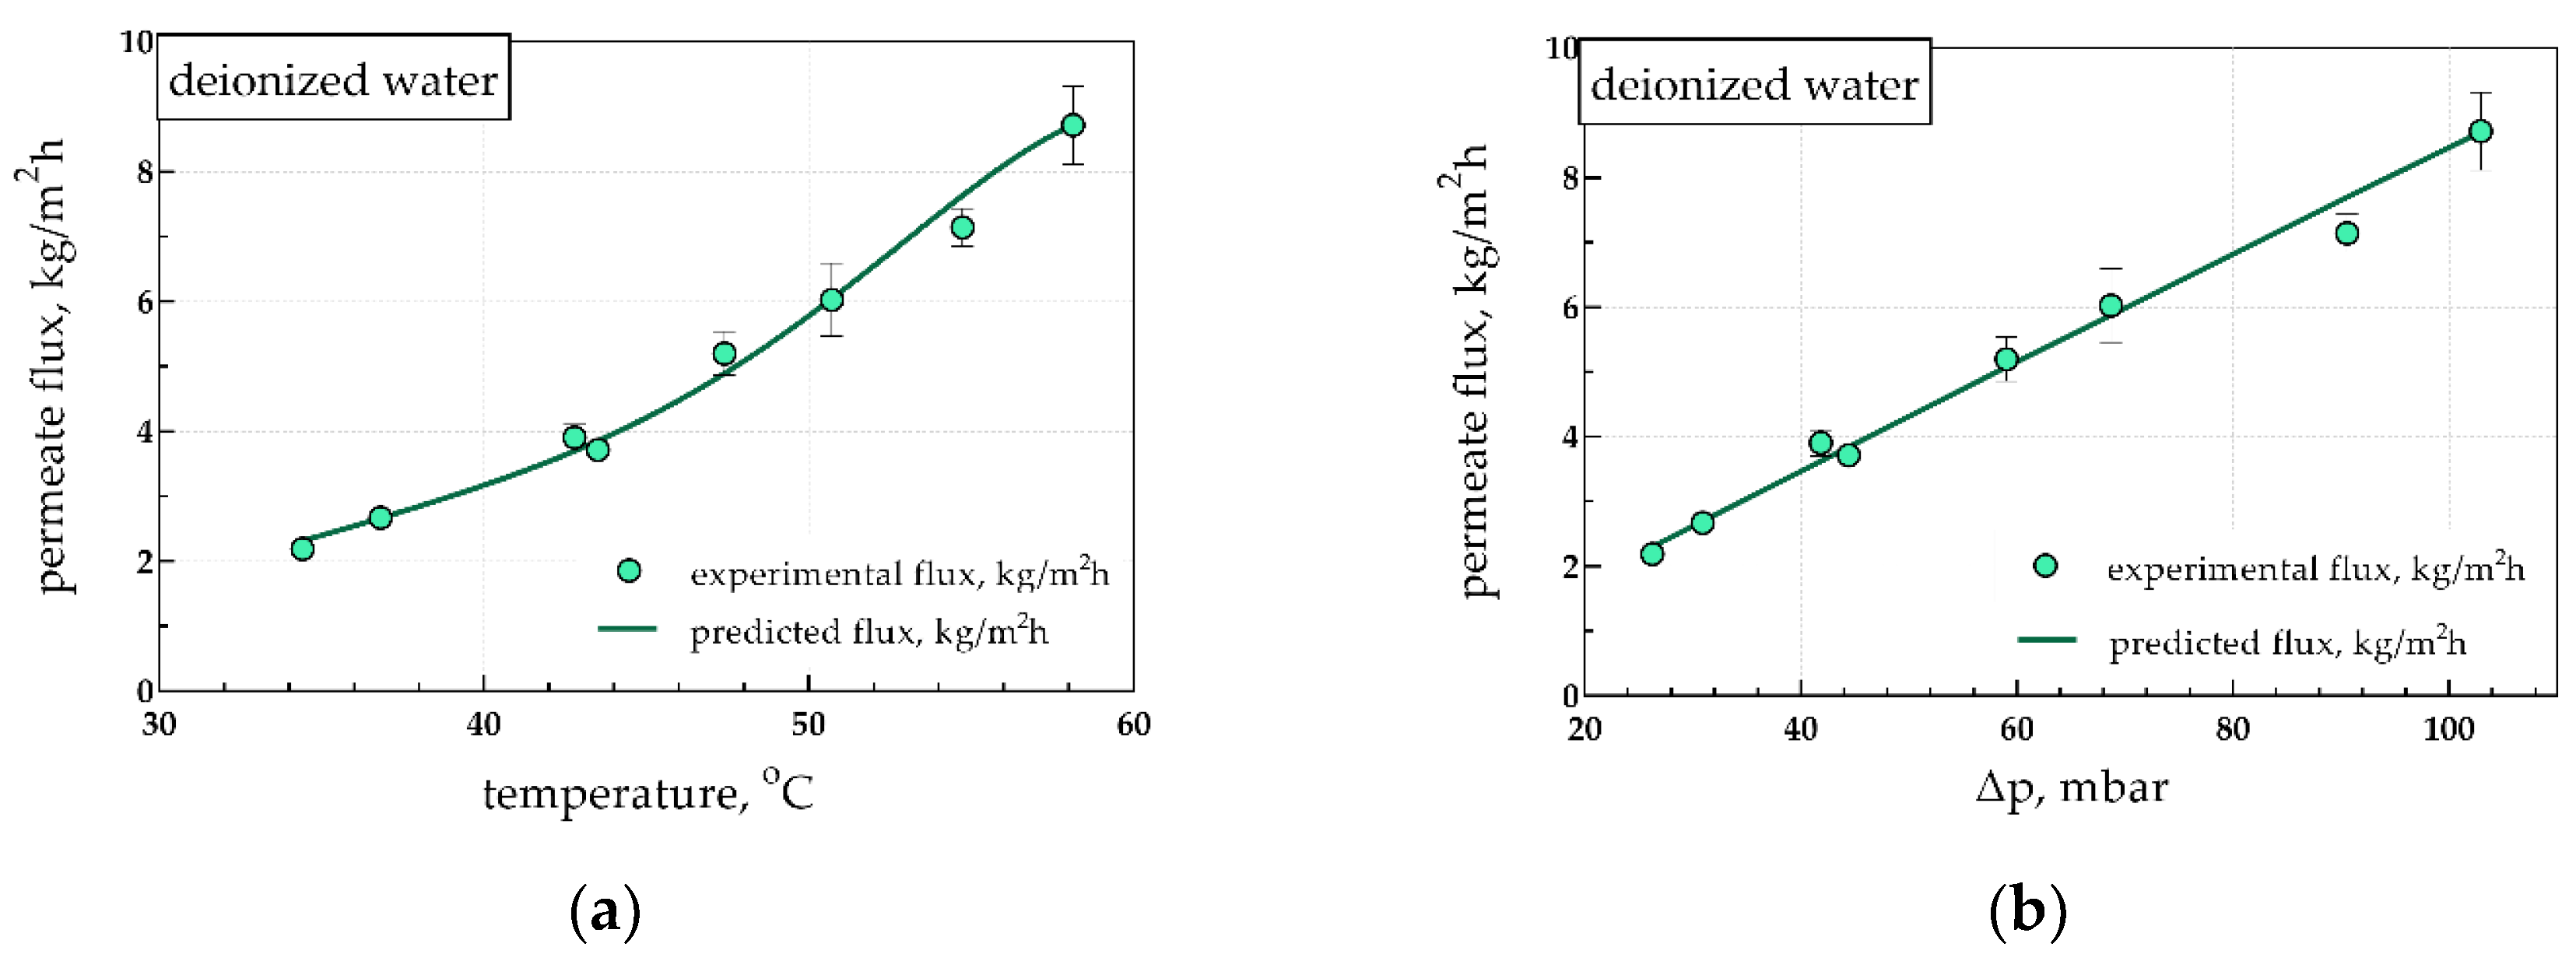
These experiments were conducted with the membrane module M2. Figure 4a depicts the distillate flux, in a steady state, as a function of the average temperature of the feed-water (i.e., the average inlet and outlet fluid temperature). As expected, the distillate flux expressed in kg/m2 h, increases with the feed temperature. In Figure A1 of the Appendix B, the variation of the permeate flux with the experiment time of a test with deionized water is observed; the average value at the steady state condition was used for data interpretation. At 34.4 °C, the flux was 2.2 kg/m2 h, increasing to 8.7 kg/m2 h for temperature 58.1 °C. In Figure 4b, the variation is plotted of the permeate flux versus the driving force (i.e., the difference of the applied vacuum minus the feed vapor pressure (Δp)). The vapor pressure of the feed solution was determined as in Reference [44].
3.2. Desalination
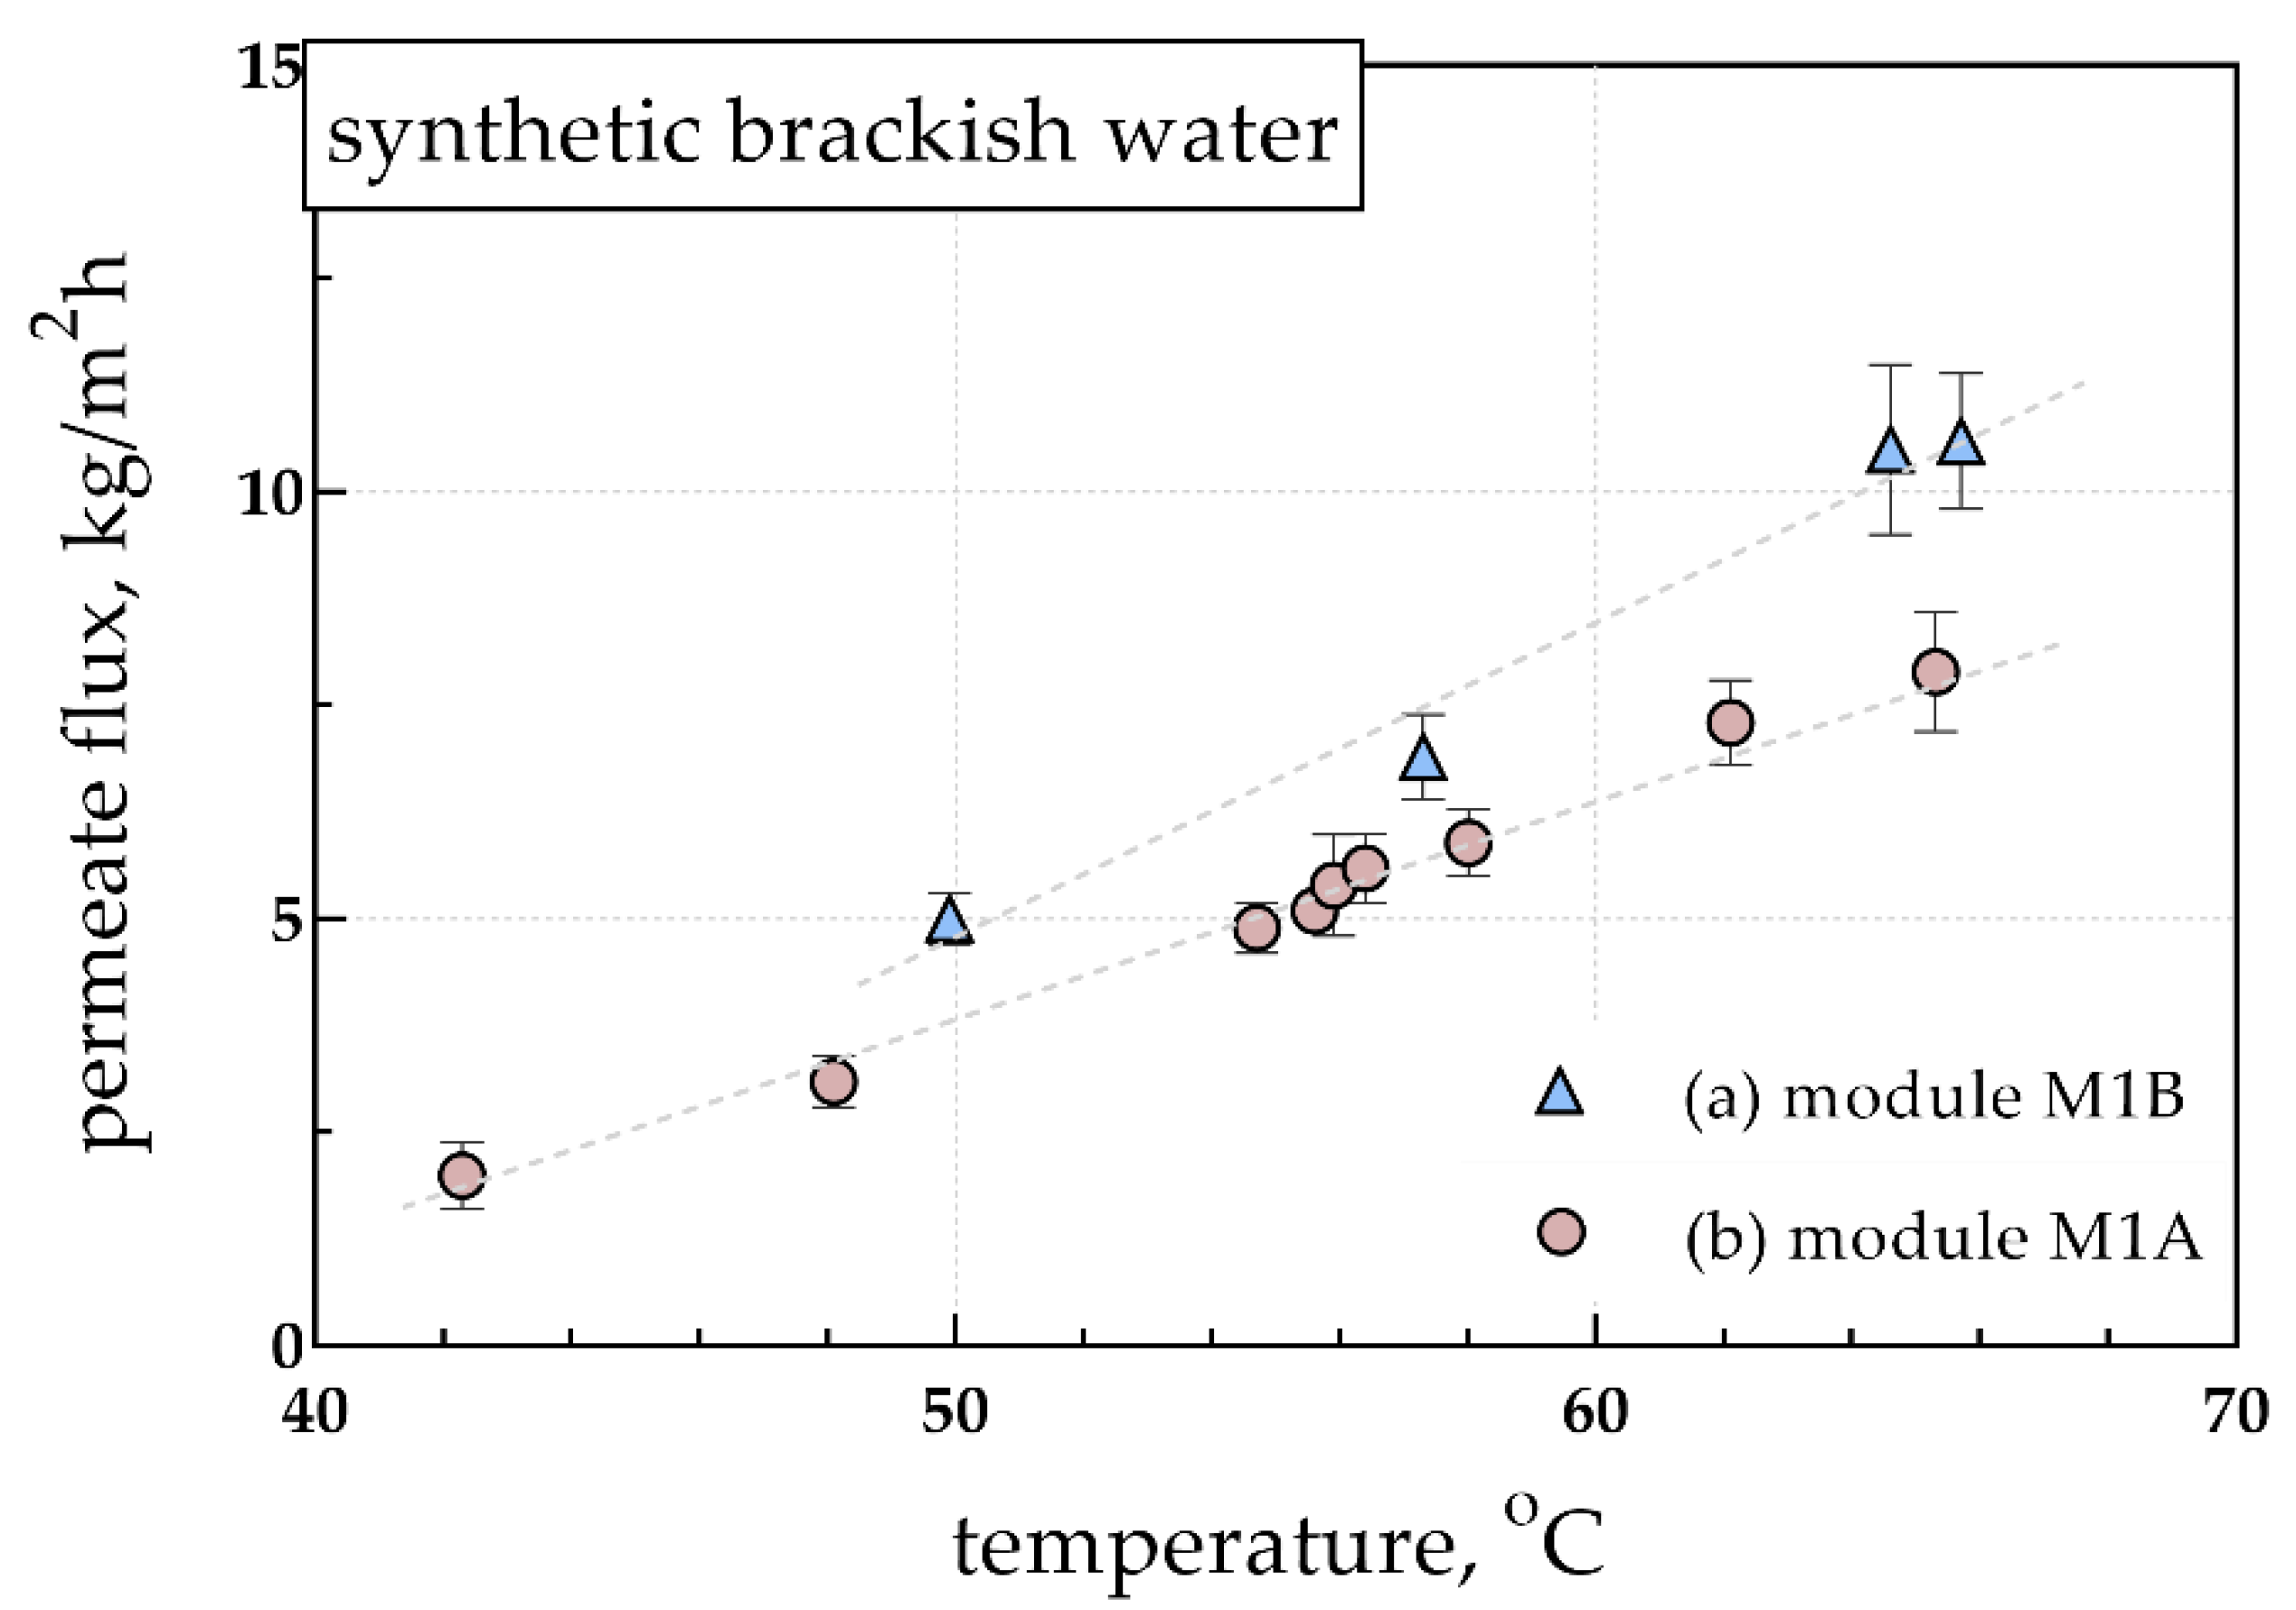
Desalination experiments were performed with a synthetic brackish water solution using the membrane module M1 (types M1A and M1B). In some experiments, the element with 44 fibers was utilized (i.e., with an active surface area 0.087 m2 (M1A)), while in other experiments, the element with 34 active fibers was used, having an active surface area 0.067 m2 (M1B).
In all experiments conducted, it was observed that the salt rejection (as calculated from the conductivity measurements) was very high (>99.8%), and almost complete removal of NaCl was achieved. Τhe high level of rejection indicates that the membrane performed well and was not wetted.
In Figure 5, the permeate flux is plotted for both types of experiments, with module M1A and module M1B. It is observed that the permeate flux increased with temperature and that the module with a smaller active area (M1B) performed better than the other (M1A).
3.3. Synthetic Ethanol-Water Solutions
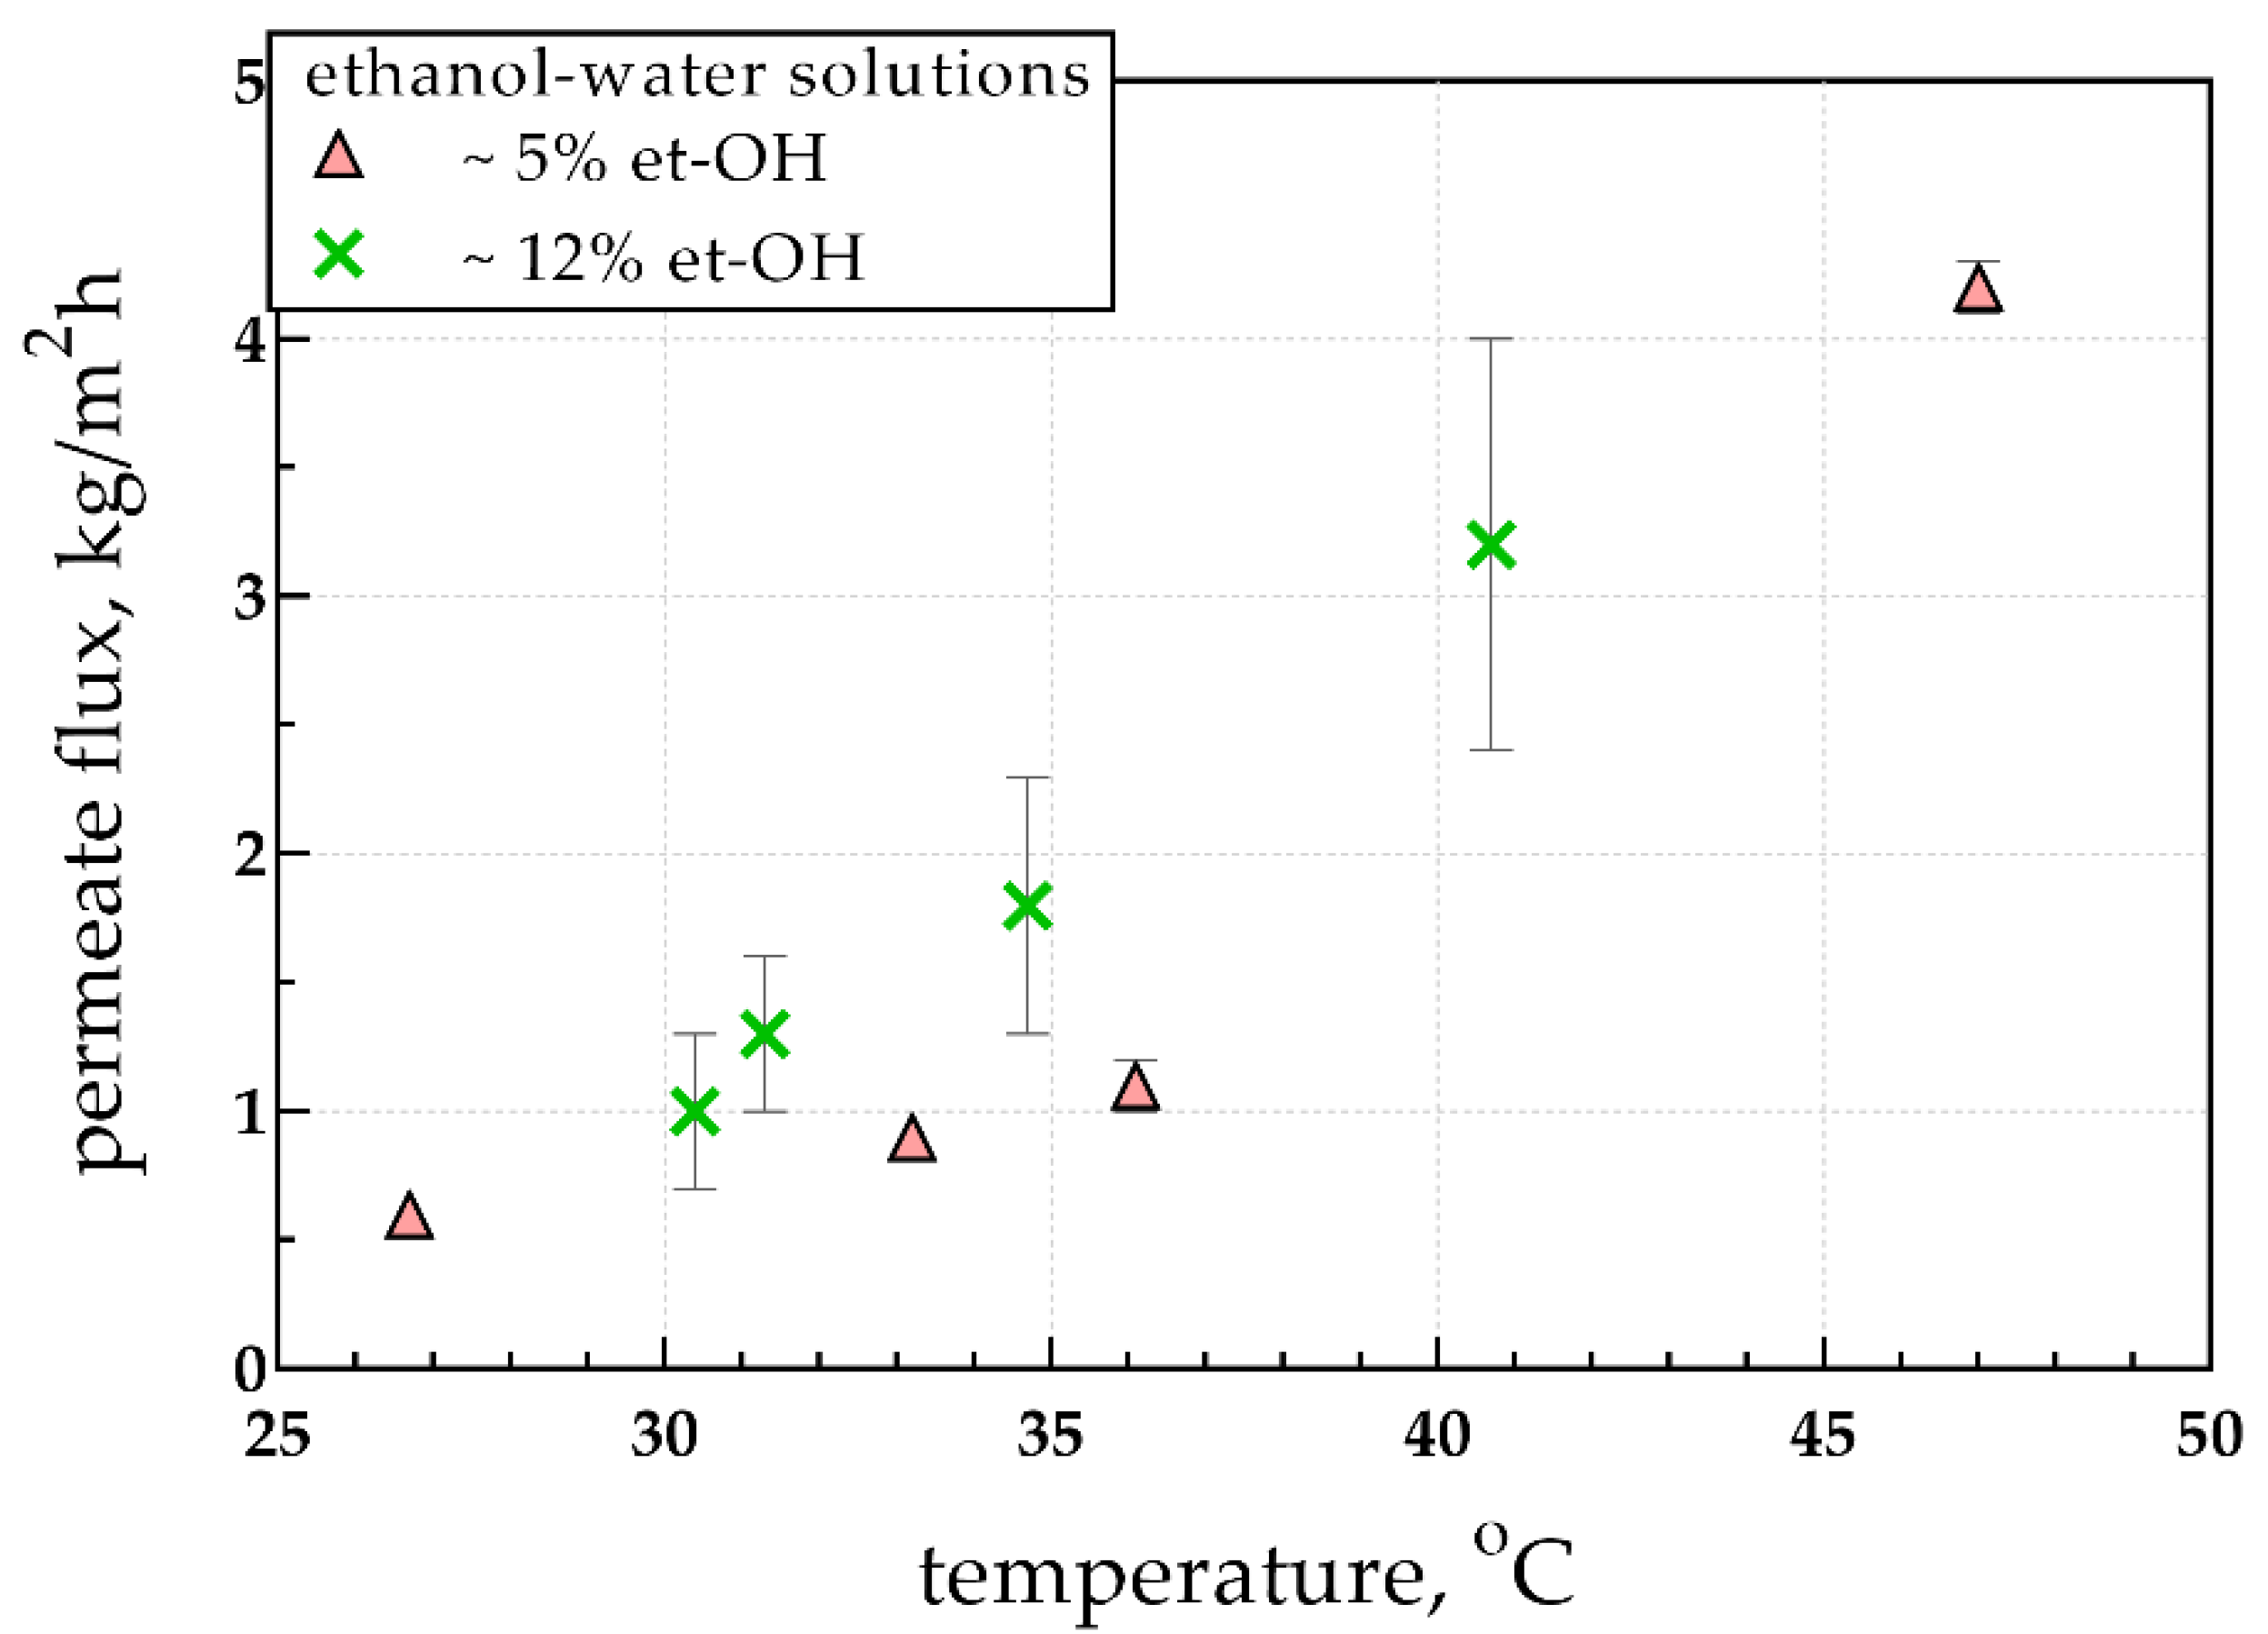
Binary mixtures of ethanol-deionized water were used to study the recovery of volatile components from mixtures. The experiments were conducted in a continuous mode of operation by filling the auxiliary vessel with a solution of higher concentration. Two types of feed solutions, of average ethanol concentrations 5.2% v/v and 12.3% v/v, were used. The experiments were carried out at various temperatures, considering the average inlet and outlet temperatures of the membrane element at steady state. The performance data of these tests are included in Table 2.
For solutions with an initial concentration of 5.2% v/v, an average ethanol concentration factor 5.6 was estimated, corresponding to 7.4 selectivity. However, the solutions with a higher initial concentration (12.3% v/v) exhibited a smaller concentration factor of ethanol (i.e., 4.1), but the selectivity remained at the same level (i.e., 6.7), with the ethanol concentration reaching the value 50% v/v in the distillate. As shown in Figure 6, the distillate flux increased with the feed temperature and ethanol concentration; in the case of 12.3% v/v ethanol feed, the flux was somewhat higher than in the case with 5.2% v/v ethanol feed, which is attributed to its higher vapor pressure. Despite the fact that the membrane area in the two types of experiments were different, the permeate flux was relatively close.
3.4. Fermented Broth Solutions
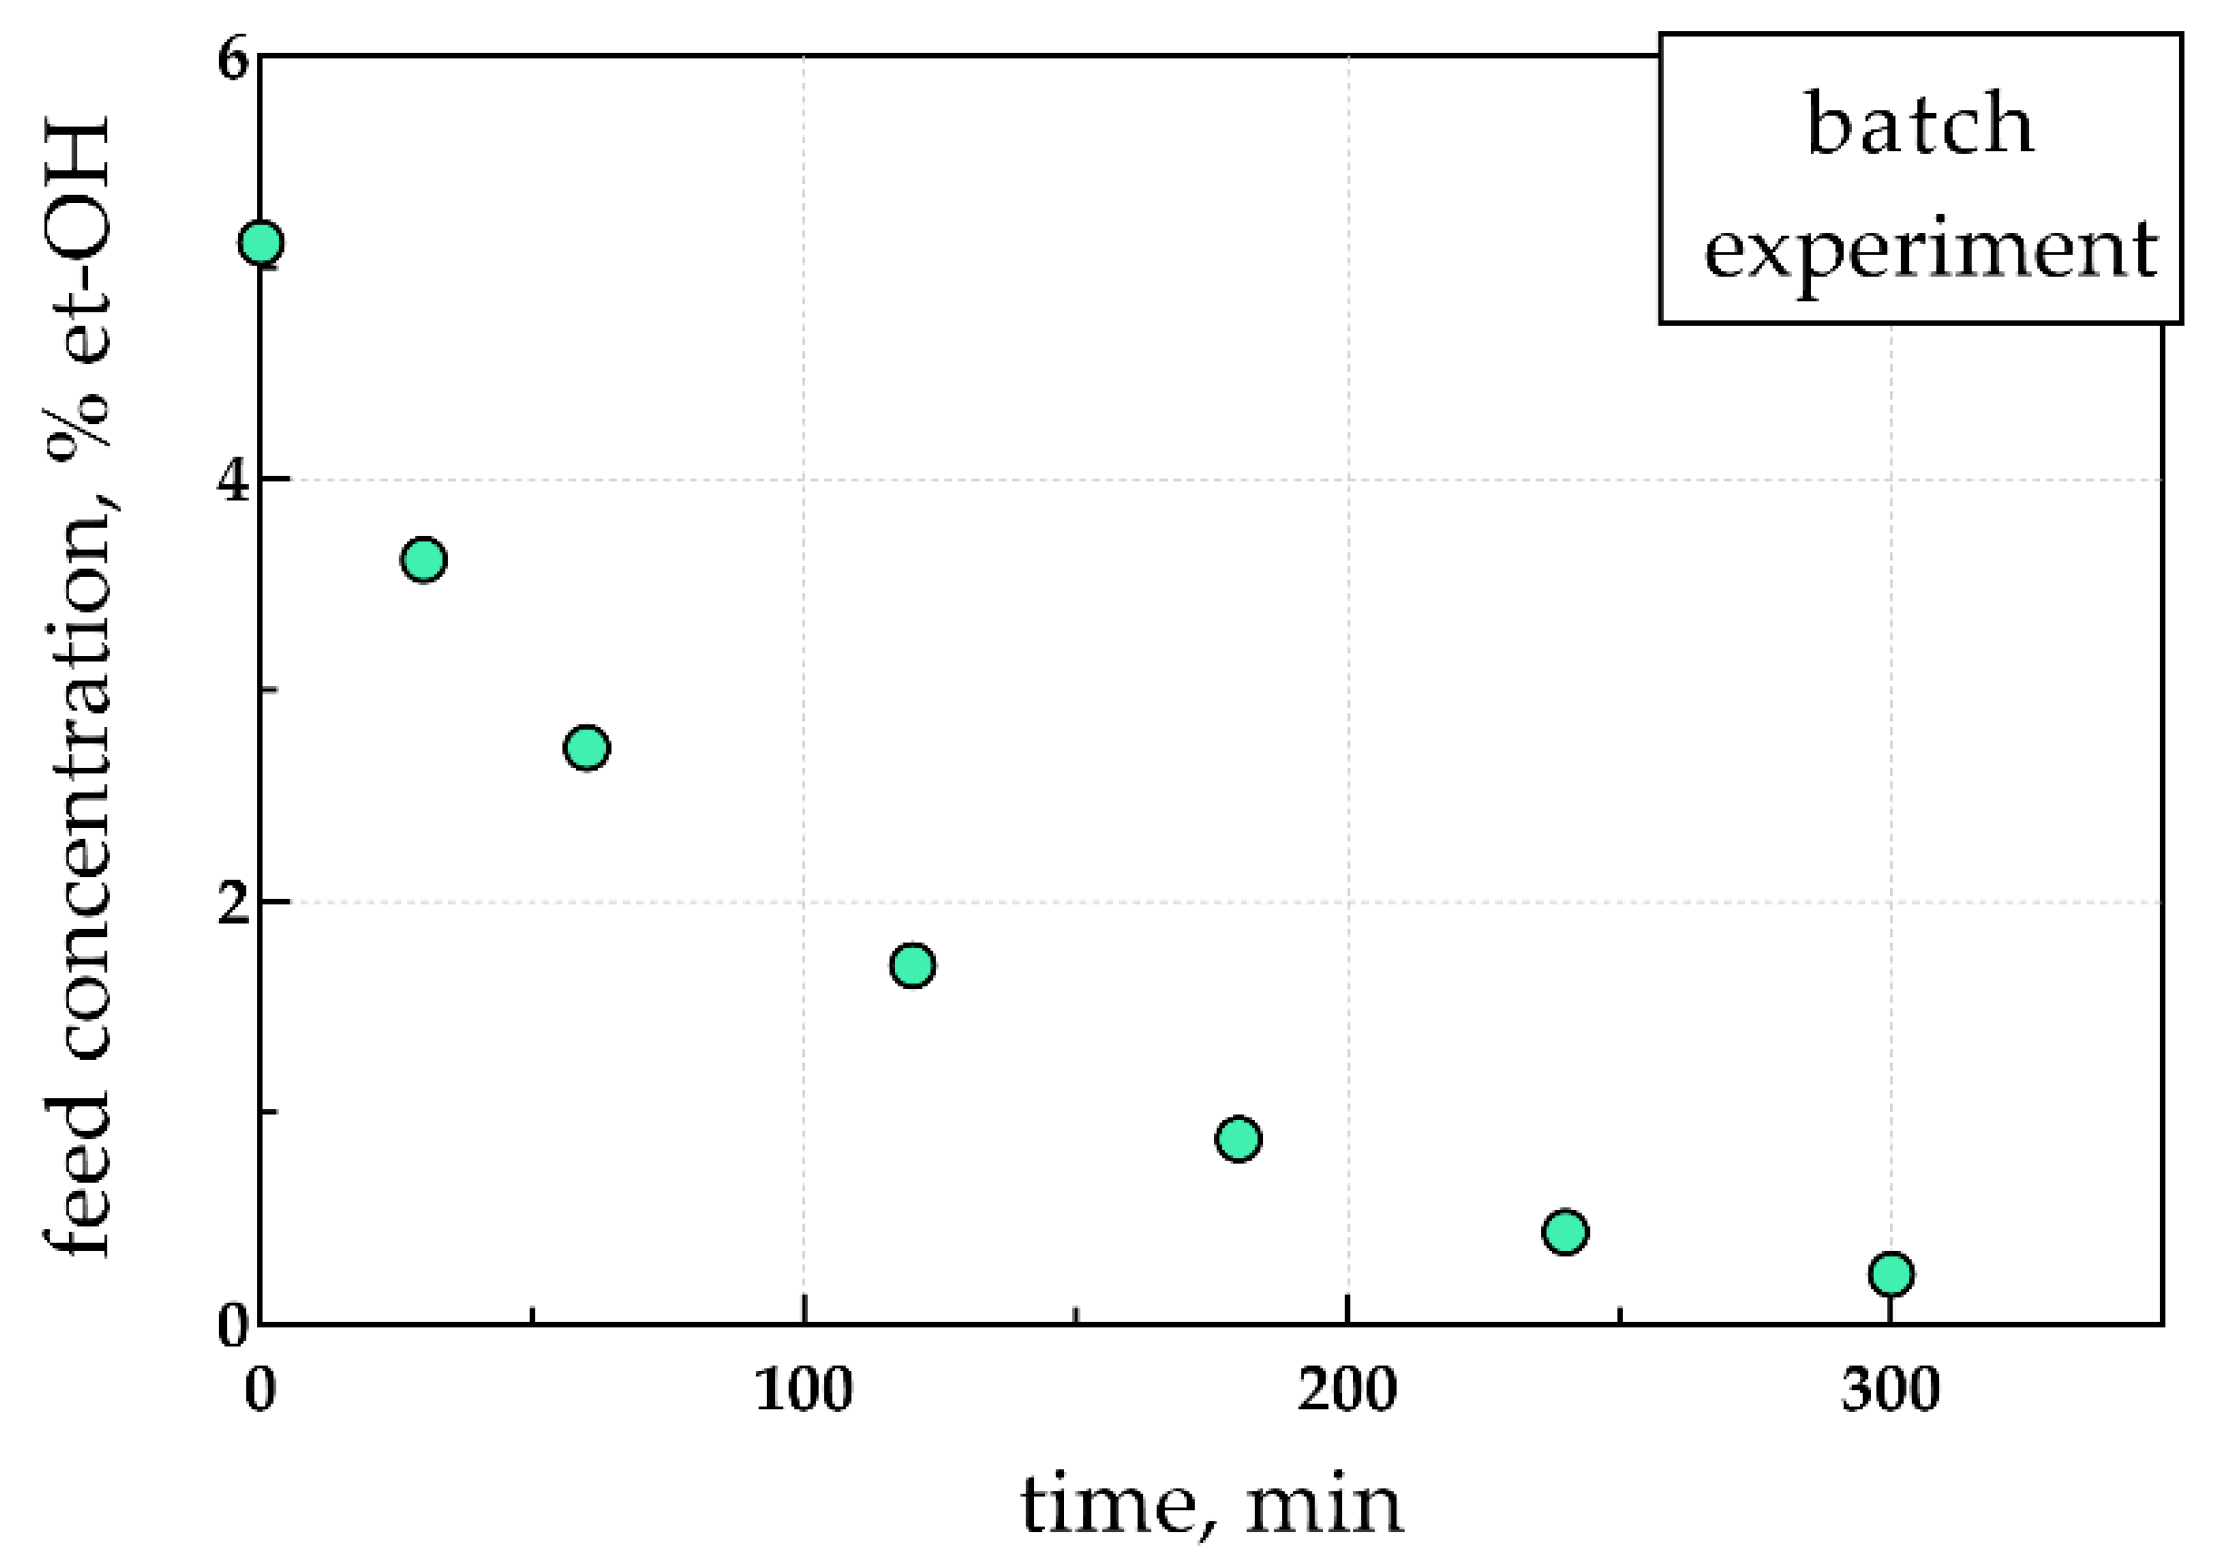
In the last series of experiments, bioethanol recovery from the fermentation products of winemaking by-products was studied. For the fermentation of the reducing sugars from winery by-products, a membrane bioreactor (MBR) with submerged ultrafiltration (UF) membranes was used. The final broth concentrations were in the range of 5.1 to 12.5% v/v. Two types of experiments were conducted: in a semi-continuous and a batch operation. In the batch experiment, the permeate flux was determined through the overall reduction of the feed solution. The performance data of the ethanol recovery from the fermented broth solutions are listed in Table 3. For all solutions used, a concentration factor in the range of 2.6 to 4.2 was observed. The degree of concentration of ethanol appeared to depend on the duration of distillation, as the concentration in the feed vessel was constantly decreasing. However, the selectivity of all the experiments was high, reaching the value of eight.
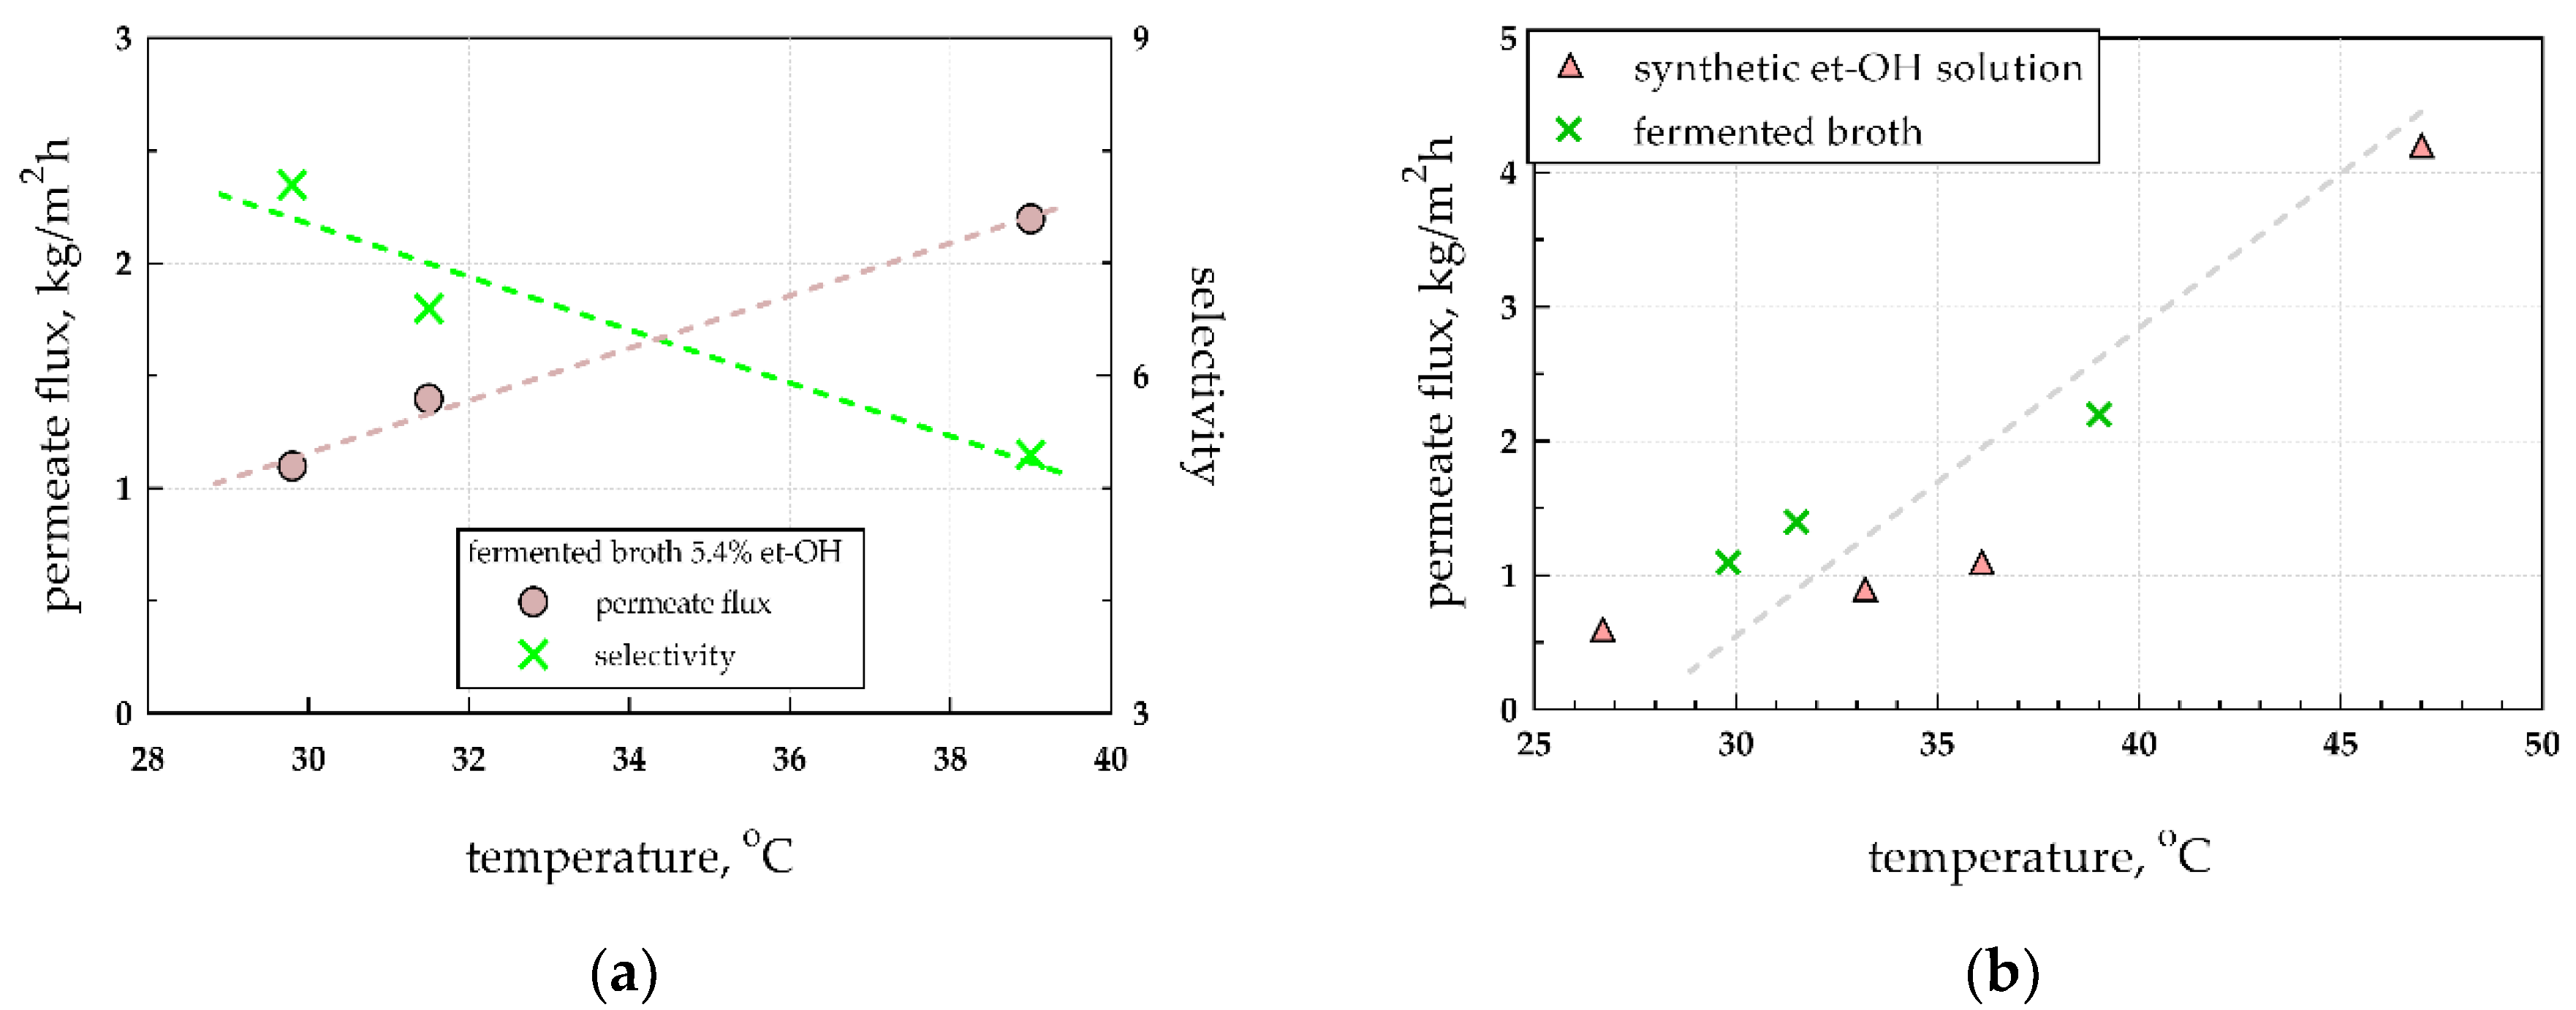
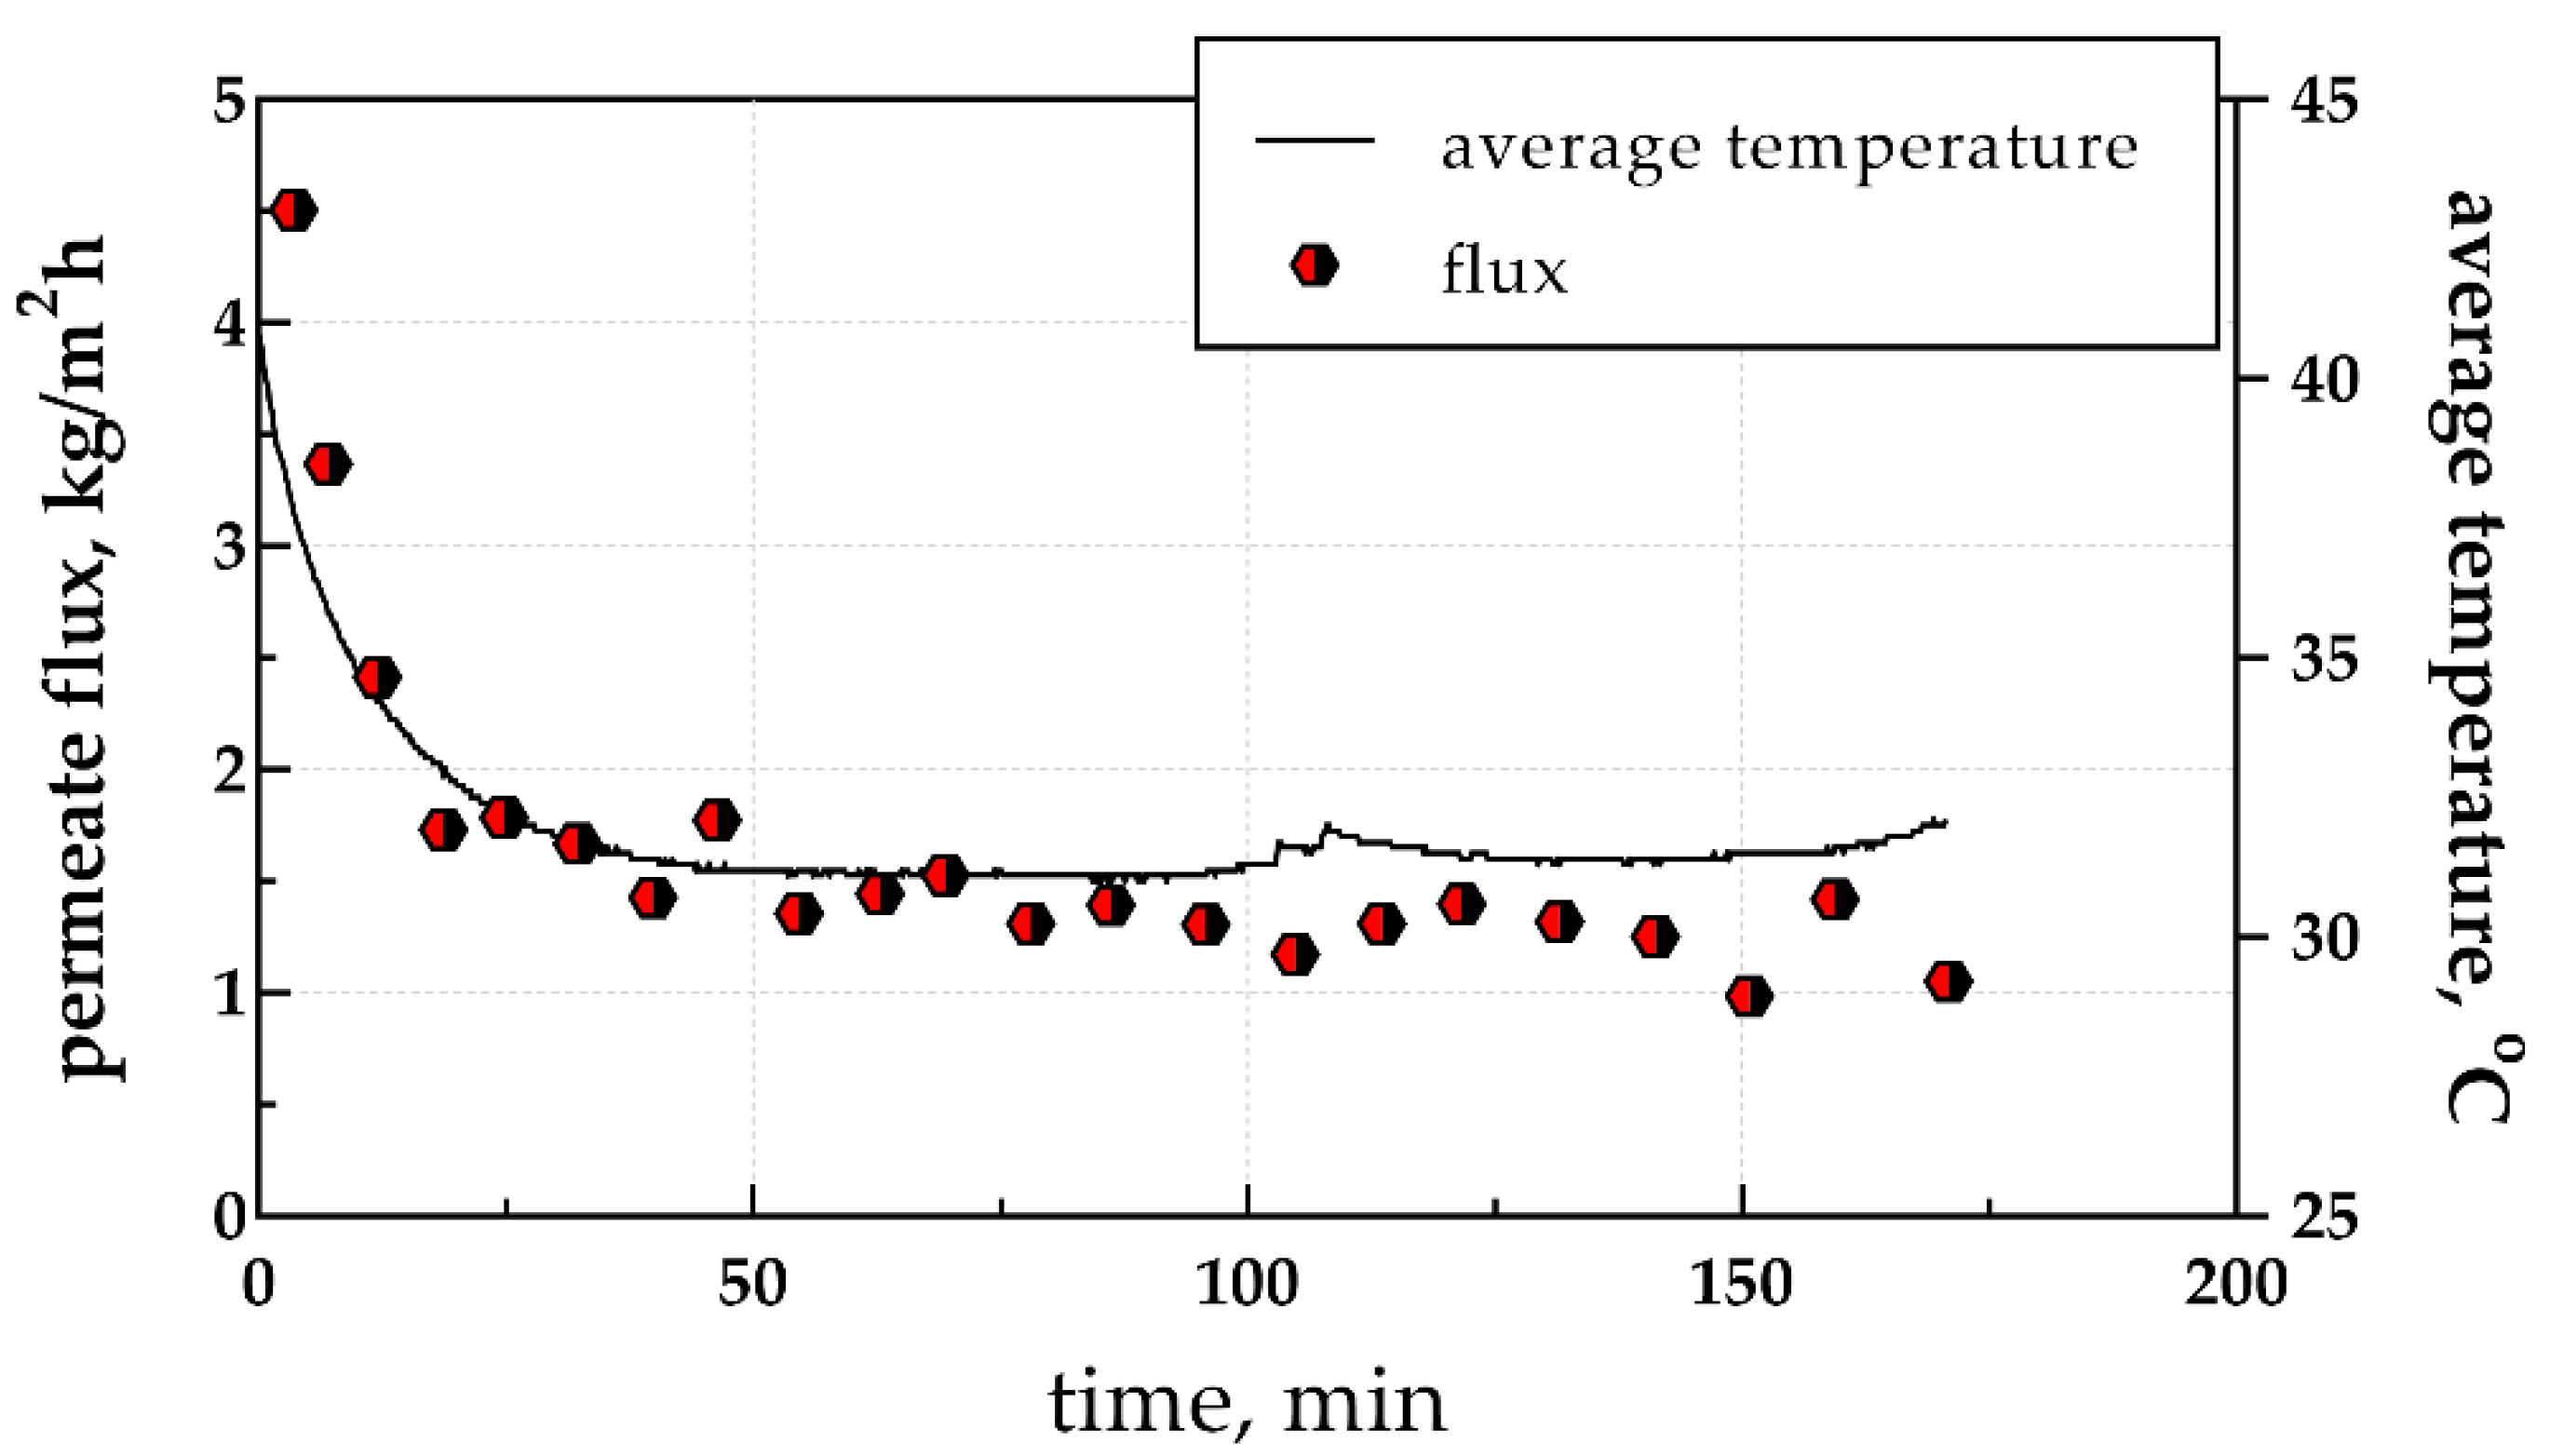
For the semi-continuous experiments, as shown in Figure A2 (Appendix B), after the system attained a nearly steady-state, a rather small flux reduction occurred thereafter, due to the reduction of the ethanol concentration inside the feed vessel. The permeate flux slightly increased relative to the cases where the feed had a lower initial concentration, which is attributed to the higher content of the feed in bioethanol. Increased feed temperature led to permeate flux increase and reduction of ethanol selectivity (Figure 7a). The reduction of the selectivity is attributed to the fact that the vapor pressure of water tends to increase with increasing temperature, and therefore greater quantities of water evaporate. Furthermore, in comparison with the ethanol-water experiments (Figure 7b), there were no substantial differences between the ethanol-water solution and the fermented broth solution regarding the flux variation as a function of the temperature. Therefore, the VMD system tested did not appear to be sensitive to the type of feed solution.
Figure 8 depicts the variation of ethanol concentration in the main feed vessel during the batch operation. The concentration reached an asymptote, which means that the removal of ethanol becomes more difficult as the concentration of ethanol in the feed vessel decreases. However, since the concentration of the final product was quite low, for the recovery of bioethanol at higher concentration, additional distillation/MD stages should be used. Therefore, a distillation experiment of the distillate resulting from the above experiments was carried out.
3.5. Distillate of the Fermented Broth
In this experiment, the concentrated distillate of the fermented broth was fed to the feed vessel having a concentration of 14% v/v ethanol. The auxiliary container was also filled with the same solution. The performance data of this experiment are summarized in Table 4.
It is noted that for solutions with an initial concentration close to 14% v/v, the concentration of ethanol is 3.4 times. In this case, the experiment lasted about an hour (i.e., far less than the previous experiments). The permeate flux was higher due to the elevated initial ethanol concentration, despite the fact that the temperature of the experiment was quite low (32 °C). In experiments under similar conditions, at a temperature of 32 °C, and for an initial concentration of ethanol of 5.7% v/v, the permeate flux was 1.4 kg/m2 h. This is because ethanol is more volatile than water, and therefore, for a feed at a higher concentration, the productivity of the distillation will increase.
4. Theoretical Analysis and Discussion
The experimental data for simple feed and continuous operation can be used to characterize the membrane through a simple mathematical model developed for data interpretation purposes. Mathematical modeling of the VMD process is much simpler than that of the other MD processes, since the conditions in the permeate channel are relatively easy to treat. In the small-dimension tubular module employed here, the flow field was laminar, which is also easier to model compared to flow fields with complicated geometries (e.g., spacer-filled membrane channels). The basic phenomenon in VMD is the liquid evaporation. This alters both the local concentration field on the membrane (i.e., uneven evaporation rate of the volatile species) and the local temperature field, where heat is released due to phase change. Additionally, evaporation leads to a transversely variable flow field in the tube, imposed by mass continuity. Consequently, the momentum, temperature, and species conservation equations must be solved in the two-dimensional cylindrical geometry of membrane module [7]. A first step of simplification is to reduce the dimensionality of the problem by developing cross-sectionally averaged conservation equations. In this respect, a closure is needed between the average cross-sectional properties (i.e., concentrations and temperatures) and the boundary (i.e., membranes surface) values that account for the evaporation rate. There are both concentration and temperature polarization issues in MD that adversely affect the process efficiency. The required closure for polarization is typically treated by using the film theory with the corresponding heat/mass transfer coefficients for laminar flow [15]. The resulting one-dimensional model is the one typically used in the literature to simulate the vacuum distillation process. In this particular case, further simplification is possible (as follows) by inspection of the experimental data:
- In all performed experiments, the reduction of the liquid mass along the flow was less than 1%, thus, it can be safely ignored for the purpose of experimental data analysis.
- In all experiments, the temperature difference between inlet and outlet flows never exceeded 5 °C. This means that the complete problem can be linearized around the average temperature along the flow. The linearization is certainly accurate for the required interval of only 2.5 °C (in the worst case). Then the temperature can be assumed to be uniform along the flow and equal to its average, which is calculated as the mean value of measured inlet and outlet temperatures. This approach is very accurate since the error is proportional to the second order of the Taylor expansion of the vapor pressure–temperature function which is very small for small values of ΔT.
- Regarding temperature polarization, the temperature difference between the cup-mixing temperature and the membrane surface temperature is given by JΔH/ht [45], where J is the evaporation flux, ΔH the evaporation enthalpy, and ht the heat transfer coefficient. It is noted that, in cases of more than one evaporating species, the numerator must be replaced by a sum over the species. A simple computation shows that this difference is of the order of 0.1 °C, thus, it can be ignored since the experimental error is certainly larger.
Regarding concentration polarization, the corresponding modulus is computed as exp(Jρ/hm), where hm is the mass transfer coefficient and ρ is the liquid density. A simple calculation shows that for the present experiments, it never exceeded 1.03, so it can be safely ignored.
The final issue to be addressed is the relation between conditions on the membrane surface and of the evaporation flux. The flow of vapor through the membrane pores can be dominated by the Knudsen mechanism (i.e., pore-vapor molecule collisions) or by the viscous (Poiseulle) flow mechanism (due to molecular collisions). In many cases, a combination of the two mechanisms (dusty gas model) is used [15]. The relative importance of the two mechanisms can be examined on the basis of the value of the ratio of molecular mean free path to pore diameter. For the membrane used here this ratio was significantly larger than unity, suggesting domination of the Knudsen mechanism. The evaporation mass flux in the case of pure water is given as [15]:
where mw is the water molecular weight, T is the average temperature, Pw is the water vapor pressure, Po is the vacuum (permeate) pressure, and K a parameter, designated as permeability, that depends on the membrane structure. Specifically, in terms of Knudsen flow theory [15], the parameter K is given as K = (2/3)(8/π)0.5εr/(δτRg0.5), where Rg is the ideal gas constant, δ the membrane thickness, r the average pore radius, ε the membrane porosity, and τ the membrane tortuosity. The value of K which represents very well the present data for pure water is 0.36 kg/(m2·h·mbar·K0.5). Comparison between predicted and experimental vapor flux data is shown in Figure 9. The fitting success is a confirmation that the Knudsen mechanism prevails, since for viscous flow the pressure dependence would be completely different. In the case of saline water, the only variation in the above equation is the multiplication of the vapor pressure by (1 − x), where x is the salt molar fraction in the feed. The salt concentration for the present experiments was too small to influence the evaporation rate, thus, Equation (4) was successfully applied to the brackish water data. The deviation between experimental and computed fluxes was smaller than 3%. The fluxes appear somewhat different in Figure 4 and Figure 5 due to differences in applied vacuum pressure.
To proceed from data analysis to predictive modeling, one should address the question what would be the flux for the particular membrane module for arbitrary feed mass flowrate F (but of the same order of magnitude as the experimental one), feed temperature Tin, salt molar fraction x, and vacuum pressure Po. Based on the preceding discussion, the model takes the form:
This model comprises a non-linear system of three algebraic differential equations. The different procedure in direct modeling, compared to the preceding data analysis, is that Tout is an output rather than an input variable.
One can now apply the integrated method to the system ethanol-water. The generalization here is that both feed substances in solution undergo evaporation, and the permeate is a binary vapor mixture, instead of a pure vapor. The small heat of evaporation of ethanol and the low evaporation fluxes lead to a temperature decrease along the flow approximately 1 °C; in this case, the data analysis and the predictive models essentially coincide. The only difference can be the input temperature used (i.e., average for data analysis, inlet for predictions). By denoting with x the ethanol molar fraction in the feed and with y the same fraction in permeate, the water and ethanol evaporation fluxes (assuming Knudsen regime flow) are given as:
where Pw and Pe are the water and ethanol vapor pressures, respectively, as functions of liquid composition and temperature. The molar weight of ethanol is denoted as me. If yw is the weight fraction of ethanol in permeate, then it can be written by employing Equations (8) and (9) as:
The closure is achieved by the following relation:
The only unknown in the system of Equations (10) and (11) is y. The above equations actually represent the mathematical model for conditions similar to those of the used membrane module, and in the particular range of feed concentrations and temperatures. Employing x and y to compute selectivity and comparing to the respective experimental data, leads to a maximum deviation of 4%. This result is significant, meaning that, despite the smaller mean molecular free path of ethanol compared to that of water, the membrane is in the Knudsen regime for ethanol as well. It appears that for the type of membranes used in this VMD module (with very small pores), a satisfactory membrane characterization can be obtained by performing only pure water MD experiments. Therefore, the membrane permeability K thus obtained can be employed to estimate the MD module performance for different feed types or to model more complicated operating systems of practical interest.
5. Conclusions
A shell-and-tube type module, comprised of capillary polypropylene membranes, was investigated for separations implementing the vacuum membrane distillation process. Employing a laboratory pilot system, based on this type of module, a variety of operating conditions and feed compositions of increasing complexity were tested (i.e., from pure water to fermented broth solutions). In all cases, the separation performance of the particular module was quite good, indicating its potential for larger-scale applications. A simplified model for the case of simple feed and continuous operation experiments was developed. Through this model it was found that the membrane can be characterized on the basis of pure water VMD experiments through a permeability-parameter K value. For the particular membrane and module type employed, the data clearly show that the Knudsen mechanism of vapor permeation prevailed in the VMD tests performed. Furthermore, using the predetermined permeability K value and adapting the model, a fair estimate of the membrane performance can be obtained, for any feed conditions within the range investigated. The present results suggest that the simple model and methodology developed in this work can be the basis for the design of complex separation units based on the particular VMD module-type employed here. Additional R&D work along these lines is necessary.
Author Contributions
A.K. (Anastasios Karabelas) and A.K. (Anthoula Karanasiou) conceived and designed the modules and the experiments; A.K. (Anthoula Karanasiou) performed the experiments; A.K. (Anthoula Karanasiou) and M.K. analyzed the data; M.K. developed the model; and all three authors wrote the paper.
Acknowledgments
This research has been partially funded by Project “Winery wastes exploitation for production of high added value products by environment-friendly technologies—WinWaPro”, Project No. 11 ΣΥΝ_2_1992, March 2013 to October 2015, co-funded by the Hellenic Republic and the European Union—European Regional Development Fund, in the context of the O.P. Competitiveness & Entrepreneurship (EPAN II). No funds were received for publishing in open access. The authors acknowledge with thanks, the contribution of A.L., expert technologist in the authors NRRE Laboratory at CPERI-CERTH, in the fabrication of the VMD pilot unit.
Conflicts of Interest
The authors declare no conflict of interest. The founding sponsors had no role in the design of the study; in the collection, analyses, or interpretation of data; in the writing of the manuscript, and in the decision to publish the results.
Appendix A

Table A1.
Characteristics of the hydrophobic membranes (Accurel® PP S6/2) and the membrane module.
| Membrane Chemical Composition | PP |
| membrane physical properties | |
| thickness | 450 μm ± 50 μm |
| inside diameter, din | 1800 μm ± 150 μm |
| nominal pore diameter, dp | 0.22 μm |
| maximum pore diameter | 0.6 μm |
| membrane porosity, εm | 73% |
| membrane performance characteristics | |
| bubble point (isopropyl alcohol, 23 °C) | 0.95 bar |
| transmembrane flow (isopropyl alcohol, 23 °C) | ≥2.1 mL/(min cm2 bar) |
| bacterial retension (brevundimonas diminuta) | ≥7 log reduction value |
| module characteristics | |
| M1 | Μ2 |
| mode of operation: inside out | Inside out |
| shell diameter: 40 mm | 40 mm |
| number of fibers: Μ1Α: 44, Μ1Β: 34 | 40 |
| fiber length: 350 mm | 350 mm |
| effective area (din): Μ1Α: 0.087 m2, M1B: 0.067 m2 | 0.079 m2 |
Appendix B
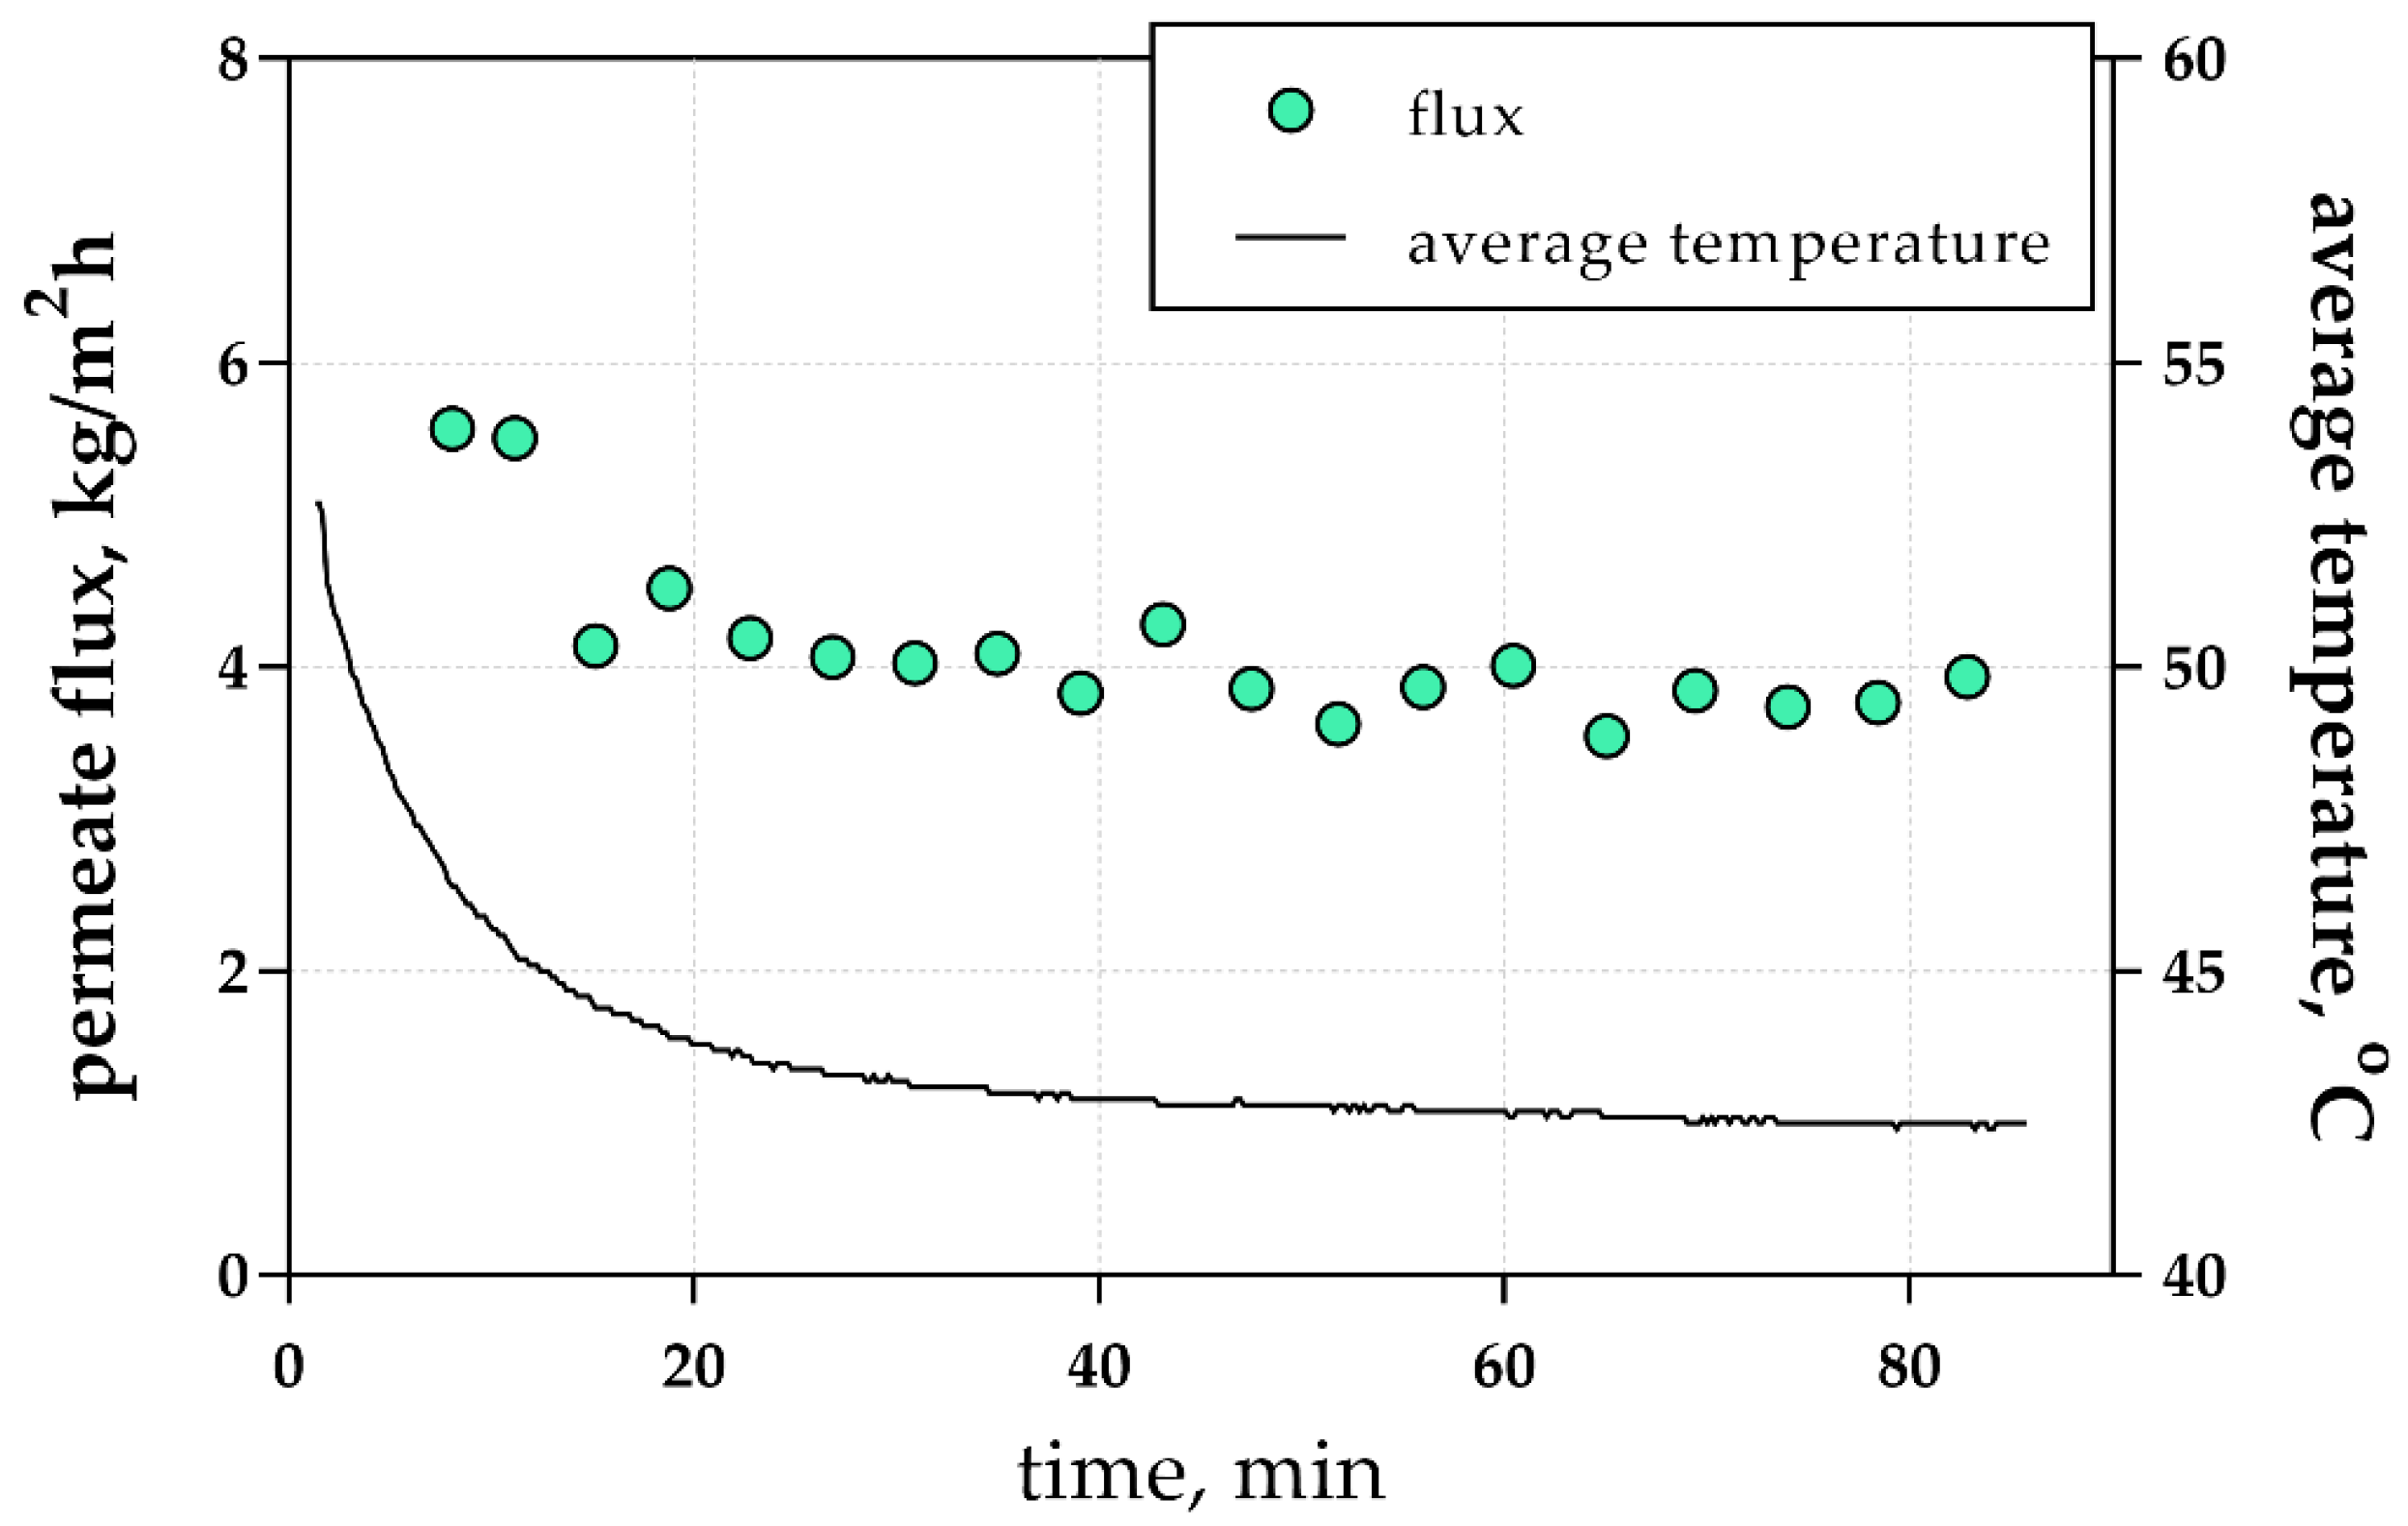
Figure A1.
Permeate flux and average feed temperature versus the experiment time. Test with deionized water.
Figure A1.
Permeate flux and average feed temperature versus the experiment time. Test with deionized water.

Figure A2.
Permeate flux and average feed temperature versus the experiment time. Test with fermented broth; semi-continuous mode.
Figure A2.
Permeate flux and average feed temperature versus the experiment time. Test with fermented broth; semi-continuous mode.

References
- Drioli, E.; Ali, A.; Macedonio, F. Membrane distillation: Recent developments and perspectives. Desalination 2015, 356, 56–84. [Google Scholar] [CrossRef]
- Alkhudhiri, A.; Darwish, N.; Hilal, N. Membrane distillation: A comprehensive review. Desalination 2012, 287, 2–18. [Google Scholar] [CrossRef]
- Khayet, M.; Matsuura, T. MD membrane modules. In Membrane Distillation; Elsevier: Amsterdam, The Netherlands, 2011; pp. 227–247, Chapter 9. [Google Scholar]
- Khayet, M.; Matsuura, T. Vacuum membrane distillation. In Membrane Distillation; Elsevier: Amsterdam, The Netherlands, 2011; pp. 323–359, Chapter 12. [Google Scholar]
- Abu-Zeid, M.A.E.-R.; Zhang, Y.; Dong, H.; Zhang, L.; Chen, H.-L.; Hou, L. A comprehensive review of vacuum membrane distillation technique. Desalination 2015, 356, 1–14. [Google Scholar] [CrossRef]
- Susanto, H. Towards practical implementations of membrane distillation. Chem. Eng. Process. Process Intensif. 2011, 50, 139–150. [Google Scholar] [CrossRef]
- Chiam, C.K.; Sarbatly, R. Vacuum membrane distillation processes for aqueous solution treatment—A review. Chem. Eng. Process. Process Intensif. 2013, 74, 27–54. [Google Scholar] [CrossRef]
- Singh, D.; Li, L.; Obusckovic, G.; Chau, J.; Sirkar, K.K. Novel cylindrical cross-flow hollow fiber membrane module for direct contact membrane distillation-based desalination. J. Membr. Sci. 2018, 545, 312–322. [Google Scholar] [CrossRef]
- Singh, D.; Sirkar, K.K. Performance of PVDF flat membranes and hollow fibers in desalination by direct contact membrane distillation at high temperatures. Sep. Purif. Technol. 2017, 187, 264–273. [Google Scholar] [CrossRef]
- González, D.; Amigo, J.; Suárez, F. Membrane distillation: Perspectives for sustainable and improved desalination. Renew. Sustain. Energy Rev. 2017, 80, 238–259. [Google Scholar] [CrossRef]
- Naidu, G.; Choi, Y.; Jeong, S.; Hwang, T.M.; Vigneswaran, S. Experiments and modeling of a vacuum membrane distillation for high saline water. J. Ind. Eng. Chem. 2014, 20, 2174–2183. [Google Scholar] [CrossRef]
- Zhang, H.; Liu, M.; Sun, D.; Li, B.; Li, P. Evaluation of commercial PTFE membranes for desalination of brine water through vacuum membrane distillation. Chem. Eng. Process. Process Intensif. 2016, 110, 52–63. [Google Scholar] [CrossRef]
- Mericq, J.P.; Laborie, S.; Cabassud, C. Vacuum membrane distillation of seawater reverse osmosis brines. Water Res. 2010, 44, 5260–5273. [Google Scholar] [CrossRef] [PubMed]
- Rom, A.; Strommer, M.; Friedl, A. Comparison of sweepgas and vacuum membrane distillation as in-situ separation of ethanol from aqueous solutions. Chem. Eng. Trans. 2014, 39, 985–990. [Google Scholar]
- Shi, J.Y.; Zhao, Z.P.; Zhu, C.Y. Studies on simulation and experiments of ethanol–water mixture separation by VMD using a PTFE flat membrane module. Sep. Purif. Technol. 2014, 123, 53–63. [Google Scholar] [CrossRef]
- Sarti, G.C.; Gostoli, C.; Bandini, S. Extraction of organic components from aqueous streams by vacuum membrane distillation. J. Membr. Sci. 1993, 80, 21–33. [Google Scholar] [CrossRef]
- Kujawski, W.; Kujawa, J.; Wierzbowska, E.; Cerneaux, S.; Bryjak, M.; Kujawski, J. Influence of hydrophobization conditions and ceramic membranes pore size on their properties in vacuum membrane distillation of water–organic solvent mixtures. J. Membr. Sci. 2016, 499, 442–451. [Google Scholar] [CrossRef]
- Urtiaga, A.M.; Ruiz, G.; Ortiz, I. Kinetic analysis of the vacuum membrane distillation of chloroform from aqueous solutions. J. Membr. Sci. 2000, 165, 99–110. [Google Scholar] [CrossRef]
- Bagger-Jørgensen, R.; Meyer, A.S.; Pinelo, M.; Varming, C.; Jonsson, G. Recovery of volatile fruit juice aroma compounds by membrane technology: Sweeping gas versus vacuum membrane distillation. Innov. Food Sci. Emerg. Technol. 2011, 12, 388–397. [Google Scholar] [CrossRef]
- Hasanoğlu, A.; Rebolledo, F.; Plaza, A.; Torres, A.; Romero, J. Effect of the operating variables on the extraction and recovery of aroma compounds in an osmotic distillation process coupled to a vacuum membrane distillation system. J. Food Eng. 2012, 111, 632–641. [Google Scholar] [CrossRef]
- Zhao, Z.P.; Ma, F.W.; Liu, W.-F.; Liu, D.Z. Concentration of ginseng extracts aqueous solution by vacuum membrane distillation. 1. Effects of operating conditions. Desalination 2008, 234, 152–157. [Google Scholar] [CrossRef]
- Zhao, Z.P.; Zhu, C.Y.; Liu, D.Z.; Liu, W.F. Concentration of ginseng extracts aqueous solution by vacuum membrane distillation 2. Theory analysis of critical operating conditions and experimental confirmation. Desalination 2011, 267, 147–153. [Google Scholar] [CrossRef]
- Jia, F.; Wang, J. Separation of cesium ions from aqueous solution by vacuum membrane distillation process. Prog. Nucl. Energy 2017, 98, 293–300. [Google Scholar] [CrossRef]
- Jia, F.; Li, J.; Wang, J.; Sun, Y. Removal of strontium ions from simulated radioactive wastewater by vacuum membrane distillation. Ann. Nucl. Energy 2017, 103, 363–368. [Google Scholar] [CrossRef]
- Plattner, J.; Naidu, G.; Wintgens, T.; Vigneswaran, S.; Kazner, C. Fluoride removal from groundwater using direct contact membrane distillation (DCMD) and vacuum enhanced DCMD (VEDCMD). Sep. Purif. Technol. 2017, 180, 125–132. [Google Scholar] [CrossRef]
- Dao, T.D.; Laborie, S.; Cabassud, C. Direct As(iii) removal from brackish groundwater by vacuum membrane distillation: Effect of organic matter and salts on membrane fouling. Sep. Purif. Technol. 2016, 157, 35–44. [Google Scholar] [CrossRef]
- Criscuoli, A.; Bafaro, P.; Drioli, E. Vacuum membrane distillation for purifying waters containing arsenic. Desalination 2013, 323, 17–21. [Google Scholar] [CrossRef]
- Peydayesh, M.; Kazemi, P.; Bandegi, A.; Mohammadi, T.; Bakhtiari, O. Treatment of bentazon herbicide solutions by vacuum membrane distillation. J. Water Process Eng. 2015, 8, e17–e22. [Google Scholar] [CrossRef]
- Carnevale, M.C.; Gnisci, E.; Hilal, J.; Criscuoli, A. Direct contact and vacuum membrane distillation application for the olive mill wastewater treatment. Sep. Purif. Technol. 2016, 169, 121–127. [Google Scholar] [CrossRef]
- Sivakumar, M.; Ramezanianpour, M.; O’Halloran, G. Mine water treatment using a vacuum membrane distillation system. APCBEE Procedia 2013, 5, 157–162. [Google Scholar] [CrossRef]
- Zhang, X.; Guo, Z.; Zhang, C.; Luan, J. Exploration and optimization of two-stage vacuum membrane distillation process for the treatment of saline wastewater produced by natural gas exploitation. Desalination 2016, 385, 117–125. [Google Scholar] [CrossRef]
- Criscuoli, A.; Zhong, J.; Figoli, A.; Carnevale, M.C.; Huang, R.; Drioli, E. Treatment of dye solutions by vacuum membrane distillation. Water Res. 2008, 42, 5031–5037. [Google Scholar] [CrossRef] [PubMed]
- Gryta, M.; Markowska-Szczupak, A.; Bastrzyk, J.; Tomczak, W. The study of membrane distillation used for separation of fermenting glycerol solutions. J. Membr. Sci. 2013, 431, 1–8. [Google Scholar] [CrossRef]
- Tomaszewska, M.; Białończyk, L. Production of ethanol from lactose in a bioreactor integrated with membrane distillation. Desalination 2013, 323, 114–119. [Google Scholar] [CrossRef]
- Gryta, M.; Barancewicz, M. Separation of volatile compounds from fermentation broth by membrane distillation. Pol. J. Chem. Technol. 2011, 13, 56–60. [Google Scholar] [CrossRef] [Green Version]
- Tomaszewska, M.; Białończyk, L. The investigation of ethanol separation by the membrane distillation process. Pol. J. Chem. Technol. 2011, 13, 66–69. [Google Scholar] [CrossRef] [Green Version]
- Lewandowicz, G.; Białas, W.; Marczewski, B.; Szymanowska, D. Application of membrane distillation for ethanol recovery during fuel ethanol production. J. Membr. Sci. 2011, 375, 212–219. [Google Scholar] [CrossRef]
- Gryta, M. The fermentation process integrated with membrane distillation. Sep. Purif. Technol. 2001, 24, 283–296. [Google Scholar] [CrossRef]
- Gryta, M.; Morawski, A.W.; Tomaszewska, M. Ethanol production in membrane distillation bioreactor. Catal. Today 2000, 56, 159–165. [Google Scholar] [CrossRef]
- Gryta, M. Influence of polypropylene membrane surface porosity on the performance of membrane distillation process. J. Membr. Sci. 2007, 287, 67–78. [Google Scholar] [CrossRef]
- Barancewicz, M.; Gryta, M. Ethanol production in a bioreactor with an integrated membrane distillation module. Chem. Pap. 2012, 66, 85–91. [Google Scholar] [CrossRef]
- Mulder, M. Basic Principles of Membrane Technology; Kluwer Academic Publishers: Dordrecht, The Netherlands, 1990. [Google Scholar]
- Smolders, K.; Franken, A.C.M. Terminology for membrane distillation. Desalination 1989, 72, 249–262. [Google Scholar] [CrossRef]
- Poling, B.E.; Thompson, G.H.; Friend, D.G.; Rowley, R.L.; Wilding, W.V. Vapor pressures of pure substances. In Perry’s Chemical Engineers’ Handbook, 8th ed.; Green, D.W., Perry, R.H., Eds.; McGraw Hill Professional, Access Engineering: New York, NY, USA, 2008. [Google Scholar]
- Bandini, S.; Sarti, G.C. Heat and mass transport resistances in vacuum membrane distillation per drop. AIChE J. 1999, 45, 1422–1433. [Google Scholar] [CrossRef]
Figure 1.
Membrane distillation (MD) principle.

Figure 2.
(a) A view of M1 custom-made vacuum membrane distillation (VMD) module; (b) a cross-sectional view of M2 VMD module.
Figure 2.
(a) A view of M1 custom-made vacuum membrane distillation (VMD) module; (b) a cross-sectional view of M2 VMD module.

Figure 3.
Experimental set-up: (a) flow diagram and (b) frontal view.

Figure 4.
Permeate flux versus: (a) the feed solution temperature, and (b) the driving force (vapor pressure-applied vacuum). Data from deionized water distillation.
Figure 4.
Permeate flux versus: (a) the feed solution temperature, and (b) the driving force (vapor pressure-applied vacuum). Data from deionized water distillation.

Figure 5.
Permeate flux versus the feed solution temperature for the desalination of synthetic brackish water. Effective membrane area (a) module M1B, 0.067 m2, and (b) module M1A, 0.087 m2.
Figure 5.
Permeate flux versus the feed solution temperature for the desalination of synthetic brackish water. Effective membrane area (a) module M1B, 0.067 m2, and (b) module M1A, 0.087 m2.

Figure 6.
Permeate flux versus the feed solution temperature for ethanol-water mixtures distillation.
Figure 6.
Permeate flux versus the feed solution temperature for ethanol-water mixtures distillation.

Figure 7.
(a) Permeate flux and selectivity versus the feed solution temperature for fermented broth solutions; average ethanol concentration 5.4% v/v; and (b) comparison of synthetic ethanol solutions and fermented broth solutions.
Figure 7.
(a) Permeate flux and selectivity versus the feed solution temperature for fermented broth solutions; average ethanol concentration 5.4% v/v; and (b) comparison of synthetic ethanol solutions and fermented broth solutions.

Figure 8.
Time variation of ethanol concentration in the main feed tank for the batch operation.

Figure 9.
Comparison between values predicted by the model and experimental vapor flux data. Permeate flux versus: (a) the feed solution temperature, and (b) the driving force (vapor pressure-applied vacuum). Data from deionized water distillation.
Figure 9.
Comparison between values predicted by the model and experimental vapor flux data. Permeate flux versus: (a) the feed solution temperature, and (b) the driving force (vapor pressure-applied vacuum). Data from deionized water distillation.

Table 1.
Types of feed solutions and experimental conditions.
| Feed Solution | Average Concentration | Type of Module | Cross Flow Velocity | Temperature | Vacuum, Mbar | Mode |
|---|---|---|---|---|---|---|
| Deionized water | - | M2 | 0.2 m/s | 34.4–58.1 °C | 28–50 | Continuous |
| Synthetic brackish water | 3000 mg/L NaCl eC = 5733 ± 155 μS/cm | M1A M1B | 0.2 m/s | 42.3–65.7 °C | 60–130 | Continuous |
| Ethanol-water mixtures | 5.2 ± 0.5% v/v 12.3 ± 1.6% v/v | M1B M1A | 0.2 m/s | 26.7–47.0 °C 30.4–40.7 °C | 62–114 | Continuous |
| Fermented broth + UF 1 | 5.4 ± 0.5% v/v | M1B | 0.2 m/s | 29.3–38.2 °C | - | Semi-continuous |
| Fermented broth + UF | 6.5 ± 0.5% v/v | M1B | 0.2 m/s | 33.0 °C | - | Batch |
| Fermented broth + UF + NF 2 | 5.1 ± 0.5% v/v | M1B | 0.2 m/s | 36.1 °C | - | Batch |
| Fermented broth + UF | 12.5 ± 1% v/v | Μ1Α | 0.2 m/s | 34.0 °C | 65–122 | Semi-continuous |
| Fermented broth + UF + NF | 10.5 ± 1% v/v | Μ1Α | 0.2 m/s | 31.0 °C | - | Semi-continuous |
| Distillate | 14.0 ± 1% v/v | Μ1Α | 0.1 m/s | 32.0 °C | - | Semi-continuous |
Note: 1 UF: Ultrafiltration, 2 NF: Nanofiltration.
Table 2.
Conditions and performance data of the ethanol concentration tests.
| Average Feed Concentration, % v/v | Average Temperature Range, °C | Average Distillate Concentration, % v/v | Selectivity | Concentration Factor | Flux, kg/m2 h |
|---|---|---|---|---|---|
| 5.2 | 26.7−47.0 | 29.3 ± 3.3 | 7.4 ± 1.0 | 5.6 ± 0.6 | 0.6−1.7 |
| 12.3 | 30.4−40.7 | 49.4 ± 3.8 | 6.7 ± 0.7 | 4.1 ± 0.4 | 1.0−3.2 |
Table 3.
Performance data for the recovery of ethanol from fermented broth solutions.
| Feed Solution | Mode | Feed Concentration, % v/v | Temperature, °C | Flux, kg/m2 h | Concentration Factor | Selectivity |
|---|---|---|---|---|---|---|
| Broth Fermented in MBR 1 | Semi-continuous | 5.4 | 29.3–38.2 | 1.2–2.1 | 2.9–4.2 | 5.3–7.7 |
| Broth Fermented in MBR | Batch | 6.5 | 33.0 ± 0.5 | 1.7 | 2.6 | 5.5 |
| Broth Fermented in MBR + NF | Batch | 5.1 | 36.5 ± 3.5 | 1.3 | 3.4 | 4.2 |
| Fermented Broth + UF | Semi-continuous | 12.5 | 34.0 ± 0.3 | 1.9 | 3.4 | 6.7 |
| Fermented Broth + UF + NF | Semi-continuous | 10.5 | 31 | 0.5 | 3.8 | 8 |
Note: 1 MBR: Membrane bioreactor.
Table 4.
Performance data of the recovery of ethanol from the distillate.
| Feed Solution | Mode | Feed Concentration, % v/v | Temperature, °C | Flux, kg/m2 h | Concentration Factor | Selectivity |
|---|---|---|---|---|---|---|
| Distillate | Semi-continuous | 14 | 33 | 1.7 | 3.4 | 6 |
© 2018 by the authors. Licensee MDPI, Basel, Switzerland. This article is an open access article distributed under the terms and conditions of the Creative Commons Attribution (CC BY) license (http://creativecommons.org/licenses/by/4.0/).
Share and Cite
MDPI and ACS Style
Karanasiou, A.; Kostoglou, M.; Karabelas, A. An Experimental and Theoretical Study on Separations by Vacuum Membrane Distillation Employing Hollow-Fiber Modules. Water 2018, 10, 947. https://doi.org/10.3390/w10070947
AMA Style
Karanasiou A, Kostoglou M, Karabelas A. An Experimental and Theoretical Study on Separations by Vacuum Membrane Distillation Employing Hollow-Fiber Modules. Water. 2018; 10(7):947. https://doi.org/10.3390/w10070947
Chicago/Turabian StyleKaranasiou, Anthoula, Margaritis Kostoglou, and Anastasios Karabelas. 2018. "An Experimental and Theoretical Study on Separations by Vacuum Membrane Distillation Employing Hollow-Fiber Modules" Water 10, no. 7: 947. https://doi.org/10.3390/w10070947
Note that from the first issue of 2016, this journal uses article numbers instead of page numbers. See further details here.