Assessing Aquatic Ecological Health for Lake Poyang, China: Part I Index Development


1
School of Geography and Tourism, Anhui Normal University, Wuhu 241003, China
2
Engineering Technology Research Center of Resources Environment and GIS, Anhui Province, Wuhu 241003, China
3
Key Laboratory of Watershed Geographic Sciences, Nanjing Institute of Geography and Limnology, Chinese Academy of Sciences, Nanjing 210008, China
4
Key Laboratory of Poyang Lake Wetland and Watershed Research, Ministry of Education, Jiangxi Normal University, Nanchang 330022, China
5
Poyang Lake Hydrology Bureau of Jiangxi Province, Jiujiang 332800, China
*
Authors to whom correspondence should be addressed.
Water 2018, 10(7), 943; https://doi.org/10.3390/w10070943
Submission received: 16 May 2018
/
Revised: 10 July 2018
/
Accepted: 10 July 2018
/
Published: 16 July 2018
(This article belongs to the Section Water Quality and Contamination)
Abstract
:The development of an ecosystem health index to assess health status in freshwater lakes is urgently needed in China, especially in polluted lakes. This study developed a specific Ecosystem Health Index (LP-EHI) for Lake Poyang in China. LP-EHI quantified lake health from the perspectives of physical, chemical, biological integrity and social service. Physical integrity indices included hydrological conditions (water level and runoff), basic morphometric characteristics (lake area and shoreline), and tributary connectivity. Chemical integrity indices used water quality, nutrition, and toxicity to quantify chemical impairment. Biological integrity indicators covered six major components of the aquatic food chain, namely, phytoplankton, zooplankton, benthic macroinvertebrates, wetland plants, fish, and wintering birds. Social service indices included drinking water, pathogenic potential, flood storage capacity, sand mining, and dish-shaped sub-lake areas under management to measure whether the lake fulfilled the needs of human society. Reference and impaired conditions for each metric were defined by “historical” conditions, “least disturbed” conditions, national standards and expert opinions. The value of LP-EHI ranging from 0 to 1 was divided into five health conditions: excellent (≥0.8), good (0.6–0.8), fair (0.4–0.6), poor (0.2–0.4) and bad (<0.2). The metrics’ reliability was further validated using a box-and-whisker plot test. The developed index (LP-EHI) is so far the most comprehensive index to evaluate ecosystem health for Lake Poyang, and is well reflected in the unique characteristics of Lake Poyang. It can enhance our understanding of lake health conditions and thus guide lake management to achieve better health conditions.
1. Introduction
Freshwater ecosystems are important water sources for human society. However, due to human activities (e.g., population growth), aquatic communities have suffered from significant declines of abundance and natural diversity in recent years [1,2]. Quantifying the ecological status of freshwater ecosystems can support water managers to identify the main perturbations responsible for impaired conditions, and thus propose regulations and recommendations towards ecosystem recovery [3].
Ecosystem health was defined as the preferred state of ecosystems that have been modified by human activity [4]. Ecological integrity, a core concept of ecosystem health, originally proposed by the U.S. Clean Water Act in 1972, was defined as “the state of being whole, entire or undiminished” [5]. It was widely used to identify whether the compositional and structural diversity and the natural function of the affected ecosystems are maintained [6]. Ecological integrity could be measured through several methods. Proposed indices focus on biological and ecological aspects, using biotic, physical and chemical parameters to assess the ecological status of the ecosystem. Biological integrity indices (BII) have been widely applied in rivers and streams and include the saprobe index (SI), family-level biotic index (FBI), and biological monitoring working party (BMWP) [7]. However, these biological indices might not be suitable for large lakes impaired by human populations due to their difficulty in determining reference conditions [8]. Moreover, the BII, which concentrates on biological populations, poorly reflects other aspects of lake ecosystems, including physical, chemical, and social service functions.
Ecological integrity index (EII) has been increasingly used to evaluate the anthropogenic impairment of lake ecosystems [8,9,10]. An example is the assessment of the Great Lakes in North American conducted by the International Joint Commission of Canada and USA since 1987. Indicators of this assessment are divided into three subject areas based on physical, chemical, and biological integrity. In China, ecological integrity metrics have also been widely applied in many lake ecosystems, including Lake Poyang [11], Lake Taihu [8,12,13], Lake Chaohu [9], Lake Doting [14], and Lake Dianchi Basin [10]. Researchers focused on pollution impacts with the measurement of total phosphorus, chlorophyll a, and water clarity [15]. Biological indicators were part of these studies, but these studies focused on the lower food web, including phytoplankton [9,11], and ignored higher trophic levels, such as macro-benthos, fish, and birds. There is also a growing need for integrating a human dimension with progress in restoration [16]. Social science factors relevant to human activities also need more explicit descriptions because lake ecosystem health refers to the state of a lake that both supplies services for people and maintains its function and complexity [12].
Lake Poyang, the largest Yangtze-River-connected freshwater lake in China, has suffered from increasing eutrophication and water quality degradation with significantly increasing total phosphorus and nitrogen [1]. The lake has shrunk in size with its surface area reduced from 5200 km2 (1949) to 3287 km2 (21st century). In addition to natural causes including soil erosion, embanking was the most significant driving force for the lake shrinking [17], which artificially reduced the natural lake volume and affected the hydrological process, with the sediment deposition rate resulting in a decline in its capacity for flood storage and regulation [18]. Seasonal water shortages also occurred frequently mainly induced by Three-Gorges-Dam reducing discharge [19], and threatened the lives of fish, birds, and humans [20]. In recent years, the seasonal fluctuations of the water level in Lake Poyang changed dramatically, resulting in an early seasonal drying in the wetland areas [21]. Therefore, some native communities were prone to be replaced by upland vegetation, affecting the lake and wetland ecosystems. The Lake Poyang wetland ecosystem was gradually degraded, and the structure and distribution of wetland plants has become mutable and fragile, dislocating and segregating habitats [22]. To understand these degradation issues, an approach to assess the lake health is needed.
Under this context, this study aimed to develop an ecosystem health index to assess Lake Poyang’s ecological health status. Metrics were selected based on the specific characteristics of Lake Poyang. Weights, reference conditions, standardization, and categorization of each metric were estimated. A box-and-whisker plot test was carried out to evaluate the consistency of LP-EHI. To our knowledge, this is so far the most comprehensive index reflecting the ecological health status of Lake Poyang. It is worth noting that this is Part I of a two-part effort, and Part II focus on assessing the health status of overall lake and indicator components based on the developed LP-EHI [23].
2. Materials and Methods
2.1. Study Area
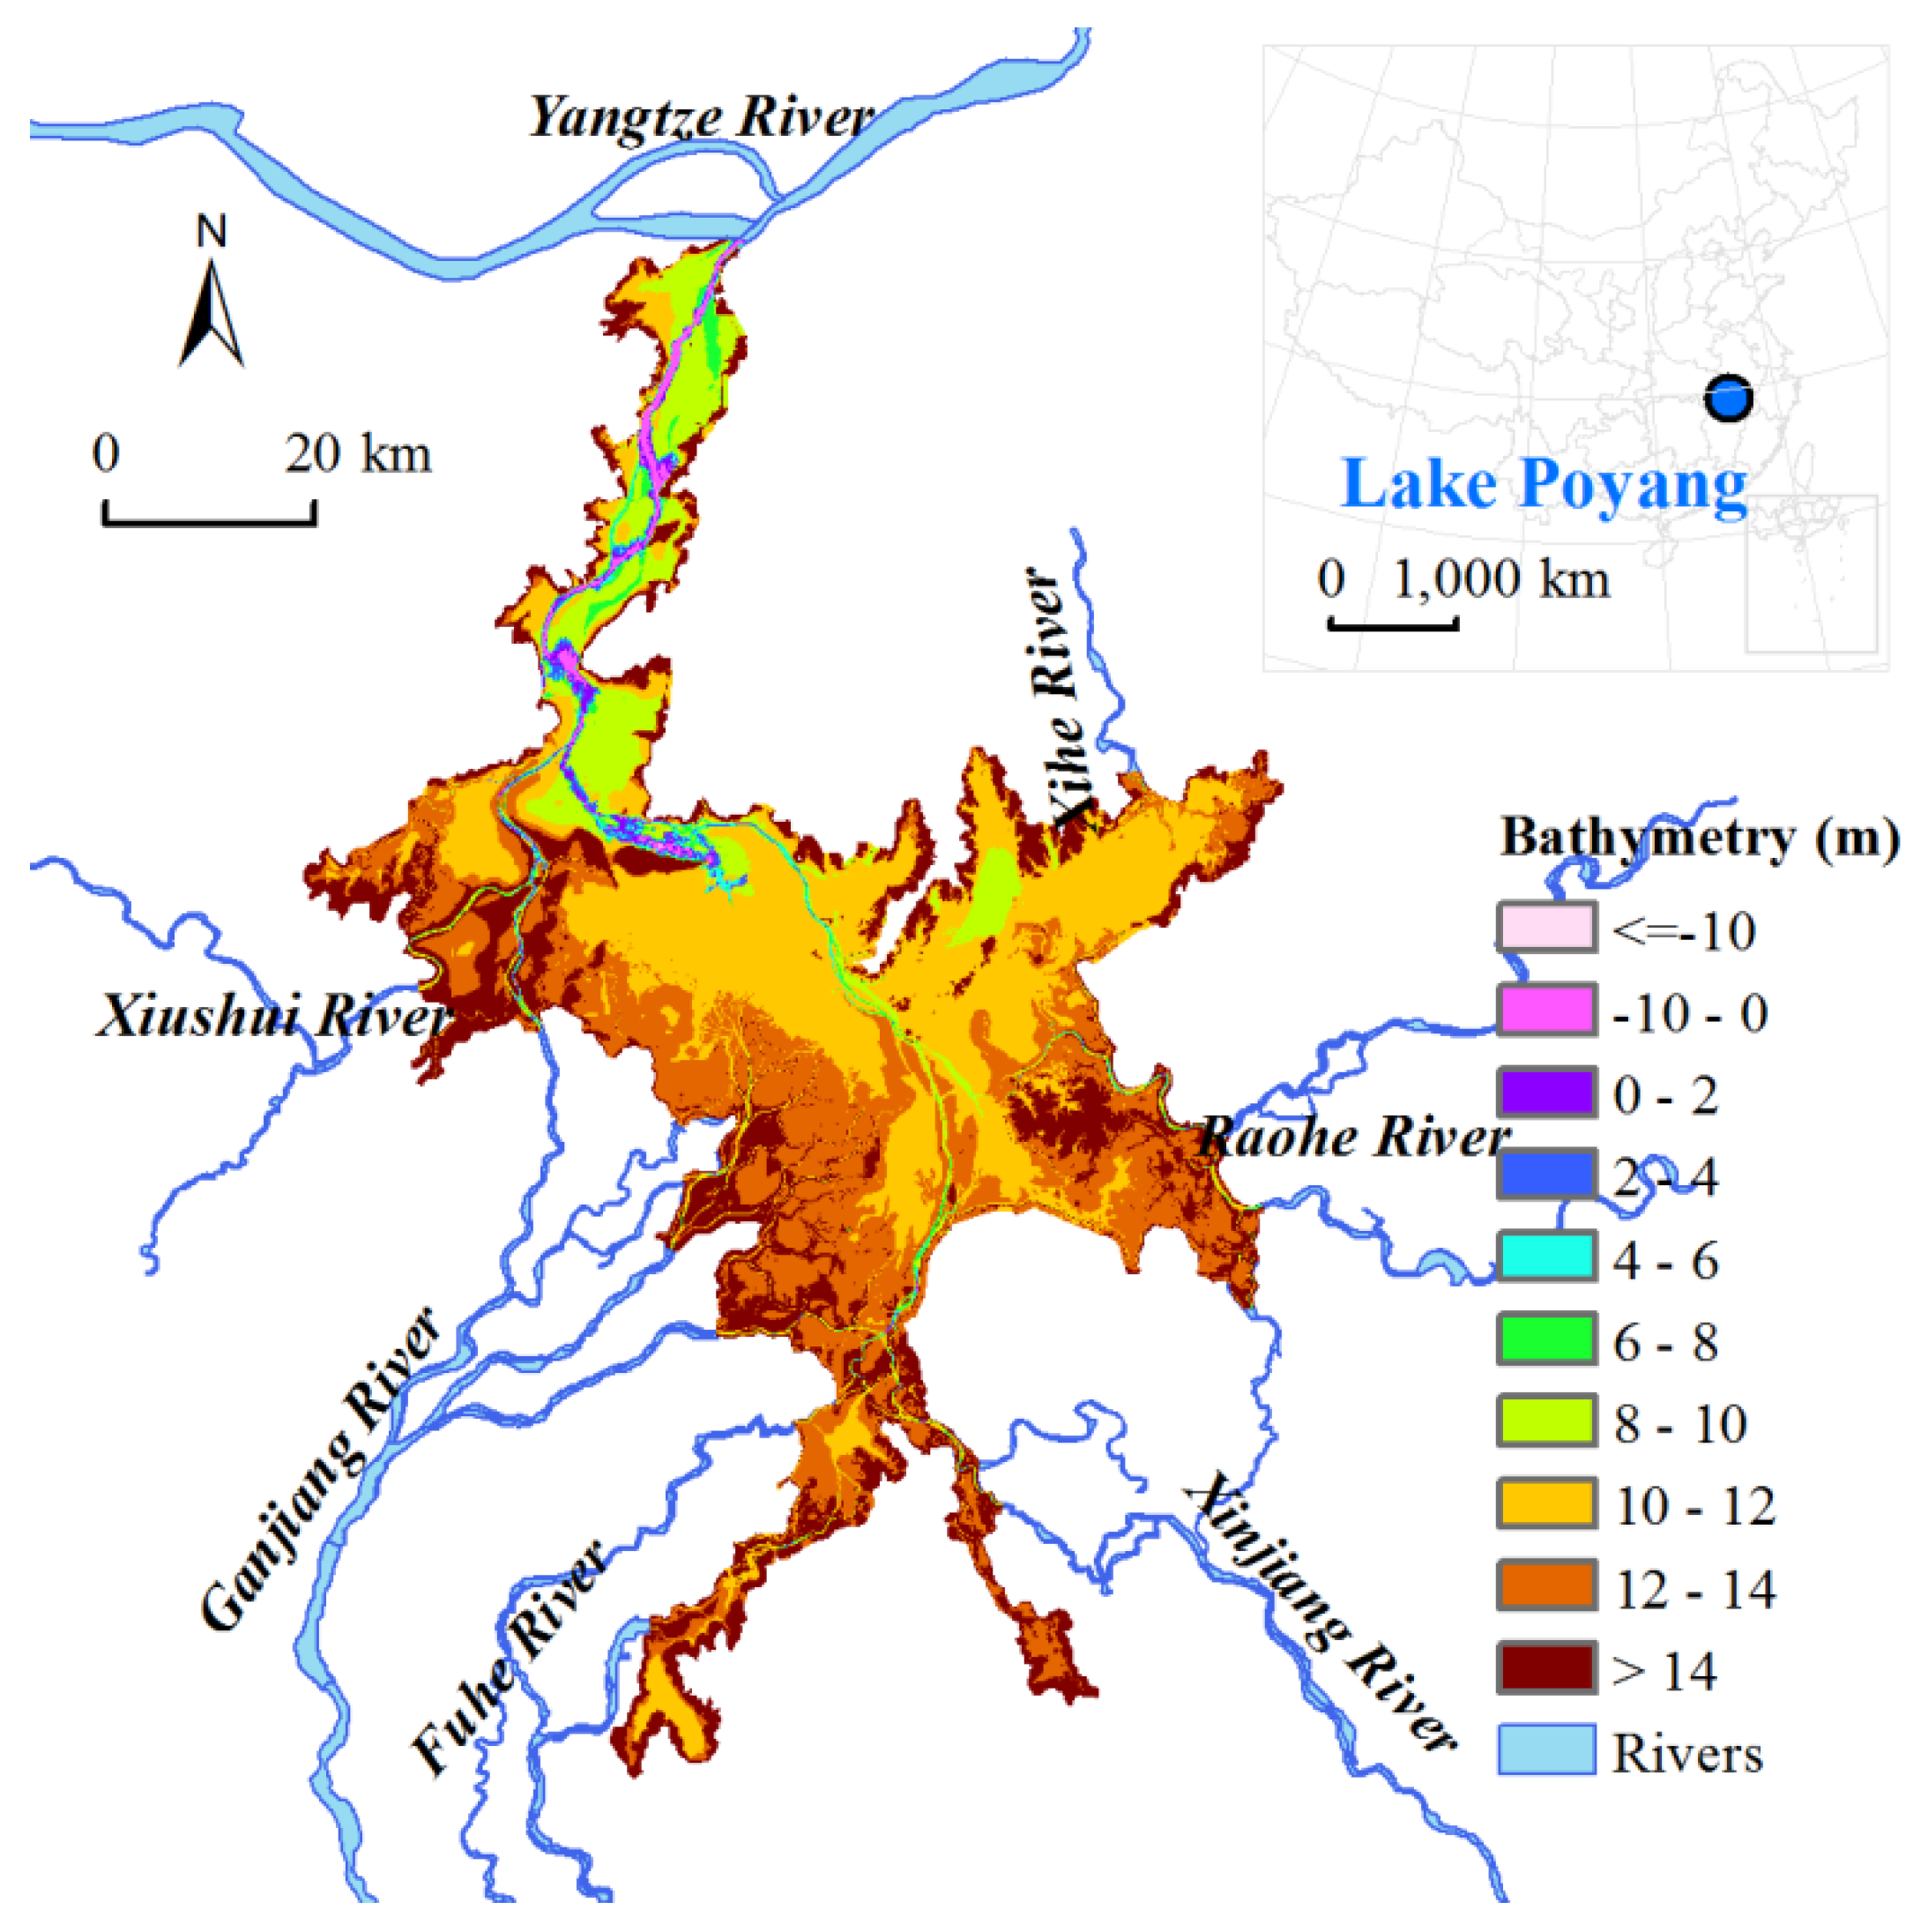
Lake Poyang (surface water area, 3287 km2), the largest natural freshwater lake in China, is located in the middle reach of the Yangtze River (Figure 1), with many wetlands in it. The lake included five inflows (Rivers Xiushui, Ganjiang, Fuhe, Xinjiang, and Raohe), and one outflow connected to the Yangtze River. Influenced by a combination of climate, hydrology, bathymetry, and human activities, the water level fluctuates dramatically (>10 m). For example, the water level at Hukou station increased from 7.32 m (11 February 2014) to 18.58 m (26 July 2014). This large water level fluctuation enhances rich biodiversity and the lake’s role in ecological conservation (Lai et al., 2014). As one of the world’s seven major wetland systems, Lake Poyang is a unique and important ecosystem in the world [21]. Lake Poyang has a mean hydraulic retention time of 20.9 days and experiences a subtropical monsoon climate with a mean annual precipitation of 1542 mm and evaporation of 1170 mm. The annually-averaged temperature is 16.5–17.8 °C.
2.2. Metric Selection
The concept of lake ecosystem health refers to the state of a lake that both supplies services for people and maintains its function and complexity [12], LP-EHI was developed from two aspects: natural properties and social service functions. Given the connotation of ecosystem health [24], characteristics of Lake Poyang [18,20,25] and previous assessments [8,11,12], natural indicators were divided into three subject areas for measuring physical, chemical, and biological integrity.
Five indicators were selected to assess physical integrity including water level, tributary connectivity, lake area, runoff and coastal habitat. Water level in Lake Poyang varied considerably (Table 1). The drying and wetting process imposed significant influences on the biological communities. Too high or too low water level both affects growth and the structure of wetland plants [25], leading to difficulties in feeding for migratory birds [26] and spawning for fish [27]. Therefore, the average of the highest and lowest 10-day water level defined in the supplementary material were both selected to measure its fluctuations. The average of the two sub-indicators’ scores was used to measure the water level condition. The percentage of entrances connected directly to the lake was used to measure tributary connectivity and often applied in large lakes’ assessments [8]. These blocked entrances induced by dams might affect mass and energy exchange between lake and rivers [8,28]. Shrinking rate of the lake area was a basic morphometric parameter and indicator for human activities, such as land reclamation via filling of wetlands due to the economic development [17]. Reclamation played a supplementary role in the increasing severity of floods [29]. The lake area was calculated when the water level (at only one outflow station: Hukou) reached 19 m, the maximum lake area. The area of the current lake at 19 m was then compared with the historical lake area at the same water level to determine the area shrinking rate. Runoff could directly affect water volume, and cause flooding or drought. Hydrological processes had also long been interacting with and influencing wetland ecosystems [26]. Total runoff of Hukou station over an entire year was chosen as one of the physical indicators. Coastal habitat was described by the shoreline alteration index (SAI), proposed by the Great Lakes in North America [28]. It was critical to measure the degree of artificial transformation or damage of shoreline. Physical coastal changes could affect lakeshore processes and near-shore circulation patterns, altered or destroyed wetland plants distribution and threatened lakeshore habitats. Further SAI can be found in the supplementary material.
Chemical integrity was represented by water quality, nutrition, and toxicity. Water quality included three indicators: total phosphorus (TP), total nitrogen (TN), and electrical conductivity (EC). Phosphorus and nitrogen were the drivers of eutrophication that could lead to the disaster of harmful algal blooms [30]. EC represented the concentration of water-soluble inorganic salts and indirectly reflects the intensity of industrial production [31]. Nutrition conditions were represented by the nutrient indictor of trophic level indices (TLI). TLI had been used in assessing the ecological status of Lake Poyang to examine the ability of the ecosystem to resist external perturbations [11]. Organochloride pesticides (OCPs) including HCH, DDT were highly concerned pollutant in China. Water solubility of organic pollutant is among the most important physical properties controlling the chemical transport and fate in the aquatic ecosystem [32]. Therefore, including these toxic chemicals was necessary to better represent the health status in Lake Poyang. In addition, Jiangxi Province had considerable mining of heavy metal resources [33]. Thus, these indices were collected to reflect pollution of toxic chemicals and heavy metals found in Lake Poyang [34]. For those site-scale indices, like TN, which were collected in seasonal measurement periods in an individual year, a straight average of all sites for each time period was calculated and then the time periods were averaged again to get the annual health value.
Biological integrity assessment covered six main components in the aquatic food chain including phytoplankton, zooplankton, benthic macroinvertebrates, wetland plants, fish and birds. Phytoplankton (algae) was the primary producer and responded quickly to water chemistry and environmental quality. Blue-green algae bloom was one of the most visible indicators of impaired water quality and presented harmful socioeconomic and ecological effects [11]. Diversity and composition indices including ratio of blue algae biomass and Berger-Parker index (percentage of the most-dominant taxa) were constructed to measure the health condition of phytoplankton (the supplementary material). Berger-Parker index was one of the most widely accepted and even metrics for measuring the diversity and stability of the ecosystem [8]. Berger-Parker index and density of large Daphnia are two indices for zooplankton. Daphnia had been introduced in the restoration area to graze algae and thus controlled eutrophication [35]. High density of large Daphnia was inverse to blue-green algae blooms. Benthic macroinvertebrates, as bottom level consumers, played an important role in aquatic recycling [36]. Berger-Parker index was chosen and FBI had been widely used to reflect water quality contaminated to varied extents [37]. Aquatic plants were able to absorb harmful substances and pollutants, functioned as an indicator of the eutrophic status of a water body [38] and provided a habitat and shelter for a variety of shellfish and small invertebrates [39,40]. Areal coverage was selected as a parameter to describe the status of wetland plants. Fish were a higher level of consumers in the aquatic food chain. Biomass and community structure directly reflected the health of the entire lake ecosystem. In recent years, fish in Lake Poyang were observed to be younger, smaller and of low quality [41]. Therefore, the weight ratio of 1 year to two fish was selected as one index. Grass carp, black carp, silver carp, and bighead carp are four domestic fish species in China, which are commercially important species and could also reflect spawning conditions [8,42]. Thus, the weight ratio of the four famous high values to local communities’ Chinese carps was also selected. Lake Poyang was popularly known as a bird sanctuary for thousands of migratory birds in winter. The total number of wintering birds directly indicated the lake’s ecological richness. Previous studies widely suggested that Lake Poyang was an ideal wintering habitat for the Siberian Crane and these cranes are primarily distributed across two national nature reserves, with a maximum number of 722, accounting for 18.05% of the global population size [43]. However, a continuous low water level during spring and early summer in Lake Poyang had resulted in long-term drought and decreased availability of food for these water birds [44]. This dramatic reduction of the Siberian Crane was widely concerning, because they were listed in the first category of the nationally protected wildlife species in China, and were regarded as an extremely endangered species by the IUCN (International Union for Conservation of Nature). Therefore, they were selected to reflect the health status of birds.
Five indicators were selected to assess the state of social service functions. The attainment rate of water function zones could measure directly whether Lake Poyang provided the high-quality drinking water. Schistosoma in Lake Poyang was highly pathogenic and threatened livestock and human health. Snails were the primary host of schistosomiasis. Therefore, the ratio of infected snails and the ratio area of marshland with snails was selected to measure its pathogenic potential. Flood storage capacity represented the regulation capacity for avoiding flooding disasters. Difference of discharge during the flood period (April to June) reflected the flood volume adjusted by the lake. Lake Poyang had probably the largest sand mining operation in the world. Sand extraction had an obvious negative influence on biodiversity and water quality [45]. Thus, the amount of sand mining was chosen as an indicator of human disturbance. The dish-shaped sub-lake referred to the large dished depression that seasonally appeared in the bottomland during dry season [46]. These sub-lakes were important for maintaining the biodiversity of this globally important wetland ecosystem. Thus, the ratio of dish-shaped sub-lakes that were officially protected by the local government was included as a response indicator.
Four-level metrics (A: Target level, B: Sub-target level, C: Element level, D: Assessment indicator level) were listed in Table 2 and Figure 2. The fifth level (E: Individual index level) indices and their corresponding equations were given in the supplementary material. LP-EHI was more comprehensive compared with other indices in previous studies (Table 3) and better reflected factors most relevant to the characteristics of Lake Poyang. A series of indices including unique hydrodynamic regime, chemical toxics, and pathogenic potential had been involved in the LP-EHI.
2.3. Weight Estimation
The weight of the selected indicator in LP-EHI was estimated using analytic hierarchy process (AHP). AHP could be implemented by four steps: structuring the decision problem, measurement and data collection, determination of normalized weights, and synthesis toward-finding solution to the problem [47]. Its formulas and detailed descriptions could be found in several studies [48,49]. After AHP modeling, giving out fuzzy weighing determined by the priority of a set of alternatives and the relative importance of attributes in a multiple criteria decision-making problem, the weights were readjusted to attain an approximate actual status (Figure 2). The concept of lake health is incorporated in the weighting, which depends not only on whether the ecosystem can maintain, but also on whether it can meet the reasonable needs of human society. In order for the environment to continue to meet the needs of society, the system must be maintained. Therefore, the weight of natural properties is higher than social service. And the various indices of social service attributes are believed to have the same feedback. For example, both drinking water and flood storage capacity are necessary for living safety of residents and it is hard to say which is more important so the weights are equal. Physical integrity reflects the basic properties of the lake and the degree of human disturbance or damage, which is of less importance than chemical integrity that directly reflects water quality and pollution, and biological communities which exchange material and energy with the whole ecosystem at any time. Therefore, the weight ratio of physical, chemical, and biological aspects is set at 1:4:4. Lake Poyang has significant hydrological characteristics [50] including fluctuating water levels and runoff, and these five physical indicators are regarded of the same importance. Water quality directly reflects pollution and human disturbance, so the weight is higher than for indicators of the nutritional status and toxicity. The biological integrity consists of phytoplankton, zooplankton, benthic macroinvertebrate, wetland plants, fish, and birds. The weight of each biological indicator is related to a series of factors including self-restoring capacity, the order in the aquatic biological food chain, and sensitivity to pressure or disturbance [28].
2.4. Reference Condition Definition
As a result of high population density, human disturbance has a profound impact on the ecosystem [7]. An important component of ecological assessment is an evaluation of the direct or indirect effects of human activities or disturbances. The concept of a reference condition is increasingly used to describe the standard or benchmark against which the current condition is compared. The following specific terms have been used to define reference conditions [51]: “Historical” condition (HC) describes the condition of lakes at some point in their history under very low pressure, without the effects of major industrialization, urbanization, and intensification of agriculture. “Least disturbed” condition (LDC) is ideally described by evaluating data collected at sites selected according to a set of explicit criteria that define what is least disturbed by human activities. These criteria vary from region to region and are developed iteratively with the goal of establishing the least amount of ambient human disturbance (e.g., <1% agricultural). “Best attainable” condition (BAC) is equivalent to the expected ecological condition of least-disturbed sites if the best possible management practices were in use for some period of time [51].
HC has been used to define some reference conditions, including vegetation, fish, and birds. In 1983, Jiangxi Province conducted the first comprehensive scientific expedition for Lake Poyang [25]. At that time, as the reform and opening-up policy in China had just begun and Jiangxi Province’s less economically developed, the lake was under relatively low pressure, and only minor impairment of physical, chemistry, lake morphology, and biology occurred, without the effects of major industrialization and intensification of urbanization. This study uses the historical survey data in 1983 to represent a reference condition.
National standards for surface water environment quality (GB3838-2002) provide benchmarks for BAC of water quality and toxicity. When both historical data and authoritative standards are lacking for specific indices, e.g., phytoplankton, zooplankton, and benthic macroinvertebrates, the LDC was used. Adhering to the literature [7,14], the reference site approach was adopted. The 5th/95th best percentile of the candidate sites increasing/decreasing with disturbance was used to select the reference sites (e.g., <5% blue-green algae biomass or >95% large Daphnia density). Expert opinion, achieved through interview and intensive discussion, was also considered in defining the reference condition of specific metrics, such as water level fluctuation (Figure 2).
2.5. Metric Standardization and Categorization
Considering the different ranges of the raw values of selected metrics, each metric was rescaled to a score between 0 and 1 using upper and lower anchors. The upper anchor (expected value) is the “best” value of the reference condition. The lower anchor (threshold value) represents the “worst” value of the most unexpected or impaired status with high population density and human disturbance. It could be calculated by the same methods to obtain the reference values. For example, the upper anchor of the total number of wintering birds was 7.1 × 10⁵ in 2005, which was the largest in history. In contrast, the lower anchor had the lowest abundance (1.7 × 10⁵) in 1998. For metrics using BAC including TN, TP, the water quality standard of Grade I was the upper anchor and Grade V was the lower anchor. Metrics that use LDC and decrease with the disturbance set the 95th percentile of the site values as the upper anchor and the 5th percentile values as the lower anchor. If the metric increased with disturbance, then the 5th percentile of the site values was set as the upper anchor, and the 95th percentile of the values was set as the lower anchor [52]. The metric was rescaled as follows [7]. For example, TN, whose average site value for a year, upper anchor, and lower anchor were respectively 1.17, 0.20, 2.00 mg L−1, the metric score was: 1 − |1.17 − 0.20|/|2.00 − 0.20| = 1 − 0.97/1.80 = 0.46.
The final score of LP-EHI was the sum of the scores for each individual metric with each weight (Equation (2)), where n is the number of metrics, is the score value of metric k, and is the weight of each metric k.
The score is expressed as a numerical value ranging from 0 to 1. This range can be subdivided into any number of categories that correspond to various levels of impairment. The metrics are scaled to reference conditions or expectations for the lake classes, and any decision on subdivision should reflect the distribution of the scores for the reference sites. This paper proposes classes with equal ranges to provide five ordinal rating categories for assessment of impairment in accordance with the requirements of the European Water Framework Directive [53], that is, excellent (≥0.8), good (0.6–0.8), fair (0.4–0.6), poor (0.2–0.4), and bad (<0.2).
3. Results and Discussion
3.1. LP-EHI
The LP-EHI included a total of five levels and 32 individual indices with their corresponding equations provided in the supplementary material. Each metric’s weight, expected or threshold value, and methods for defining reference conditions were listed in Figure 2. Status of health conditions can thus be calculated according to Figure 2.
3.2. Index Testing and Validation
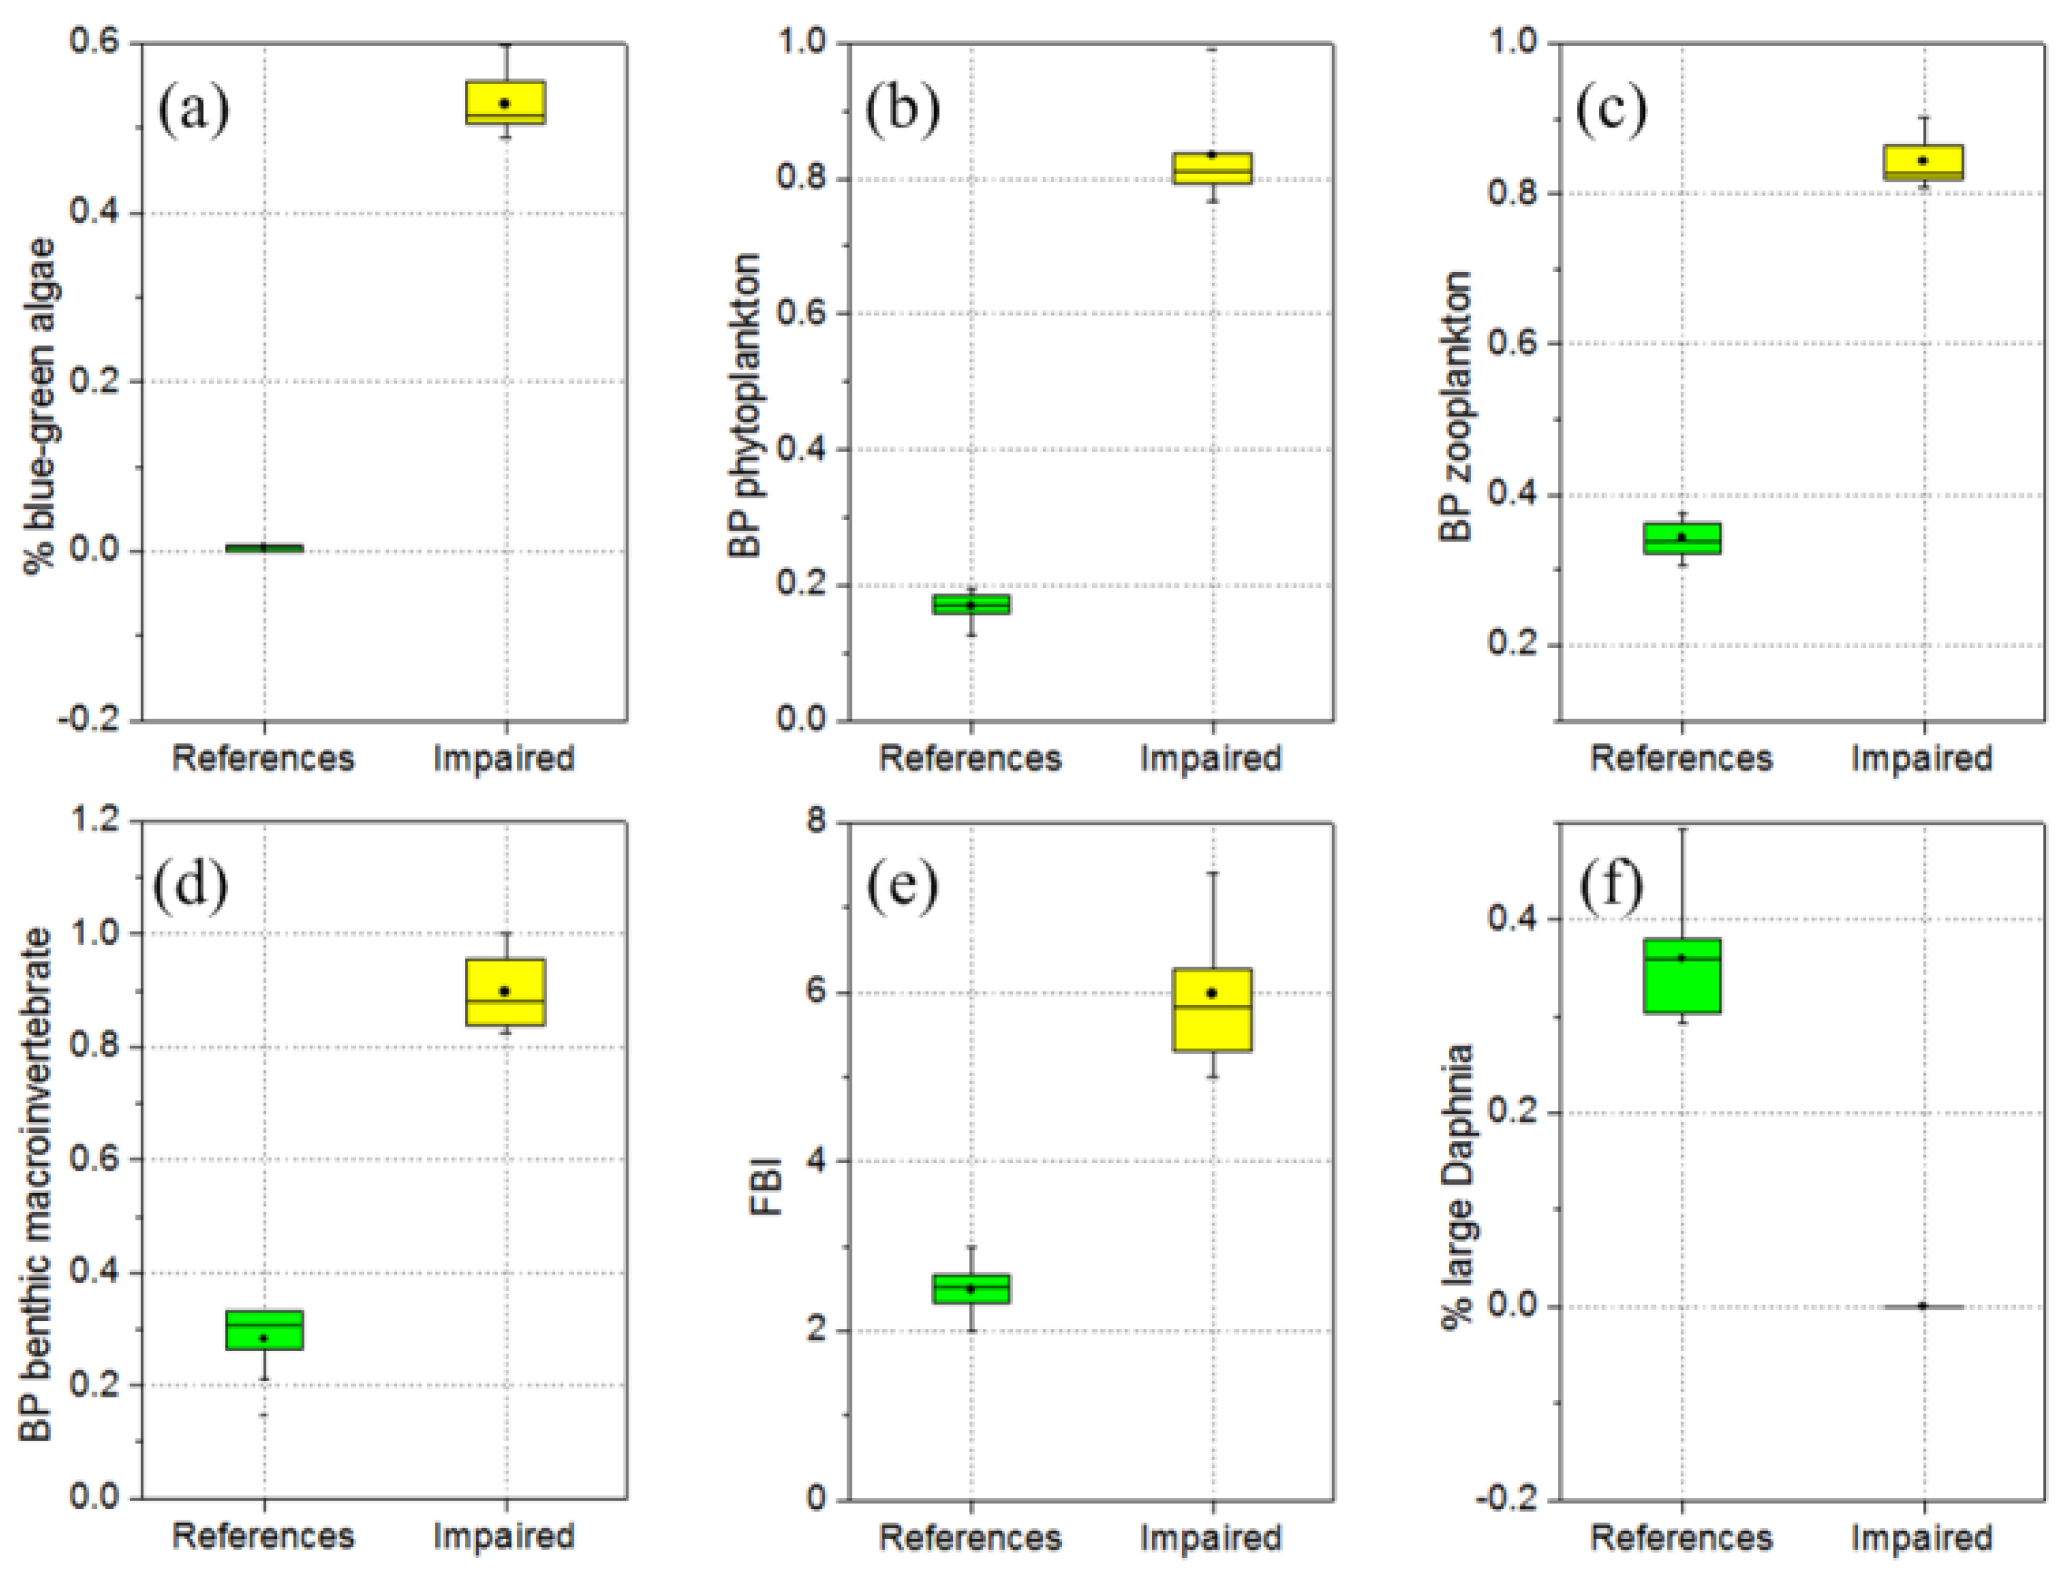
The evaluation results were tested and validated to confirm the discrimination between reference and impaired values for metrics using the approach proposed by Barbour et al. [54]. Once significant differences were identified, the reference condition was scientifically defined, and the difference could then be used to measure the current status. Box-and-whisker test plots, recommended by Huang et al. [7] and Wu et al. [55], were performed on each metric, and reference values were compared with impaired values for discrimination power analysis. The discrimination power of each metric was judged according to the degree of Inter-Quartile (IQ) overlap in the box plots. Table 4 was used to improve the clarity and specificity of the discrimination power. The metrics with an IQ value equal and higher than 2 satisfied the testing [55].
For those metrics determined by HC and BAC, the reference and impaired values were unchangeable or had an annual timescale. For example, the reference and impaired values for TN, defined by BAC (GB3838-2002), were consistent and were 0.20 and 2.00 mg L−1, respectively. For those metrics defined by HC, such as wintering birds, the reference and impaired values were defined as the historical minimum (in 1998) and maximum values (in 2005), respectively. Therefore, discrimination existed and did not need further testing. Site-scale seasonal metrics determined by LDC including phytoplankton, zooplankton, and benthic macroinvertebrate, needed to be tested. Results showed significant differences between the reference and impaired sites of these metrics (IQ ≥ 2, Figure 3), thereby indicating that the developed LP-EHI was reliable.
3.3. Determination of Reference Condition
The determination of the appropriate reference condition was a critical step in developing LP-EHI. It was illustrated that identifying a truly undisturbed or “perfect” reference condition was not practical because most aquatic ecosystems were disturbed by long-term human activities. LDC was the most common method of determining reference conditions for the health assessment of streams and rivers [8]. However, the majority of inland lakes in China are disturbed to different degrees [56]. Lake Poyang is frequently affected by human activities, including sand mining, fishing, agriculture, and industry. Loss of species and habitats, ecosystem degradation caused by pollution, and overexploitation occur on rapid timescales. Thus, reference condition in the study was defined as the combination of HC, BAC, and LDC. The evaluation results based on the combination of HC, BAC, and LDC may overvalue the ecological status of Lake Poyang in comparison with the true or “perfect” natural condition. However, the reference conditions constructed for LP-EHI successfully reflected the structure and characteristics of biochemical processes, and were sufficient and sensitive in their ability to distinguish reference sites from impaired sites through box-and-whisker plot tests.
3.4. Indicator Selection for LP-EHI
Suitable indicator selection establishes a solid foundation for reliable assessment. Lake Poyang, as the largest freshwater lake naturally connected to Yangtze River in China and one of seven globally important wetlands, has a series of complicated hydrological and bio-chemical characteristics. BII, which is widely used in the assessment of rivers and lakes, insufficiently describes the health status of Lake Poyang. Therefore, this study used ecosystem health indices to construct the LP-EHI from physical, chemical, biological, and social function aspects. Considering a large amount of previous valuable assessments, recent health status, and expert opinion, effort was made to gather numerous scientific indicators to ensure that LP-EHI reflects the structure and characteristics of the lake. Given the unique hydrological characteristics of Lake Poyang, seldom-used indices such as water level and runoff were developed to measure physical integrity.
Phytoplankton, benthic macroinvertebrate, fish, and aquatic plants are commonly used to measure the health of a lake ecosystem [8]. LP-EHI expanded the biological indices to include zooplankton and birds. Zooplankton, as bottom-level consumers, maintains a balanced exchange of material and energy in the food chain. Birds, as the highest-level consumers, reflect the richness of vegetation, water quality, and even hydrological process. LP-EII also includes social function indices that were rarely used in previous assessments to decide whether the lake meets reasonable requirements of human beings. LP-EHI reflects the health of the ecosystem to the greatest extent, and its use is considerably time consuming and complex. Collecting a sufficient amount of data was a time-consuming work; however, doing so enabled more information to be obtained, thereby reflecting the real situation of the lake.
Although LP-EHI comprised of many indicators, it is still difficult to cover every aspect of the entire lake ecosystem. Sediment plays a major role in the transportation and transformation of materials in freshwater ecosystems. Especially the palaeo-data from sediment reflect the accumulation of the internal load spanning long decades, which can be significant such that it prevents improvements in a lake, even when the external load has been greatly reduced [57]. However, the goal of this study is to assess the current health status of Lake Poyang, thus the slight and slow change of health status within a relatively short temporal scale was hard to be reflected from palaeo-data from sediment. For Lake Poyang, frequent hydrological alteration, intensive wind-wave disturbance, and the relatively weak water current in some protected bays, resulted in great spatial heterogeneity in organic content and fine-grain size of sediments [58]. These non-human-induced distributions of sediment were difficult to define the reference conditions. Also limited by the ability to access the palaeo-data, including multi-proxy data from sediment cores, LP-EHI has not included the sediment indicator temporarily. Fortunately, the concentrations of water solution used in this study could reflect the situation of sediment partly. In the future, the ecosystem health change research in longer periods, the sediment indicator would be acquired maximally.
3.5. Comparison with Previous Ecosystem Health Indices
In order to quantitatively assess ecosystem health, various indices covering different aspects of ecosystem health have been suggested. These indices range from single species indicators (e.g., Huang et al. [7]) to composites of species to measures of biodiversity, to system level measures of ecosystem structure, function, and organization (e.g., Xu et al. [59]). Compared with single species indicators, the composite indicators could better reflect the more comprehensive assessment.
LP-EHI, as a total index of five levels and 32 individual indices, covered most ecological realms, which need an indeed tough data collection and analysis, and have been seldom constructed in other larger freshwater lakes, especially in China (Table 3). LP-EHI also went beyond the biophysical realm to include a number of human socio-economic factors, with which there are more concerns on analysis of the linkages between the human pressures and response on ecosystem, and have been explicitly avoided by conventional science [7,11,59,60,61]. Indeed, effective diagnosis requires an exploration for, and identification of, most critical of these links of human alterations and societal responses. Additionally, for the goal of assessing the current health status of the largest freshwater lake, Lake Poyang, more indicators have better reflected its characteristics, like changeable water level, pathogenic potential, and dish-shaped sub-lake areas under management have been taken into consideration (Table 2). Undoubtedly, the comprehensive index can bring significantly higher confidence to master the health status from a global perspective and it works well as demonstrated in Part II [23]. However, it also lead to a huge data demand, increasing the difficulties to make comparisons of ecosystem health status among different lakes based on LP-EHI.
Limited by the temporal and spatial resolution of conventional assessments based on sample sites, it is one of the leading efforts related to developing dynamic models to calculate indicators in assessment to expand the dimension [61]. LP-EHI made lots of efforts to select suitable indicators which could not only reflect the health status of the lake, but easily be combined with the mechanism models, laying a solid foundation for further modeling. Supported by Jiangxi Water Resources Department (Grant No. KT201406), the dynamic models to simulate ecological indicators including water level, TN, TP, Chlorophyll a have been built successfully and would be useful for predicting the changes of the lake ecosystem health following the changes in environmental conditions [61]. Such a complex index would provide ample dynamic simulation to serve for refined evaluation; however, the difficulty of constructing comprehensive models and validating parameters is also conceivable.
4. Conclusions
This study developed an Ecological Health Index (LP-EHI) that consists of five levels and 32 individual indices. Physical, chemical, biological, and social service indices were used to reflect the ecological health of the aquatic ecosystem. The developed index (LP-EHI) provided five ordinal rating categories (excellent, good, fair, poor, and bad) to describe ecological health conditions. The developed index is a valuable reference for complex large lake ecosystem assessments, and enhances our understanding on health management of the lake ecosystem. A further application of LP-EHI is provided in Part II.
Supplementary Materials
The following are available online at https://www.mdpi.com/2073-4441/10/7/943/s1, Table S1: Equations for calculating the fifteen level individual indices.
Author Contributions
L.Q., J.H. and J.G. designed the research; L.Q. and Q.H. performed the experiments and analyzed the data; S.W. and Y.G. collected measured data; All authors contributed to manuscript writing; L.Q., J.H. and Q.H. revised the manuscript.
Funding
This research was jointly supported by the National Basic Research Program of China (Grant No. 2012CB417006), the Major Water Resources Science and Technology Program of Jiangxi Water Resources Department (Grant No. KT201406), National Natural Science Foundation of China (Grant No. 41561093, 41661102), Youth Natural Scientific Foundation of Jiangxi Province (Grant No. 20161BAB213076).
Acknowledgments
We acknowledge the Jiangxi Province Poyang Lake Hydrology Bureau for providing hydrological measured data, the Lake Poyang Wetland Observation and Research station and Jiangxi Ecological Civilization Research and Promotion Association for providing ecological investigation data, and Jiangxi Hydraulic Research Institute for providing statistical data about service functions.
Conflicts of Interest
The authors declare no conflict of interest.
Abbreviations
| LP-EHI | ecosystem health index for Lake Poyang |
| BII | biological integrity indices |
| SI | saprobe |
| FBI | family-level biotic index |
| EII | ecological integrity index |
| SAI | shoreline alteration index |
| TP | total phosphorus |
| TN | total nitrogen |
| EC | electrical conductivity |
| TLI | trophic level indices |
| OCPs | organochloride pesticides |
| AHP | analytic hierarchy process |
| HC | historical condition |
| LDC | least disturbed condition |
| BAC | best attainable condition |
References
- Cheng, X.Y.; Li, S.J. An analysis on the evolvement processes of lake eutrophication and their characteristics of the typical lakes in the middle and lower reaches of Yangtze River. Chin. Sci. Bull. 2006, 51, 1603–1613. [Google Scholar] [CrossRef]
- Frissell, C.A.; Bayles, D. Ecosystem management and the conservation of aquatic biodiversity and ecological integrity. Water Resour. Bull. 1996, 32, 229–240. [Google Scholar] [CrossRef]
- Langhans, S.D.; Reichert, P.; Schuwirth, N. The method matters: A guide for indicator aggregation in ecological assessments. Ecol. Indic. 2014, 45, 494–507. [Google Scholar] [CrossRef]
- Flotemersch, J.E.; Leibowitz, S.G.; Hill, R.A.; Stoddard, J.L.; Thoms, M.C.; Tharme, R.E. A Watershed Integrity Definition and Assessment Approach to Support Strategic Management of Watersheds. River Res. Appl. 2016, 32, 1654–1671. [Google Scholar] [CrossRef]
- Kay, J.J.; Henry, A.R. Uncertainty, complexity, and ecological integrity: Insights from an ecosystem approach. In Implementing Ecological Integrity: Restoring Regional and Global Environmental and Human Health; NATO Science Series, Environmental Security; Crabbé, P., Holland, A., Ryszkowski, L., Westra, L., Eds.; Springer: Dordrecht, The Netherlands, 2000; pp. 121–156. [Google Scholar]
- Richter, B.D.; Mathews, R.; Harrison, D.L.; Wigington, R. Ecologically sustainable water management: Managing river flows for ecological integrity. Ecol. Appl. 2003, 13, 206–224. [Google Scholar] [CrossRef]
- Huang, Q.; Gao, J.F.; Cai, Y.J.; Yin, H.B.; Gao, Y.N.; Zhao, J.H.; Liu, L.Z.; Huang, J.C. Development and application of benthic macroinvertebrate-based multimetric indices for the assessment of streams and rivers in the Taihu Basin, China. Ecol. Indic. 2015, 48, 649–659. [Google Scholar] [CrossRef]
- Huang, Q.; Gao, J.F.; Zhang, Y.H.; Yan, R.H.; Wang, Y.; Cai, Y.J. Aquatic ecological integrity assessment of four large lakes in the middle-to-lower reaches of the Yangtze River, China. Acta Ecol. Sin. 2016, 36, 118–126. [Google Scholar] [CrossRef]
- Xu, F.L.; Tao, S.; Dawson, R.W.; Li, P.G.; Cao, J. Lake ecosystem health assessment: Indicators and methods. Wat. Res. 2001, 35, 3157–3167. [Google Scholar] [CrossRef]
- Liao, J.Q.; Cao, X.F.; Wang, J.; Huang, Y. Basin-scale aquatic ecosystem health assessment with composite indices of chemistry and aquatic biota: A case study of Dianchi Lake. Acta Sci. Circumst. 2014, 34, 1845–1852. [Google Scholar] [CrossRef]
- Zhang, Y.H.; Yang, G.S.; Li, B.; Cai, Y.J.; Chen, Y.W. Using eutrophication and ecological indicators to assess ecosystem condition in Poyang Lake a Yangtze connected lake. Aquat. Ecosyst. Health Manag. 2016, 19, 29–39. [Google Scholar] [CrossRef]
- Hu, Z.X.; Hu, W.P.; Gu, X.H.; Chen, Y.W.; Ji, J. Assessment of ecosystem health in Lake Taihu. J. Lake Sci. 2005, 17, 256–262. (In Chinese) [Google Scholar]
- Guan, B.H.; An, S.Q.; Gu, B.H. Assessment of ecosystem health during the past 40 years for Lake Taihu in the Yangtze River Delta, China. Limnology 2010, 12, 47–53. [Google Scholar] [CrossRef]
- Wang, X.; Zheng, B.H.; Liu, L.S.; Wang, L.J. Development and evaluation of the Lake Multi-biotic Integrity Index for Dongting Lake, China. J. Limnol. 2015, 74, 594–605. [Google Scholar] [CrossRef]
- Carlson, R.E. A trophic state index for lakes. Limnol. Oceanogr. 1977, 22, 361–369. [Google Scholar] [CrossRef] [Green Version]
- Niemi, G.J.; Mcdonald, M.E. Application of Ecological Indicators. Annu. Rev. Ecol. Evol. Syst. 2004, 35, 89–111. [Google Scholar] [CrossRef]
- Min, Q. Study on the relationship between shape, water regime and innings of Poyang Lake. Adv. Water Sci. 2000, 11, 76–81. [Google Scholar]
- Han, X.X.; Chen, X.L.; Feng, L. Four decades of winter wetland changes in Poyang Lake based on Landsat observations between 1973 and 2013. Remote Sens. Environ. 2014, 156, 426–437. [Google Scholar] [CrossRef]
- Lai, X.J.; Liang, Q.H.; Jiang, J.H.; Huang, Q. Impoundment Effects of the Three-Gorges-Dam on Flow Regimes in Two China’s Largest Freshwater Lakes. Water Resour. Manag. 2014, 28, 5111–5124. [Google Scholar] [CrossRef]
- Min, Q.; Zhan, L.S. Characteristics of low-water level changes in Lake Poyang during 1952–2011. J. Lake Sci. 2012, 24, 675–678. (In Chinese) [Google Scholar]
- Mei, X.F.; Dai, Z.J.; Fagherazzi, S.; Chen, J.Y. Dramatic variations in emergent wetland area in China’s largest freshwater lake, Poyang Lake. Adv. Water Resour. 2016, 96, 1–10. [Google Scholar] [CrossRef]
- Feng, L.; Han, X.X.; Hu, C.M.; Chen, X.L. Four decades of wetland changes of the largest freshwater lake in China: Possible linkage to the Three Gorges Dam? Remote Sens. Environ. 2016, 176, 43–55. [Google Scholar] [CrossRef]
- Qi, L.Y.; Huang, J.C.; Huang, Q.; Gao, J.F.; Wang, S.G.; Guo, Y.Y. Assessing aquatic ecological health for Lake Poyang, China: Part II Index application. Water 2018, 10, 909. [Google Scholar] [CrossRef]
- Li, C.H.; Cui, W.; Pang, A.P.; Zheng, X.K. Progress on theories and methods of watershed eco-health assessment. Process Geogr. 2008, 27, 9–17. [Google Scholar]
- Hu, Z.P.; Ge, G.; Liu, C.L. Cause analysis and early warning for wetland vegetation degradation in Poyang Lake. Res. Environ. Yangtze Basin 2015, 23, 381–386. (In Chinese) [Google Scholar]
- Hu, Z.P.; Ge, G.; Liu, C.L. Response of wintering migratory birds to hydrological processes in Poyang Lake. J. Nat. Res. 2014, 29, 1770–1778. [Google Scholar] [CrossRef]
- Wang, Y.Y.; Yu, X.B.; Xu, J.; Li, W.H.; Fan, N. Temporal variation of energy sources in a floodplain lake fish community. J. Freshw. Ecol. 2012, 27, 295–303. [Google Scholar] [CrossRef] [Green Version]
- International Joint Commission (IJC). Assessment of Progress Made towards Restoring and Maintaining Great Lakes Water Quality Since 1987; IJC: Washington, DC, USA, 2013. [Google Scholar]
- Li, X.H.; Zhang, Q. Variation of floods characteristics and their responses to climate and human activities in Poyang Lake, China. Chin. Geogr. Sci. 2014, 25, 13–25. [Google Scholar] [CrossRef]
- Wu, Z.; Zhang, D.; Cai, Y.; Wang, X.; Zhang, L.; Chen, Y. Water quality assessment based on the water quality index method in Lake Poyang: The largest freshwater lake in China. Sci. Rep. 2017, 7, 17999. [Google Scholar] [CrossRef] [PubMed] [Green Version]
- Moreira, S.; Schultze, M.; Rahn, K.; Boehrer, B. A practical approach to lake water density from electrical conductivity and temperature. Hydrol. Earth Syst. Sci. 2016, 20, 2975–2986. [Google Scholar] [CrossRef] [Green Version]
- Zhi, H.; Zhao, Z.; Zhang, L. The fate of polycyclic aromatic hydrocarbons (PAHs) and organochlorine pesticides (OCPs) in water from Poyang Lake, the largest freshwater lake in China. Chemosphere 2015, 119, 1134–1140. [Google Scholar] [CrossRef] [PubMed]
- Xu, Y.; Zhang, C.; Oxynos, K.; Schmitzer, J.; Kettrup, A. Hexachlorocyclohexane (HCH) Residues in Ya-Er Lake Area, China. Int. J. Environ. Anal. Chem. 2006, 57, 53–61. [Google Scholar] [CrossRef]
- Zhang, H.; Jiang, Y.H.; Ding, M.J.; Xie, Z.L. Level, source identification, and risk analysis of heavy metal in surface sediments from river-lake ecosystems in the Poyang Lake, China. Environ. Sci. Pollut. Res. 2017, 24, 21902–21916. [Google Scholar] [CrossRef] [PubMed]
- Boersma, M. The nutritional quality of P-limited algae for Daphnia. Limnol. Oceanogr. 2000, 45, 1157–1161. [Google Scholar] [CrossRef] [Green Version]
- Minutoli, R.; Granata, A.; Guglielmo, L. Potential use of ecotoxicological biomarkers in Serratella ignita (Ephemeroptera) larvae for Alcantara river (Sicily, Italy) water quality assessment. J. Limnol. 2013, 72, 394–399. [Google Scholar] [CrossRef]
- Wang, B.X.; Yang, L.F. A study on tolerance values of the benthic macroinvertebrate taxa in eastern China. Acta Ecol. Sin. 2004, 24, 2768–2775. (In Chinese) [Google Scholar]
- Onaindia, M.; De Bikuna, B.G.; Benito, I. Aquatic plants in relation to environmental factors in northern Spain. J. Environ. Manag. 1996, 42, 123–137. [Google Scholar] [CrossRef]
- Hurley, L.M. Submerged Aquatic Vegetation. In Habitat Requirements for Chesapeake Bay Living Resources, 2nd ed.; Funderbunk, S.L., Jordan, S.J., Mihursky, J.A., Riley, D., Eds.; Chesapeake Research Consortium, Inc.: Solomons, MD, USA, 1991; pp. 1–19. [Google Scholar]
- Orth, R.J.; Moore, K.A. Chesapeake bay: An unprecedented decline in submerged aquatic vegetation. Science 1983, 222, 51–53. [Google Scholar] [CrossRef] [PubMed]
- Huang, L.L.; Wu, Z.Q.; Li, J.H. Fish fauna, biogeography and conservation of freshwater fish in Poyang Lake Basin, China. Environ. Biol. Fishes 2011, 96, 1229–1243. [Google Scholar] [CrossRef]
- Duan, X.B.; Liu, S.P.; Huang, M.G.; Qiu, S.L.; Li, Z.H.; Wang, K.; Chen, D.Q. Changes in abundance of larvae of the four domestic Chinese carps in the middle reach of the Yangtze River, China, before and after closing of the Three Gorges Dam. Environ. Biol. Fishes 2009, 86, 13–22. [Google Scholar] [CrossRef]
- Shao, M.Q.; Guo, H.; Jiang, J.H. Population sizes and group characteristics of Siberian Crane (Leuco-geranus leucogeranus) and Hooded Crane (Grus monacha) in Poyang Lake Wetland. Zool. Res. 2014, 35, 373–379. [Google Scholar] [CrossRef] [PubMed]
- Chen, B.; Cui, P.; Xu, H.G.; Lu, X.G.; Lei, J.C.; Wu, Y.; Shao, M.Q.; Ding, H.; Wu, J.; Cao, M.C. Assessing the suitabihlity of abitat for wintering Siberian cranes (Leucogeranus leucogeranus) at different water levels in Poyang Lake area, China. Pol. J. Ecol. 2016, 64, 84–97. [Google Scholar] [CrossRef]
- Leeuw, J.D.; Shankman, D.; Wu, G.F.; De Boer, W.F.; Burnham, J.; He, Q.; Yesou, H.; Xiao, J. Strategic assessment of the magnitude and impacts of sand mining in Poyang Lake, China. Reg. Environ. Chang. 2009, 10, 95–102. [Google Scholar] [CrossRef] [Green Version]
- Wang, X.L.; Xu, L.G.; Wan, R.R.; Chen, Y.W. Seasonal variations of soil microbial biomass within two typical wetland areas along the vegetation gradient of Poyang Lake, China. Catena 2016, 137, 483–493. [Google Scholar] [CrossRef]
- Tam, M.C.Y.; Tummala, V.M.R. An application of the AHP in vendor selection of a telecommunications system. Omega 2001, 29, 171–182. [Google Scholar] [CrossRef]
- Saaty, T.L. Decision-making with the AHP: Why is the principal eigenvector necessary. Eur. J. Oper. Res. 2003, 145, 85–91. [Google Scholar] [CrossRef]
- Wei, C.C.; Chien, C.F.; Wang, M.J.J. An AHP-based approach to ERP system selection. Int. J. Prod. Econ. 2005, 96, 47–62. [Google Scholar] [CrossRef]
- Zhang, Q.; Werner, A.D. Hysteretic relationships in inundation dynamics for a large lake–floodplain system. J. Hydrol. 2015, 527, 160–171. [Google Scholar] [CrossRef]
- Stoddard, J.L.; Larsen, D.P.; Hawkin, C.P.; Johnson, R.K.; Norris, R.H. Setting expectations for the ecological condition of stream: The concept of reference condition. Ecol. Appl. 2006, 16, 1267–1276. [Google Scholar] [CrossRef]
- Stoddard, J.L.; Herlihy, A.T.; Peck, D.V.; Hughes, R.M.; Whittier, T.R.; Tarquinio, E. A process for creating multimetric indices for large-scale aquatic surveys. J. N. Am. Benthol. Soc. 2008, 27, 878–891. [Google Scholar] [CrossRef]
- Hering, D.; Feld, C.K.; Moog, O.; Ofenböck, T. Cook book for the development of a Multimetric Index for biological condition of aquatic ecosystems: Experiences from the European AQEM and STAR projects and related initiatives. Hydrobiologia 2006, 566, 311–324. [Google Scholar] [CrossRef]
- Barbour, M.T.; Gerritsen, J.; Griffith, G.E. A framework for biological criteria for Florida streams using benthic macroinvertebrates. J. N. Am. Benthol. Soc. 1996, 15, 185–211. [Google Scholar] [CrossRef]
- Wu, N.C.; Cai, Q.H.; Fohrer, N. Development and evaluation of a diatom-based index of biotic integrity (D-IBI) for rivers impacted by run-of-river dams. Ecol. Indic. 2012, 18, 108–117. [Google Scholar] [CrossRef] [Green Version]
- De Leo, G.A.; Levin, S. The multifaceted aspects of ecosystem integrity. Conserv. Ecol. 1997, 1, 3. [Google Scholar] [CrossRef]
- Yang, Z.P.; Wang, L.Q.; Liang, T.; Huang, M.X. Nitrogen distribution and ammonia release from the overlying water and sediments of Poyang Lake, China. Environ. Earth Sci. 2015, 74, 771–778. [Google Scholar] [CrossRef] [Green Version]
- Zhang, Q.H.; Dong, X.H.; Chen, Y.W.; Yang, X.D. Hydrological alterations as the major driver on environmental change in a floodplain Lake Poyang (China): Evidence from monitoring and sediment records. J. Gt. Lakes Res. 2018, 44, 377–387. [Google Scholar] [CrossRef]
- Xu, F.L.; Zhao, Z.Y.; Zhan, W.; Zhao, S.S.; Dawson, R.W.; Tao, S. An ecosystem health index methodology (EHIM) for lake ecosystem health assessment. Ecol. Model. 2005, 188, 327–339. [Google Scholar] [CrossRef]
- Xu, F.L.; Li, Y.L.; Wang, Y.; He, W.; Kong, X.Z.; Qin, N.; Liu, W.X.; Wu, W.J.; Jorgensen, S.E. Key issues for the development and application of the species sensitivity distribution (SSD) model for ecological risk assessment. Ecol. Indic. 2015, 54, 227–237. [Google Scholar] [CrossRef]
- Xu, F.L.; Dawson, R.W.; Tao, S.; Cao, J.; Li, B.G. Amethod for lake ecosystem health assessment: An Ecological ModelingMethod (EMM) and its application. Hydrobiologia 2001, 443, 159–175. [Google Scholar] [CrossRef]
Figure 1.
Location, bathymetry and connecting rivers of Lake Poyang, China.

Figure 2.
List of indicators, and their weights and threshold values used in LP-EHI.

Figure 3.
Small black squares represent median numbers. Boxes represent interquartile ranges (box-and-whisker plots of each plankton metric: blue-green algae (a), BP phytoplankton (b), BP zooplankton (c), BP benthic macroinvertebrate (d), FBI (e), and large Daphnia (f) used to discriminate between reference and impaired sites; 25–75% percentiles). Range bars represent maximum and minimum values.


Table 1.
Water level at five hydrological stations in 2014.
| Station | Highest Water Level (m) | Date for Highest Water Level | Lowest Water Level (m) | Date for Lowest Water Level | Average Water Level (m) |
|---|---|---|---|---|---|
| Hukou | 18.58 | 26 July | 7.29 | 11 February | 12.60 |
| Xingzi | 18.57 | 26 July | 7.32 | 31 January | 12.72 |
| Duchang | 18.58 | 26 July | 7.60 | 1 February | 12.94 |
| Tangyin | 18.58 | 27 July | 11.04 | 3 February | 14.12 |
| Kangshan | 18.53 | 26 July | 12.17 | 5 February | 14.78 |
Table 2.
Ecological indicators and their relative health status, methods and data source.
| Target Level A | Sub-Target Level B | Element Level C | Assessment Indicator Level D | Relative Health Status 1 | Method for Indicator Values 2 | Data Source 3 | |
|---|---|---|---|---|---|---|---|
| Good | Bad | ||||||
| LP-EHI A1 | Natural properties B1 | Physical integrity C1 | Water level D1 | ↑↓ | ↑↓ | a, b | I |
| Tributary connectivity D2 | ↑ | ↓ | a, b | VI | |||
| Lake area D3 | ↑ | ↓ | a, b | III | |||
| Runoff D4 | ↑↓ | ↑↓ | a, b | I | |||
| Coastal habitat D5 | ↑ | ↓ | a, b | IV | |||
| Chemical integrity C2 | Water quality D6 | ↓ | ↑ | a | I | ||
| Nutrition D7 | ↓ | ↑ | a, b | I | |||
| Toxicity D8 | ↓ | ↑ | a | VI | |||
| Biological integrity C3 | Phytoplankton D9 | ↓ | ↑ | a, b | II | ||
| Zooplankton D10 | ↑↓ | ↑↓ | a, b | II | |||
| Benthic macroinvertebrate D11 | ↓ | ↑ | a, b | II | |||
| Wetland plants D12 | ↑ | ↓ | a | VI | |||
| Fish D13 | ↑↓ | ↑↓ | a, b | VI | |||
| Bird D14 | ↑ | ↓ | a | III | |||
| Social service B2 | Human health C4 | Drinking water D15 | ↑ | ↓ | a, b | V | |
| Pathogenic potential D16 | ↓ | ↑ | a, b | VI | |||
| Regulation C5 | Flood storage capacity D17 | ↑ | ↓ | a, b | I | ||
| Human activity C6 | Sand mining D18 | ↓ | ↑ | a | V | ||
| Response C7 | Dish-shaped sub-lake areas under management D19 | ↑ | ↓ | a, b | III | ||
1 ↑/↓: the indicator has positive/negative relationship with health status; ↑↓: the indicator has no fixed positive and negative relationship with health status; 2 a: measure; b: calculate; 3 data from I:field observation by Jiangxi Province Poyang Lake hydrology bureau; II: field observation by Lake Poyang Wetland Observation and Research station; III: field observation by Jiangxi Ecological Civilization Research and Promotion Association; IV: field observation by Jiangxi Normal University; V: statistical data by Jiangxi Hydraulic Research Institute; VI: literature.
Table 3.
Comparison of indicators for the Great Lakes in North American and five largest freshwater lakes in China.
Table 3.
Comparison of indicators for the Great Lakes in North American and five largest freshwater lakes in China.
| Used in LP-EHI | The Great Lakes in North American | Large Lakes in China | ||||||||
|---|---|---|---|---|---|---|---|---|---|---|
| Lake Superior | Lake Michigan | Lake Huron | Lake Erie | Lake Ontario | Lake Poyang | Lake Dongting | Lake Taihu | Lake Chaohu | Lake Hongze | |
| Water level | Y 1 | Y | Y | Y | Y | Y | N | N | N | N |
| Tributary | Y | Y | Y | Y | Y | Y | Y | Y | Y | N |
| Lake area | Y | Y | Y | Y | Y | Y | Y | Y | Y | N |
| Runoff | N | N | N | N | N | N | Y | N | N | N |
| Coastal habitat | Y | Y | Y | Y | Y | N | N | N | N | N |
| Water quality | Y | Y | Y | Y | Y | Y | Y | Y | Y | Y |
| Nutrition | Y | Y | Y | Y | Y | Y | Y | Y | Y | Y |
| Toxicity | Y | Y | Y | Y | Y | N | N | N | N | N |
| Phytoplankton | Y | Y | Y | Y | Y | Y | Y | Y | Y | N |
| Zooplankton | Y | Y | Y | Y | Y | N | N | N | Y | N |
| Benthic macroinvertebrate | Y | Y | Y | Y | Y | Y | Y | Y | Y | N |
| Wetland plants | Y | Y | Y | Y | Y | N | Y | N | Y | N |
| Fish | Y | Y | Y | Y | Y | Y | Y | Y | Y | N |
| Birds | Y | Y | Y | Y | Y | N | N | N | N | N |
| Drinking water | Y | Y | Y | Y | Y | N | N | N | N | N |
| Pathogenic potential | Y | Y | Y | Y | Y | N | Y | N | N | N |
| Flood storage capacity | N | N | N | N | N | N | N | N | N | N |
| Sand mining | N | N | N | N | N | N | N | N | N | N |
| Sub-lake | N | N | N | N | N | N | N | N | N | N |
1 Y: used; N: not used.
Table 4.
Inter-Quartile (IQ) classes in the box-and-whisker plots.
| IQ | Description |
|---|---|
| 3 | No overlap of interquartile ranges. |
| 2 | Some overlap of interquartile ranges but both medians are outside the interquartile range overlap. |
| 1 | Moderate overlap of interquartile ranges but at least one median is outside the interquartile range overlap. |
| 0 | (a) Extensive overlap of interquartile range or (b) both medians within the overlap. |
© 2018 by the authors. Licensee MDPI, Basel, Switzerland. This article is an open access article distributed under the terms and conditions of the Creative Commons Attribution (CC BY) license (http://creativecommons.org/licenses/by/4.0/).
Share and Cite
MDPI and ACS Style
Qi, L.; Huang, J.; Huang, Q.; Gao, J.; Wang, S.; Guo, Y. Assessing Aquatic Ecological Health for Lake Poyang, China: Part I Index Development. Water 2018, 10, 943. https://doi.org/10.3390/w10070943
AMA Style
Qi L, Huang J, Huang Q, Gao J, Wang S, Guo Y. Assessing Aquatic Ecological Health for Lake Poyang, China: Part I Index Development. Water. 2018; 10(7):943. https://doi.org/10.3390/w10070943
Chicago/Turabian StyleQi, Lingyan, Jiacong Huang, Qi Huang, Junfeng Gao, Shigang Wang, and Yuyin Guo. 2018. "Assessing Aquatic Ecological Health for Lake Poyang, China: Part I Index Development" Water 10, no. 7: 943. https://doi.org/10.3390/w10070943
Note that from the first issue of 2016, this journal uses article numbers instead of page numbers. See further details here.