Physico-chemical Characteristics of Corrosion Scales from Different Pipes in Drinking Water Distribution Systems

1
State Key Laboratory of Hydroscience and Engineering, Tsinghua University, Beijing 100084, China
2
Southwest University of Science and Technology, 59 Qinglong Road, Mianyang 621010, Sichuan, China
*
Author to whom correspondence should be addressed.
Water 2018, 10(7), 931; https://doi.org/10.3390/w10070931
Submission received: 20 June 2018
/
Revised: 11 July 2018
/
Accepted: 12 July 2018
/
Published: 13 July 2018
(This article belongs to the Special Issue Potable Water: Quality of Raw Water and Finished Potable Water, Production of Potable Water, Contaminations of Potable Water)
Abstract
:Corrosion scales formed on iron pipe surfaces are an important factor defining water quality in drinking water distribution systems, since they would release contaminants and cause water discoloration at transient hydrodynamic regimes. Consequently, characterization of corrosion scales is indispensable to water quality protection. In this study, corrosion products were carefully collected from three old, corroded iron pipes made of different materials and exposed to different water qualities and operation conditions. Physico-chemical characteristics of these scales were determined using Scanning Electron Microscope (SEM), Energy Dispersive X-ray Spectroscopy (EDS), Inductively Coupled Plasma (ICP), X-ray Diffraction (XRD) and X-ray Photoelectron Spectroscopy (XPS). Testing results show that scale characteristics, including micromorphology, porosity and composition, vary significantly due to different pipe materials, water qualities and hydraulic conditions. Zinc coatings in galvanized pipes contribute to metal corrosion prevention, while attention should be paid to zinc release. High corrosive surface water facilitates the formation of developed corrosion tubercles, in which the compact shell-like layer conduces to maintain the structural stability of corrosion scales under disturbance. Structural breaks and low-velocity zones in water distribution systems might be in high potential of contaminant release, since the inhomogeneous materials and unusual hydraulic conditions would result in unstable scale characteristics.
1. Introduction
Corrosion scales affect water quality in drinking water distribution systems via several mechanisms. They act as sinks for contaminant accumulation, harbor microbial growth and as a result they may release contaminants back to the ambient water causing the deterioration of its quality, especially in changing hydrodynamic conditions [1,2,3,4,5,6,7,8,9,10,11,12,13,14,15]. Accordingly, characterization of corrosion scales is essential to understand metal release processes in drinking water networks and to protect water quality.
Metal corrosion in pipe distribution systems includes general corrosion-producing uniform scales and local corrosion which results in the development of corrosion tubercles [16,17,18,19,20]. Typical mature corrosion tubercles usually consist of four layers: a corroded metal floor, an inner porous core layer directly contacting with pipe wall, a compact shell-like layer enveloping the core layer and a loosely deposited layer on solid-liquid interface [4,19,20,21]. Scales sampled from different layers of the same tubercle have different microscopic features and compositions. Generally, the inner core layer contains ferrous and ferric materials, while the outer shell-like layer, which contacts with bulk water that is abundant in dissolved oxygen, mainly consists of ferric ones [4,20].
Physical and chemical characteristics of corrosion scales remarkably influence the variation of water quality during water delivery [3,4,8,13,14,21,22]. Fe, O and C are confirmed as the predominant elements in corrosion scales formed on old, corroded iron pipes, with notable levels of Ca, S, Mn, Zn, P, Mg, Al and trace metal elements [1,10,14,19,22,23]. Efforts to identify crystalline phases comprising such scales have shown that goethite (α-FeOOH), magnetite (Fe3O4) and lepidocrocite (γ-FeOOH) tend to be dominant, while siderite (FeCO3), hematite (Fe2O3), green rusts (hydrated ferrous-ferric compounds containing CO32−, Cl− or SO42−), calcite (CaCO3) and quartz (SiO2) are also frequently found [1,2,3,7,10,14,19,20,21,22,23,24,25,26,27,28].
Extensive research efforts have been given to the characterization of corrosion scales and hav efound that scale properties vary significantly depending on pipe materials, water qualities and hydraulic conditions [1,3,4,10,11,13,14,19,21,22,23,29,30,31]. However, when investigating the scale formation process and contaminant accumulation-release mechanisms, factors that influence these processes are not supposed to be discussed separately. Corrosion scales were sampled from practical pipe distribution systems, in which the environmental factors are complicated and interactive.
Generally, the corrosion scale layer is much thinner in galvanized iron pipes than in unlined cast iron pipes [22]. Significant amounts of Zn and zincite (ZnO) have been frequently detected for scales formed on galvanized iron [14,19,22,23]. In addition to the accumulation from water, release and re-deposition of heavy metals, such as Cu and Mn, from pipe fittings or system joints also lead to the deposition of tenorite (CuO) and manganese oxide (MnO) in some scales [11,14,21].
Ca and calcite have been consistently observed in corrosion scales formed on pipes exposed to water with high hardness [10,14,32,33]. Surface water, which usually contains more chloride and sulfate and is identified as a corrosive water source, conduces to form compact corrosion scales with high magnetite content [21,29]. It is reported that corrosion scales in pipes transporting groundwater are relatively thin and smooth as well as have a higher content of amorphous iron materials [21].
Increased shear stress applied to the corrosion scales by increased flow results in notable impacts on scale characteristics and its water discoloration potential [31,34,35,36,37,38,39]. Furthermore, hydraulic conditions influence the convective transport to the surface, diffusion of oxidants at the interface, as well as the transfer of species accelerating or inhibiting corrosion of pipe surfaces [3,4,14,29,31,40]. All these processes are critical to determining the rate of growth and characteristics of the corrosion scales.
In this study, three pipe systems typical for different pipe materials, pipe operation conditions and transporting water qualities were adopted for comparison. Corrosion scales were sampled from the old, corroded iron pipes and characterized using several sophisticated techniques. The primary objective is to investigate how the combination of internal-external factors influences metal corrosion and scale development in pipes, which is essential to protect water quality stability in drinking water distribution systems.
2. Materials and Methods
2.1. Sample Collection
Nine groups of corrosion scale samples were collected from different pipes, different positions in distribution systems and different layers of scales, as summarized in Table 1. Figure 1 shows the pipe sections and the corrosion scales on pipe surfaces.
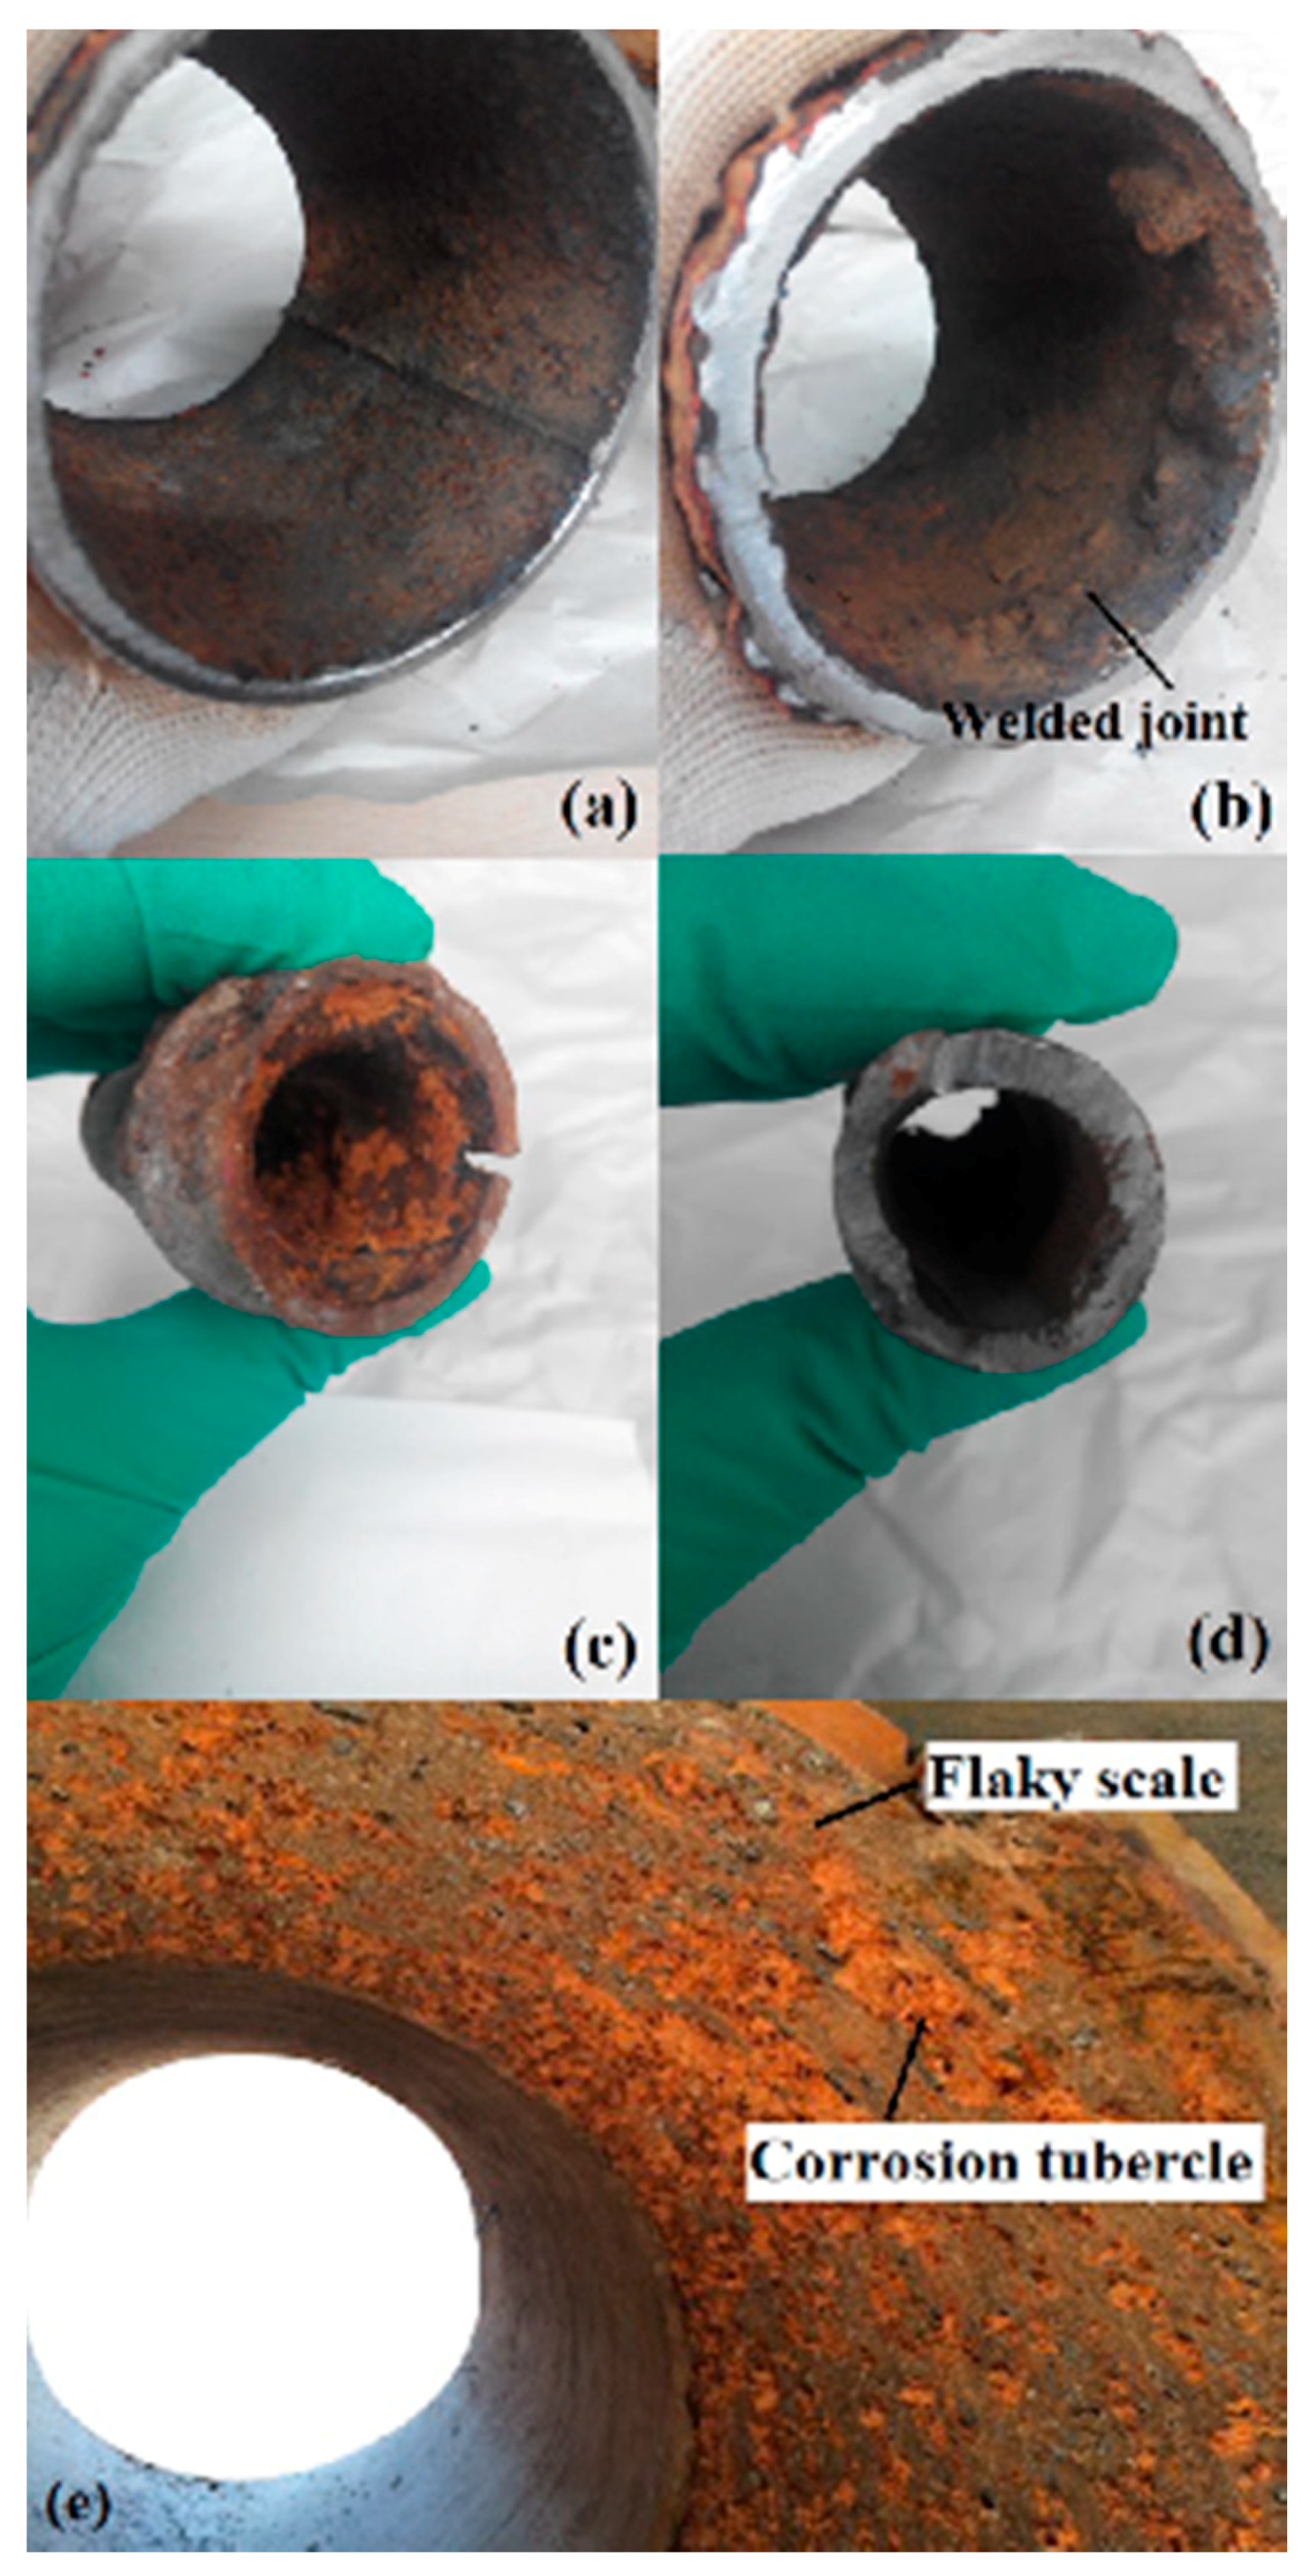
Samples 1#, 2# and 3# were taken from a hybrid pipe section (Pipe A), which was described in detail in the previous research [14]. This pipe, which is assembled of an unlined cast iron section and galvanized iron section by a welded joint, served an experimental water delivery system in Tsinghua University, Beijing, China and transported water intermittently as required. Pipe A is an excellent research object highly suitable for comparing corrosion mechanisms of different pipe materials exposed to the same water quality [14] and ascertaining the element release from pipe joints and their re-deposition on the adjacent surfaces. Samples 1# and 3# were taken from unlined cast iron pipe and galvanized iron pipe segments, respectively. Sample 2# was from the hybrid pipe section, which contained the welded joint (Figure 1b).
Samples 4# and 5# were derived from different positions of a galvanized iron service pipe system (Pipe B) in Tsinghua University. Sample 4# was taken from the screw connecting section (Figure 1c), which is out of zinc coating locally, while Sample 5# was from the straight pipe section (Figure 1d).
Pipe C originates from the water delivery trunk mains, which were made of unlined cast iron, in Zhengzhou City, Henan Province, China. Samples 6#, 7# and 8# were representative for the corrosion tubercles, as shown in Figure 1e, while Sample 9# was prepared from the flaky scales. Samples 6#, 7# and 8# were taken from the inner, middle and outer layers of well-developed corrosion tubercles, respectively.
2.2. Water Quality
The water sources supplied in Tsinghua University and Zhengzhou City are groundwater and surface water, respectively. In the past, water supplied in Zhengzhou City was taken from the Yellow River. Since December, 2014, the water source has been switched into the Danjiangkou Reservoir water transferred by the South-to-North Water Diversion Project. Corrosion scales in Pipe C were sampled and analyzed on April, 2016. In other words, Pipe C has worked with the Yellow River water for nearly 30 years and the Danjiangkou Reservoir water for around 1.5 years before replacement.
Summarization of source water quality is given in Table 2. The primary difference is the abundance of chloride and sulfate in the Yellow River water, which could be considered as high corrosivity water according to its Larson Ratio [29]. It is also reported that exposure of iron to highly corrosive water leads to the formation of developed corrosion scales [21]. As shown in Figure 1, Pipe C was more heavily corroded than Pipe A and Pipe B. Corrosion scales in Pipe C were more developed, with the existence of layered tubercles.
2.3. Scale Analysis
Corrosion scale samples were dried under vacuum at about 20 °C immediately after extraction. Thereafter, they were pulverized using an agate mortar and pestle for analysis.
Microstructures and elemental compositions of the scale samples were observed by Scanning Electron Microscope and Energy Dispersive X-ray Spectroscopy (SEM-EDS, Hitachi SU8010, Tokyo, Japan). SEM technique is conducted under high vacuum condition and used for material analyses of surface micromorphology and particle size. Elemental composition in a small area can be qualitatively or quantitively measured by EDS to determine the solid phase.
The NOVA 2000e surface area and porosity analyzer (Quantachrome Co., Boynton Beach, FL, USA) was used to determine the specific surface area and porosity of the corrosion scales by N2 gas adsorption and desorption. The scale samples were degassed at 120 °C prior to analysis.
The method of Inductively Coupled Plasma (ICP) is widely used in analytical chemistry to quantitively determine the inorganic elements in solutions and digested solids. Scale samples were digested by inorganic acid and analyzed by ICP (Agilent 7500ce, Santa Clara, CA, USA) to investigate the elemental composition.
The X-ray Diffraction (XRD, Bruker D8 Advance, Bruker, Germany) was conducted on the powder samples using Cu Kα radiation, with the 2θ ranged from 10° to 80°. Diffraction data determined by XRD were compared against reference patterns from International Center for Diffraction Data (ICDD) to identify the crystalline phase composition of corrosion scales.
X-ray Photoelectron Spectroscopy (XPS) technique, with the sampling depth of only several nanometers, is surface-sensitive and always used for qualitive determination and valence analysis of surface elements in solid samples. Corrosion scales were determined by XPS (Thermo Scientific K-Alpha, Fremont, CA, USA) analysis and comparison with the NIST XPS Database. Non-linear least squares fitting of deconvolution of Fe (2p3/2) was conducted to investigate the relative amount of different iron species in the samples.
3. Results
3.1. Physical Characteristics
3.1.1. Apparent Description
As shown in Figure 1a,b, corrosion scale layers inside Pipe A are very thin, with a thickness of only a few millimeters or less than a millimeter. These dark black samples are hard and difficult to be pulverized. Sample 2# seems more developed, compared with Sample 1# and Sample 3#, and there appears to be some bumps.
On the contrary, scale samples from Pipe B, presenting yellowish-brown, are easy to be peeled off and pulverized. It can be found from Figure 1c,d that scale layer is much thicker inside the screw section than inside the straight section. No layered structure could be identified in the corrosion scales from Pipe A or Pipe B.
As shown in Figure 1e, corrosion scale layers in Pipe C are relatively well developed. All over the pipe surfaces were covered with flaky scales resulting from uniform corrosion. These flaky scales are crisp and easy to be peeled off. They are dark gray and some have an inapparent yellowish interlayer. Tuberculate scales due to local corrosion dispersedly distribute in the pipe surfaces, with an average thickness of 3 centimeters and an obvious layered structure.
Taken from the inner layer of the corrosion tubercle, Sample 6# is flake-like and fragile. Adjacent to Sample 6#, the core layer Sample 7# is enveloped by a shell layer. The inner flake layer and middle core layer are both yellowish-brown. The shell-like layer is hard and dark black, surrounding the core layer. There are some yellowish-brown particulate deposits loosely attached to the outside surface of the shell-like layer. Due to the difficulty in separating out the shell-like layer, Sample 8# is a mixture of the dominant shell-like layer and a small quantity of the inner core layer and outer deposit layer. Sample 9# was prepared from the flaky scales.
3.1.2. Micromorphology
SEM examination results show that distinctly diverse microstructures can be found in the scales from Pipe A, as discussed in detail by Li et al. [14]. Sample 1# presents lamellar, plate-like and needle-like. The micromorphology of A-HP samples shows the presence of highly diverse lamellar, needle-like, crystal-like, columnar, cottony and blocky formations. Crystal-like, lamellar, cottony, filamentous and porous spongy structures were observed in Sample 3#.
Figure 2 shows SEM micrographs of the corrosion scale samples from Pipe B and Pipe C. In contrast, the micromorphology of Pipe B and Pipe C samples seems nondescript. Some needle-like and flaky structures were observed for Sample 4# and Sample 5#. Sample 6# and Sample 8# appear globular, while Sample 7# and Sample 9# present cottony.
3.1.3. Surface Area and Porosity
Physical characteristics of the scale samples were further analyzed based on the nitrogen adsorption and desorption studies. Specific surface area, pore volume and pore size were calculated by several methods and the results were shown in Table 3. Due to the limited amount of scale samples from Pipe A and the difficulty in peeling off, surface area and porosity analysis results of these samples are absent.
On the whole, specific area, pore volume and pore size of the scales from Pipe B are all higher than those from Pipe C, indicating the comparative porosity of Sample 4# and Sample 5#. Sample 4# has a relatively lower BET-specific surface area and a higher average BET pore diameter than Sample 5# does, which manifests in that the pore size of Sample 4# is a bit higher.
As for Pipe C, the orders of surface area and pore volume appear Sample 9# < Sample 6# < Sample 8# < Sample 7#, while that of pore size shows Sample 8# ≈ Sample 7# < Sample 6# < Sample 9#. This indicates that the pores of Sample 6# and Sample 9# are larger in size but fewer in amount, resulting in the lower specific surface area.
3.2. Chemical Characteristics
3.2.1. Elemental Composition
The elemental compositions of scale samples determined by ICP are shown in Table 4. For each group of scales, more than three samples were measured and the average was given. Figure 3 illustrates the cumulative occurrence profiles of Fe, Ca and Zn determined by EDS. In consideration of the sample quantities for cumulative analysis, six profiles were plotted for each element, representing Sample 1#, Sample 2#, Sample 3#, scales from Pipe B, scale from Pipe C and the total deposits, respectively.
In general, Fe, O and C are the most prevalent elemental components in the corrosion scales, followed by Ca, Zn, S, Al, Si and so on. However, there is significant diversity among the scales from different pipes. Even apparent differences can be identified in the corrosion scales from different areas of the same pipe.
In Pipe A, elemental composition of Sample 1# is relatively uniform, while there is an evident diversity among Sample 2#, as shown in Figure 3. Fe content in Sample 1# is a bit higher than those in Sample 2# and Sample 3#. Fe content in Sample 2# covers a wide range (Figure 3a). Ca is prominent in the scales from Pipe A, especially in Sample 2# (Table 4). Cumulative Ca distribution profile in Sample 2# covers an extremely wide range (Figure 3b). Zn mainly exists in the scales from galvanized iron pipes, namely Sample 3#, Sample 4# and Sample 5# (Table 4). Sample 3# exhibits the dominance of Zn content (Figure 3c). Corrosion scales from Pipe A are comparatively abundant in Si, Mn, Pb, Ti and Cu, especially for Sample 2# (Table 4).
From Figure 3b,c, similar trends in distributions of Ca and Zn can be observed in the same group of samples, especially in Sample 1# and Sample 3#. However, the trends are significantly different between Sample 1# and Sample 3#. As shown in Figure 3c, there are two plateaus (40~50 mg/g and 420~470 mg/g) in the Zn distribution profile of Sample 3#. As for the Ca distribution profile of Sample 1# shown in Figure 3b, only one plateau (10~15 mg/g) is observed.
In Pipe C, one of the distinctive characteristics is that the order of S content shows Sample 6# > Sample 9# > Sample 7# > Sample 8#, as shown in Table 4. S content detected in Sample 6# reaches several times or even several tens of times of those in other scale samples. Compared with those from Pipe A and Pipe B, the scales extracted from Pipe C are relatively rich in S, Al, K and P.
3.2.2. Crystalline Compounds
XRD patterns of the corrosion scales are shown in Figure 4. It can be found that the crystalline compounds of scale samples are quite different from pipe to pipe. Iron materials in these corrosion scales mainly exist in amorphous state.
In Pipe A, calcite (CaCO3) is the predominant crystal in all samples, followed by magnetite (Fe3O4), maghemite (γ-Fe2O3) and goethite (α-FeOOH). Intensity of calcite in Sample 2# is much higher than those in Sample 1# and Sample 3#, while intensities of magnetite and maghemite are relatively higher in Sample 1#. Tenorite (CuO) and manganese oxide (MnO) were detected in Sample 2#, while zincite (ZnO) and hydrozincite (Zn5(CO3)2(OH)6) were detected in Sample 3#.
Crystalline compounds in the scales from Pipe B are simpler and more uniform. Goethite is the primary crystal in Sample 4# and Sample 5#, with the existence of zincite and hydrozincite.
As for Pipe C, quartz (SiO2) is the dominant crystalline compound in all scales, though distinct differences could be found among different samples. Intensity of quartz in Sample 6# is the lowest, while the highest one was detected in Sample 9#. Lepidocrocite (γ-FeOOH) was observed in Sample 6#; goethite was found in Sample 7#; magnetite, maghemite and goethite were detected in Sample 8#.
Non-linear regression using a Gaussian/Lorentzian curve was conducted on deconvolution of the Fe (2p3/2) peak determined by XPS. The peak area stands for the relative amount of iron species in corrosion scales [22]. Table 5 shows the relative percentage of magnetite, maghemite and goethite on the surfaces of scale samples.
The proportion of iron species is comparatively uniform in the corrosion scales from the same pipes. In Pipe A, goethite is prominent in Sample 1#, while magnetite is significant in Sample 2#. In the corrosion scales from Pipe B, goethite is the primary iron compound, corresponding with the XRD results. The content of magnetite and maghemite is significantly higher in Sample 4# than in Sample 5#. This corresponds to the findings by Yang et al. [21] that thicker corrosion scale has a higher ratio of magnetite/goethite. The relative proportions of magnetite, maghemite and goethite are approximate in the scales from Pipe C.
4. Discussion
Physico-chemical characteristics of corrosion scales vary significantly due to pipe materials, source water qualities, hydraulic conditions, as well as scale structures. These internal and external factors are interactive and exert a comprehensive effect on the processes of scale formation and development.
4.1. Pipe Materials
While investigating the corrosion mechanisms of different pipe materials, scale samples from Pipe A are the ideal research objects, since the same historical operation conditions of hydraulic, water quality and climatic environment could be strictly confirmed. Comparison of the physico-chemical characteristics of Sample 1#, Sample 2# and Sample 3# determined by SEM-EDS, ICP and XRD was elaborated in a previous research [14].
In general, micromorphology and chemical composition of the scales from unlined cast iron pipes are relatively uniform. Higher Fe content and intensities of magnetite and maghemite were detected in these samples. The diverse microstructures and inhomogeneous components in the scales from hybrid pipes can be interpreted as the combined structural and material effects of the welded joint. Therefore, more attention should be paid to the connecting areas in water distribution systems, which might release contaminants and give rise to colored water under disturbance.
In galvanized iron pipes, zinc coatings contribute to the prevention of metal corrosion, drawn from Figure 1c,d (Pipe screw connecting section is out of zinc coatings locally.). In the service pipes whose cross section is usually narrow, more attention should be paid to the iron corrosion and subsequent pipe obstruction as well as energy loss in some specific positions, such as screw junctions and elbows, which are generally out of zinc coatings. However, zinc coatings would result in higher zinc compounds in corrosion scales and zinc release, which should also come into notice [14].
4.2. Water Sources
Corrosion scales in this study were collected from different pipe distribution systems, whose source water qualities differ, as shown in Table 1. Surface water source from the Yellow River is abundant in chloride and sulfate and identified as high corrosive water.
Compared with those from the other two pipes, corrosion scale layers in Pipe C are far more developed. According to Table 3, scale samples in Pipe B possess higher porosity than those in Pipe C do, from the perspectives of specific area, pore volume and pore size. This verifies that the high corrosive surface water leads to the formation of developed and compact corrosion scales [21].
The high abundance of Ca (Table 4 and Figure 3b) in scales from Pipe A is correlated with the prevalence of calcite (Figure 4a–c). This may be associated with the precipitation of calcium carbonate from the high-alkalinity groundwater source [10,14,32,33].
Comparatively, corrosion scales extracted from Pipe C are rich in S (Table 4). As shown in Table 1, water from the Yellow River, which Pipe C historically transported for a long period of time, is rich in sulfate and this appears to have led to the abundance of S in the corrosion scales. However, S content is extremely different from layer to layer in the corrosion tubercles, appearing inner layer > middle layer > outer layer, which resulted from the water source switch in Zhengzhou City. Water from the Danjiangkou Reservoir is low in sulfate and altered the composition of corrosion scales, even though the exposure period is less than 1.5 years. Owing to the protection from the compact shell-like layer, the effect on the inner layer is relatively insignificant, resulting in the stratification of S content in corrosion tubercles.
4.3. Structures of Corrosion Scales
In Pipe C, the flaky scale layers resulted from uniform corrosion and the tuberculate scales due to local corrosion possess totally different characteristics.
The flaky scales, namely Sample 9#, have the smallest specific surface area and pore volume and the biggest pore size, indicating that the pores are larger in size but fewer in amount. Similarly with Sample 6#, the inner layer of the corrosion tubercles. The outer and middle layers of the corrosion tubercle are relatively compact, with well-developed microporosity. This is consistent with the typical layered corrosion tubercle model developed in the previous researches [4,19,21], verifying the protective effect of the outer shell-like layer.
According to Figure 4, iron materials detected in different layers of the corrosion tubercles also differ, with lepidocrocite in the inner layer; goethite in the middle layer; and magnetite, maghemite, goethite in the outer layer. This verifies the previous report that magnetite and goethite are the main iron substances in the dense shell-like layer [19,24].
Overall speaking, high corrosive surface water facilitates the formation of developed corrosion tubercles, in which the compact shell-like layer contributes to maintain the structural stability of corrosion scales under disturbance.
4.4. Hydraulic Conditions
Distinctly different from the normal yellowish-brown ones, the dark black corrosion scales in Pipe A are very thin and difficult to be peeled off and pulverized. Besides, microstructures of these scales are extremely diverse and non-uniform. This might be related to the stagnation condition or even out-of-water that the pipe often underwent, since this pipe transported water intermittently to the experimental system as required. Microbial activities under low oxygen conditions during the stagnant period might contribute to the strange apparent characteristics and micromorphology in Pipe A, which needs further investigation.
As discussed afore, corrosion scales from Pipe A, which transported groundwater, are abundant in calcite. The relatively higher calcite content in corrosion scales from the pipes transporting groundwater have also been shown in other research [21]. However, to our knowledge, no research has found that calcite plays a predominant role in crystalline compositions. Few calcium or calcite was determined in scale samples from Pipe B that transported the same water as Pipe A. It is speculated that the intermittent operation condition in Pipe A contributes to the absorption of calcium and crystallization of calcite.
Zn content is significantly higher in Sample 3# than in Sample 4# (Table 4 and Figure 3c), despite the fact that they were both scrapings from galvanized iron pipe sections. The flowing water in Pipe B renews water body to deliver sufficient oxidants to the pipe surfaces [3,40], enhancing the oxidation of pipe metal and development of corrosion scales, resulting in the relatively low Zn proportion. Inversely, due to the low velocity and frequent stagnation condition, corrosion scales in Pipe A are undeveloped and unstable. The Zn distribution profile of Sample 3# with two plateaus, as shown in Figure 3c, indicates that Zn presents in the scales in two different corrosion statuses. Employed as a sacrificial protective layer, zinc coating is oxidized prior to the underlying iron substrate, leading to the plateau of high Zn content in corrosion scales. After depletion of zinc coating locally, the exposed iron substrate is oxidized and participates in the development of corrosion scales, resulting in the plateau of low Zn content. This can be confirmed from Figure 3a, that two plateaus can also be observed in the Fe distribution profile of Sample 3#.
As shown in Table 1, Pipe B is a galvanized service pipe. Sample 4# was taken from the screw connecting section, which is out of zinc coatings locally and has a sudden increase in cross section. However, the contents of Zn and its compounds are significant in Sample 4#, they even exceed those in Sample 5# (Table 4 and Figure 4). This indicates that zinc from the coatings or corrosion scales in the straight pipe section would be dissolved or scoured off by the water flow and precipitate in the screw section. The vortex brought about by the sudden change of flow pathway facilitates particle precipitation [31,34,35,36,37,38,39]. It also indirectly reveals the release-deposit process of metal inside the pipe distribution systems [1,2,3,4,5,6,14].
In consequence, pipe operation and hydraulic conditions remarkably influence the formation of corrosion scales. In the low-velocity zones or dead ends of drinking water distribution systems, characteristics of corrosion scales are diverse and unstable. Structural breaks in the pipe distribution systems, such as connection joints and elbows, would act as harbors for contaminant accumulation and development of corrosion tubercles, due to the combined effect of inhomogeneous pipe materials and unusual hydraulic conditions. Stricter protection is required in these fragile areas, since they are in high risk of contaminant release in changing hydrodynamic conditions and might become threats to human health [3,14].
5. Conclusions
Physico-chemical characteristics of corrosion scales sampled from drinking water pipe systems were determined using several sophisticated techniques. It can be concluded that scale characteristics, including micromorphology, porosity and composition, vary significantly due to different pipe materials, water qualities and hydraulic conditions. Zinc coatings in galvanized iron pipes would lead to zinc release in drinking water, though they are conductive to prevention of metal corrosion. Corrosion tubercles developed under high corrosive surface water possess stronger resistance to contaminant release under disturbance, thanks to the protection of the compact shell-like layer. Stricter protection is required to the structural breaks and low-velocity zones in pipe systems, where the inhomogeneous pipe materials and unusual hydraulic conditions would result in unstable scale characteristics. These areas are always in high risk of contaminant release under disturbance and might become threats to human health. The findings in this study could be applied in protection of water quality stability in drinking water distribution systems.
Author Contributions
Conceptualization, M.L., Z.L. and Y.C.; Data curation, M.L. and Z.L.; Formal analysis, M.L.; Funding acquisition, Z.L. and Y.C.; Investigation, M.L.; Methodology, M.L., Z.L. and Y.C.; Project administration, Z.L. and Y.C.; Resources, Z.L. and Y.C.; Supervision, Z.L. and Y.C.; Validation, M.L. and Z.L.; Visualization, M.L. and Z.L.; Writing—original draft, M.L. and Z.L.; Writing—review & editing, M.L., Z.L. and Y.C.
Funding
This research received no external funding.
Acknowledgments
This work was supported by National Science and Technology Support Project of China (No. 2016YFC0502204), the National Natural Science Foundation of China (No. 51579130 and No. 91647116), and Tsinghua University Initiative Scientific Research Program (No. 2014z09112).
Conflicts of Interest
The authors declare no conflict of interest.
References
- Tuovinen, O.H.; Button, K.S.; Vuorinen, A.; Carlson, L.; Mair, D.M.; Yut, L.A. Bacterial, chemical, and mineralogical characteristics of tubercles in distribution pipelines. J. Am. Water Works Assoc. 1980, 72, 626–635. [Google Scholar] [CrossRef]
- Lytle, D.A.; Sorg, T.J.; Frietch, C. Accumulation of arsenic in drinking water distribution systems. Environ. Sci. Technol. 2004, 38, 5365–5372. [Google Scholar] [CrossRef] [PubMed]
- Sarin, P.; Snoeyink, V.L.; Bebee, J.; Jim, K.K.; Beckett, M.A.; Kriven, W.M.; Clement, J.A. Iron release from corroded iron pipes in drinking water distribution systems: Effect of dissolved oxygen. Water Res. 2004, 38, 1259–1269. [Google Scholar] [CrossRef] [PubMed]
- Sarin, P.; Snoeyink, V.L.; Lytle, D.A.; Kriven, W.M. Iron corrosion scales: Model for scale growth, iron release, and colored water formation. J. Environ. Eng. 2004, 130, 364–373. [Google Scholar] [CrossRef]
- Imran, S.A.; Dietz, J.D.; Mutoti, G.; Taylor, J.S.; Randall, A.A.; Cooper, C.D. Red water release in drinking water distribution systems. J. Am. Water Works Assoc. 2005, 97, 93–100. [Google Scholar] [CrossRef]
- Imran, S.A.; Dietz, J.D.; Mutoti, G.; Xiao, W.Z.; Taylor, J.S.; Desai, V. Optimizing source water blends for corrosion and residual control in distribution systems. J. Am. Water Works Assoc. 2006, 98, 107–115. [Google Scholar] [CrossRef] [Green Version]
- Gerke, T.L.; Maynard, J.B.; Schock, M.R.; Lytle, D.L. Physiochemical characterization of five iron tubercles from a single drinking water distribution system: Possible new insights on their formation and growth. Corros. Sci. 2008, 50, 2030–2039. [Google Scholar] [CrossRef]
- Schock, M.R.; Hyland, R.N.; Welch, M.M. Occurrence of contaminant accumulation in lead pipe scales from domestic drinking water distribution systems. Environ. Sci. Technol. 2008, 42, 4285–4291. [Google Scholar] [CrossRef] [PubMed]
- Kim, E.J.; Herrera, J.E. Characteristics of lead corrosion scales formed during drinking water distribution and their potential influence on the release of lead and other contaminants. Environ. Sci. Technol. 2010, 44, 6054–6061. [Google Scholar] [CrossRef] [PubMed]
- Peng, C.Y.; Korshin, G.V.; Valentine, R.L.; Hill, A.S.; Friedman, M.J.; Reiber, S.H. Characterization of elemental and structural composition of corrosion scales and deposits formed in drinking water distribution systems. Water Res. 2010, 44, 4570–4580. [Google Scholar] [CrossRef] [PubMed]
- Peng, C.Y.; Hill, A.S.; Friedman, M.J.; Valentine, R.L.; Larson, G.S.; Romero, A.M.Y.; Reiber, S.H.; Korshin, G.V. Occurrence of trace inorganic contaminants in drinking water distribution systems. J. Am. Water Works Assoc. 2012, 104, 181–193. [Google Scholar] [CrossRef]
- Gerke, T.L.; Little, B.J.; Luxton, T.P.; Scheckel, K.G.; Maynard, J.B. Strontium concentrations in corrosion products from residential drinking water distribution systems. Environ. Sci. Technol. 2013, 47, 5171–5177. [Google Scholar] [CrossRef] [PubMed]
- Wang, H.; Masters, S.; Edwards, M.A.; Falkinham, J.O.; Pruden, A. Effect of disinfectant, water age, and pipe materials on bacterial and eukaryotic community structure in drinking water biofilm. Environ. Sci. Technol. 2014, 48, 1426–1435. [Google Scholar] [CrossRef] [PubMed]
- Li, M.J.; Liu, Z.W.; Chen, Y.C.; Hai, Y. Characteristics of iron corrosion scales and water quality variations in drinking water distribution systems of different pipe materials. Water Res. 2016, 106, 593–603. [Google Scholar] [CrossRef] [PubMed]
- Trueman, B.F.; Gagnon, G.A. Understanding the role of particulate iron in lead release to drinking water. Environ. Sci. Technol. 2016, 50, 9053–9060. [Google Scholar] [CrossRef] [PubMed]
- Larson, T.E.; King, R.M. Corrosion by water at low flow velocity. J. Am. Water Works Assoc. 1954, 46, 1–9. [Google Scholar] [CrossRef]
- Larson, T.E.; Skold, R.V. Corrosion and tuberculation of cast iron. J. Am. Water Works Assoc. 1957, 49, 1294–1301. [Google Scholar]
- Obrecht, M.F.; Pourbaix, M. Corrosion of metals in potable water systems. J. Am. Water Works Assoc. 1967, 59, 977–992. [Google Scholar] [CrossRef]
- Sarin, P.; Snoeyink, V.L.; Bebee, J.; Kriven, W.M.; Clement, J.A. Physico-chemical characteristics of corrosion scales in old iron pipes. Water Res. 2001, 35, 2961–2969. [Google Scholar] [CrossRef]
- Jin, J.T.; Wu, G.X.; Guan, Y.T. Effect of bacterial communities on the formation of cast iron corrosion tubercles in reclaimed water. Water Res. 2015, 71, 207–218. [Google Scholar] [CrossRef] [PubMed]
- Yang, F.; Shi, B.Y.; Gu, J.N.; Wang, D.S.; Yang, M. Morphological and physicochemical characteristics of iron corrosion scales formed under different water source histories in a drinking water distribution system. Water Res. 2012, 46, 5423–5433. [Google Scholar] [CrossRef] [PubMed] [Green Version]
- Tang, Z.J.; Hong, S.; Xiao, W.Z.; Taylor, J. Characteristics of iron corrosion scales established under blending of ground, surface, and saline waters and their impacts on iron release in the pipe distribution system. Corros. Sci. 2006, 48, 322–342. [Google Scholar] [CrossRef]
- Lin, J.P.; Ellaway, M.; Adrien, R. Study of corrosion material accumulated on the inner wall of steel water pipe. Corros. Sci. 2001, 43, 2065–2081. [Google Scholar] [CrossRef]
- Sontheimer, H.; Kolle, W.; Snoeyink, V.L. The siderite model of the formation of corrosion-resistant scales. J. Am. Water Works Assoc. 1981, 73, 572–579. [Google Scholar] [CrossRef]
- Olowe, A.A.; Genin, J.M.R.; Bauer, P. Hyperfine interactions and structures of ferrous hydroxide and green rust II in sulfated aqueous media. Hyperfine Interact. 1988, 41, 501–504. [Google Scholar] [CrossRef]
- Drissi, H.; Refait, P.; Genin, J.M.R. The oxidation of Fe(OH)2 in the presence of carbonate ions: Structure of carbonate green rust one. Hyperfine Interact. 1994, 90, 395–400. [Google Scholar] [CrossRef]
- Refait, P.; Abdelmoula, M.; Genin, J.M.R. Mechanisms of formation and structure of green rust one in aqueous corrosion of iron in the presence of chloride ions. Corros. Sci. 1998, 40, 1547–1560. [Google Scholar] [CrossRef]
- Swietlik, J.; Raczyk-Stanislawiak, U.; Piszora, P.; Nawrocki, J. Corrosion in drinking water pipes: The importance of green rusts. Water Res. 2012, 46, 1–10. [Google Scholar] [CrossRef] [PubMed]
- Larson, T.E.; Skold, R.V. Laboratory studies relating mineral quality of water to corrosion of steel and cast iron. J. Am. Water Works Assoc. 1958, 14, 285–588. [Google Scholar] [CrossRef]
- Liu, H.Z.; Schonberger, K.D.; Peng, C.Y.; Ferguson, J.F.; Desormeaux, E.; Meyerhofer, P.; Luckenbach, H.; Korshin, G.V. Effects of blending of desalinated and conventionally treated surface water on iron corrosion and its release from corroding surfaces and pre-existing scales. Water Res. 2013, 47, 3817–3826. [Google Scholar] [CrossRef] [PubMed]
- Li, M.J.; Liu, Z.W.; Chen, Y.C.; Wu, Y.Y. Effect mechanism of flow velocity on iron release from pipe surfaces in drinking water distribution systems. In Proceedings of the 37th IAHR World Congress, Kuala Lumpur, Malaysia, 13–18 August 2017. [Google Scholar]
- Ali, M.A.; Dzombak, D.A. Effects of simple organic acids on sorption of Cu2+ and Ca2+ on goethite. Geochim. Cosmochim. Acta 1996, 60, 291–304. [Google Scholar] [CrossRef]
- Weng, L.P.; Koopal, L.K.; Hiemstra, T.; Meeussen, J.C.L.; Van Riemsdijk, W.H. Interactions of calcium and fulvic acid at the goethite-water interface. Geochim. Cosmochim. Acta 2005, 69, 325–339. [Google Scholar] [CrossRef] [Green Version]
- Boxall, J.B.; Dewis, N. Identification of discolouration risk through simplified modelling. In Proceedings of the World Water and Environmental Resources Congress, Anchorage, AK, USA, 15–19 May 2005; pp. 1–10. [Google Scholar]
- Boxall, J.B.; Saul, A.J. Modeling discoloration in potable water distribution systems. J. Environ. Eng. 2005, 131, 716–725. [Google Scholar] [CrossRef]
- Boxall, J.B.; Prince, R.A. Modelling discolouration in a Melbourne (Australia) potable water distribution system. J. Water Supply Res. Technol. Aqua 2006, 55, 207–219. [Google Scholar] [CrossRef]
- Vreeburg, J.H.G.; Boxall, J.B. Discolouration in potable water distribution systems: A review. Water Res. 2007, 41, 519–529. [Google Scholar] [CrossRef] [PubMed]
- Husband, S.; Boxall, J.B. Discolouration risk management for trunk mains. Water Distrib. Syst. Anal. 2010, 2010, 535–542. [Google Scholar]
- Sharpe, R.L.; Smith, C.J.; Boxall, J.B.; Biggs, C.A. Pilot scale laboratory investigations into the impact of steady state conditioning flow on potable water discolouration. Water Distrib. Syst. Anal. 2010, 2010, 494–506. [Google Scholar]
- Fabbricino, M.; Korshin, G.V. Changes of the corrosion potential of iron in stagnation and flow conditions and their relationship with metal release. Water Res. 2014, 62, 136–146. [Google Scholar] [CrossRef] [PubMed]
Figure 1.
Pipe sections and corrosion scale samples: (a) unlined cast iron pipe section of Pipe A; (b) hybrid pipe section of Pipe A; (c) screw section of Pipe B; (d) straight section of Pipe B and (e) Pipe C.
Figure 1.
Pipe sections and corrosion scale samples: (a) unlined cast iron pipe section of Pipe A; (b) hybrid pipe section of Pipe A; (c) screw section of Pipe B; (d) straight section of Pipe B and (e) Pipe C.

Figure 2.
SEM micrographs of corrosion scales from Pipe B and Pipe C. (a–f) represent Sample 4#–9#, respectively.
Figure 2.
SEM micrographs of corrosion scales from Pipe B and Pipe C. (a–f) represent Sample 4#–9#, respectively.

Figure 3.
Cumulative occurrence profiles of (a) Fe, (b) Ca and (c) Zn in corrosion scale samples.


Figure 4.
XRD patterns of corrosion scales. (a–i) represent Sample 1#–9#, respectively.


Table 1.
Corrosion scale samples.
| Pipe ID | Sample ID | Pipe Material | Pipe Diameter (cm) | Pipe Age (Years) | Water Source | Service Position | Sampling Area |
|---|---|---|---|---|---|---|---|
| A | 1# | Unlined cast iron | 8.0 | 20 | Groundwater | Experimental water delivery system | / |
| 2# | Hybrid pipe | ||||||
| 3# | Galvanized iron | ||||||
| B | 4# | Galvanized iron | 3.5 | 20 | Groundwater | Service pipes | Screw section |
| 5# | Straight section | ||||||
| C | 6# | Unlined cast iron | 100 | 30 | Surface water | Trunk mains | Inner layer of corrosion tubercle |
| 7# | Middle layer of corrosion tubercle | ||||||
| 8# | Outer layer of corrosion tubercle | ||||||
| 9# | Flaky scale |
Table 2.
Source water quality.
| Water Sources | pH | Hardness (mg/L as CaCO3) | Turbidity (NTU) | SO42− (mg/L) | Cl− (mg/L) | Al (mg/L) | |
|---|---|---|---|---|---|---|---|
| Tsinghua University | Groundwater | 7.93 | 196.2 | 0.32 | 50.0 | 18.6 | <0.02 |
| Zhengzhou City | Yellow River | 7.98 | 235.8 | 0.19 | 85.6 | 54.2 | 0.07 |
| Danjiangkou Reservoir | 8.05 | 155.5 | 0.22 | 41.1 | 18.8 | 0.07 | |
Table 3.
Surface area and porosity of scale samples.
| Surface Area (m2/g) | Pore Volume (×103 cm3/g) | Pore Size (Å) | ||||
|---|---|---|---|---|---|---|
| BET a | BJH b | BJH b | BET a | BJH b | ||
| Pipe B | 4# | 123.0 | 100.5 | 219.0 | 58.6 | 87.2 |
| 5# | 170.1 | 89.4 | 174.1 | 40.0 | 77.9 | |
| Pipe C | 6# | 50.5 | 59.7 | 87.8 | 54.0 | 58.8 |
| 7# | 81.7 | 87.3 | 104.6 | 41.4 | 47.6 | |
| 8# | 77.4 | 87.4 | 98.4 | 41.3 | 45.0 | |
| 9# | 31.8 | 36.7 | 58.0 | 73.3 | 62.6 | |
Note: a Calculated by using the Brunauer, Emmett and Teller (BET) method. b Calculated based on desorption data between 10-3000 Å diameter by using the Barrett, Joyner and Halenda (BJH) method.
Table 4.
Elemental composition of scale samples by ICP test.
| Elemental Composition (mg/g) | Fe | Ca | Zn | S | Al | Si | Mg | Mn | Pb | K | P | Na | Ti | Cu | |
|---|---|---|---|---|---|---|---|---|---|---|---|---|---|---|---|
| Pipe A | 1# 2# 3# | 554.3 283.4 386.5 | 41.7 185.8 23.4 | 0.8 3.1 158.9 | 0.5 1.0 1.8 | 0.2 0.8 0.9 | 3.4 5.8 4.8 | 1.0 3.4 1.2 | 2.7 3.1 1.5 | 0.6 8.5 2.5 | 0.1 0.7 0.2 | / / / | / 0.2 0.1 | / 2.2 / | 1.0 0.5 0.4 |
| Pipe B | 4# 5# | 648.9 612.8 | 1.0 0.6 | 31.3 14.6 | 4.6 4.3 | 0.1 0.1 | 1.7 1.3 | 0.4 / | 0.3 0.2 | 0.3 0.2 | 0.1 0.1 | 0.8 0.3 | 0.2 0.2 | / / | / / |
| Pipe C | 6# 7# 8# 9# | 337.4 211.4 316.8 254.2 | 5.7 2.4 3.2 8.7 | 0.1 0.1 0.1 / | 68.7 11.2 5.7 15.7 | 3.9 6.4 6.3 2.8 | 1.2 1.6 0.8 1.6 | 1.9 2.5 2.3 1.7 | 2.1 0.2 0.6 1.5 | / / / / | 1.1 2.0 2.0 0.8 | 0.8 1.8 1.5 0.8 | 0.6 0.7 0.9 0.2 | 0.2 0.4 0.3 0.1 | / / / / |
Note: The symbol/represents the corresponding element was detected below 0.1 mg/g.
Table 5.
Non-linear least squares fitting results of deconvolution of Fe(2p3/2) peak determined by XPS.
Table 5.
Non-linear least squares fitting results of deconvolution of Fe(2p3/2) peak determined by XPS.
| Chemical Composition (%) | Magnetite (Fe3O4) | Maghemite (γ-Fe2O3) | Goethite (α-FeOOH) | |
|---|---|---|---|---|
| Pipe A | 1# 2# 3# | 17 46 32 | 29 22 26 | 54 32 42 |
| Pipe B | 4# 5# | 9 0 | 35 24 | 56 76 |
| Pipe C | 6# 7# 8# 9# | 35 28 27 20 | 26 29 27 38 | 39 43 46 42 |
© 2018 by the authors. Licensee MDPI, Basel, Switzerland. This article is an open access article distributed under the terms and conditions of the Creative Commons Attribution (CC BY) license (http://creativecommons.org/licenses/by/4.0/).
Share and Cite
MDPI and ACS Style
Li, M.; Liu, Z.; Chen, Y. Physico-chemical Characteristics of Corrosion Scales from Different Pipes in Drinking Water Distribution Systems. Water 2018, 10, 931. https://doi.org/10.3390/w10070931
AMA Style
Li M, Liu Z, Chen Y. Physico-chemical Characteristics of Corrosion Scales from Different Pipes in Drinking Water Distribution Systems. Water. 2018; 10(7):931. https://doi.org/10.3390/w10070931
Chicago/Turabian StyleLi, Manjie, Zhaowei Liu, and Yongcan Chen. 2018. "Physico-chemical Characteristics of Corrosion Scales from Different Pipes in Drinking Water Distribution Systems" Water 10, no. 7: 931. https://doi.org/10.3390/w10070931
Note that from the first issue of 2016, this journal uses article numbers instead of page numbers. See further details here.