Assessing Aquatic Ecological Health for Lake Poyang, China: Part II Index Application


1
School of Geography and Tourism, Anhui Normal University, Wuhu 241003, China
2
Engineering Technology Research Center of Resources Environment and GIS, Wuhu 241003, China
3
Key Laboratory of Watershed Geographic Sciences, Nanjing Institute of Geography and Limnology, Chinese Academy of Sciences, Nanjing 210008, China
4
Key Laboratory of Poyang Lake Wetland and Watershed Research, Ministry of Education, Jiangxi Normal University, Nanchang 330022, China
5
Poyang Lake Hydrology Bureau of Jiangxi Province, Jiujiang 332800, China
*
Authors to whom correspondence should be addressed.
Water 2018, 10(7), 909; https://doi.org/10.3390/w10070909
Submission received: 16 May 2018
/
Revised: 26 June 2018
/
Accepted: 29 June 2018
/
Published: 10 July 2018
(This article belongs to the Section Water Quality and Contamination)
Abstract
:As one of the largest Yangtze river-connected lakes in China, Lake Poyang’s heath status has increasingly become a cause for concern. This study evaluated Lake Poyang’s heath status using a newly developed index (ecosystem health index for Lake Poyang, LP-EHI). The evaluation results revealed a declining tendency in the lake’s health status from 2010 to 2014. The health conditions for Lake Poyang were “good”, “fair”, and “fair” in 2010, 2013, and 2014, respectively. The individual indices for water quality, nutrient conditions, and benthic macroinvertebrate showed a deteriorating trend from 2010 to 2014 mainly due to human activities, such as industrial pollution. Further analysis revealed that the health status of Lake Poyang was strongly affected by hydrological processes. This study demonstrated the potential of LP-EHI in evaluating the ecological health of Lake Poyang. Such a heath status evaluation can be applied to other lakes, and can benefit lake management, restoration, and conservation.
1. Introduction
Lake Poyang, as the largest freshwater lake ecosystem in China and one of the seven internationally recognized important wetlands, plays an important role in maintaining the ecological balance of the entire basin. However, the lake has shrunk in size and suffered from severe eutrophication [1]. Water quality deteriorated from ratings of I or II in the 1980s to III or worse in the 2010s [2]. The degradation of wetland vegetation and fish resources has also been observed in recent years [3]. Therefore, an update of the lake’s ecosystem health assessment is needed. Especially, the building of the Lake Poyang Hydraulic Project (LPHP) that has been proposed recently might cause considerable changes in hydrodynamic conditions, water quality, and aquatic species [4,5]. Therefore, this assessment can act as a reference baseline to quantitatively analyze the impact of the LPHP. Connected to the Yangtze River, Lake Poyang has unique characteristics that distinguished it from other enclosed or semi-enclosed lakes. These unique characteristics (e.g., large water level fluctuation) should be fully incorporated in its ecosystem health assessment. Changes in the climate, land use, and land cover in the basin, and the impoundment effects of the Three Gorges Dam about 1050 km upstream of Lake Poyang, have caused large variations of seasonal streamflow and water level [6,7,8,9]. The highly fluctuating regime fosters rich biodiversity, raising the international importance of the lake in ecological conservation. Unfortunately, the hydrological characteristics of the lake have changed during the past decade, and the duration of extreme low or high water events have increased, thereby affecting wetland landscapes [10], water quality [2,11], and aquatic habitats [12,13,14]. However, these changes were seldom discussed in previous studies [15,16]. Based on the developed ecosystem health index for Lake Poyang (LP-EHI) in Part I, which holistically incorporated the lake’s characteristics, a comprehensive and objective ecological assessment can be achieved.
This study applied the developed index to identify Lake Poyang’s ecological health conditions, which was implemented in three steps. First, the sample sites and parameter data were selected, collected, and processed. Second, using the developed LP-EHI in Part I, the overall health status of the lake and its indicator components were calculated. Finally, the health conditions were analyzed based on the evaluation results.
2. Materials and Methods
2.1. Study Area
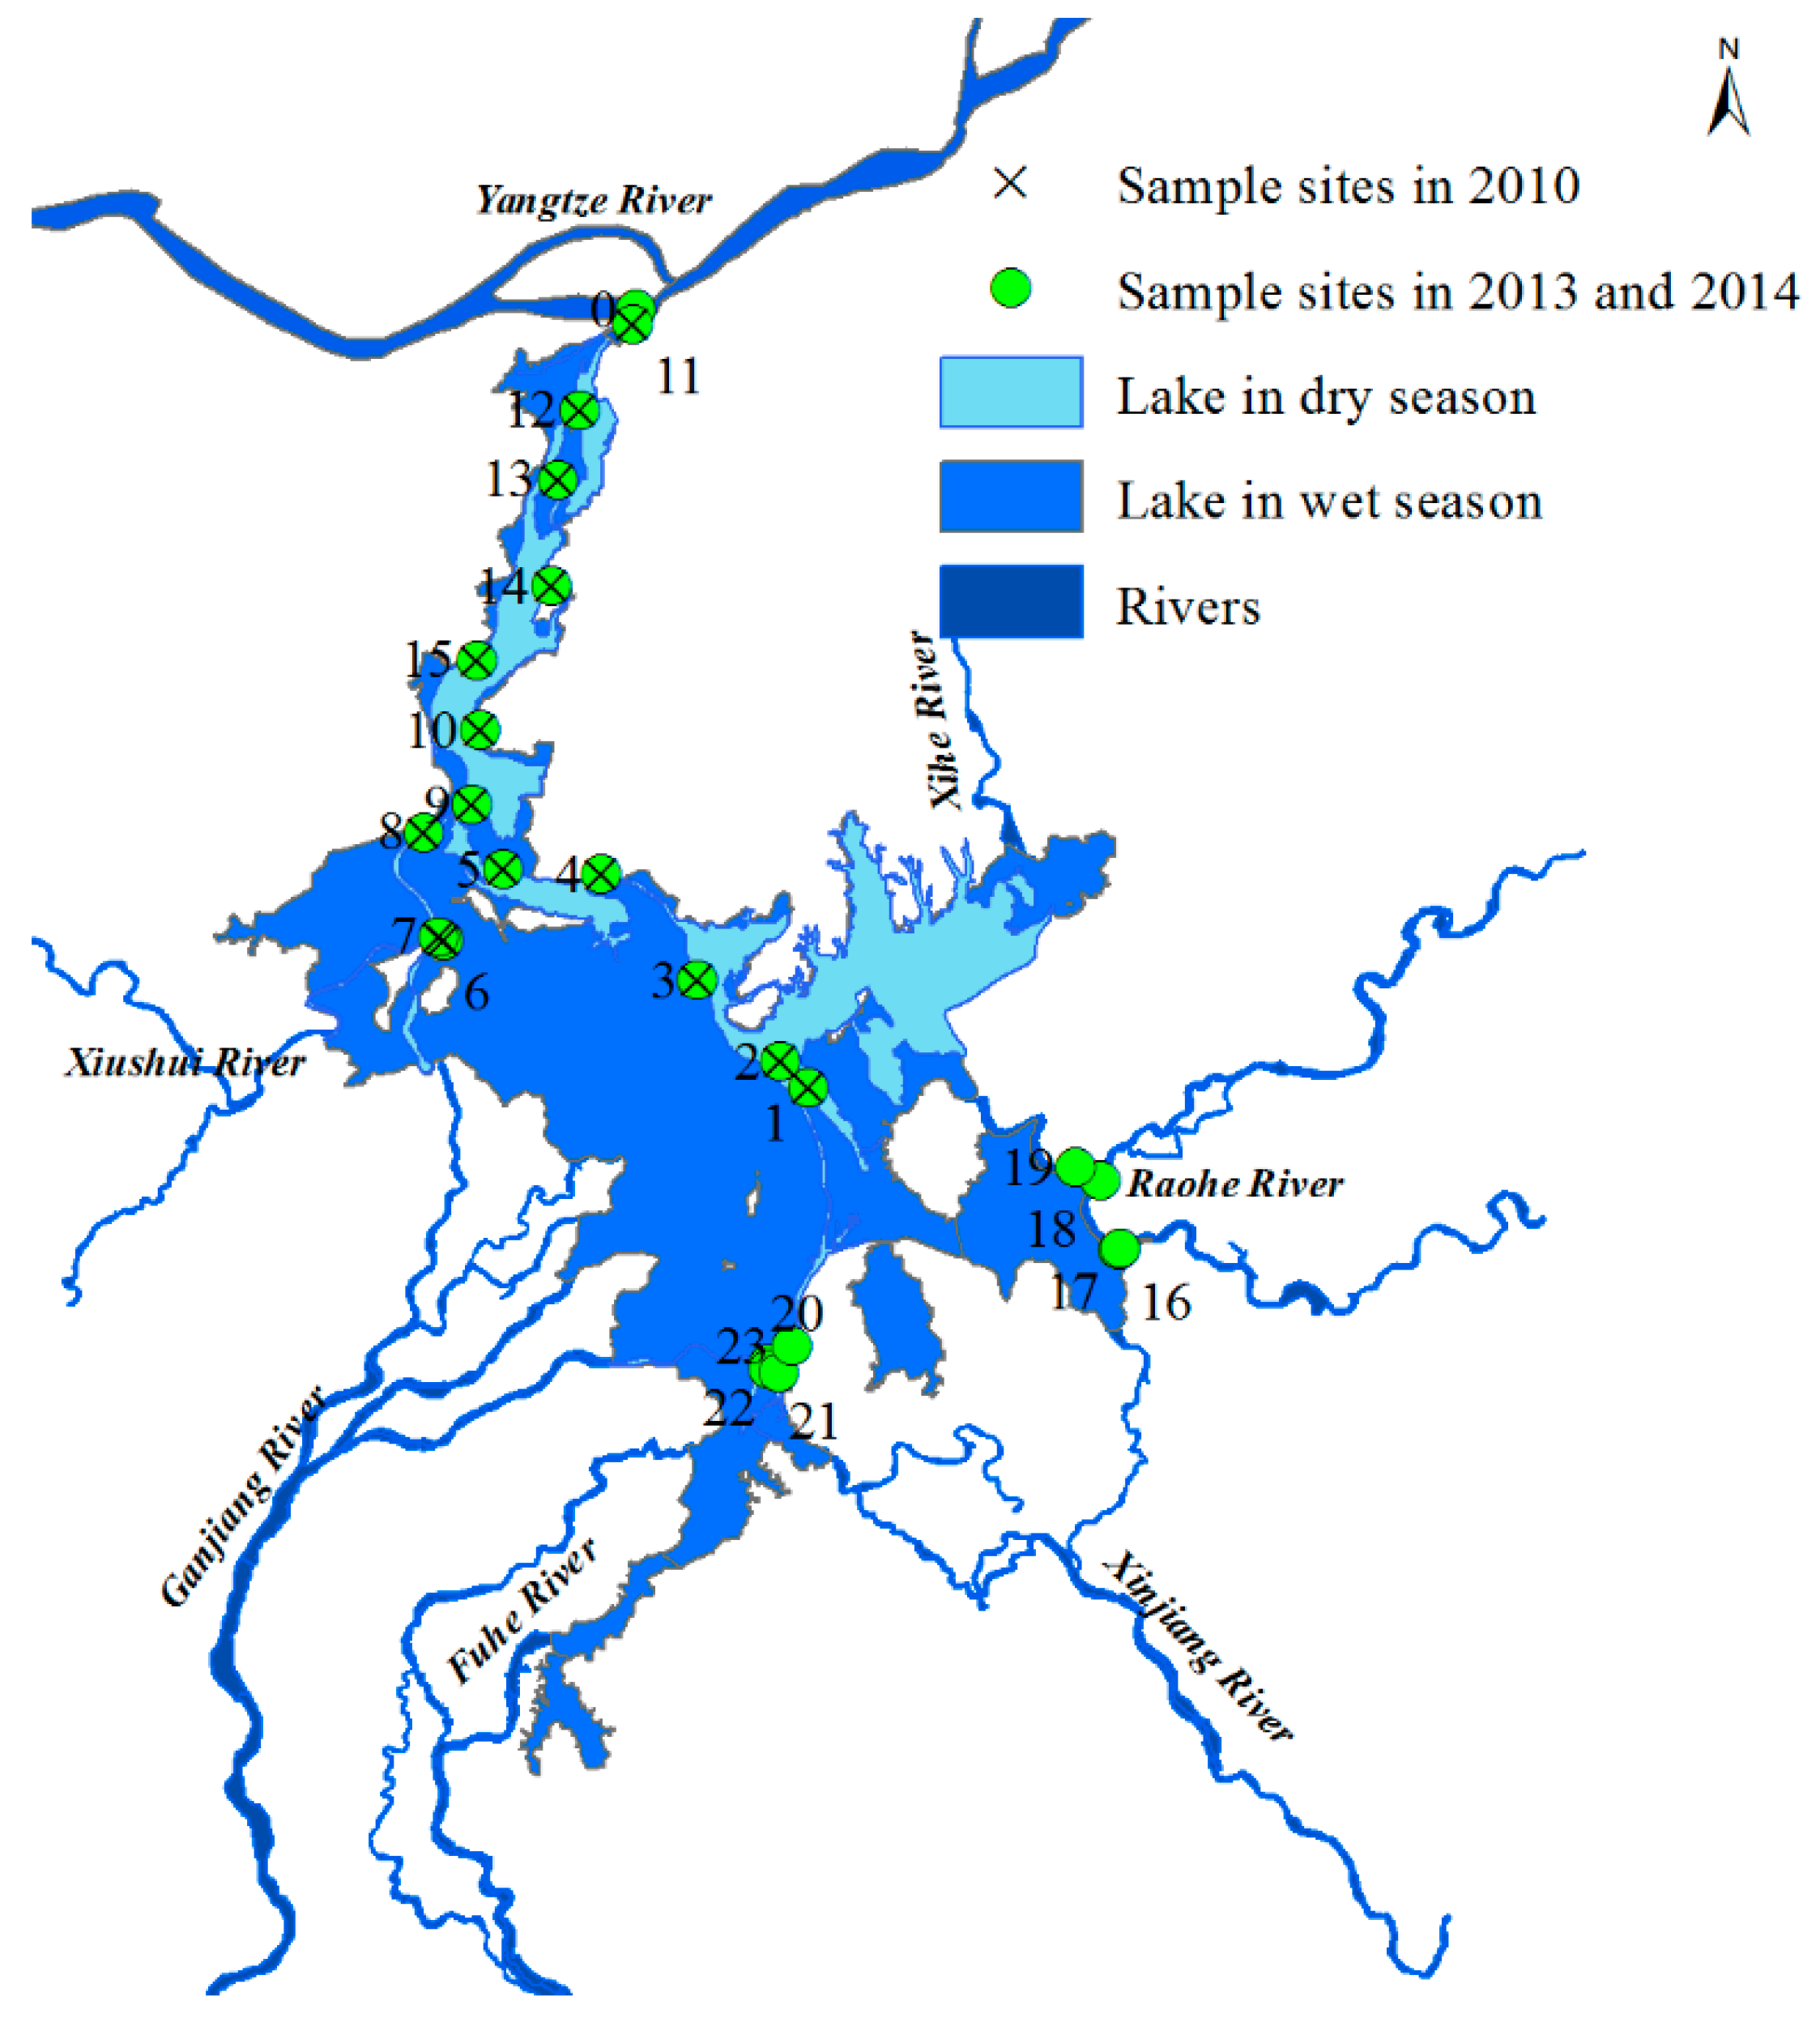
In Part I, the meteorological, hydrological, and bathymetry conditions of Lake Poyang have been described [17]. Sample sites were selected via a randomized systematic design with a spatial component [18]. Bathymetry conditions, hydrodynamic characteristics, and transportation accessibility were also considered to adjust and optimize the sampling distribution (Figure 1). Samples were collected four times from the periods of 7–11 January, 8–13 April, 11–23 July, and 8–16 October in 2010, 2013, and 2014. In 2010, 15 sites were located in the lake. Although the lake area changes substantially in a year, these 15 sites could be sampled throughout the whole year. In 2013 and 2014, sampling sites 0 and 16–23 were added to monitor the state of inflows and outflow. In addition, benthic macroinvertebrate samples were collected quarterly at 15 sampling sites (1–15), which are regular monitoring stations of the Lake Poyang Laboratory for Wetland Ecosystem Research (PLWER) within the Chinese Ecosystem Research Network (CERN).
2.2. Sample Collection and Processing
At each site, triplicate measures of physicochemical parameters were made before the benthic sampling. First, 2 L of water was collected in sterilized plastic bottles and stored in a portable refrigerator at <4 °C until analysis. These were analyzed in the laboratory for total nitrogen (TN), total phosphorus (TP), and chemical oxygen demand in manganese (CODMn), following standard methods for water and wastewater analysis. Temperature, pH, dissolved oxygen (DO), turbidity, and electrical conductivity (EC) were measured using a portable multi-probe meter (Model YSI-6600 V2, YSI Inc., Yellow Springs, OH, USA) at the center of each of the sampling reach. Phytoplankton chlorophyll-a (Chl a) concentration was calculated from spectrophotometric measurements after 90% hot ethanol extraction, according to Lorenzen (1967).
Phytoplankton samples were fixed with Lugol’s iodine solution (1% v/v) and allowed to settle for 48 h prior to counting using a microscope; the taxa identification was performed according to Su et al. [19]. Since the biomass in Lake Poyang was low, all of the phytoplankton cells in a 0.1-mL fixed sample concentrated from 1 mL to 30 mL were counted to estimate the density, which is necessary in the volumetric method of measuring phytoplankton biomass. Mean cell volume was calculated using appropriate geometric configurations. Volume values were converted to biomass assuming that 1 mm3 of volume was equivalent to 1 mg of fresh weight biomass [14].
Planktonic crustaceans’ zooplankton was collected by acrylic glass water sampler (5 L). After filtration with a plankton net (64 μm mesh), the samples were fixed with 5% buffered formaldehyde solution and returned to the laboratory, where the zooplankton were identified to the taxonomic level outlined. A sample was scanned for particularly large species, and taxa with large numbers of individuals were counted by taking 1-mL sub-samples until 100 individuals were counted [1,13,20,21]. Adult individuals were identified to species level in nearly all of the cases following Koste [22] (rotifers) and Kiefer [23] (crustaceans). Species that could not be distinguished in routine counting were treated as one category (e.g., Synchaeta oblonga/tremula). Juvenile stages of copepods were treated as a separate category. Daphnia were identified according to Hebert et al. [24].
Benthic macroinvertebrates were collected as duplicates using a modified Peterson grab (0.05 m2), which was sieved in situ through a sieve (250-μm mesh). In the laboratory, the samples were sorted in a white tray, and animals were preserved in 7% buffered formalin solution. Specimens were identified to the lowest feasible taxonomic level, counted, blotted dry, and weighed to determine their wet weight using an electronic balance (Sartorius BS-124, readability: 0.1 mg). Mollusks were weighed with their shells [20].
In addition to the collected chemical and biological data, we also quantitatively evaluated the lake health based on our compilation of other metrics, including physical characteristics, wetland vegetation, fish, and birds, which were collected from previous studies [10,16,25], statistical yearbooks, and official reports.
2.3. LP-EHI
In Part I, LP-EHI was developed to quantify lake health from the perspectives of physical, chemical, biological, and social service [17]. This index can be an alternative method of estimating the health status of lake ecosystems and guide lake management to achieve better health conditions. Further implementation details about LP-EHI, including metric selection, weight estimation, reference condition definition, metric standardization, and categorization can be found in Qi et al. [17].
3. Results
3.1. Assessing Ecological Status Using LP-EHI
3.1.1. Overall Lake Health Status
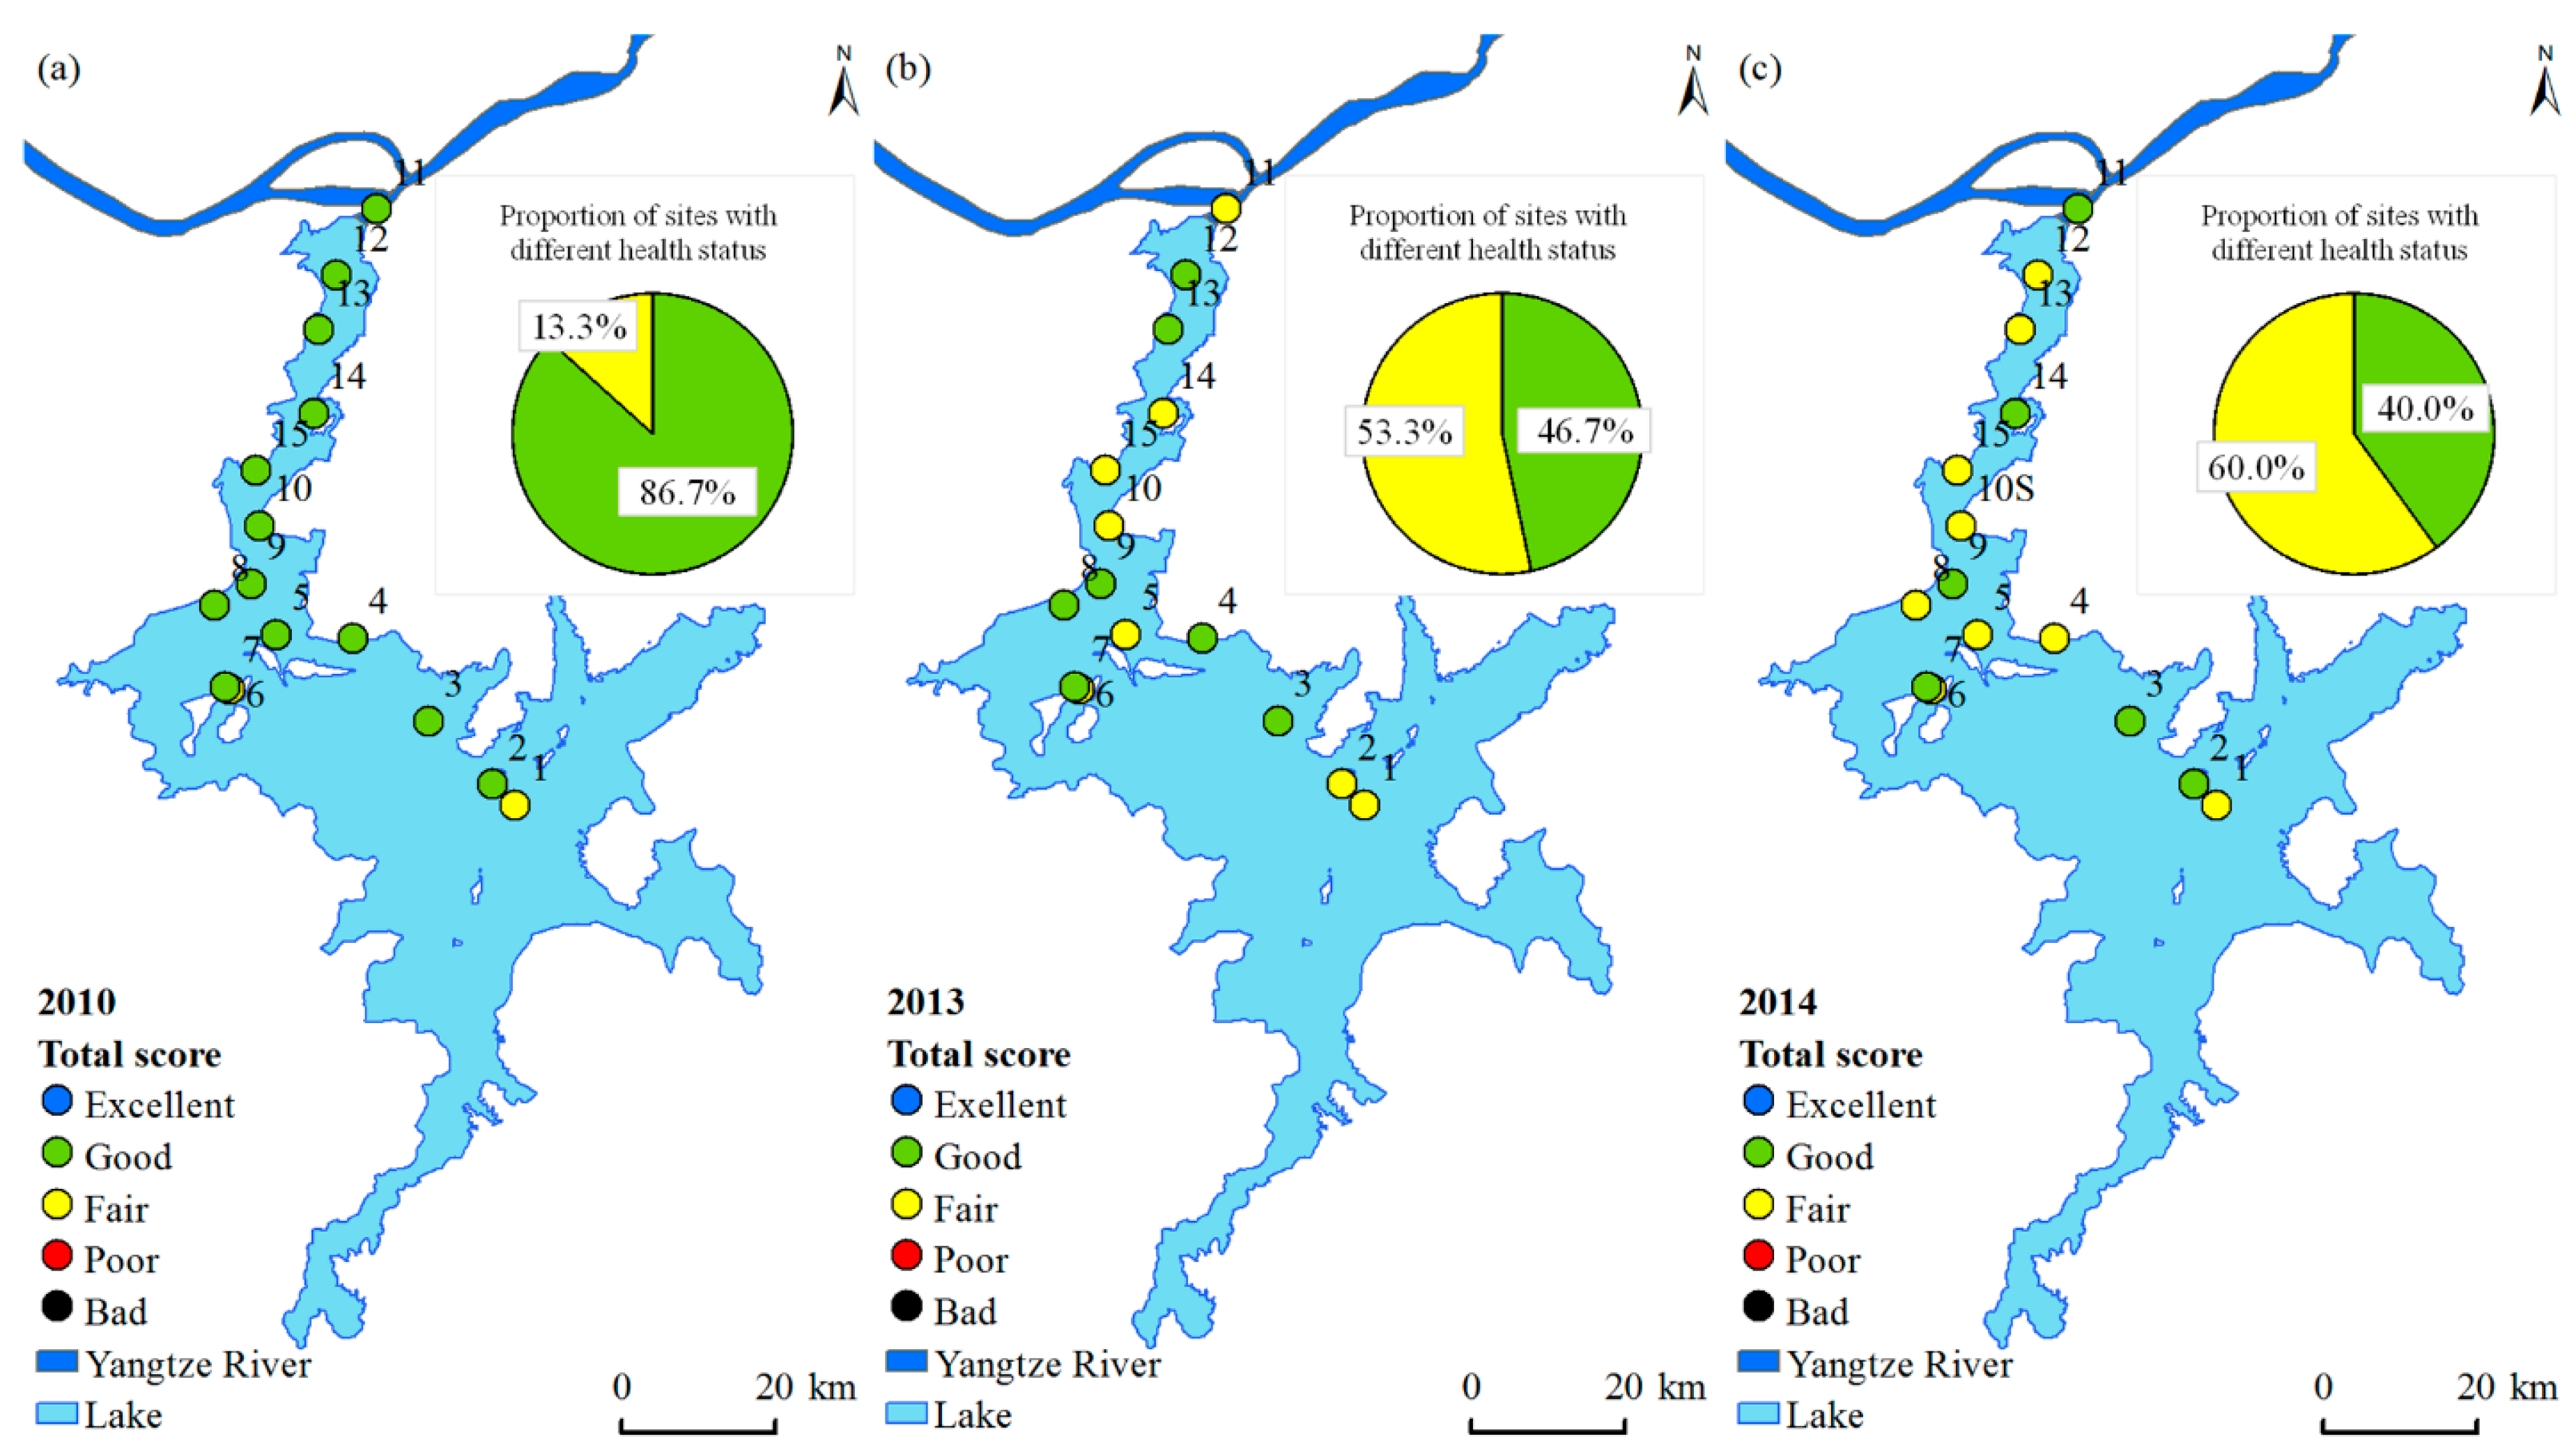
On the basis of Equation (2) in Part I and the analysis of individual indices, the LP-EHI final scores in 2010, 2013, and 2014 were calculated at a “good” 0.62, “fair” 0.59, and “fair” 0.59, respectively. The total scores showed a slight decreasing trend from 2010 to 2014. In 2010, the majority of the sample sites were respectively in the “good” 86.7%, and the remaining sites were in “fair” condition. In 2013, the percentage of “good” sites decreased to 46.7%; other sites were “fair”. In 2014, the number of sites in “good” status further reduced to 40.0%; 60.0% of sites were “fair” (Figure 2).
3.1.2. Annual Variation of Health Indicator Components
The average score for each indicator in 2010, 2013, and 2014, and its weight (D1–D19 in Part I) are shown in the Nightingale rose diagram (Figure 3). For physical indices (D1–D5), the scores of water level (D1) and annual runoff (D4) of 2010 were lower in 2010 than in 2013 and 2014. The status of water level was better in typical ordinary hydrological year, rather than wet or dry years (Table 1). The lake area shrinking rate (D3) in 2010, 2013, and 2014 was 0.77. The other two physical indices, including tributary connectivity (D2) and coastal habitat (D5), remained unchanged.
For chemical indicators, the scores of water quality (D6) showed a decreased tendency, with the water quality status in 2010 as the best among these three years: 2010 (0.54, “fair”) > 2013 (0.45, “fair”) > 2014 (0.37, “poor”). The health status of nutrition (D7) also had a deterioration tendency. TLI (trophic level index) in 2010, 2013, and 2014 were 41.7 (0.71, “good”), 41.9 (0.70, “good”), and 47.2 (0.57, “fair”), respectively. Toxicity (D8) in each of these three years was below the lowest limits of the national standard (GB3838-2002) [25]. Therefore, the score of D8 was 1.00.
For biological indicators, the phytoplankton indicator (D9) for all three years was “good”, and the scores declined slightly. For zooplankton, the status of zooplankton health (D10) in 2013 (0.36, “poor”) and 2014 (0.57, “fair”) was significantly poorer than in 2010 (0.64, “good”). The state of benthic macroinvertebrate (D11) health showed a decrease after 2010, and the scores were 0.83 (“excellent”) in 2010, 0.39 (“poor”) in 2013, and 0.53 (“fair”) in 2014. Due to the inadequacy of data and long life cycle [26], the health scores of wetland plants (D12) and fish (D13) remained the same for these three years, and respectively were “good” 0.73 and “fair” 0.52. The health status of wintering birds (D14) varied greatly, and the scores were “poor” 0.30, “good” 0.61, and “good” 0.79.
The proportion of water function zones (D15) changed little in these years. The water function zone percentage reached the corresponding water quality standard in 2010, 2013, and 2014 at only 33.3% (0.33, “poor”), 46.4% (0.46, “fair”), and 31.8% (0.32, “poor”), respectively. The pathogenic potential indicator (D16) was always at a good level. The infected snail ratio was 0.10% [27] for the 60% area percentage of marshland with snails. Therefore, the schistosomiasis indicator reached a “good” score of 0.70. The capacity of flood (D17) varied among different hydrological processes, and in 2010, as the typical wet year, the capacity of regulating flood was higher than in the other two years. The score of sand mining (D18) showed a large increase from 2010 (0.00, “bad”) to 2013 (0.50, “fair”), and remained stable in 2014. The resulting scores of dish-shaped sub-lake areas under management were consistently “bad” at 0.06.
3.2. Deteriorated Health Indicators
3.2.1. Water Quality
From an annual variation of indicator components, both the water quality and nutrient levels of Lake Poyang showed deterioration trends (Figure 3). The chemical integrity indices were calculated based on the physicochemical parameters collected from field observation in 2010, 2013, and 2014. From the water quality aspect, 86.7% of the sampling sites had “fair” status. Other sampling sites were “good” in 2010. However, some of the sampling sites in 2013 appeared “poor” or “bad”, such as sites 0 and 16 (Figure 1). In 2014, many sites worsen, with 62.5% of them “poor” (Figure 4).
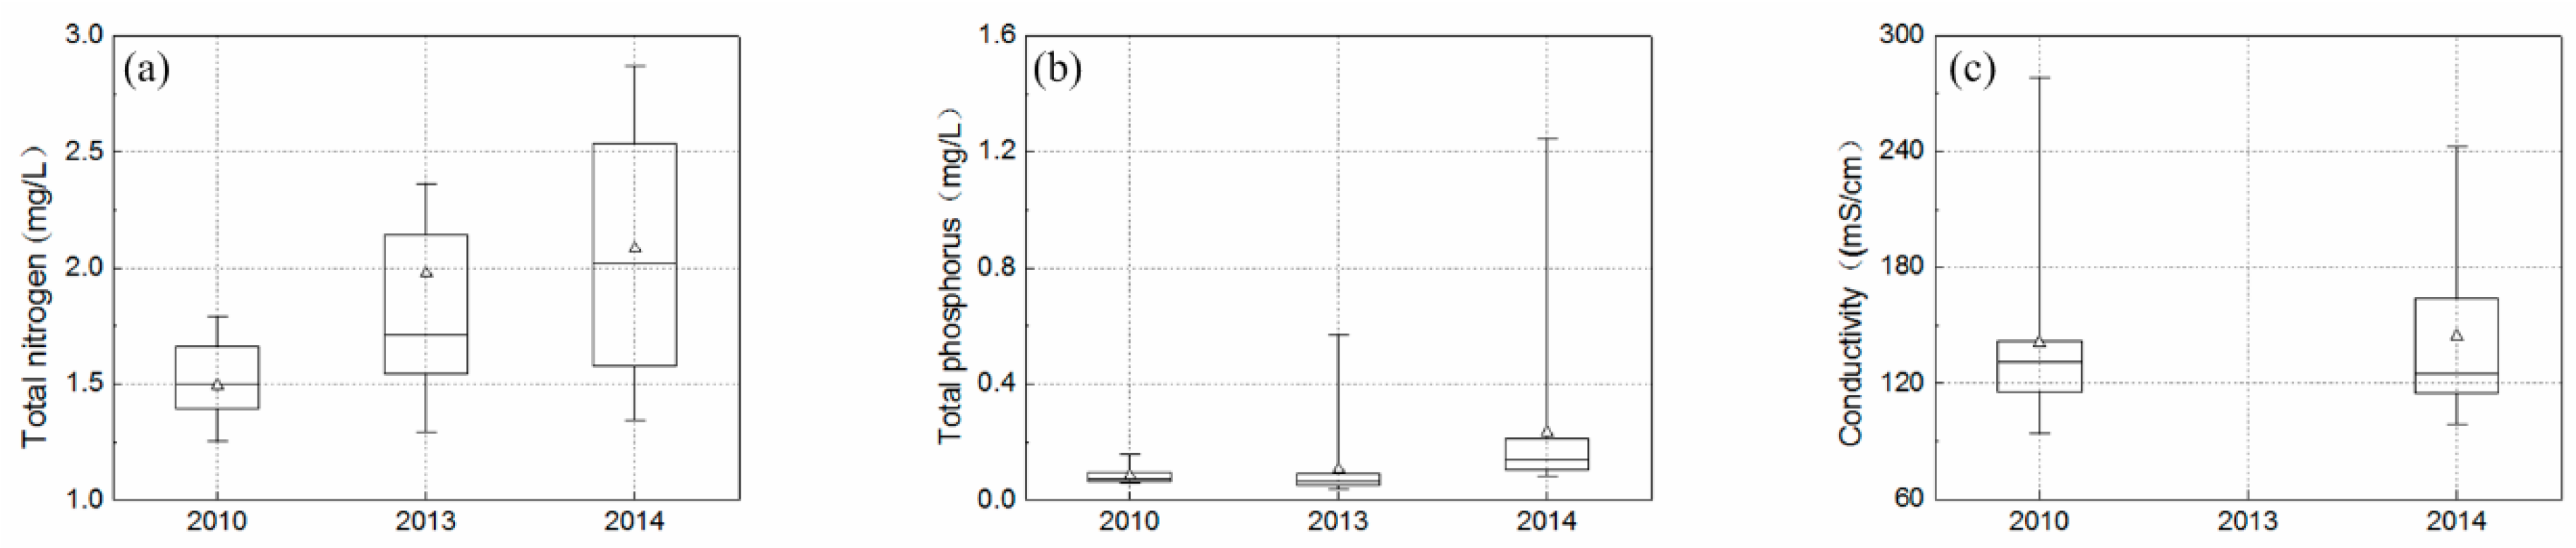
The scores of individual indices of water quality were further analyzed (Figure 5), and the annual average values of TN (1.49 ± 0.64 mg/L), TP (0.08 ± 0.08 mg/L), and EC (140.98 ± 109.62 mS/cm) in 2010 were best with health scores of 0.34 for TN, 0.65 for TP, and 0.73 for EC. The health status of the water quality in 2010 was better than that in other two years. In 2013, the average TN and TP increased to 1.98 ± 1.04 and 0.11 ± 0.15 mg/L respectively, with health scores of 0.22 for TN, and 0.67 for TP. Water quality in the lake began to deteriorate to some degree, although EC were unavailable in 2013. In addition, the concentrations of TN (2.08 ± 1.08 mg/L), TP (0.23 ± 0.61 mg/L), and EC (144.38 ± 97.88 mS/cm) were the highest in 2014, with annual average scores of 0.22 for TN, 0.47 for TP, and 0.68 for EC.
3.2.2. Nutrient Level
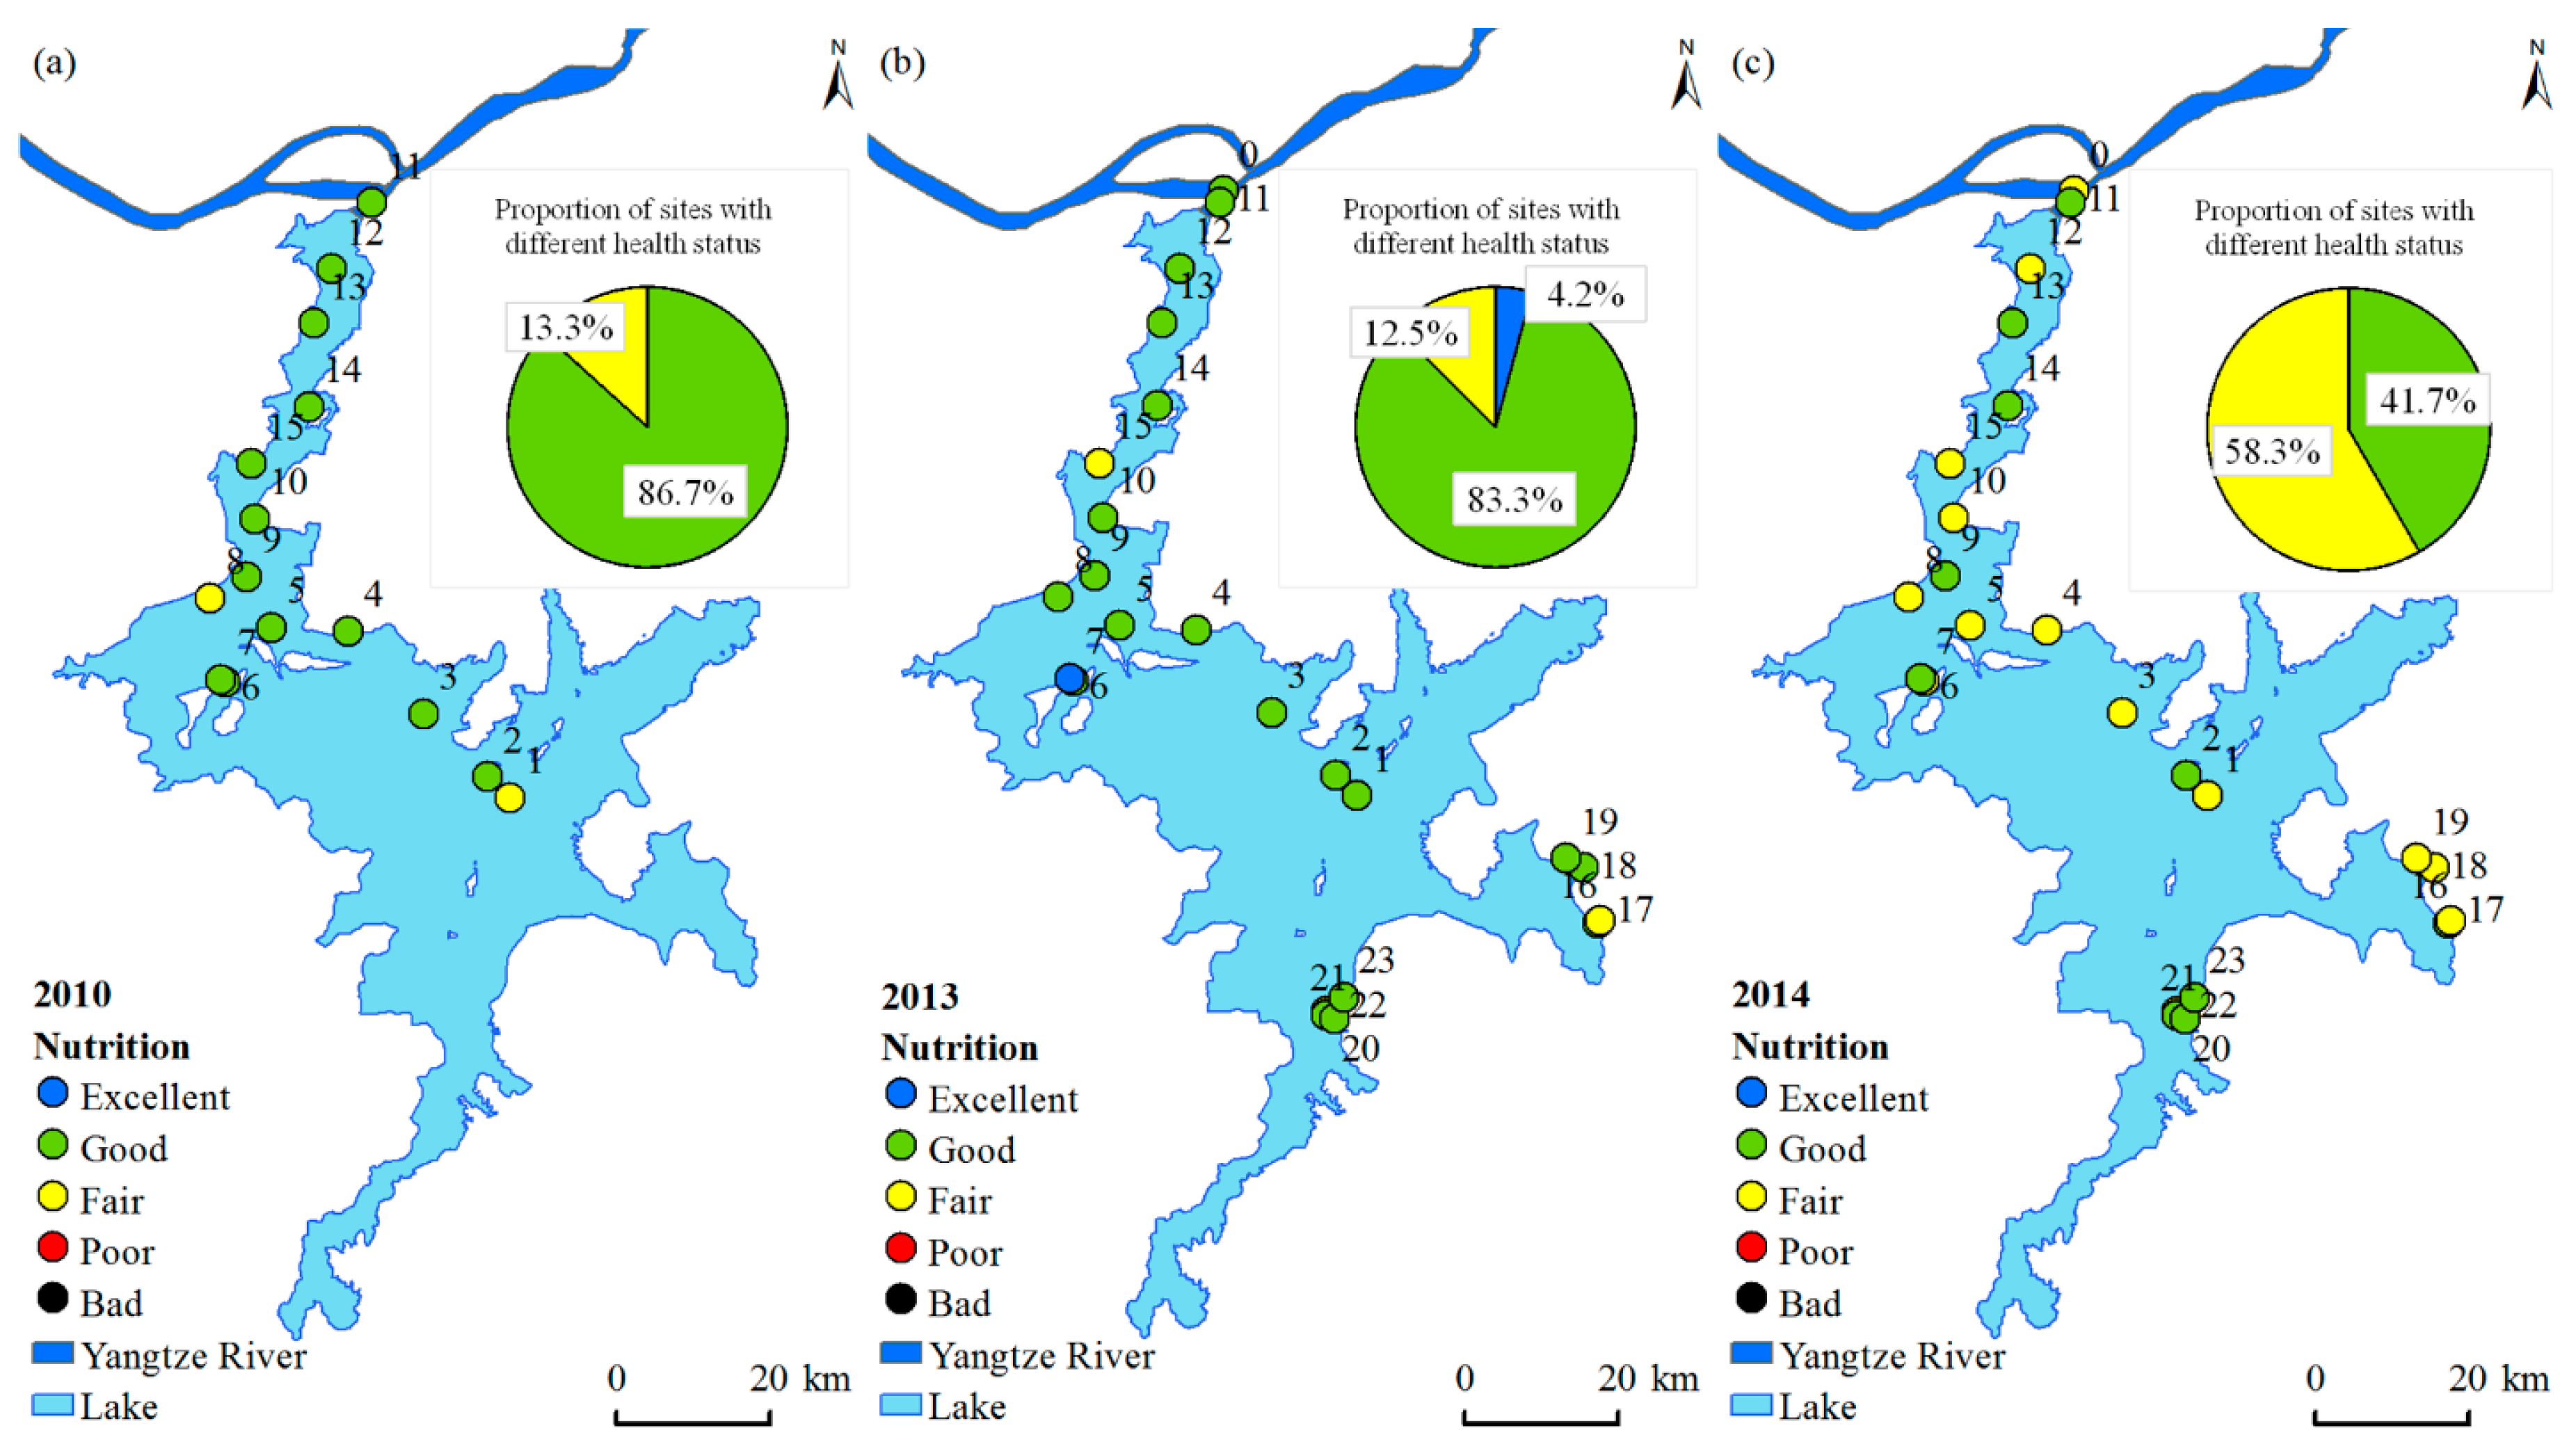
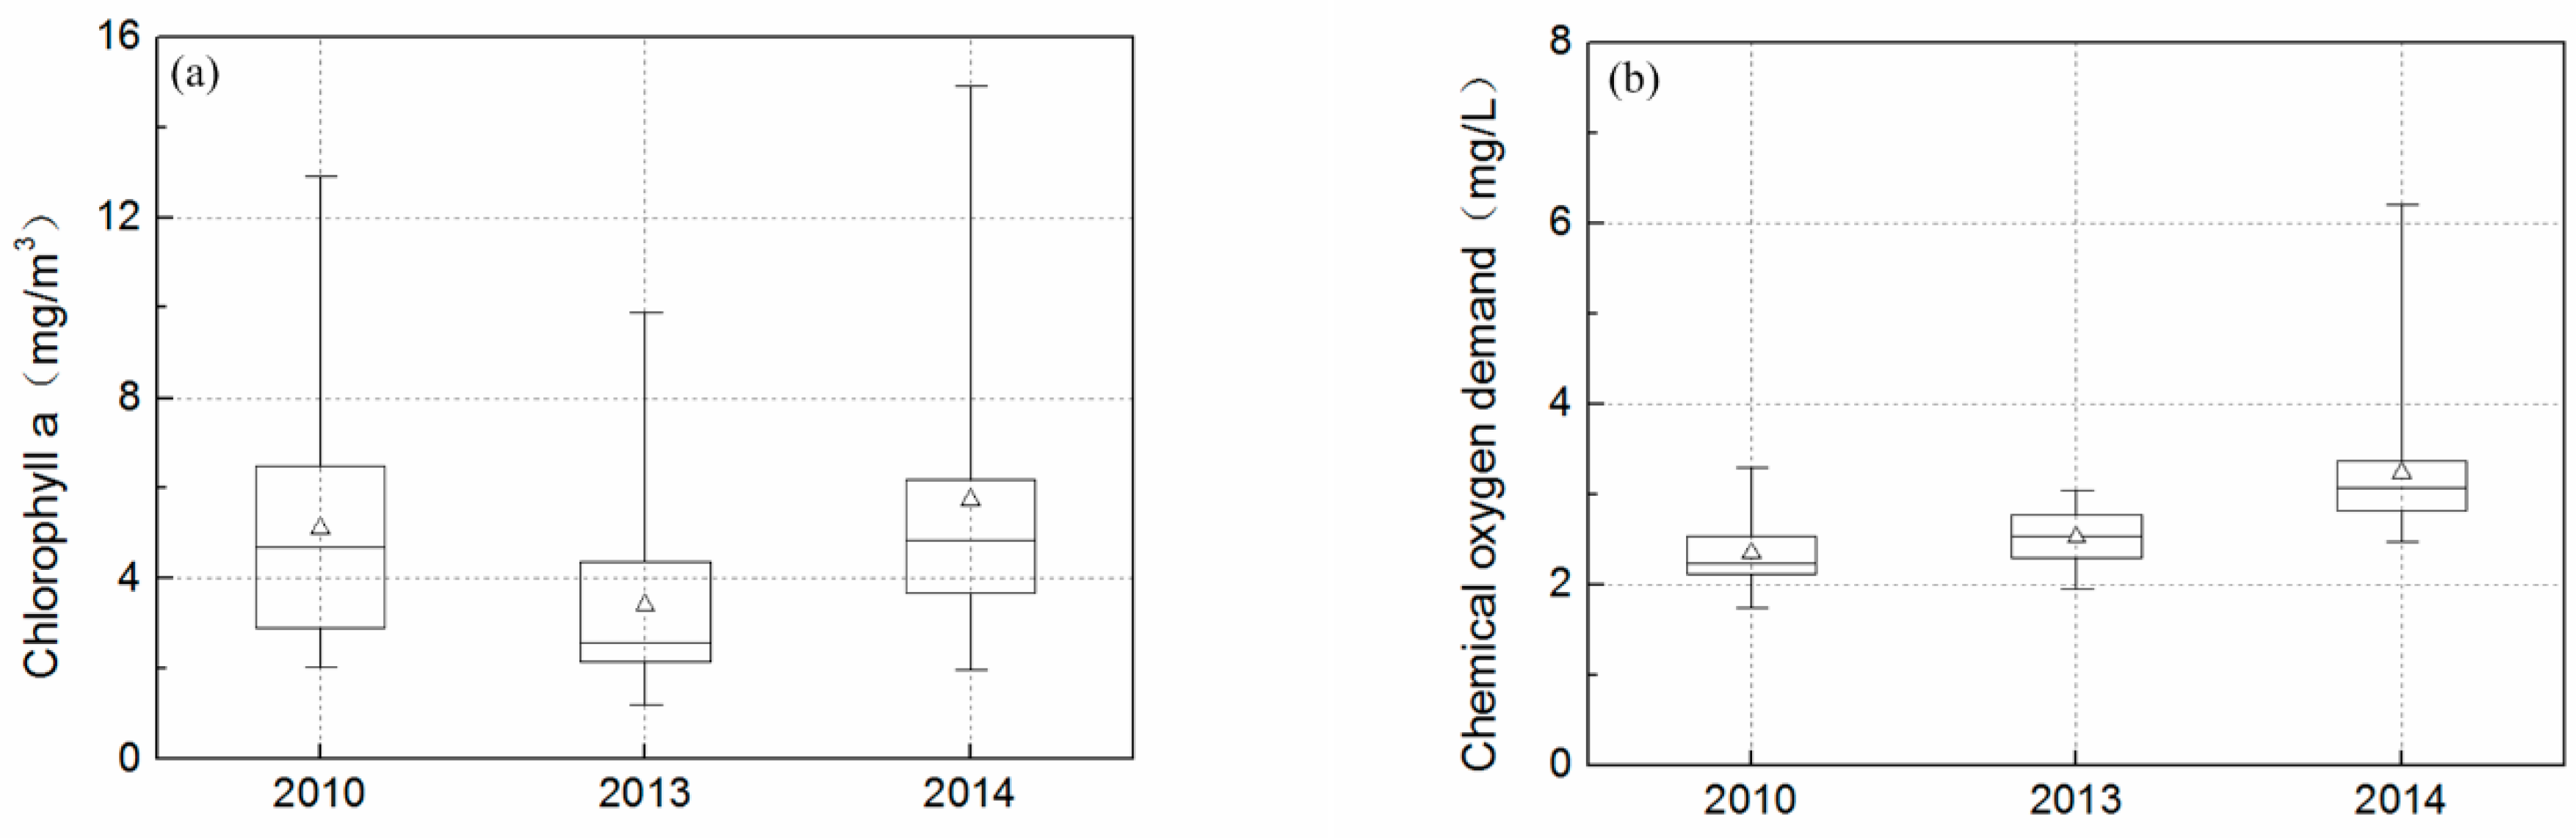
The nutrient levels of Lake Poyang increased between 2010–2014. In 2010 and 2013, the nutrient scores were similar, and most of sites reached “good” (Figure 6). However, many sites in 2014 declined to “fair”. In Part I, the method of TLI has been described, and four elements has been included, that is, TN, TP, Chl a, and COD. Transparency data were excluded due to inaccuracy caused by the complicated hydrodynamics. In addition to TN and TP, as mentioned before, the concentrations of Chl a (5.76 ± 3.48 mg/m3) and COD (3.24 ± 0.76 mg/L) were larger in 2014 than in 2010 and 2013 (Figure 7).
3.2.3. Benthic Macroinvertebrate
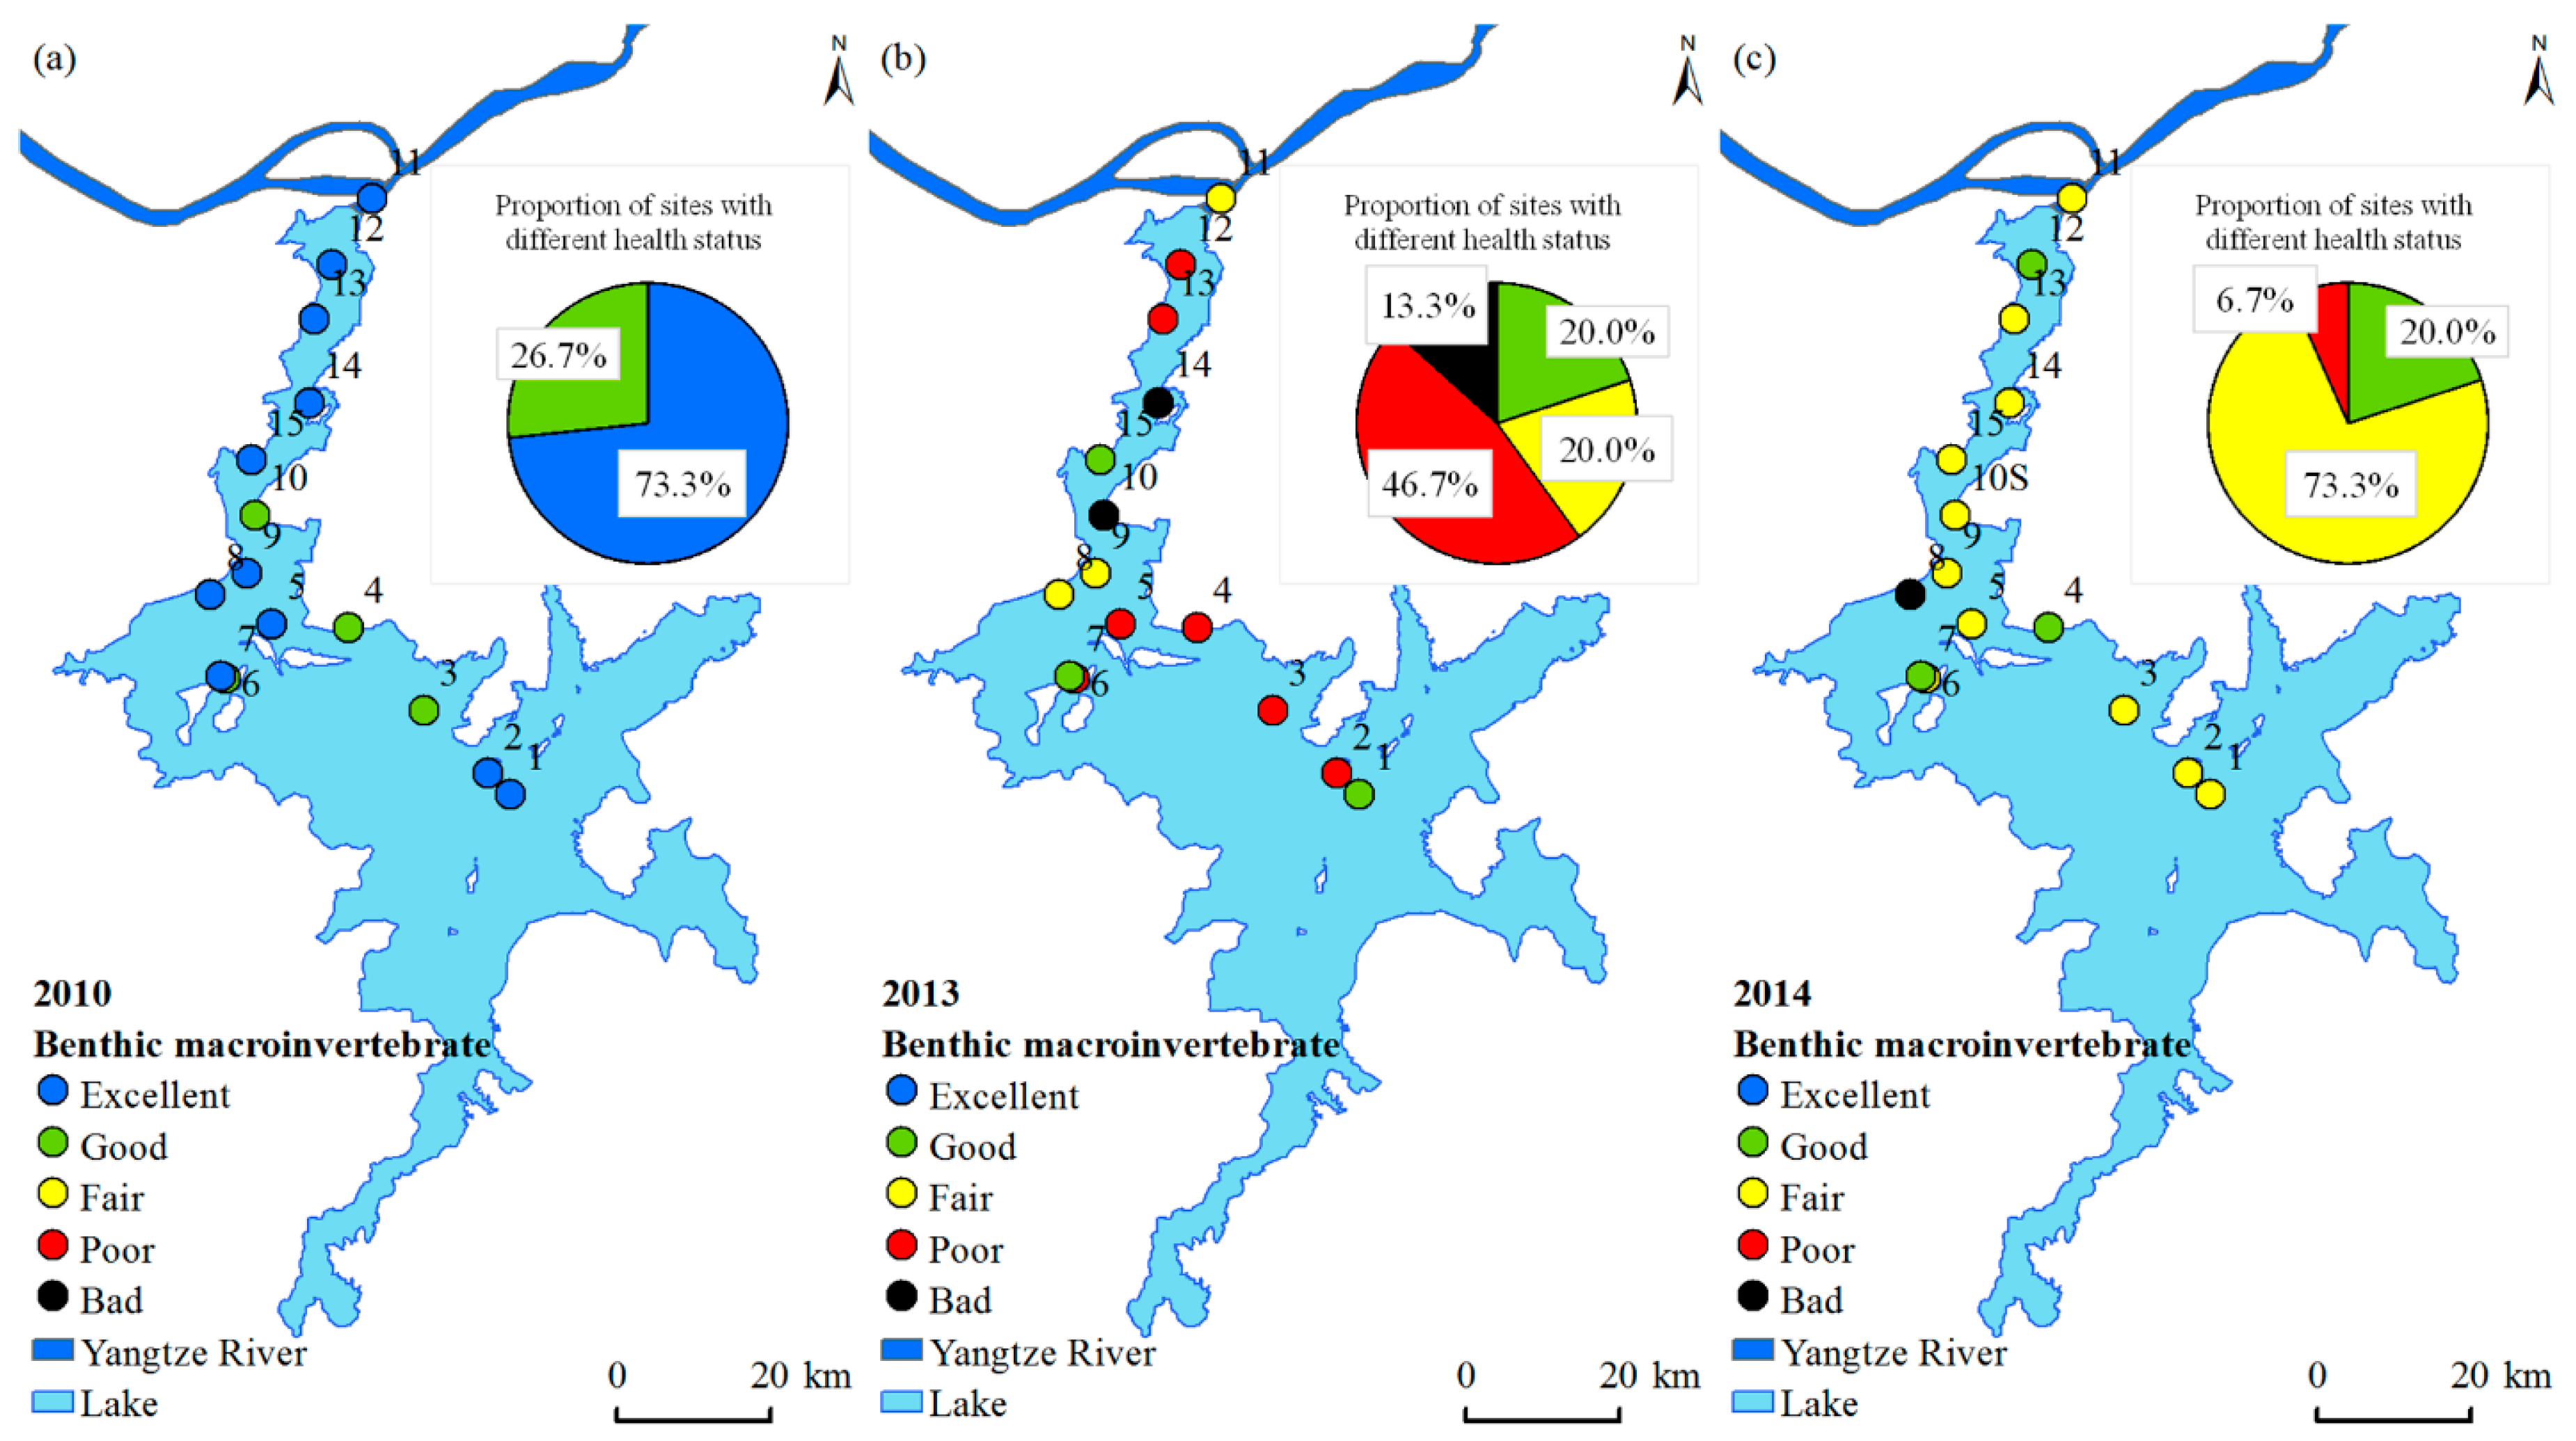
Both zooplankton and benthic macroinvertebrate scores decreased after 2010. Zooplankton abundances vary consistently with water levels, but insignificantly with nutrients [13]. Therefore, the health status of zooplankton might be affected by the different hydrological characteristics among these three years. Only the decreased benthic macroinvertebrate was analyzed, and extensive differences existed among the sites (Figure 8). All of the sites in 2010 were “good” or “excellent”. However, many sites along the eastern channel declined to “poor” in 2013. In 2014, the majority of sites (73.3%) were “fair”. The elevated state of benthic macroinvertebrate in 2010 was mainly due to the community richness; the Berger–Parker index was significantly higher in 2010 than the other two years, which ranged from 0.69 to 0.94, with an average value of an “excellent” 0.83. However, the scores of Berger–Parker index in 2013 and 2014 were lower, with a “poor” 0.37 and a “fair” 0.52. The family biotic index (FBI) acted similarly to the Berger–Parker index.
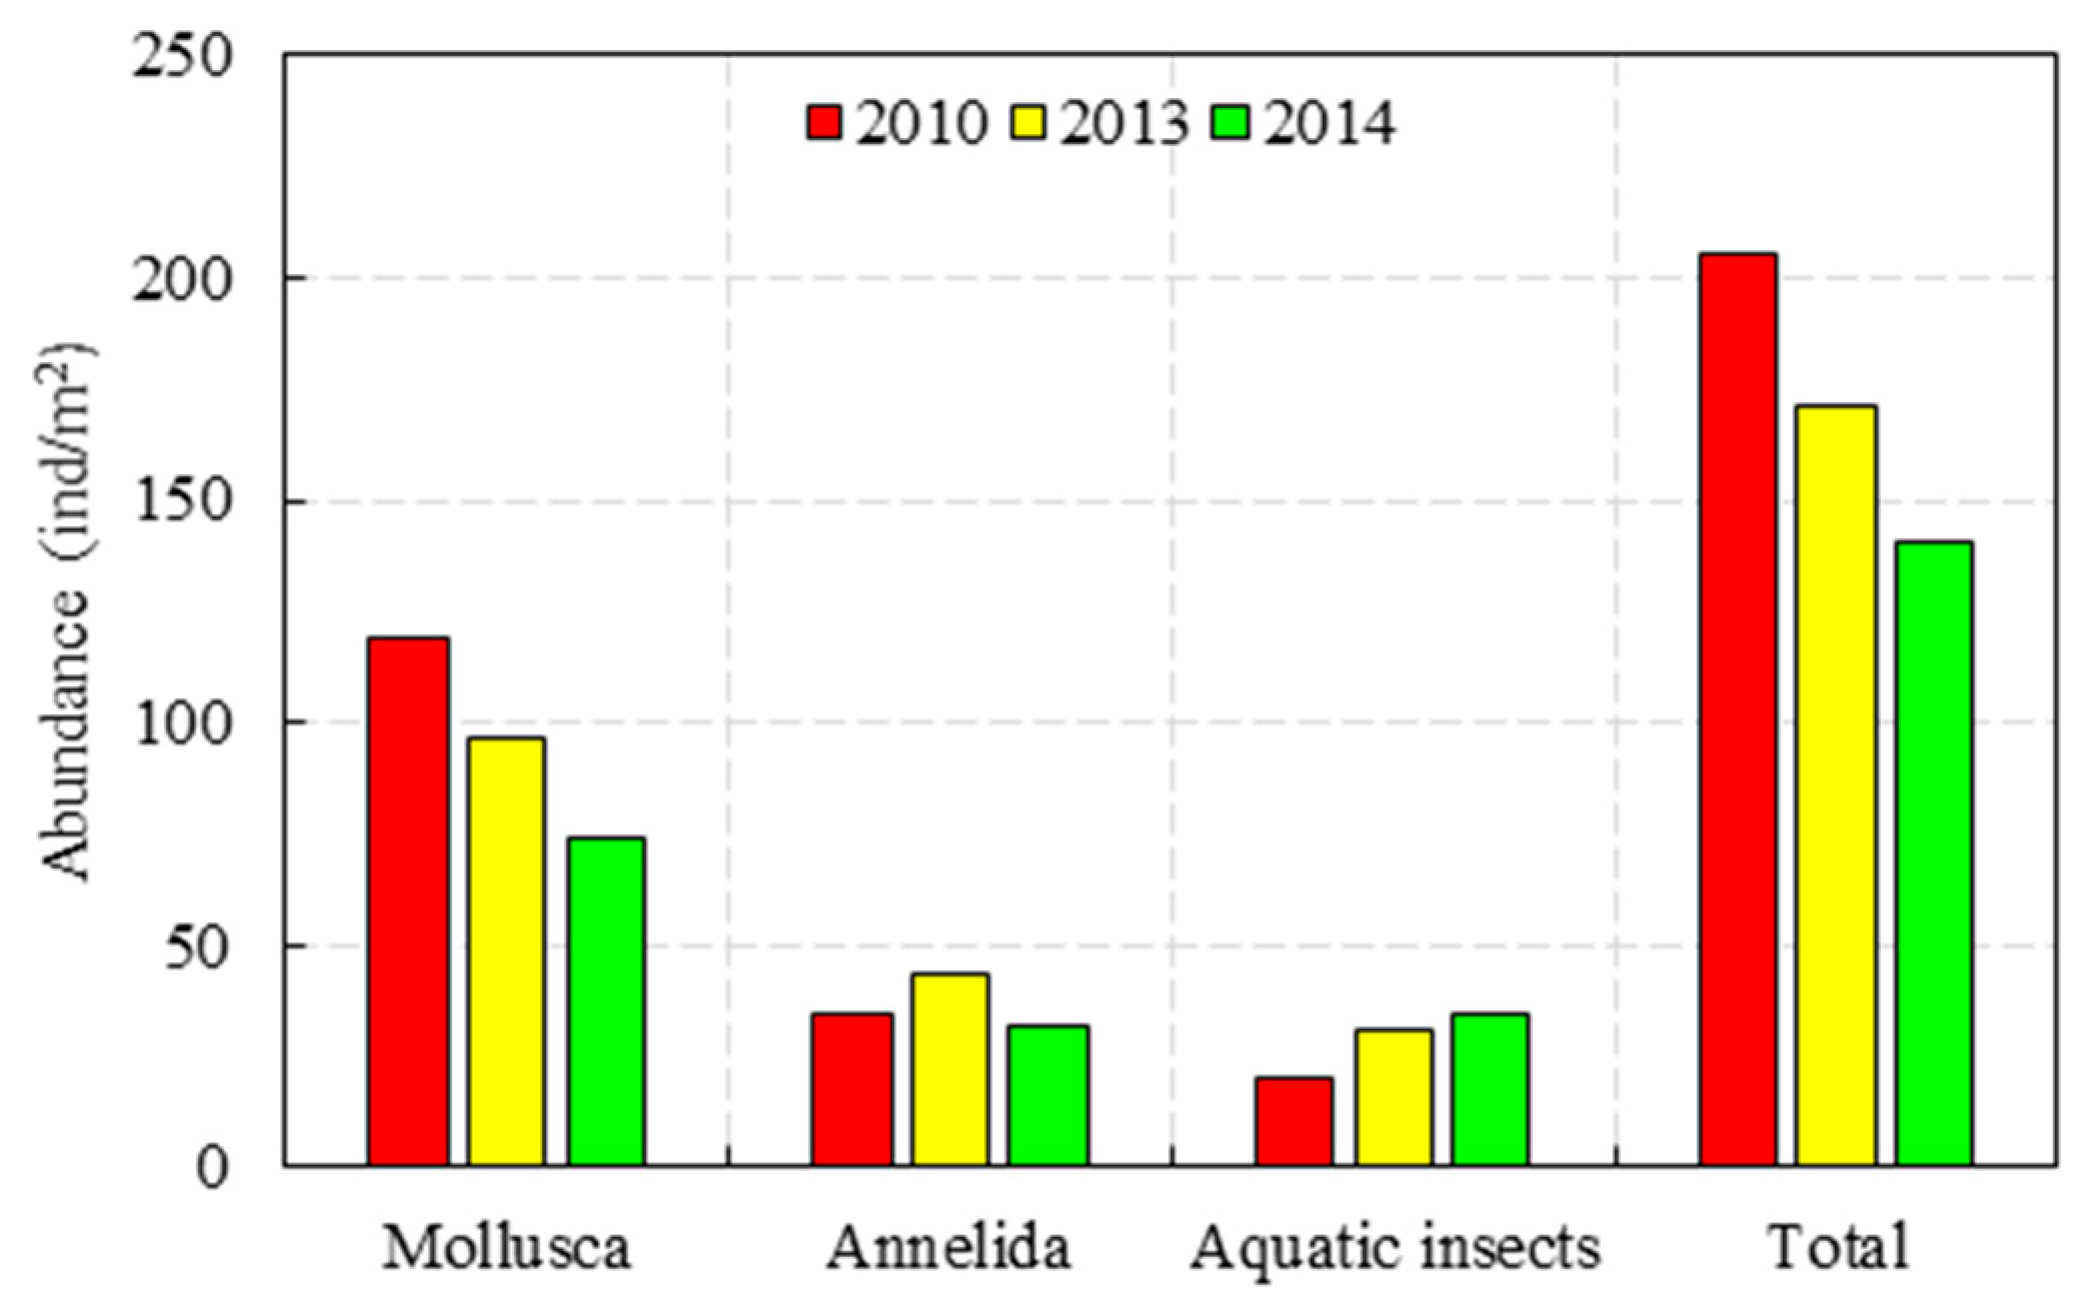
A comparison among the results in 2010, 2013, and 2014 revealed remarkable changes in the abundance of the benthic macroinvertebrate. The mean total abundance of benthic macroinvertebrate decreased from 205 ind/m2 in 2010 to 140 ind/m2 in 2014 (Figure 9), with Mollusca representing the greatest proportion of the decline (from 119 ind/m2 in 2010 to 74 ind/m2 in 2014). In contrast, the abundance of Annelida and aquatic insects showed little change.
4. Discussion
4.1. Health Status in Lake Poyang
Facing the decreasing trend of water quality (Figure 4) and increasing nutrients (Figure 6), future nutrient enrichment might occur in Lake Poyang. This water quality deterioration and increasing nutrients in Lake Poyang is influenced not only by the inherent succession process, but also by changes in hydrological rhythms among the Yangtze River and Lake Poyang sub-basins and many factors under human activities, such as the construction of water conservancy facilities, urbanization, the adjustment of industrial structure and land use patterns [1,2].
Our results revealed that the benthic macroinvertebrate changed greatly in abundance and diversity over the past few years in Lake Poyang (Figure 8). The total abundance of benthic invertebrate decreased (Figure 9), which has been demonstrated in previous studies [12,28]. Overloaded human disturbance, including reckless fishing, may destroy the living of benthic macroinvertebrate communities, especially for freshwater mussels. Extensive sand extraction may have had severely negative impacts on the benthic fauna of Lake Poyang, because the sediment type (sand and mud) is one of the dominant factors responsible for the benthic macroinvertebrate in terms of feeding types. According to Leeuw et al. [29], the volume of sand mining was 236 million m3/year in 2005–2006, which was approximately 40% of the regional demand for sand in the lower Yangtze Valley. The dredging-inducing changes in substrate instability, sediment grain size, and high turbidity might have influenced the survival, recruitment, and growth of Mollusca, such as mussels [30]. The health status of wintering birds varied greatly (Figure 3), and depended on the hydrological characteristics [31]. When Lake Poyang is at a normal water level year, it is most favorable for the overwintering migratory birds, and the number will be the largest. However, if the water level is too high or too low, the wintering birds can be affected due to a lack of food or feeding difficulties [32]. Based on the statistics regarding the water levels in these three years (Table 1), the hydrological characteristics in 2010 were less suitable for wintering birds than in the other two years (2013 and 2014).
Recently, some social aspects, such as pathogenic potential and sand mining indicators, have been improved (Figure 3). Considerable efforts have been exerted to control schistosomiasis, and the local government measures included the improvement of lavatories, treatment of sick cows and patients, a ban on overgrazing, and the killing of snails in sensitive zones, in order to reduce the instances of pathogenic potential. Sand mining affected the hydrologic regimes, including increased areas of water discharge sections and water turbidity. Sand mining also affected the sediment pattern in the lower reaches of the Yangtze River. However, the increased demand for building materials in the construction industry should be met through sand mining in Lake Poyang, especially since 2001, when this practice was banned in the Yangtze River [33]. Given the harm of sand mining, the government limited the volume and range, contributing to the higher score of 2013 and 2014. Dish-shaped sub-lakes are important parts of the wetland, where land and water are frequently alternated with rich vegetation biodiversity. They are vital to the maintenance of the integrity and biodiversity of the Lake Poyang ecosystem, since such dish-shaped sub-lakes provide food and shelter for approximately 80% of the winter waterfowls. Thus, effective measures should be taken to protect the dish-shaped sub-lakes. However, with only a few under efficient management by the protection administration until 2014, the resulting scores were consistently “bad” (Figure 3).
4.2. Comparison with Previous Assessments of Lake Poyang
The results of this study were consistent with the conclusions drawn from previous studies [16]. The health status of Lake Poyang in recent years has been “fair” or “good”. However, compared with other assessments in Lake Poyang, LP-EHI considered more comprehensive indicators including water level, runoff, wetland vegetation, birds, dish-shaped sub-lake areas under management, and sand mining. These indicators reflect the ecological status in the lake well, but were excluded in the previous studies. Our findings also show the annual variability of health status indicators such as water quality deterioration, declined benthic macroinvertebrate, better management of sand mining, which has been seldom explored in the previous assessments. In this paper, the methods of calculating indices were also optimized to the specific features of Lake Poyang. For example, the TLI score was higher than that in other studies, because transparency was excluded from the calculations, and the weight had been assigned to the other four elements in the TLI (TN, TP, COD, and Chl a). Frequent water exchange and quick flow velocity caused a random mix of sediment and water; therefore, the measured transparency value presented a certain degree of uncertainty that might have affected the assessment accuracy.
4.3. Data Uncertainty
To assess the health of Lake Poyang, the LP-EHI combined sub-indices into a single indicative master index. We incorporated data for physical, chemical, social services, as well as most of the biological indicators in 2010, 2013, and 2014 for evaluation. However, a very small portion of the data in these years was difficult to obtain, because of the temporal limitation of published data and the lack of systematic observation. For example, data on vegetation and fish were not available. Given the temporal scale of fish and aquatic vegetation [26] in Table 2, these indicators exhibited only small changes in a few years. Therefore, the weight ratio of the four major Chinese carps and year 1–2 fishes were used instead of the latest accessible year (2011), and the vegetation indicator in 2013 replaced the data. In addition, the schistosomiasis data in 2012 were used due to the lack of data in other years. However, this data is relatively stable and under control by the local government. Therefore, the health status revealed a slight change in recent years.
4.4. Conversion about Spatial and Temporal Resolution in LP-EHI
Considering the temporal and spatial scales in Table 2 and characteristics of ecological elements in Lake Poyang, the temporal and spatial resolution of each indicator are listed in Table 3. For large-scale indices, such as physical and social service indices, the annual health status and trends of 2010, 2013, and 2014 were analyzed. For those indices, such as chemical and partial biological integrity indices, the seasonal health status for each sample site can be calculated. When the annual health status and variations were assessed, the straight averages of these chemical or biological components were applied. Due to that, the sample sites were evenly distributed in the main lake and regular time sampling interval, and the averages defined in our study were appropriate for conversion from smaller-scale to annual scale assessment.
5. Conclusions
This study evaluated the health status of Lake Poyang based on a new developed index (LP-EHI). The health status of Lake Poyang in 2010, 2013, and 2014 were at “good” (0.62), “fair” (0.59), and “fair” (0.59) levels respectively, with a gradually deteriorating trend. The individual indices showed varied health statuses. Several indices’ health scores, including water quality, nutrition, and benthic macroinvertebrate, decreased with an increasing disturbance by human activities. However, several protection measures, such as controlling sand mining in the main channel, could improve the resulting scores. Furthermore, the results showed that the health status was highly related to hydrological processes. Compared with the previous index applied in Lake Poyang, LP-EHI described the health status of the lake ecosystem from more comprehensive perspectives, including the physical, chemical, biological, and social service aspects. These evaluation results provided considerable scientific support for lake management, restoration, and conservation.
Author Contributions
L.Q., J.H. and J.G. conceived and designed the research; L.Q. and Q.H. performed the experiments and analyzed the data; S.W. and Y.G. collected historical data; All authors contributed to writing the manuscript; L.Q., J.H., and Q.H. revised the manuscript.
Funding
This research was jointly supported by the National Basic Research Program of China (Grant No. 2012CB417006), the Major Water Resources Science and Technology Program of Jiangxi Water Resources Department (Grant No. KT201406), National Natural Science Foundation of China (Grant No. 41561093, 41661102), Youth Natural Scientific Foundation of Jiangxi Province (Grant No. 20161BAB213076).
Acknowledgments
We acknowledge the Jiangxi Province Poyang Lake Hydrology Bureau for providing hydrological measured data, the Lake Poyang Wetland Observation and Research station and Jiangxi Ecological Civilization Research and Promotion Association for providing ecological investigation data, and Jiangxi Hydraulic Research Institute for providing statistical data about service functions.
Conflicts of Interest
The authors declare no conflict of interest.
References
- Liu, X.; Teubner, K.; Chen, Y. Water quality characteristics of Poyang Lake, China, in response to changes in the water level. Hydrol. Res. 2016, 47, 238–248. [Google Scholar] [CrossRef] [Green Version]
- Du, Y.L.; Peng, W.Q.; Liu, X.B.; Wang, S.Y.; Liu, X.B.; Chen, C.; Liu, C.; Wang, L. Modeling of water quality evolution and response with the hydrological regime changes in Poyang Lake. Environ. Earth Sci. 2018, 77, 265. [Google Scholar] [CrossRef]
- Hu, Z.P.; Ge, G.; Liu, C.L. Cause analysis and early warning for wetland vegetation degradation in Poyang Lake. Resour. Environ. Yangtze Basin 2015, 23, 381–386. (In Chinese) [Google Scholar]
- Lai, G.Y.; Wang, P.; Li, L. Possible impacts of the Poyang Lake (China) hydraulic project on lake hydrology and hydrodynamics. Hydrol. Res. 2016, 47, 187–205. [Google Scholar] [CrossRef] [Green Version]
- Wang, P.; Lai, G.Y.; Li, L. Predicting the Hydrological Impacts of the Poyang Lake Project Using an EFDC Model. J. Hydrol. Eng. 2015, 20, 5–19. [Google Scholar] [CrossRef]
- Lai, X.J.; Jiang, J.H.; Huang, Q.; Xu, L.G. Two-dimensional numberical simulation of hydrodynamic and pollutant transport for Lake Poyang. J. Lake Sci. 2011, 23, 893–902. (In Chinese) [Google Scholar]
- Lai, X.J.; Liang, Q.H.; Jiang, J.H.; Huang, Q. Impoundment Effects of the Three-Gorges-Dam on Flow Regimes in Two China’s Largest Freshwater Lakes. Water Resour. Manag. 2014, 28, 5111–5124. [Google Scholar] [CrossRef]
- Lai, X.J.; Shankman, D.; Huber, C.; Yesou, H.; Huang, Q.; Jiang, J.H. Sand mining and increasing Poyang Lake’s discharge ability: A reassessment of causes for lake decline in China. J. Hydrol. 2014, 519, 1698–1706. [Google Scholar] [CrossRef]
- Lai, X.J.; Huang, Q.; Zhang, Y.H.; Jiang, J.H. Impact of lake inflow and the Yangtze River flow alterations on water levels in Poyang Lake, China. Lake Reserv. Manag. 2014, 30, 321–330. [Google Scholar] [CrossRef]
- Li, Y.L.; Yao, J.; Zhao, G.Z.; Zhang, Q. Evidences of hydraulic relationships between groundwater and lake water across the large floodplain wetland of Poyang Lake, China. Water Sci. Technol. 2018, 18, 698–712. [Google Scholar] [CrossRef]
- Wu, Z.S.; Zhang, D.; Cai, Y.; Wang, X.; Zhang, L.; Chen, Y. Water quality assessment based on the water quality index method in Lake Poyang: The largest freshwater lake in China. Sci. Rep. 2017, 7, 17999. [Google Scholar] [CrossRef] [PubMed] [Green Version]
- Cai, Y.J.; Lu, Y.J.; Wu, Z.S.; Chen, Y.W.; Zhang, L.; Lu, Y. Community structure and decadal changes in macrozoobenthic assemblages in Lake Poyang, the largest freshwater lake in China. Knowl. Manag. Aquat. Ecosyst. 2014, 414, 9. [Google Scholar] [CrossRef]
- Liu, B.G.; Liu, X.; Wu, Y.; Zhong, Z.; Chen, Y.W. Spatial and temporal distribution characteristics of planktonic crustaceans in Lake Poyang. Acta Ecol. Sin. 2016, 36, 1–9. [Google Scholar] [CrossRef]
- Wu, Z.S.; Cai, Y.J.; Liu, X.; Xu, C.P.; Chen, Y.W.; Zhang, L. Temporal and spatial variability of phytoplankton in Lake Poyang: The largest freshwater lake in China. J. Gt. Lakes Res. 2013, 39, 476–483. [Google Scholar] [CrossRef]
- Huang, Q.; Gao, J.F.; Zhang, Y.H.; Yan, R.H.; Wang, Y.; Cai, Y.J. Aquatic ecological integrity assessment of four large lakes in the middle-to-lower reaches of the Yangtze River, China. Acta Ecol. Sin. 2016, 36, 118–126. [Google Scholar] [CrossRef]
- Zhang, Y.H.; Yang, G.S.; Li, B.; Cai, Y.J.; Chen, Y.W. Using eutrophication and ecological indicators to assess ecosystem condition in Poyang Lake a Yangtze connected lake. Aquat. Ecosyst. Health Manag. 2016, 19, 29–39. [Google Scholar] [CrossRef]
- Qi, L.Y.; Huang, J.C.; Huang, Q.; Gao, J.F.; Wang, S.G.; Guo, Y.Y. Assessing aquatic ecological health for Lake Poyang, China: Part I Index development. Water 2018. under review. [Google Scholar]
- Herlihy, A.T.; Larsen, D.P.; Paulsen, S.G.; Urquhart, N.S.; Rosenbaum, B.J. Designing a spatially balanced, randomized site selection process for regional stream surveys: The EMAP mid-Atlantic pilot study. Environ. Monit. Assess. 2000, 63, 95–113. [Google Scholar] [CrossRef]
- Su, X.M.; Steinman, A.D.; Xue, Q.; Zhao, Y.Y.; Xie, L.Q. Evaluating the contamination of microcystins in Lake Taihu, China: The application of equivalent total MC-LR concentration. Ecol. Indic. 2018, 89, 445–454. [Google Scholar] [CrossRef]
- Cai, Y.J.; Lu, Y.J.; Liu, J.S.; Dai, X.L.; Lu, Y.; Gong, Z.J. Macrozoobenthic community structure in a large shallow lake: Disentangling the effect of eutrophication and wind-wave disturbance. Limnologica 2016, 59, 1–9. [Google Scholar] [CrossRef]
- Baranyi, C.; Hein, T.; Holarek, C.; Keckeis, S.; Schiemer, F. Zooplankton biomass and community structure in a Danube River floodplain system: Effects of hydrology. Freshw. Biol. 2002, 47, 473–482. [Google Scholar] [CrossRef]
- Koste, W. Die Radertierchen Mitteleuropas; Gebruder Borntrager: Berlin, Germany, 1978. [Google Scholar]
- Kiefer, F. Das Zooplankton der Binnengewasser; 2. Teil; E. Schweitzerbart’ sche-Verlagsbuchhandlung: Stuttgart, Germany, 1978. [Google Scholar]
- Hebert, P.D.N.; Wilson, C.C. Provincialism in plankton: Endemism and allopatric speciation in Australian Daphnia. Evolution 1994, 48, 1333–1349. [Google Scholar] [CrossRef] [PubMed]
- Zhi, H.; Zhao, Z.; Zhang, L. The fate of polycyclic aromatic hydrocarbons (PAHs) and organochlorine pesticides (OCPs) in water from Poyang Lake, the largest freshwater lake in China. Chemosphere 2015, 119, 1134–1140. [Google Scholar] [CrossRef] [PubMed]
- Li, C.H.; Cui, W.; Pang, A.P.; Zheng, X.K. Progress on Theories and Methods of Watershed Eco-health Assessment. Process Geogr. 2008, 27, 9–17. (In Chinese) [Google Scholar]
- Li, Y.F.; Hang, C.Q.; Hu, F.; Yuan, M.; Gu, X.N.; Lu, S.B.; Zeng, X.J.; Lin, D.D. Role of new strategy in transmission control of schistosomiasis in Poyang Lake region. Chin. J. Schistosomiasis Control 2017, 29, 689–694. [Google Scholar] [CrossRef]
- Wang, H.Z.; Xu, Q.Q.; Cui, Y.D.; Liang, Y.L. Macrozoobenthic community of Poyang Lake, the largest freshwater lake of China, in the Yangtze floodplain. Limnology 2007, 8, 65–71. [Google Scholar] [CrossRef] [Green Version]
- Leeuw, J.D.; Shankman, D.; Wu, G.F.; De Boer, W.F.; Burnham, J.; He, Q.; Yesou, H.; Xiao, J. Strategic assessment of the magnitude and impacts of sand mining in Poyang Lake, China. Reg. Environ. Chang. 2009, 10, 95–102. [Google Scholar] [CrossRef] [Green Version]
- Zhang, Q.H.; Dong, X.H.; Chen, Y.W.; Yang, X.D. Hydrological alterations as the major driver on environmental change in a floodplain Lake Poyang (China): Evidence from monitoring and sediment records. J. Great Lakes Res. 2018, 44, 377–387. [Google Scholar] [CrossRef]
- Li, Y.K.; Qian, F.W.; Shan, J.H.; Li, J.; Yuan, F.K.; Miu, L.J.; Xie, G.Y. The effect of climate change on the population fluctuation of the Siberian crane in Poyang Lake. Acta Ecol. Sin. 2014, 34, 2645–2653. [Google Scholar] [CrossRef]
- Hu, Z.P.; Ge, G.; Liu, C.L. Response of wintering migratory birds to hydrological processes in Poyang Lake. J. Nat. Res. 2014, 29, 1770–1778. [Google Scholar] [CrossRef]
- Jiang, F.; Qi, S.H.; Liao, F.Q.; Zhang, X.X.; Wang, D.; Zhu, J.X.; Xiong, M.Y. Hydrological and sediment effects from sand mining in Poyang Lake during 2001–2010. Acta Geogr. Sin. 2015, 70, 837–845. [Google Scholar] [CrossRef]
Figure 1.
Locations of sample sites in Lake Poyang, China.

Figure 2.
Total score of health status at the sample sites in Lake Poyang in 2010 (a), 2013 (b) and 2014 (c).
Figure 2.
Total score of health status at the sample sites in Lake Poyang in 2010 (a), 2013 (b) and 2014 (c).

Figure 3.
Annual variations of individual index scores of ecosystem health assessment in 2010 (a), 2013 (b) and 2014 (c).
Figure 3.
Annual variations of individual index scores of ecosystem health assessment in 2010 (a), 2013 (b) and 2014 (c).

Figure 4.
Health status of water quality at the sample sites in Lake Poyang in 2010 (a), 2013 (b) and 2014 (c).
Figure 4.
Health status of water quality at the sample sites in Lake Poyang in 2010 (a), 2013 (b) and 2014 (c).

Figure 5.
Variation of total nitrogen (a), total phosphorus (b) and electrical conductivity (c) in 2010, 2013, and 2014. The maximum, 75th, mean, 25th, and minimum percentile are included in the boxplot.
Figure 5.
Variation of total nitrogen (a), total phosphorus (b) and electrical conductivity (c) in 2010, 2013, and 2014. The maximum, 75th, mean, 25th, and minimum percentile are included in the boxplot.

Figure 6.
Health status of nutrient conditions at the sample sites in Lake Poyang in 2010 (a), 2013 (b) and 2014 (c).
Figure 6.
Health status of nutrient conditions at the sample sites in Lake Poyang in 2010 (a), 2013 (b) and 2014 (c).

Figure 7.
Variation of Chlorophyll a (a) and COD (b) in 2010, 2013, and 2014.

Figure 8.
Health status of benthic macroinvertebrate at the sample sites in Lake Poyang in 2010 (a), 2013 (b) and 2014 (c).
Figure 8.
Health status of benthic macroinvertebrate at the sample sites in Lake Poyang in 2010 (a), 2013 (b) and 2014 (c).

Figure 9.
The abundance of Mollusca, Annelida, aquatic insects, and total benthic invertebrate at Lake Poyang in 2010, 2013, and 2014.
Figure 9.
The abundance of Mollusca, Annelida, aquatic insects, and total benthic invertebrate at Lake Poyang in 2010, 2013, and 2014.


Table 1.
Highest and lowest 10-day water levels in 2010, 2013, and 2014.
| Year | Average of Highest 10-Day Water Level | High Water Level Score (Health Status) | Average of Lowest 10-Day Water Level | Low Water Level Score (Health Status) | Average (Health Status) |
|---|---|---|---|---|---|
| 2010 | 20.08 | 0.46 (“fair”) | 7.60 | 1.00 (“excellent”) | 0.73 (“good”) |
| 2013 | 16.68 | 1.00 (“excellent”) | 7.42 | 1.00 (“excellent”) | 1.00 (“excellent”) |
| 2014 | 18.48 | 1.00 (“excellent”) | 7.32 | 1.00 (“excellent”) | 1.00 (“excellent”) |
Table 2.
Different biological characteristics and their spatial and temporal scales in basin [26].
Table 2.
Different biological characteristics and their spatial and temporal scales in basin [26].
| Biology | Temporal Scale | Spatial Scale |
|---|---|---|
| Fish | Years | km2 |
| Aquatic vegetation | Years/decades | km2 |
| Benthic macroinvertebrate | Months/years | hm2 |
| Phytoplankton | Days/weeks | m2 |
Table 3.
Different temporal and spatial resolution of indices in LP-EHI.
| Target Level A | Sub-Target B | Element Level C | Assessment Indicator D | Temporal Resolution | Spatial Resolution |
|---|---|---|---|---|---|
| LP-EHI | Natural properties B1 | Physical integrity C1 | Water level D1 | Annual | Lake |
| Tributary connectivity D2 | Annual | Lake | |||
| Lake area D3 | Annual | Lake | |||
| Runoff D4 | Annual | Lake | |||
| Coastal habitat D5 | Annual | Lake | |||
| Chemical integrity C2 | Water quality D6 | Seasonal | Sites | ||
| Nutrition D7 | Seasonal | Sites | |||
| Toxicity D8 | Seasonal | Sites | |||
| Biological integrity C3 | Phytoplankton D9 | Seasonal | Sites | ||
| Zooplankton D10 | Seasonal | Sites | |||
| Benthic macroinvertebrate D11 | Seasonal | Sites | |||
| Wetland plants D12 | Annual | Lake | |||
| Fish D13 | Annual | Lake | |||
| Bird D14 | Annual | Lake | |||
| Social service B2 | Human health C4 | Drinking water D15 | Annual | Lake | |
| Pathogenic potential D16 | Annual | Lake | |||
| Regulation C5 | Flood storage capacity D17 | Annual | Lake | ||
| Human activity C6 | Sand mining D18 | Annual | Lake | ||
| Response C7 | Dish-shaped sub-lake under management D19 | Annual | Lake |
© 2018 by the authors. Licensee MDPI, Basel, Switzerland. This article is an open access article distributed under the terms and conditions of the Creative Commons Attribution (CC BY) license (http://creativecommons.org/licenses/by/4.0/).
Share and Cite
MDPI and ACS Style
Qi, L.; Huang, J.; Huang, Q.; Gao, J.; Wang, S.; Guo, Y. Assessing Aquatic Ecological Health for Lake Poyang, China: Part II Index Application. Water 2018, 10, 909. https://doi.org/10.3390/w10070909
AMA Style
Qi L, Huang J, Huang Q, Gao J, Wang S, Guo Y. Assessing Aquatic Ecological Health for Lake Poyang, China: Part II Index Application. Water. 2018; 10(7):909. https://doi.org/10.3390/w10070909
Chicago/Turabian StyleQi, Lingyan, Jiacong Huang, Qi Huang, Junfeng Gao, Shigang Wang, and Yuyin Guo. 2018. "Assessing Aquatic Ecological Health for Lake Poyang, China: Part II Index Application" Water 10, no. 7: 909. https://doi.org/10.3390/w10070909
Note that from the first issue of 2016, this journal uses article numbers instead of page numbers. See further details here.