Impacts of Climate Change on Flood-Prone Areas in Davao Oriental, Philippines


1
Graduate School for International Development and Cooperation, Hiroshima University, 1-5-1 Kagamiyama, Higashi-Hiroshima 739-8529, Hiroshima, Japan
2
Institute of Computing and Engineering, Davao Oriental State College of Science and Technology, Guang-guang, Dahican, Mati City 8200, Davao Oriental, Philippines
*
Author to whom correspondence should be addressed.
Water 2018, 10(7), 893; https://doi.org/10.3390/w10070893
Submission received: 28 May 2018
/
Revised: 19 June 2018
/
Accepted: 2 July 2018
/
Published: 4 July 2018
(This article belongs to the Section Hydrology)
Abstract
:This study aims to quantitatively assess the impacts of climate change on the flood-prone risk areas in Davao Oriental, Philippines for the years 2030, 2050, and 2100 in comparison with the present situation by identifying flood risk zones based on multisource data, including rainfall, slope, elevation, drainage density, soil type, distance to the main channel, and population density. The future temperatures and rainfall projections from the Coupled Model Intercomparison Project Phase 5 (CMIP5) predictions of the Intergovernmental Panel on Climate Change (IPCC) were used. The future temperatures from the CMIP5 predictions showed that Davao Oriental should experience approximately 1 °C and 3 °C increases under the Representative Concentration Pathway (RCP)4.5 and RCP8.5 scenarios, respectively, while the rainfall should slightly increase in the coming years. Among the 39 general circulation models (GCMs) available from CMIP5, the GFDL-ESM2M model showed good agreement with the observed rainfall dataset at the local stations. The intensity of rainfall should increase approximately 69% in the future, resulting in an increase in the magnitude of the floods. The resulting flood risk map shows that 95.91% of Davao Oriental is presently under the low and moderate flood risk categories, and those categories should slightly decrease to 95.75% in the future. The high and very high flood risk areas cover approximately 3% of the province at present and show no dramatic change in the future. Presently, 28 out of the 183 barangays (towns) are at high and very high risks of floods, whereas in the coming years, only one barangay will be added to the very high risk of floods. These barangays under the high and very high categories of flood risk are primarily situated on riversides and coastal areas. Thus, immediate actions from decision-makers are needed to develop a community-based disaster risk plan under the future conditions.
1. Introduction
Global warming is the result of an increase in cumulative carbon dioxide emissions in the atmosphere. According to the Intergovernmental Panel on Climate Change (IPCC) [1], the global temperatures at the end of the century are likely to increase by 0.3–4.8 °C under the Representative Concentration Pathway (RCP)2.6–8.5 scenarios, respectively. The impacts of climate change can affect the temporal and spatial distribution of river basins. These can increase the magnitude and frequency of extreme hydrological events [2,3] and can increase the risk of floods [4,5].
Over the past decade, most case studies on hydrological impacts, such as flood assessments, considered the results of general circulation models (GCMs) as a source for evaluation. However, there are limitations to the models, such as the coarse resolution and uncertainty in capturing critical regional parameters, such as geographic and atmospheric parameters, and clouds [3]. To overcome such limitations, many statistical and dynamical models have emerged in recent years that can transfer the coarse resolution to finer spatial outputs at the regional scale [6,7].
In the case of flood risk assessments, according to the IPCC [5] and Hirabayashi et al. [4], a warmer climate would increase the risk of floods. In Hirabayashi et al. [4], a global-scale flood risk assessment using multiple change models concluded that an ensemble of projections under a new high-concentration scenario demonstrates a substantial increase in flood frequency in Southeast Asia with small uncertainty in the direction of change. Furthermore, Hirabayashi et al. [4] revealed that the global exposure to floods would increase depending on the degree of warming.
At the regional scale, several studies [3,8,9] have shown remarkable results concerning the projected changes in floods using multiple climate change models. Dau and Kuntiyawichai [3] aimed to demonstrate the feasibility of assessing flood simulations that correspond to the impacts of climate change on the flood risks in Central Vietnam and used the Hadley Centre Coupled Model version 3 (HadCM3) for the A2 and B2 scenarios and coupling hydrological models. Their results indicated that the weather will be become hotter in the future, and they demonstrated a potential increase in runoff and water levels under future climate change scenarios. Another study, conducted by Huang et al. [9], concerned the projections of climate change impacts on floods and droughts and evaluated the performance of a set of climate change scenarios from the ensemble’s project for flood and drought projections using the soil and water integrated model (SWIM). The study showed that there is a moderate certainty that most German rivers will experience more extreme 50-year floods and more frequent occurrences of 50-year droughts. Another study, conducted by Apurv et al. [8], concerned the climate change impact on floods and suggested that there is an increase in the number of spells with higher rainfall and longer duration, which can lead to an increase in peak floods and the total flood volume. Apurv et al. [8] aimed to analyze the Coupled Model Intercomparison Project Phase 5 (CMIP5) decadal predictions for precipitation over five sub-basins of the Brahmaputra River.
Many case studies agree that the regional downscaling approach could reduce the uncertainty in the global climate models. Basconcillo et al. [10] used regional statistical downscaling of three global climate models (BCM2, CNCM3, and MPEH5) for two emission scenarios (A1B and A2) in the fourth assessment (AR4) report of the IPCC by utilizing a spatial interpolation technique in interpolating downscaled climate projections at weather stations on grids to aggregate the entire study area. This study assessed which of the global climate models has good agreement with the observed rainfall data at weather stations. It also used point spatial interpolation to aggregate the rainfall data in the entire Davao Oriental area.
In this study, the potential impacts of climate change on flood hazards and risks in the province of Davao Oriental are investigated using the temperature and rainfall projections for the region from the CMIP5 predictions of the IPCC under the RCP4.5 and RCP8.5 scenarios, based on multicriteria data analysis (MCDA). Section 2 describes the study region and multisource datasets used, including the projected rainfall for the future. Section 3 illustrates the methodology for the MCDA concepts and an analytic hierarchy process (AHP) framework, and Section 4 describes the results of a multicriteria analysis for the future flood risks in the study region. Finally, the discussion and conclusions are presented in Section 5 and Section 6, respectively.
2. Study Area and Data Set
2.1. Study Site
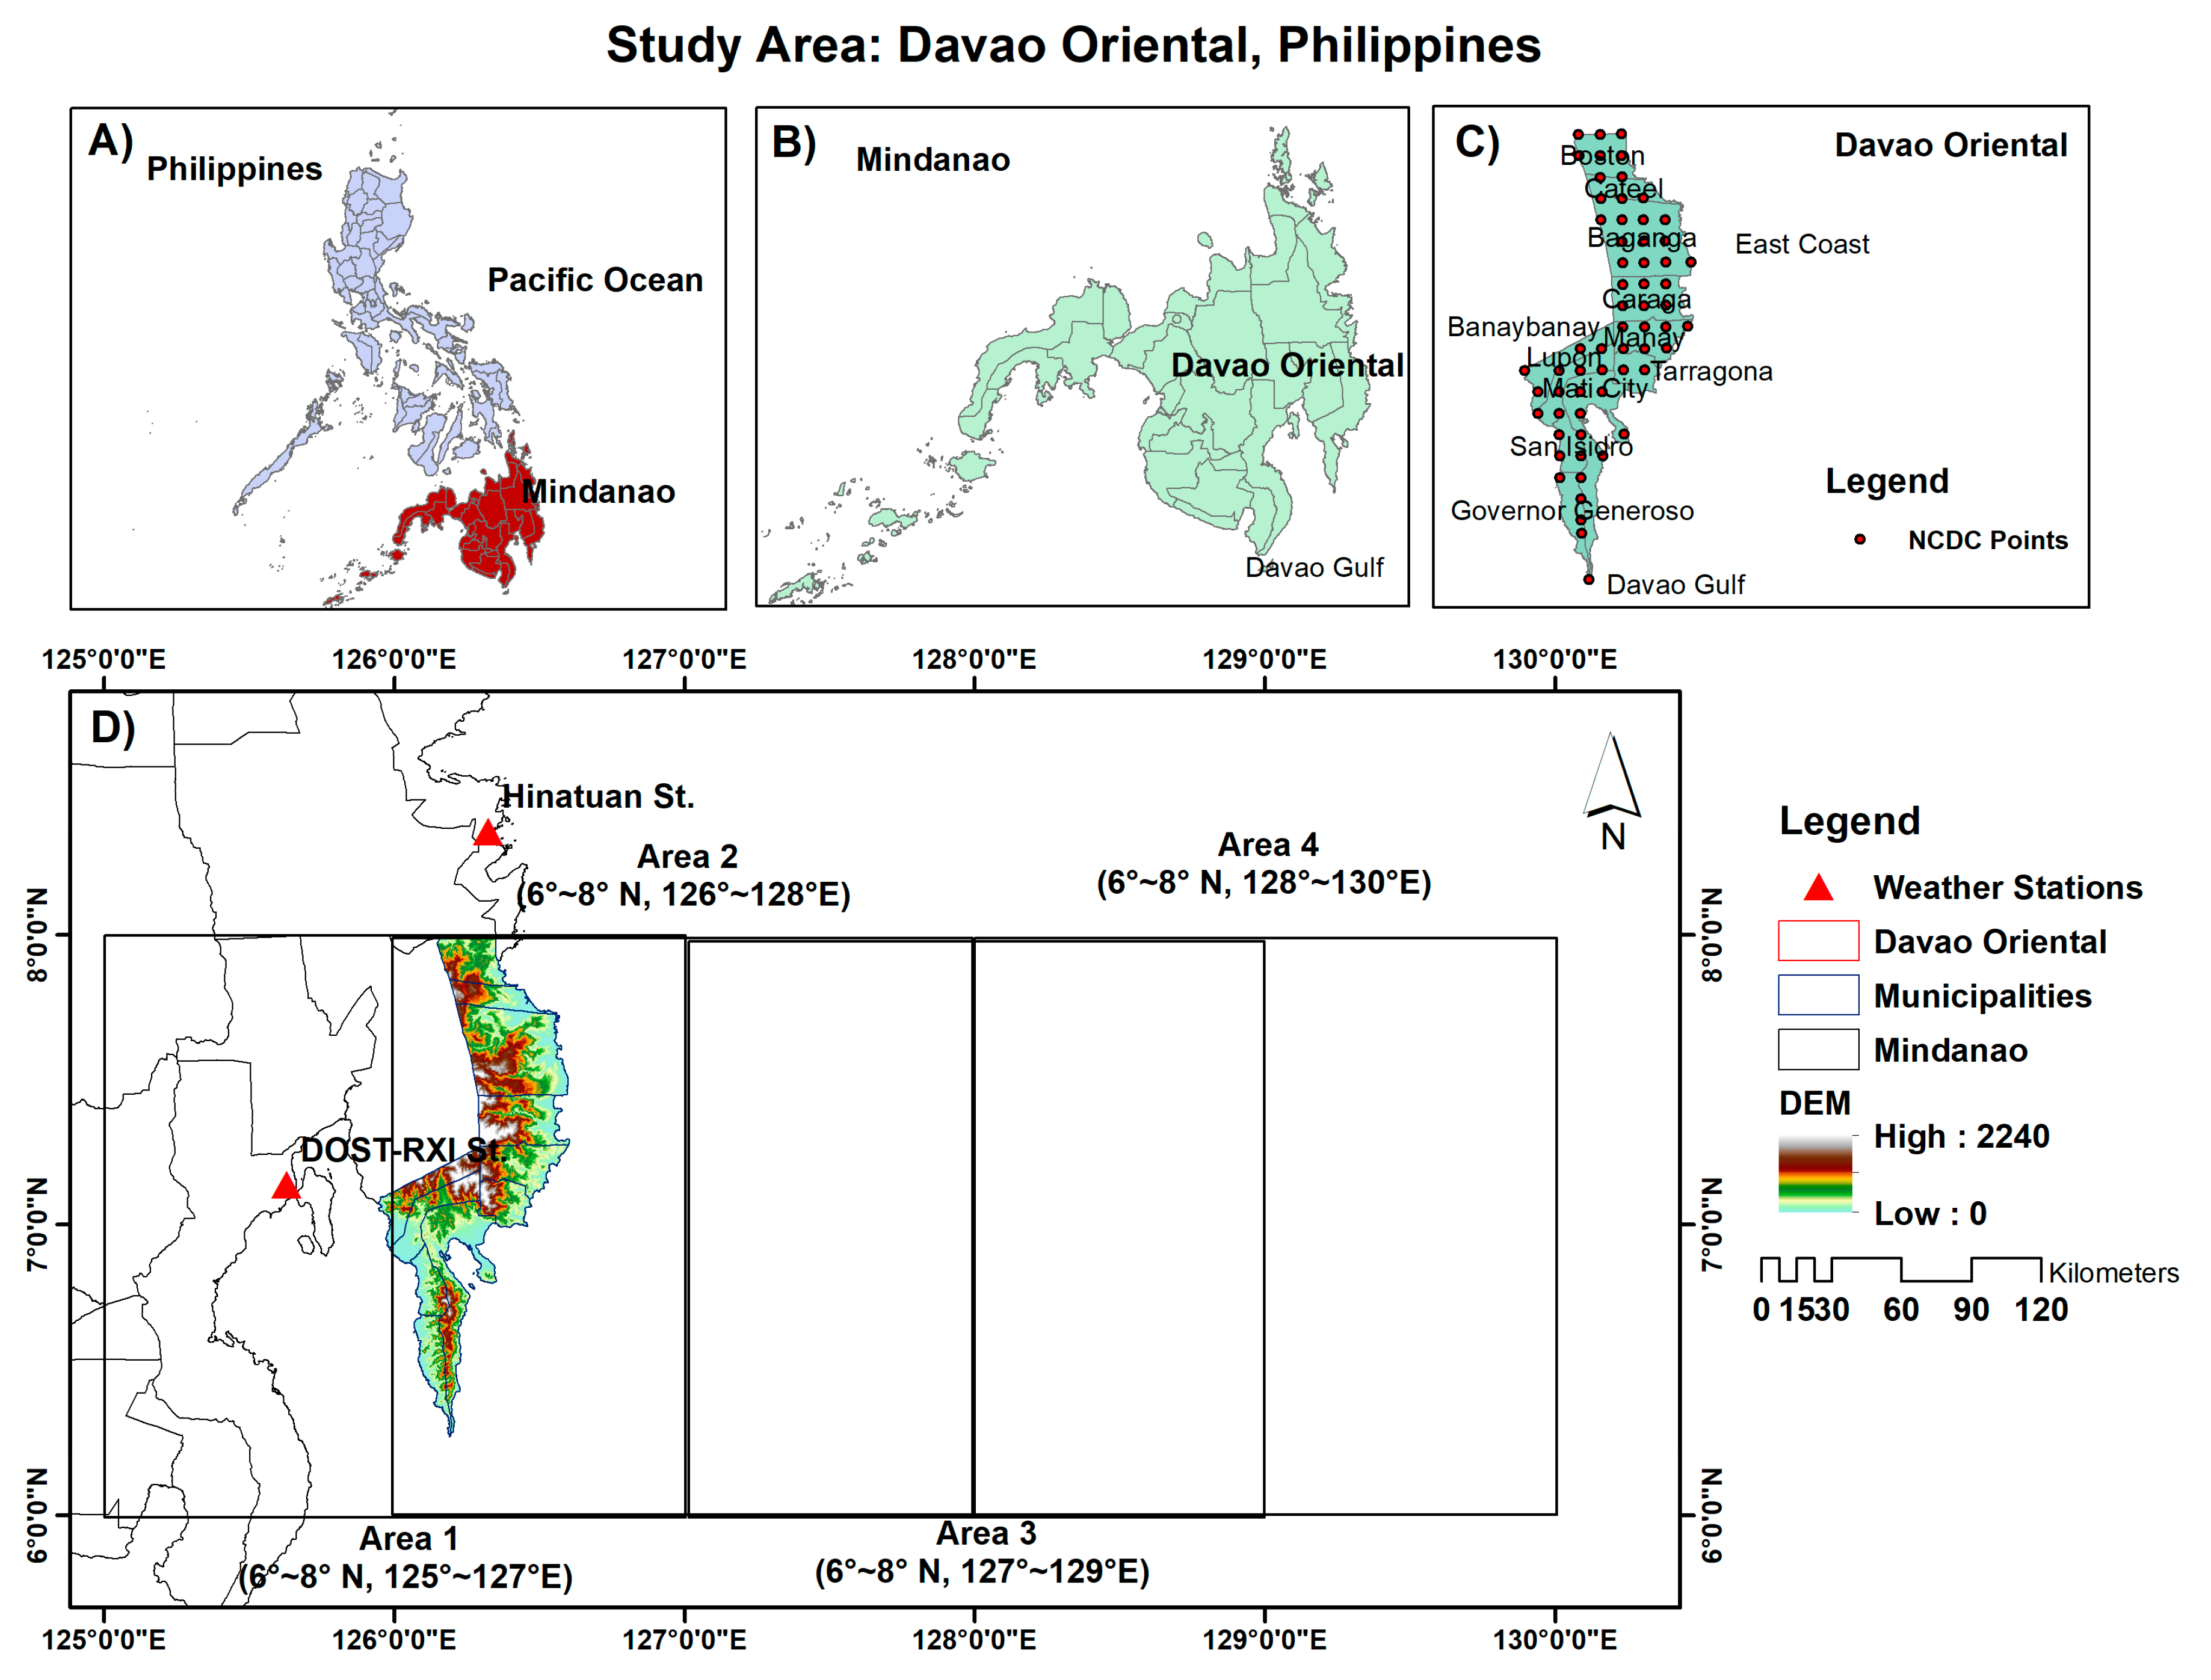
In the Philippines, the climate can be categorized into four climate types, Types I–IV, defined by the spatial distribution of monthly rainfall [10,11]. Based on Coronas [11], the study region of this paper, Davao Oriental, has two climate types. District I (East Coast Municipalities) is in Climate Type II. This part of the province has a maximum rain period from December to February. District II (Davao Gulf Municipalities) is in Climate Type IV, which has an evenly distributed rainfall pattern throughout the year. Accordingly, frequent and heavy rainfall can cause a high risk of floods in the municipalities on the eastern coast [12].
Davao Oriental is a province of Davao Region, Philippines. Davao Oriental is the easternmost province of the country and is located between 6°20′ and 7°10′ N latitude and 125°0′ and 126°20′ E longitude (Figure 1). The province is composed of 183 barangays (towns) and two congressional districts. District 1, also known as the East Coast, consists of five municipalities: Tarragona, Manay, Baganga, Cateel, and Boston. District 2, also called Davao Gulf, includes four municipalities and one city: San Isidro, Governor Generoso, Banaybanay, Lupon, and Mati City. Davao Oriental covers an area of approximately 5679 km2. The population is approximately 558,958 [13], with a population density of 98/km2.
The topographic condition of Davao Oriental is characterized by a widespread chain of mountain ranges with an uneven distribution of plateaus, swamps, and lowlands. The Mount Hamiguitan Range is newly listed as a UNESCO Heritage site and is located at the administrative boundaries between the municipality of San Isidro, Governor Generoso, and Mati City. This province occupies the largest land area of the provinces of Region XI (Davao Region), approximately 516,446 hectares or 26% of the total land area of Davao Region.
Davao Oriental is unique in that it is the only province in the country where all municipalities have coastlines. The coastline of the province measures 513.2 km from the municipality of Boston in the northern part of the province to the municipality of Banaybanay in the southwestern part of the province. It is the longest section of coastline in the country and is approximately 3% of the total coastline of the country.
Davao Oriental is located in the southeast of Mindanao Island. Mindanao Island is known to be a rather typhoon-free region, with less flood and storm-surge risk compared to the rest of the Philippines. However, flood events caused by tropical cyclones such as Typhoon Sendong in 2011 and Typhoon Bopha in 2012 in the study region are anticipated to be more frequent under global warming. Therefore, Davao Oriental is considered for the study area.
2.2. Data Set
2.2.1. Rainfall Records
The observed rainfall data were obtained from the Hinatuan and DOST-RXI Stations (Figure 1D). The Hinatuan Station has observed daily rainfall data from 1990 to 2015. The DOST-RXI Station has observed daily rainfall data from 2006 to 2015. These two stations are far from the boundary of Davao Oriental. The distances of the Hinatuan and DOST-RXI Stations from the nearest border of the province are 43.9 km and 33.4 km, respectively, as shown in Figure 1D. Therefore, using the rainfall data from these two stations would give an unreliable result because of their geographic locations.
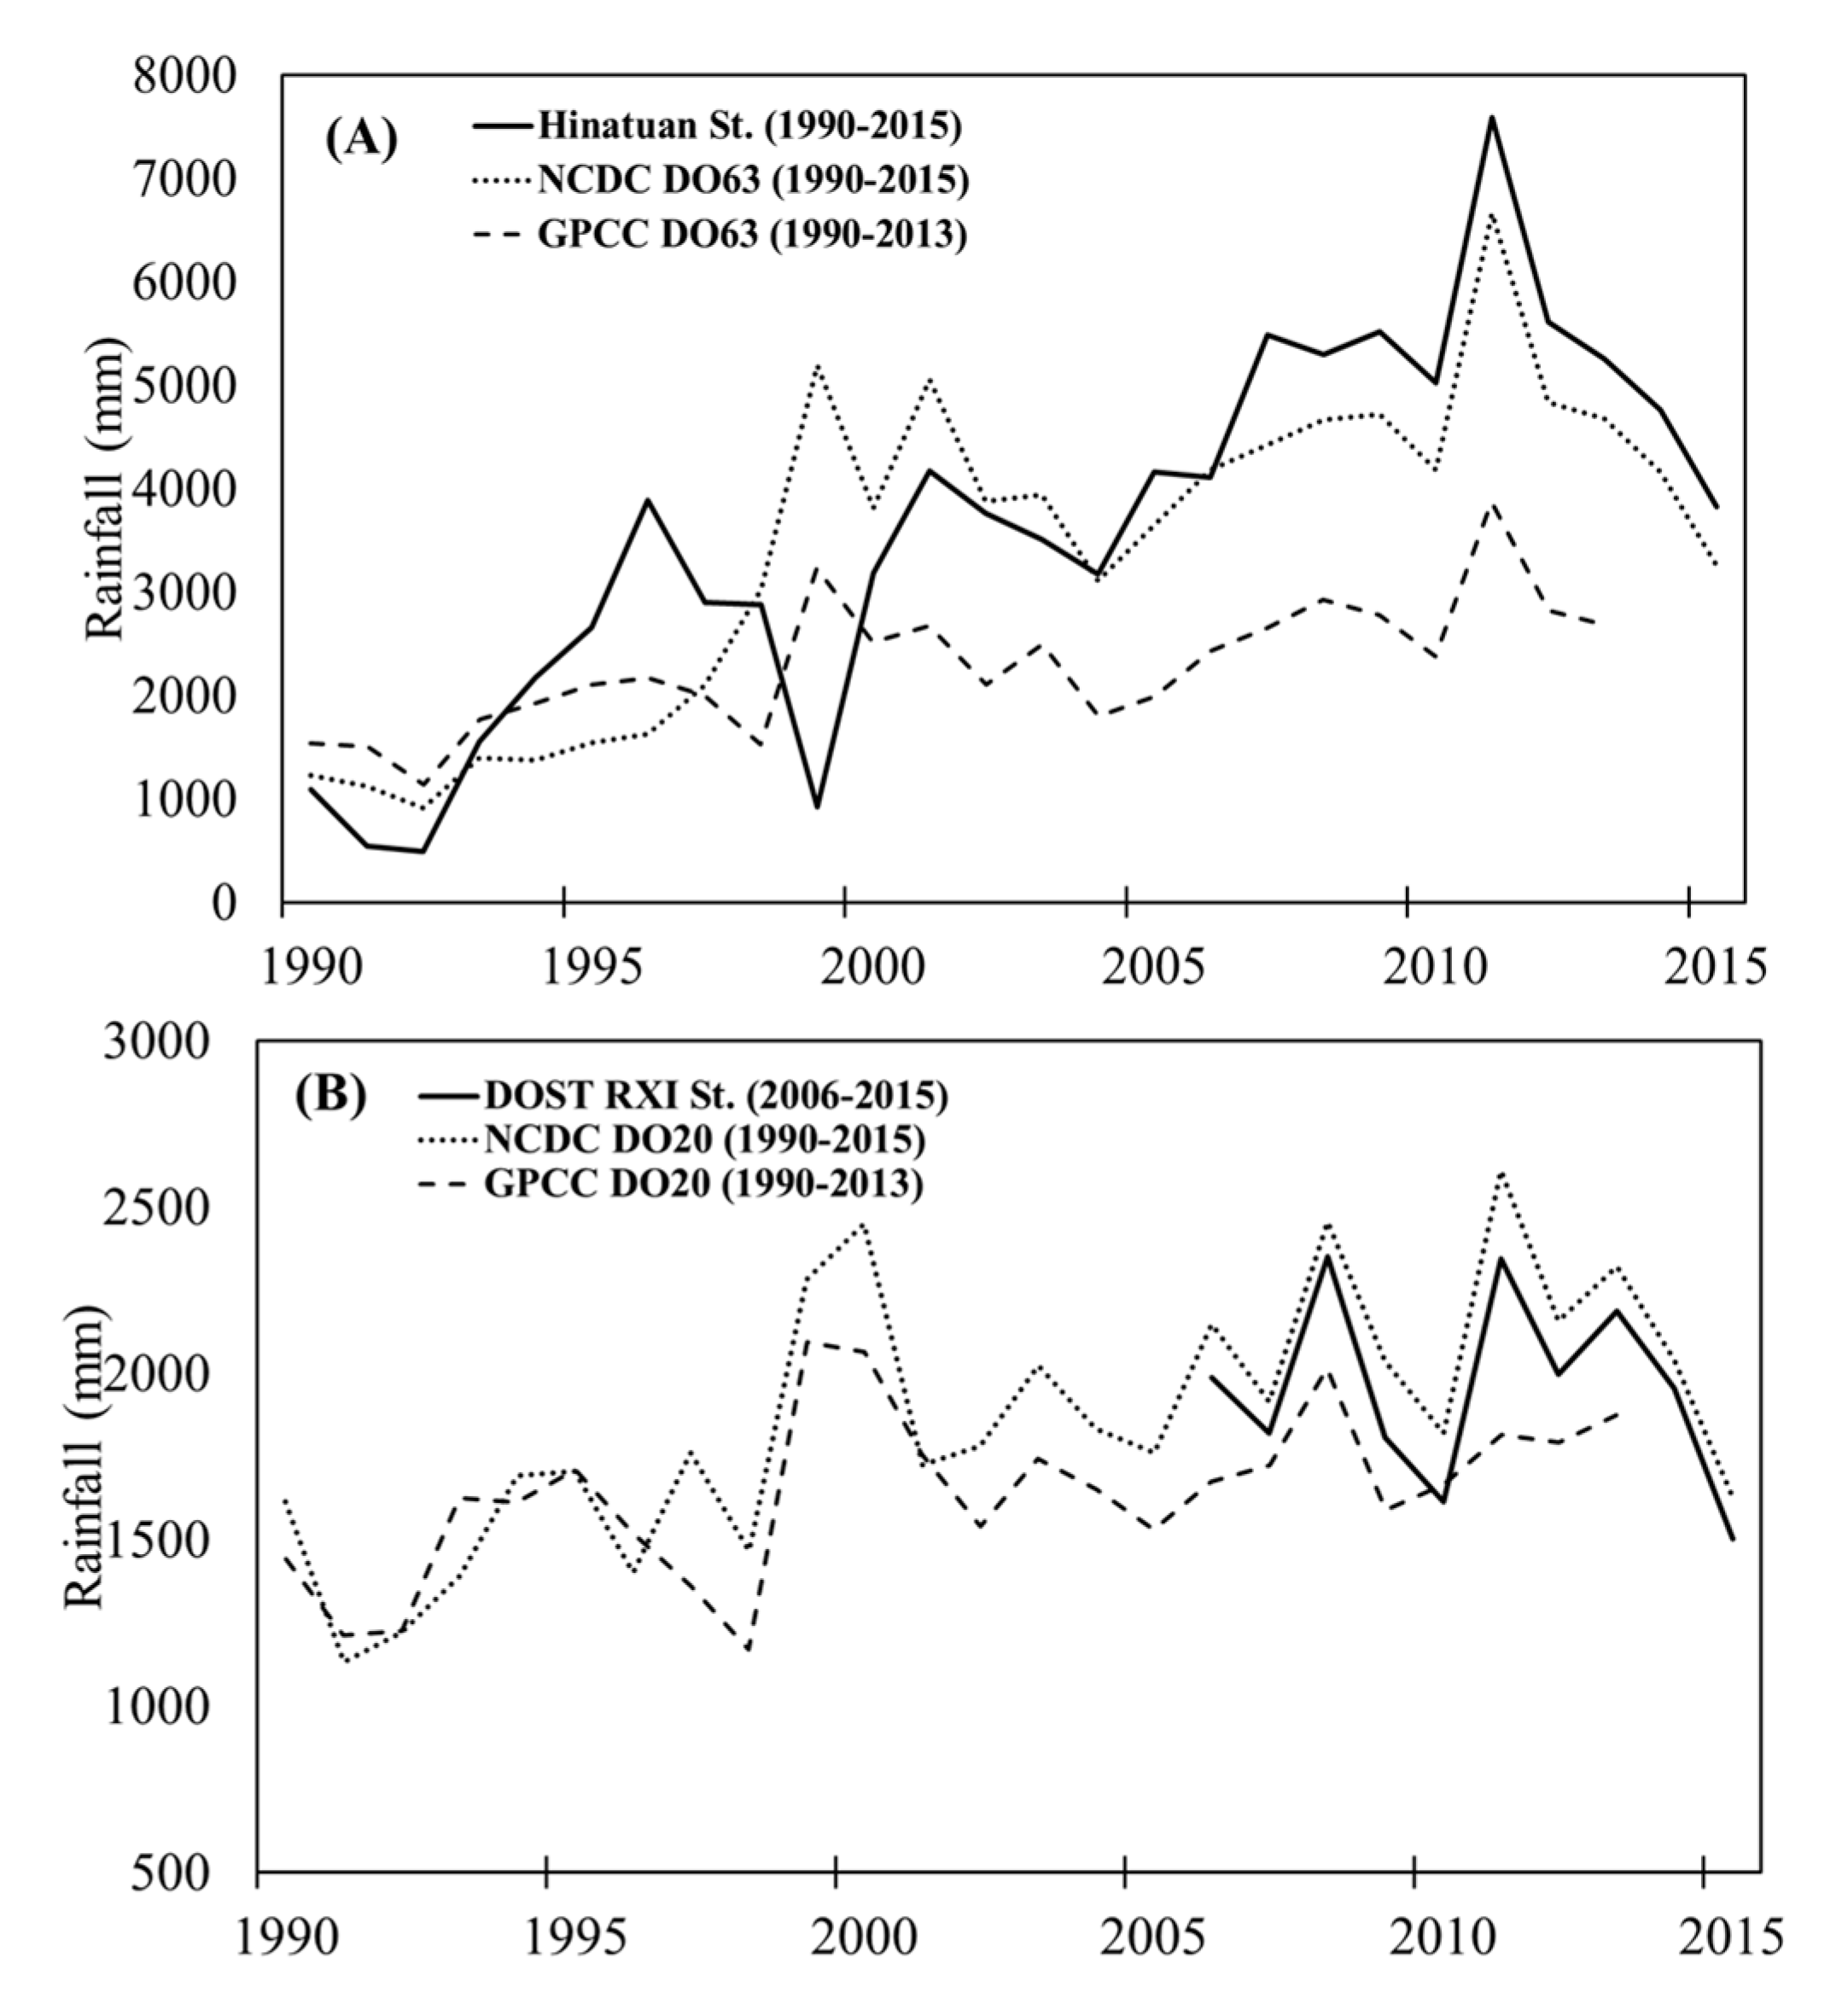
To address the geographic limitation of the weather stations, rainfall data were obtained from the National Climate Data Center (NCDC) and the Global Precipitation Climatology Centre (GPCC) (Table 1). The NCDC rainfall data are the global daily forms of precipitation with a spatial grid resolution of 0.5° latitude × 0.5° longitude. In contrast, the GPCC rainfall data are the global daily forms of precipitation on a regular grid with a spatial resolution of 1.0° latitude × 1.0° longitude. The rainfall data from 63 coordinates were extracted within the boundary of Davao Oriental (Figure 1C). Additionally, the nearest grid points were compared to the Hinatuan Station and DOST-RXI Station to evaluate the reliability of the data. Figure 2 reveals that the NCDC rainfall data show good agreement with the observed rainfalls at the two stations. The GPCC rainfall, however, depicts lower values at Hinatuan, while the rainfall at DOST-RXI shows good agreement with the observed and NCDC rainfalls. Then, the NCDC rainfall data were interpolated since most of the related studies of flood hazard mapping used an interpolation method to create the rainfall distribution map [14,15,16,17].
2.2.2. Rainfall Projections: CMIP5 Dataset
Many studies on the climate change impacts on floods have used various climate change scenarios to evaluate the effects on floods. Mohammed et al. [18], for instance, used the CMIP5 dataset for the RCP4.5 and RCP8.5 scenarios to simulate the climate change impacts on flow regimes within the Lake Champlain Basin. A study on predicting extreme floods by Wu et al. [19] employed five GCMs for three emission scenarios (RCP2.6, RCP4.5, and RCP8.5) with 10 downscaling simulations for each emission scenario and included extreme flood predictions for two stages of future periods (2020–2050 and 2050–2080).
In this paper, the temperature and rainfall projections under climate change were utilized from the CMIP5 predictions of IPCC for the RCP4.5 and RCP8.5 scenarios. From a number of GCMs of the CMIP5 dataset, the 39 GCMs, as shown in Table A1 (see Appendix A), were used to obtain the rainfall projections for the Davao Oriental region. Moreover, the future temperature for the Davao Oriental region was also obtained from the same CMIP5 GCMs for the rainfall projections. The detailed procedures for analysis and evaluation of the rainfall and temperature projections are described in the following Section 3.1 and Section 3.2.
2.2.3. Digital Elevation Model (DEM)
The Advanced Spaceborne Thermal Emission and Reflection Radiometer Global Digital Elevation Model (ASTER GDEM) is one of the most widely used DEM datasets. ASTER GDEM has been applied in many fields, such as soil erosion, topography, geomorphology, and hydrology [20,21]. ASTER GDEM is also widely used in developing flood hazard maps to extract drainage networks, flow accumulations and directions, basin boundaries, watershed boundaries, slopes and elevations [22,23,24,25].
The first version of ASTER GDEM, released in June 2009, was generated using stereo-pair images collected by the ASTER instrument on board the Terra satellite. The ASTER GDEM coverage spans from 83° north latitude to 83° south, encompassing 99% of the landmass of Earth [26]. The latest version of the ASTER GDEM V2 dataset was released in October 2011. The improved ASTER GDEM V2 dataset adds 260,000 additional stereo-pairs, improving coverage and reducing the occurrence of artefacts. The refined production algorithm provides improved spatial resolution, increased horizontal and vertical accuracy, and superior water body coverage and detection [26]. Therefore, the ASTER GDEM V2 dataset is of better quality than the first version and has a 30-m spatial resolution in the GeoTIFF image format with decimal degrees and WGS84 datum. The ASTER GDEM V2 dataset for the study site is shown in Figure 1D.
2.2.4. Administration Boundaries
The administrative boundaries of Davao Oriental include provincial, municipal, and barangay boundaries. Davao Oriental is the easternmost province of the country. On the west side of Davao Oriental is the province of Compostela Valley, and the provinces of Surigao del Sur and Agusan del Sur are to the north. The Philippine Sea, part of the Pacific Ocean, is to the east of Davao Oriental. The administrative boundaries include 10 municipal boundaries and 183 barangay boundaries. The 10 municipal boundaries and their barangay boundaries are displayed in Figure 1C and Figure 7, respectively. The administrative boundaries were provided as shapefiles from the global administrative areas and Philippine GIS organization, as indicated in Table 1. These shapefiles are in decimal degrees and have a WGS84 datum. The data were then projected to the Universal Transverse Mercator (UTM) coordinate system zone 51N.
2.2.5. Population and Socioeconomic Data
Based on the 2015 Census of Population and Housing (CPH) [13], as shown in Table 2, the province of Davao Oriental had a total population of 558,958 in 2015. The 2015 census includes 41,340 more persons than were counted in the 2010 CPH, which determined a total population of 517,618 persons. This increase in the population from 2010 to 2015 translates into an average annual population growth rate of 1.47%.
Mati City has the highest population of all municipalities, with 25.3% of the total provincial population. The municipality of Lupon is the second largest, with 11.8% of the total provincial population, followed by the municipalities of Baganga and Governor Generoso, with 10.1% and 9.9%, respectively. The rest of the municipalities contribute 43% of the total provincial population.
To evaluate the flood risk under climate change scenarios in the short term (2020–2030), medium term (2050–2060), and long term (2090–2100), the population is also projected according to each period. Cabrera and Lee [12] stated that population settlements and the drastic increase in populations are among the factors that intensify the risk of floods. In this study, the arithmetic increase method (AIM) was used to calculate the future population projections. Using the AIM, the average increase in population per decade is calculated from the past census reports [27]. This increase is added to the present population to determine the population of the next decade. Thus, it is assumed that the population is increasing at a constant rate, following Equation (1) as below:
where Pn is the population after “n” decades, P is the present population, and C is the rate of change of the population with respect to time (i.e., the average increment of the census data).
2.2.6. Soil Type
The Davao Oriental soil cover is mainly loam and sandy clay loam, and a section of rough mountainous land has an unidentified soil type. The area of Davao Oriental is classified into two sets of input parameters. The northern area of the province (Camasan sandy clay loam, undifferentiated mountain soil, Bolinao clay, and San Manuel silty clay loam) is classified as sandy clay loam. The southern area of the province (Malalag loam, San Manuel silty clay loam, and a small part of Bolinao clay) is classified as loam [28].
3. Methodology
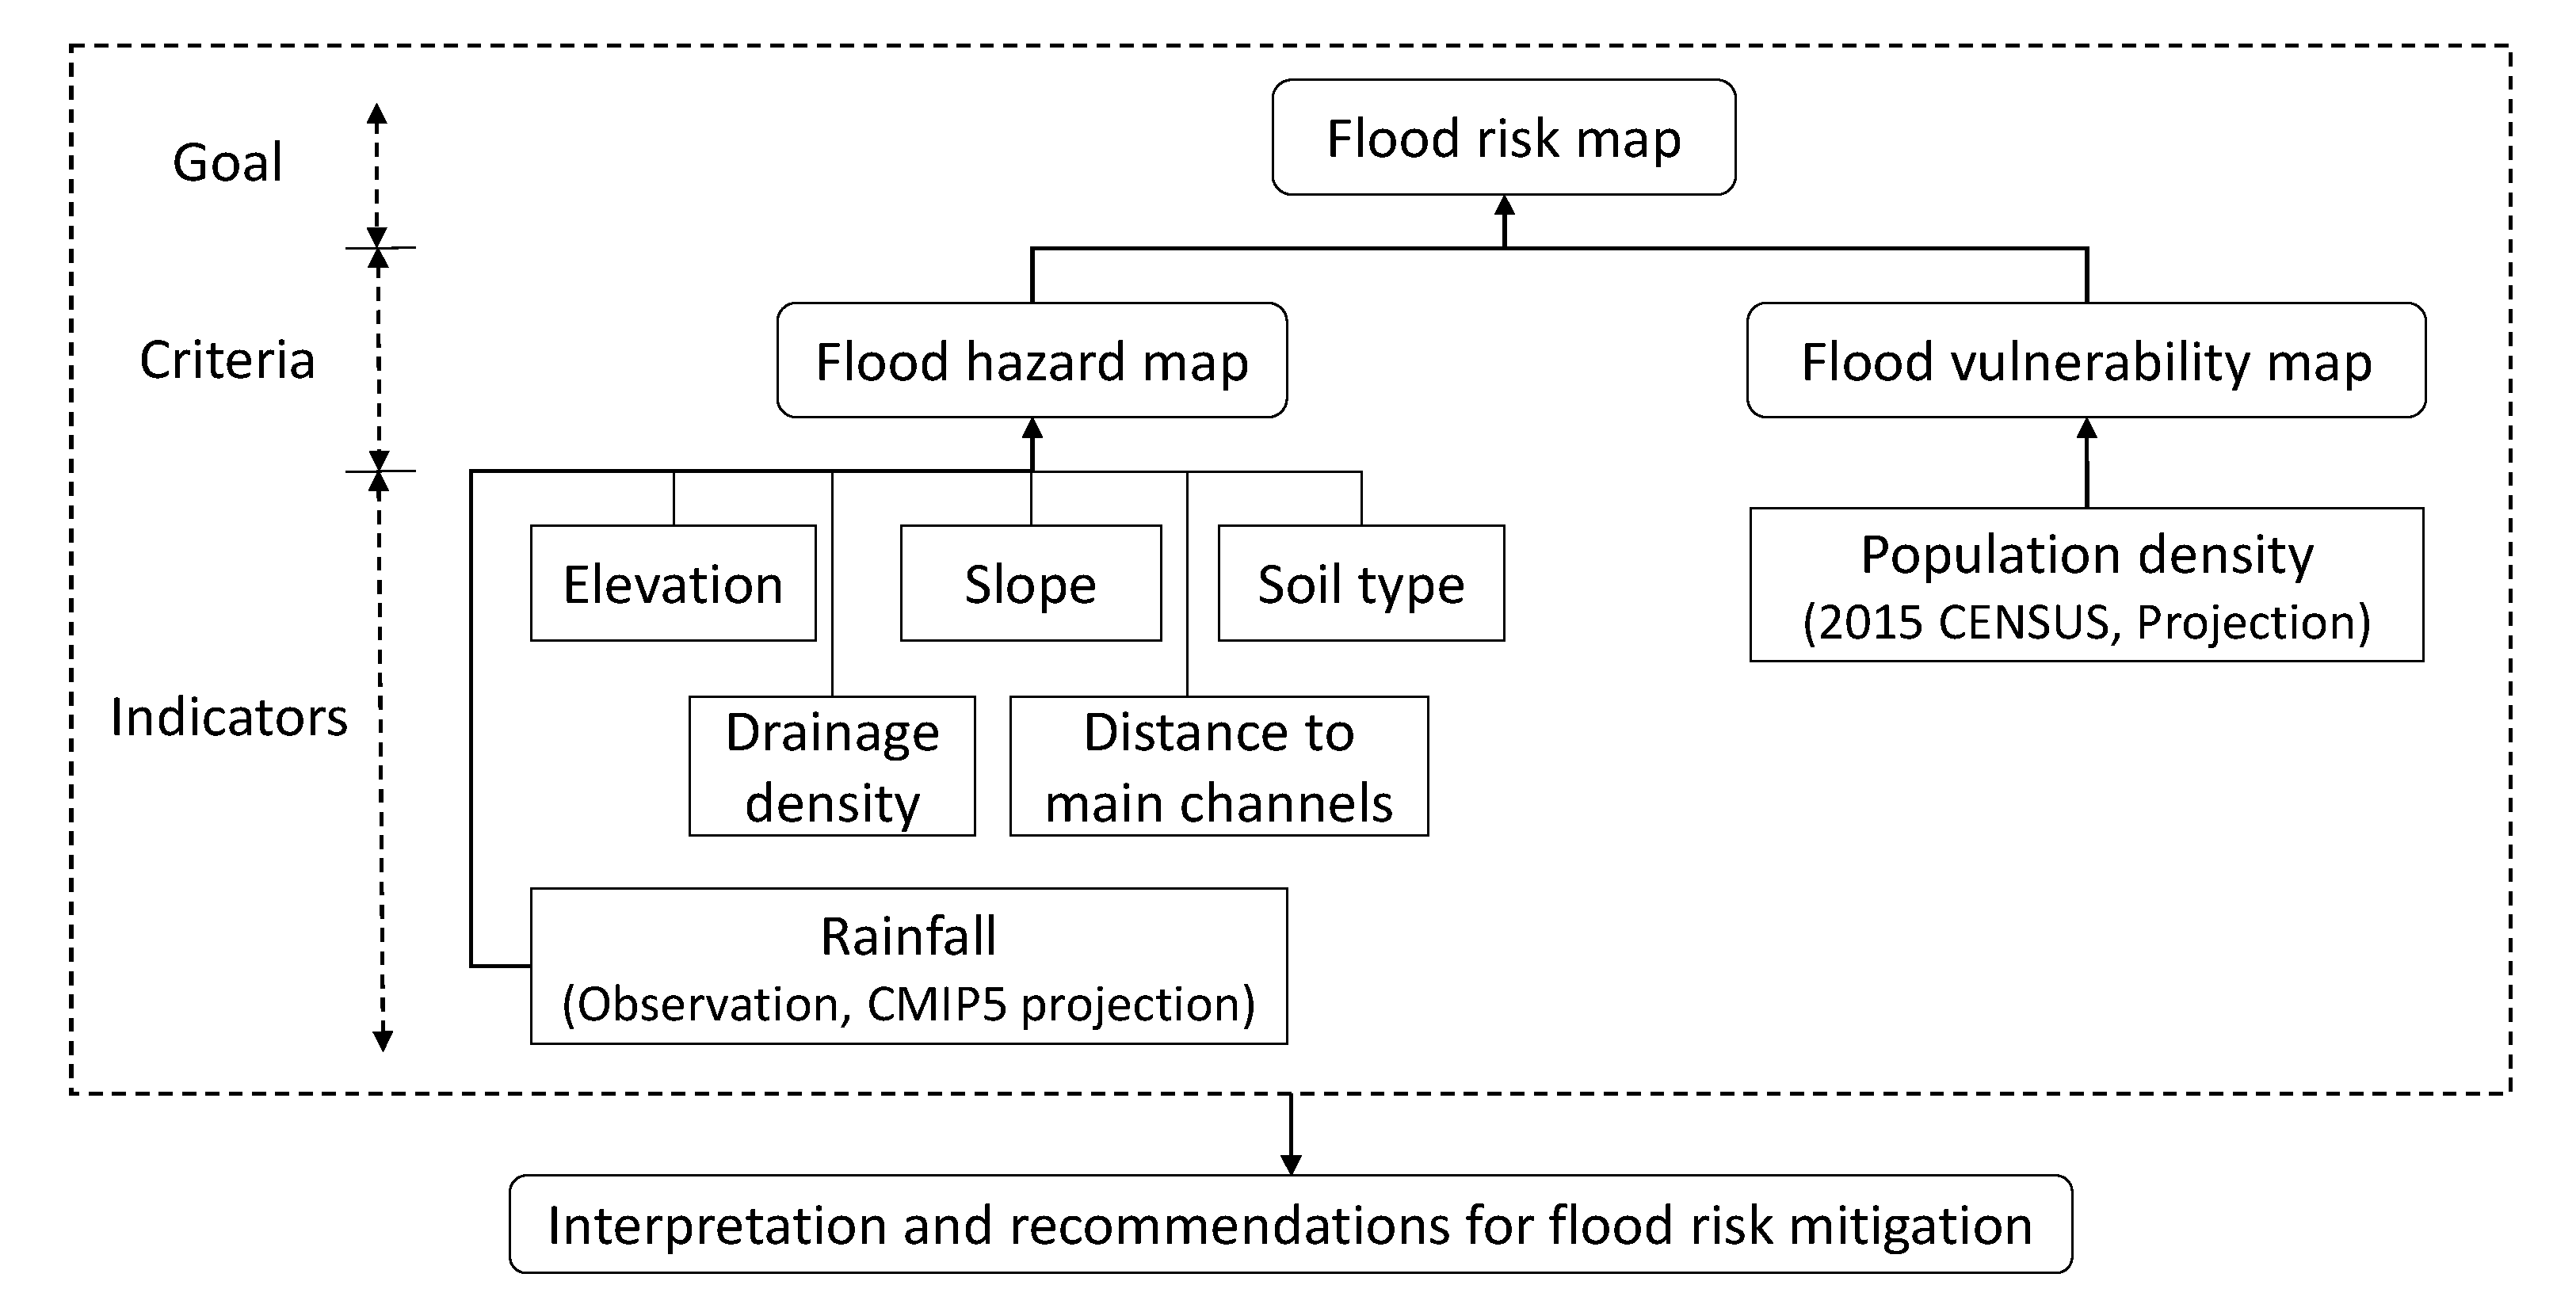
The methodology in this paper was based on a GIS-based spatial assessment process for flood hazards and was conducted by using MCDA concepts and an AHP framework. This approach used the spatial data management capabilities of GIS and the flexibility of MCDA to combine factual evidence with value-based information [29], where the factual evidence is the indicator.
The indicators considered in this paper were the slope, elevation, soil type, rainfall, drainage density, and distance to the main channel. The value-based information approach, following Saaty [30], used an expert decision to identify which indicators were the most crucial in the flood hazard map. Figure 3 presents the flowchart of AHP based on the MCDA.
3.1. Criteria and Indicators Selection
An important step of this analysis was the criteria selection for evaluating the flood risks. The criteria considered were flood hazard and vulnerability. The barangay population density was used as the indicator in the vulnerability map. There are many indicators affecting flood hazard identification and modeling, and they vary from one study area to another. For instance, urban flood modeling is incredibly complex compared to rural flood modeling due to the interactions with manmade structures, such as buildings, roads, channels, tunnels, and underground structures. This paper used a composite flood hazard map index based on six indicators. These indicators were selected based on various case studies [14,16,31,32,33] and were based on the available data in the study area.
3.1.1. Rainfall
At any location, the chance of flood increases as the amount of rain increases. A higher rainfall intensity can result in more runoff because the ground cannot quickly absorb the water. In this study, the annual average rainfall records were used for the current flood hazard assessment. A total of 25 years of annual rainfall data, from 1990 to 2015, were used. Due to the lack of weather stations in the study area, rainfall records from the NCDC were used, as described in Section 2.2.1 (see Table 1 and Figure 2).
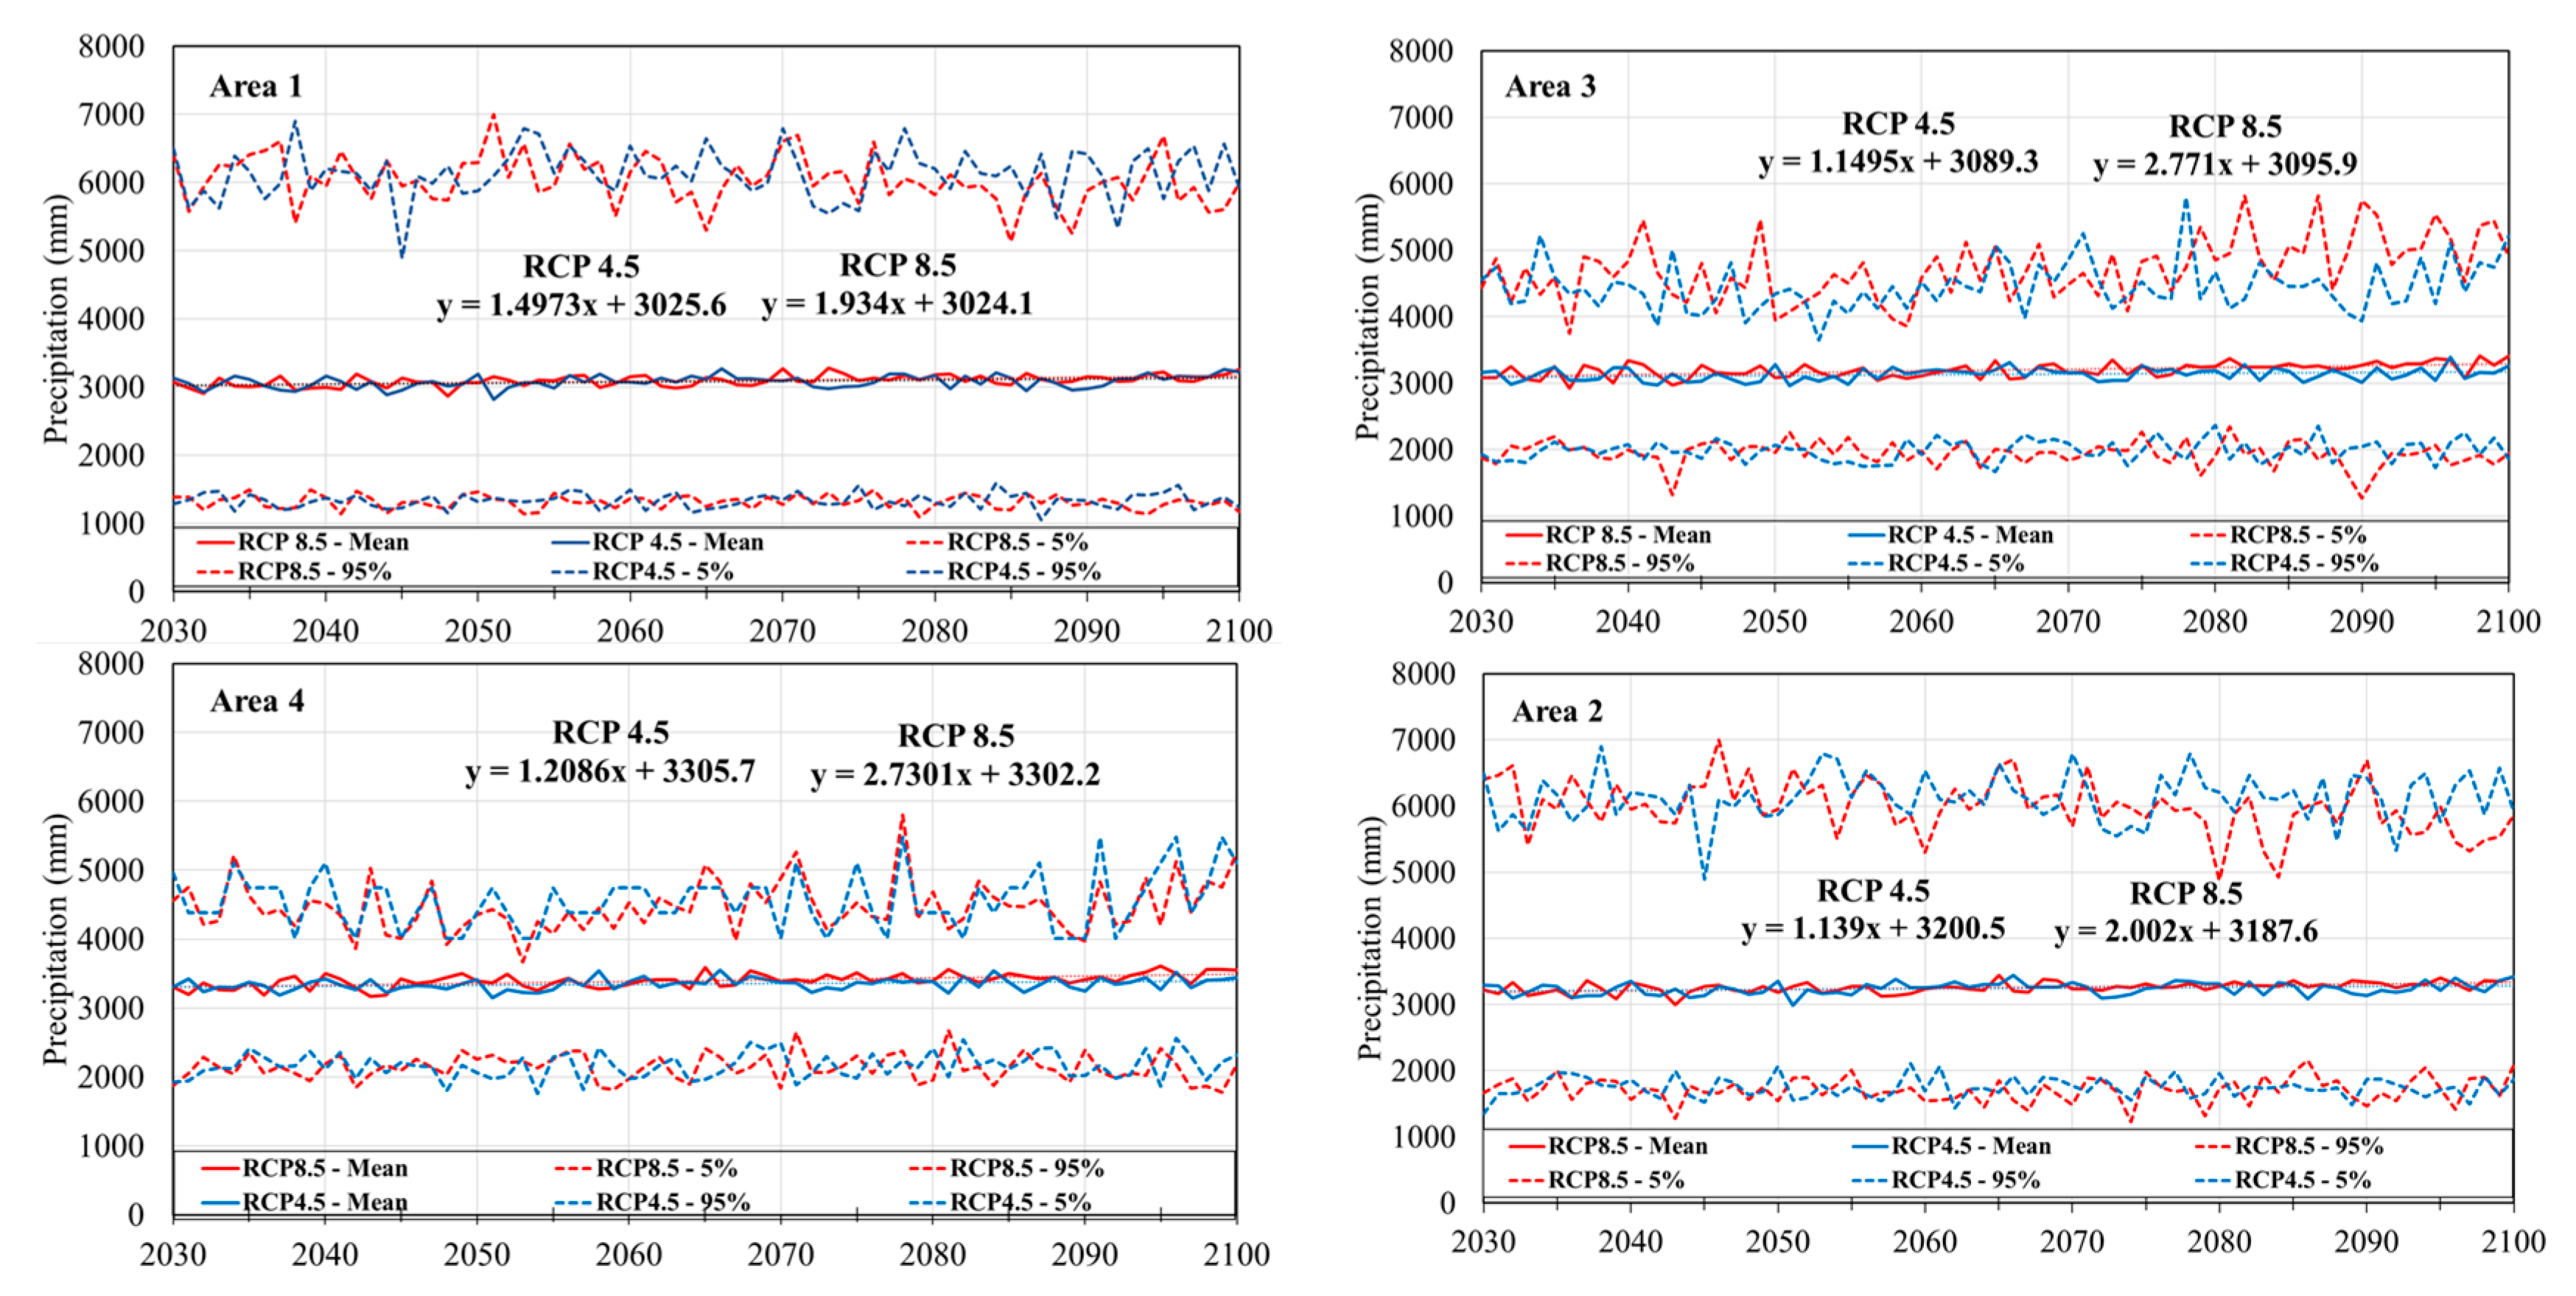
To investigate the climate change impact on flood hazards and risks, spatial areas covering an area of 2° × 2°, as depicted in Figure 1D, were defined due to the coarse and inconsistent spatial horizontal resolutions among the CMIP5 GCMs, as summarized in Table A1. Area 1 covered Davao Oriental and its surrounding regions, and Areas 2–4 shifted one degree each to the east in longitude from Areas 1–3, respectively. Then, the area-averaged rainfalls of each defined area from the 39 GCMs for two scenarios, RCP8.5 and RCP4.5, in the short term (2020–2030), medium term (2050–2060), and long term (2090–2010) were used for future flood hazards and risks. Then, spatial interpolations by using the Kriging method were carried out to address spatial rainfall patterns in the future projections of the Davao Oriental region with the following procedures:
- (1)
- Convert the area-averaged daily rainfalls to point layers to be the same as the NCDC data points in Davao Oriental;
- (2)
- The spatial rainfall patterns in the observed rainfalls are applied to the projected rainfalls, as follows:where N is the number of NCDC points in Davao Oriental, Ri is the observed rainfall at the NCDC points, and Ravg is the area-averaged projected rainfalls for Davao Oriental from the CMIP5 dataset. The observed spatial rainfall patterns, RDi in Equation (2), were determined as a rainfall difference at each point between the observed annual rainfalls and the observed area-averaged annual rainfall over Davao Oriental, and then, the projected spatial rainfall pattern, RPi in Equation (3), was calculated by adding the observed rainfall pattern, RDi, to the area-averaged projected rainfall, Ravg, in Davao Oriental.
- (3)
- Re-project the outcome of Equation (3) to UTM51 to be the same as the other indicators.
3.1.2. Soil
Soil type [34,35] and hydrological soil classification [36] are the significant factors in determining the water holding and infiltration characteristics of an area and consequently affects flood susceptibility. Generally, runoff from intense rainfall is likely to be faster and greater in clay soils than in sand [37]. Additionally, rain runoff from intense rainfall is likely to be faster and greater in loam than in sand.
3.1.3. Slope
3.1.4. Elevation
In contrast to the slope, the elevation of an area is a major factor in floods. Low elevation is a good indicator of areas with a high potential for flood accumulation. Water flows from higher to lower elevations; therefore, the slope influences the amount of surface runoff and infiltration [15]. Flat areas at low elevations may flood more quickly than areas the higher elevations with steeper slopes.
3.1.5. Drainage Density
3.1.6. Distance to the Main Channel
The distance to the main channel significantly impacts flood mapping. Areas located close to the main channel and flow accumulation path are more likely to flood [29].
Once the criteria were defined, the next step was to build the spatial database. Each criterion was converted into raster data with a 30 m × 30 m grid resolution. The ASTER GDEM data were registered and projected to the UTM coordinate system, zone 51N. The slope and elevation were obtained using the 3D Analyst algorithm based on a DEM. The drainage density and distance to the main channel were obtained using Arc Hydro, which is a set of data models that operate within ArcGIS to support geospatial and temporal data analyses. All data were integrated into the GIS environment using the AHP method. Finally, the weighted overlay was used to calculate the flood hazard map, which was then combined with the vulnerability map to create a flood risk map in the study area.
In the future flood hazard and risk assessment, the indicators such as slope, soil type, drainage density, elevation, and distance to the main channel were assumed to be the same as the current conditions, whereas the projections for population density and rainfall were considered in the assessment.
3.2. AHP Modeling Process
The MCDA was used to analyze a series of alternatives or objectives by ranking them from the most preferable to the least preferred using a structured approach. The AHP is a multicriteria decision-making approach and was introduced by Saaty [30,39]. The AHP is also a decision support tool to solve complex decision problems and uses a hierarchical approach to represent a problem; this hierarchy is described by goals, criteria, and indicators, as shown in Figure 3. Evaluation indicators and their weights must be determined according to their importance using paired comparisons. The process of AHP consists of six steps [14,30]. First, a complex, unstructured problem is broken down into its component factors. Second, the AHP hierarchy is developed. Third, a paired comparison matrix is determined by imposing judgements. Fourth, values are assigned to the subjective judgements, and the relative weights of each indicator are calculated. Fifth, the judgements are synthesized to determine the priority variables. Finally, the consistency of the assessments and judgements is checked.
The key component of AHP is the calculation of the consistency ratio (CR). If the CR ratio exceeds 0.1, the set of judgements may be too inconsistent to be reliable. If the CR is less than 0.1, then the comparison matrix can be considered to have an acceptable consistency. A CR of 0 means that the judgements are entirely consistent.
3.2.1. Pairwise Comparison
The first step in the AHP is to make a pairwise comparison of each criterion based on the scales by Saaty [30], shown in Table 3. The results of the comparison were described in terms of integer values from 1 to 9, where a higher number means that the chosen indicator is considered to be more important than the other indicator used in the comparison. In this study, the pairwise comparison matrix is shown in Table 4.
3.2.2. Normalization
This step is the process of normalizing the matrix by adding the numbers in each column. Each entry in the column is then divided by the column sum to yield its normalized score, as described in Equation (4). The sum of each column should be 1. Lastly, the priority vector (PV) is computed by dividing the sum of the normalized column of the matrix by the number of criteria used (n), as shown in Equation (5). Table 5 shows the normalized matrix in this study.
where Cij is the value of a criterion in the pairwise comparison matrix, Xij is the normalized score, and PVij is the priority vector of a criterion.
3.2.3. Consistency Analysis
There are three steps to determine the CR. First, the consistency measure (CM) is calculated by multiplying the pairwise matrix by the PV, and then, the result is divided by the weighted sum vector with the criterion weights. Second, the consistency index (CI) is calculated, as described in Equation (6). Lastly, the CR is computed, as described in Equation (7).
where λmax is the sum of the CM divided by the number of criteria (n) and set to 6.126. The results of the random index (RI) are given in Table 6.
The results of the pairwise comparison matrix for this work are presented in Table 4. In Table 5, the column PV contains the relative importance weights for each criterion. From the input values in the pairwise comparison and the weights calculation, the CR was found to be 0.02. The CR result indicates a reasonable level of coherency in the pairwise comparison.
The hazard index (HI) was used to consider the rate of probability and was calculated based on Equation (8) as follows:
where St, Sl, Dd, Dc, E, and R represent the soil type, slope, drainage, distance to main channel, elevation, and rainfall, respectively.
HI = St × 0.04 + Sl × 0.23 + Dd × 0.06 + Dc × 0.10 + E × 0.15 + R × 0.42
Finally, the hazard index was computed using a weighted overlay analysis. The values of HI were classified into five categories such as very low (VL), low (L), moderate (M), high (H), and very high (VH).
3.3. Evaluation of Rainfall and Temperature Projections
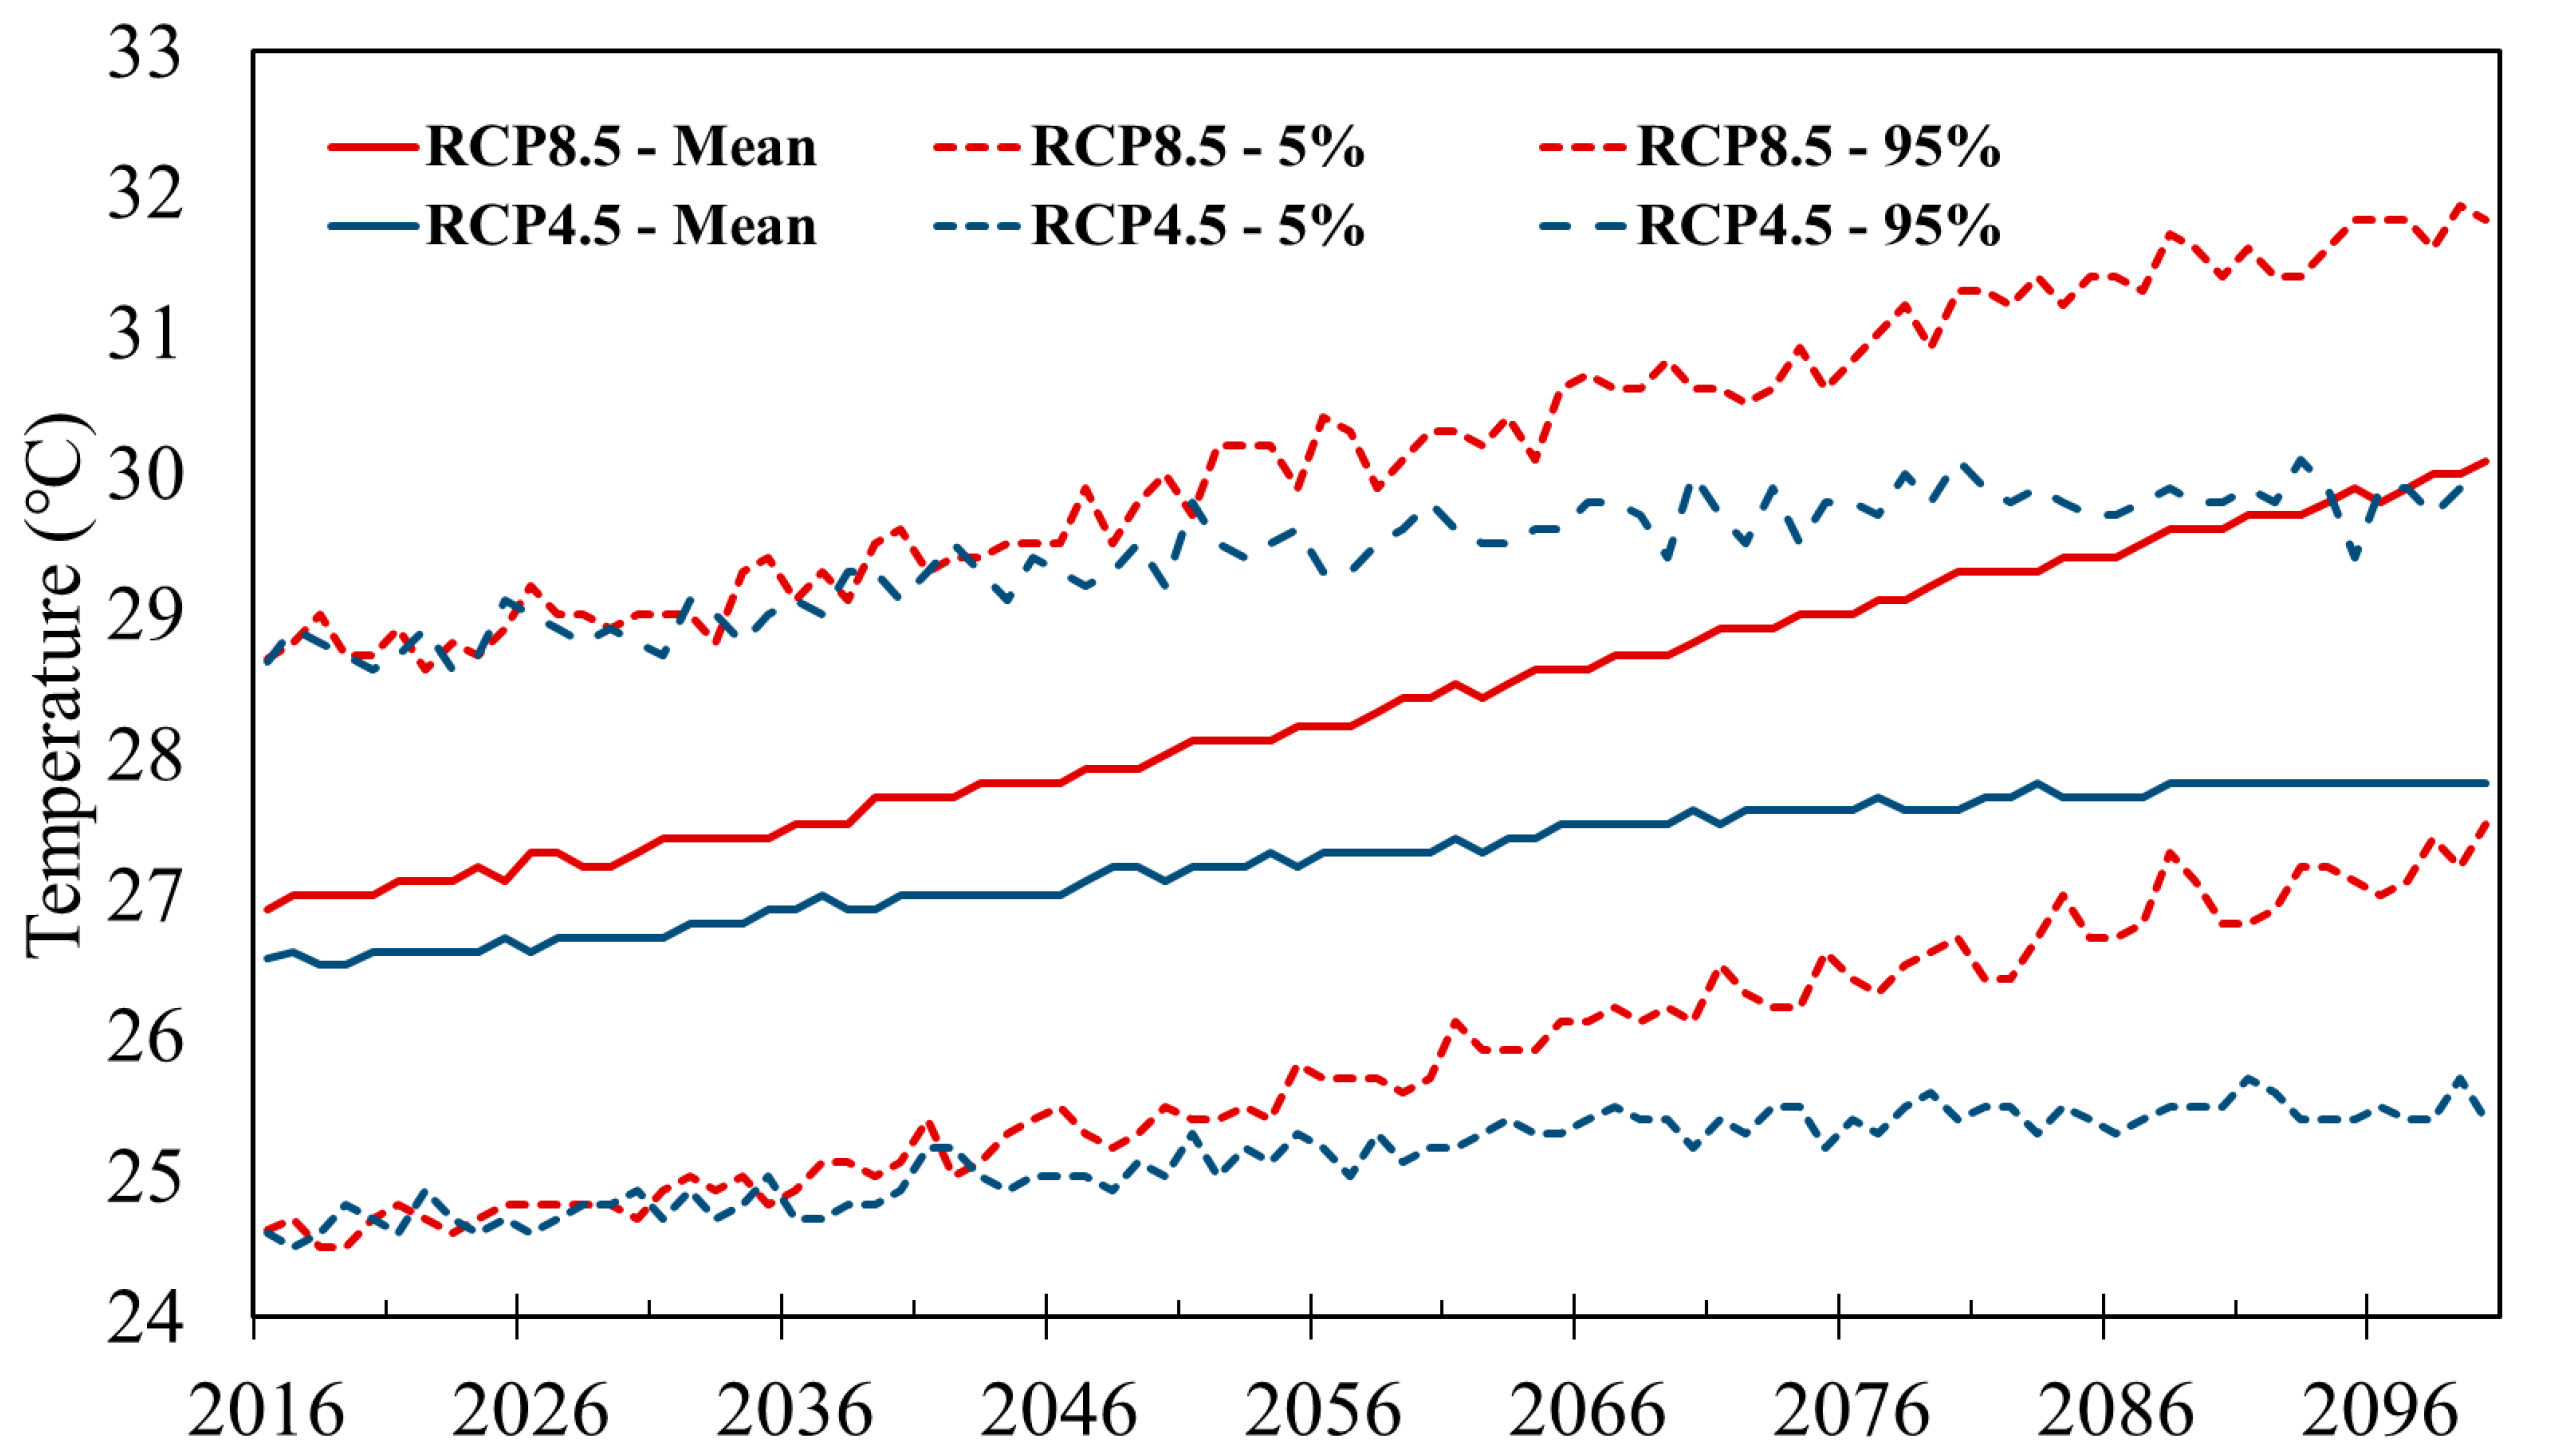
The area-averaged (Area 1 in Figure 1D) daily temperatures from the 39 GCMs in Figure 4 show a significant increase of approximately 3 °C and 1 °C from 2016 to 2100 under the RCP8.5 and RCP4.5 scenarios, respectively. However, the area-averaged daily precipitation for Area 1 illustrate a slight increase in Figure 5. To further investigate the projected rainfall, the defined Area 1 was shifted one degree east and defined as Areas 2–4 to determine a change in precipitation. As the defined area moves east to the open sea, the projected rainfall presents a slight increase in the mean value and the linear trend. Area 4 shows comparable increases in the mean value and the linear trend compared to those of Area 1 as the defined area gets farther from the shoreline. With respect to the difference in the projected rainfall between the two scenarios, RCP4.5 and RCP8.5, the difference is almost insignificant because the increment of the projected rainfall in the RCP8.5 scenario is very low. This behavior of the projected rainfall in the long term is remarkably different from the temperature projection, which might be partially due to incomplete microphysics parameterizations and coarse horizontal resolutions of the GCMs.
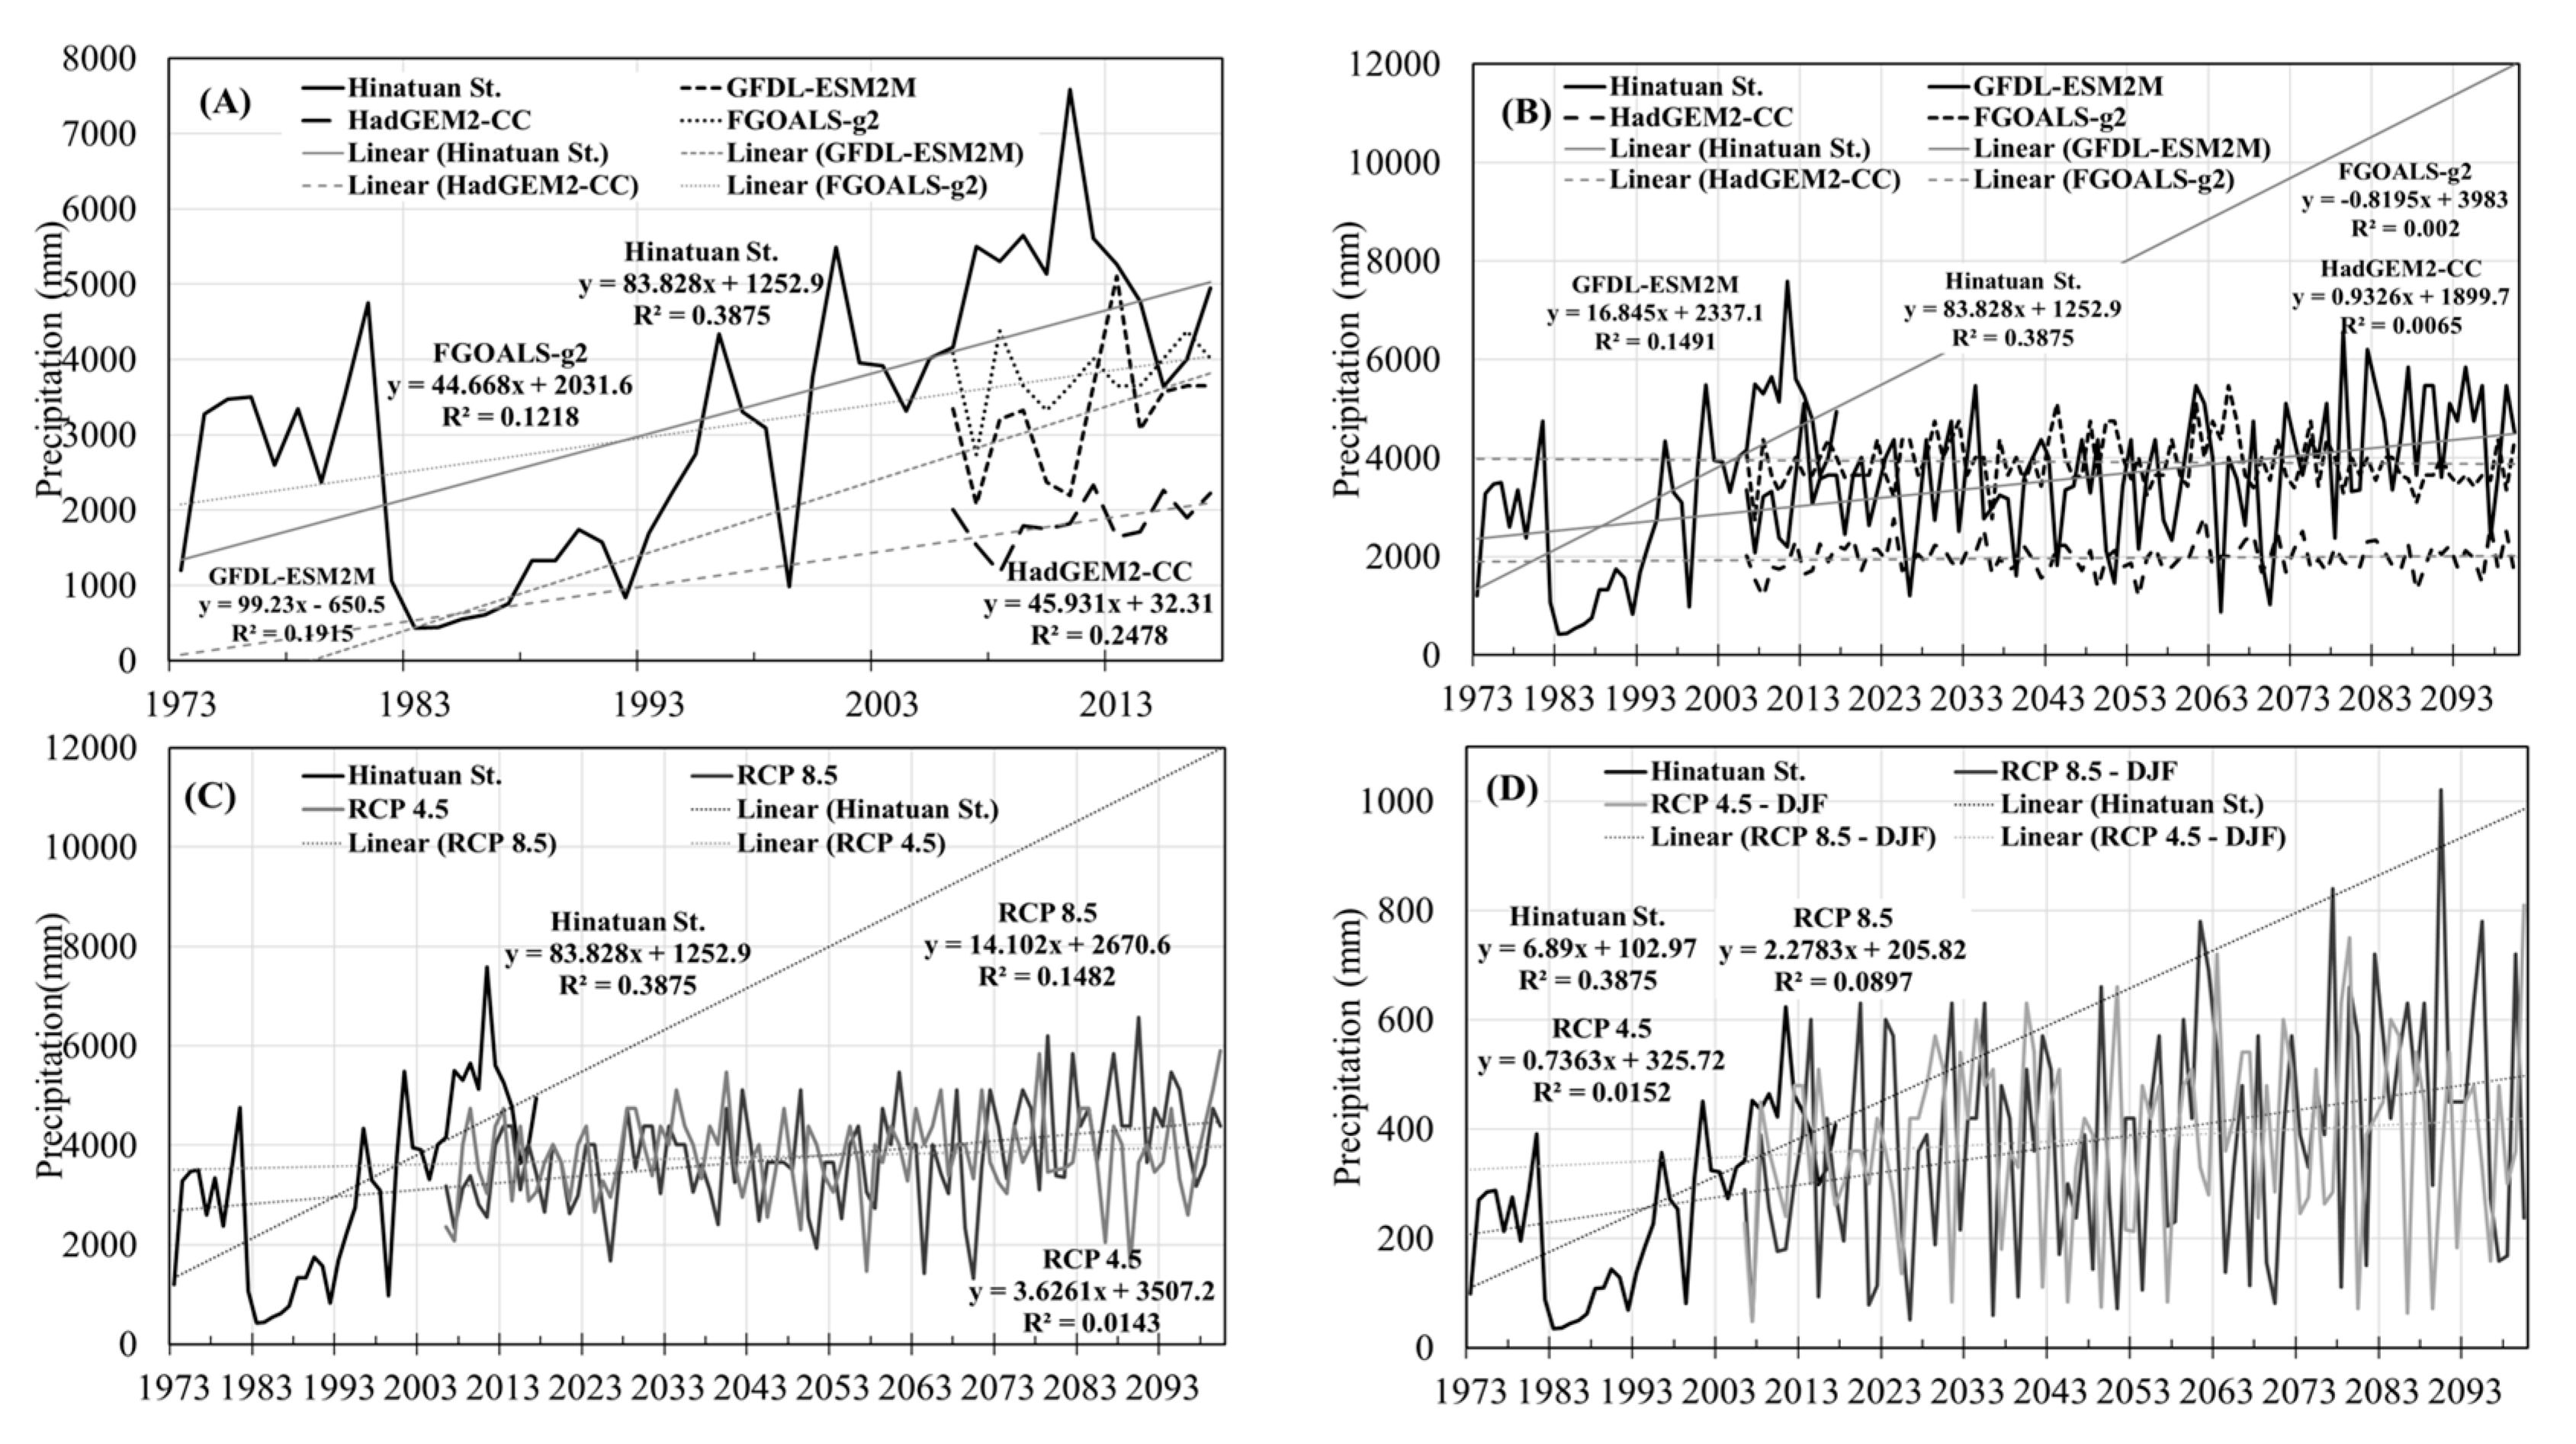
Further, the rainfall projections of the 39 GCMs of Area 4 were compared to the observed rainfall at Hinatuan Station for the 10-year overlapping period from 2006 to 2016 to identify which GCM result would be appropriate to use in the flood assessment. Among the 39 GCMs considered, three GCMs, such as the HadGEM2-CC, GFDL-ESM2M, and FGOALS-g2 models, showed good agreement with the observed rainfall at Hinatuan in terms of increasing the linear trends, as in Figure 6A, while the other GCMs showed almost no increasing trends, as implied in Figure 5. Figure 6B presents the rainfall projections and linear trends of the three GCMs over the extended period to 2100.
The values of the GFDL-ESM2M model depict the outstanding increasing trend over the extended period, whereas the trends of the other two models are not significant in this long period. Figure 6C illustrates the area-averaged (Area 4) projected rainfalls of GFDL-ESM2M for two scenarios, RCP4.5 and RCP8.5. The difference between the two scenarios is not practically significant, but the linear trend of the RCP8.5 result shows more increasing trends than RCP8.5. Since the study site can be divided into different climate zones with respect to the precipitation patterns as described, the seasonal rainfall variations were also investigated. In the evaluation of seasonal rainfall using the GFDL-ESM2M result, the DJF season had a high increase in precipitation compared to the other seasons (Figure 6D). Based on the above evaluation of the rainfall projections of the GCMs, the GFDL-ESM2M model rainfall projection for Area 4 was used for the rainfall indicator in the future flood hazard and risk assessment.
4. Results
4.1. Vulnerability Map
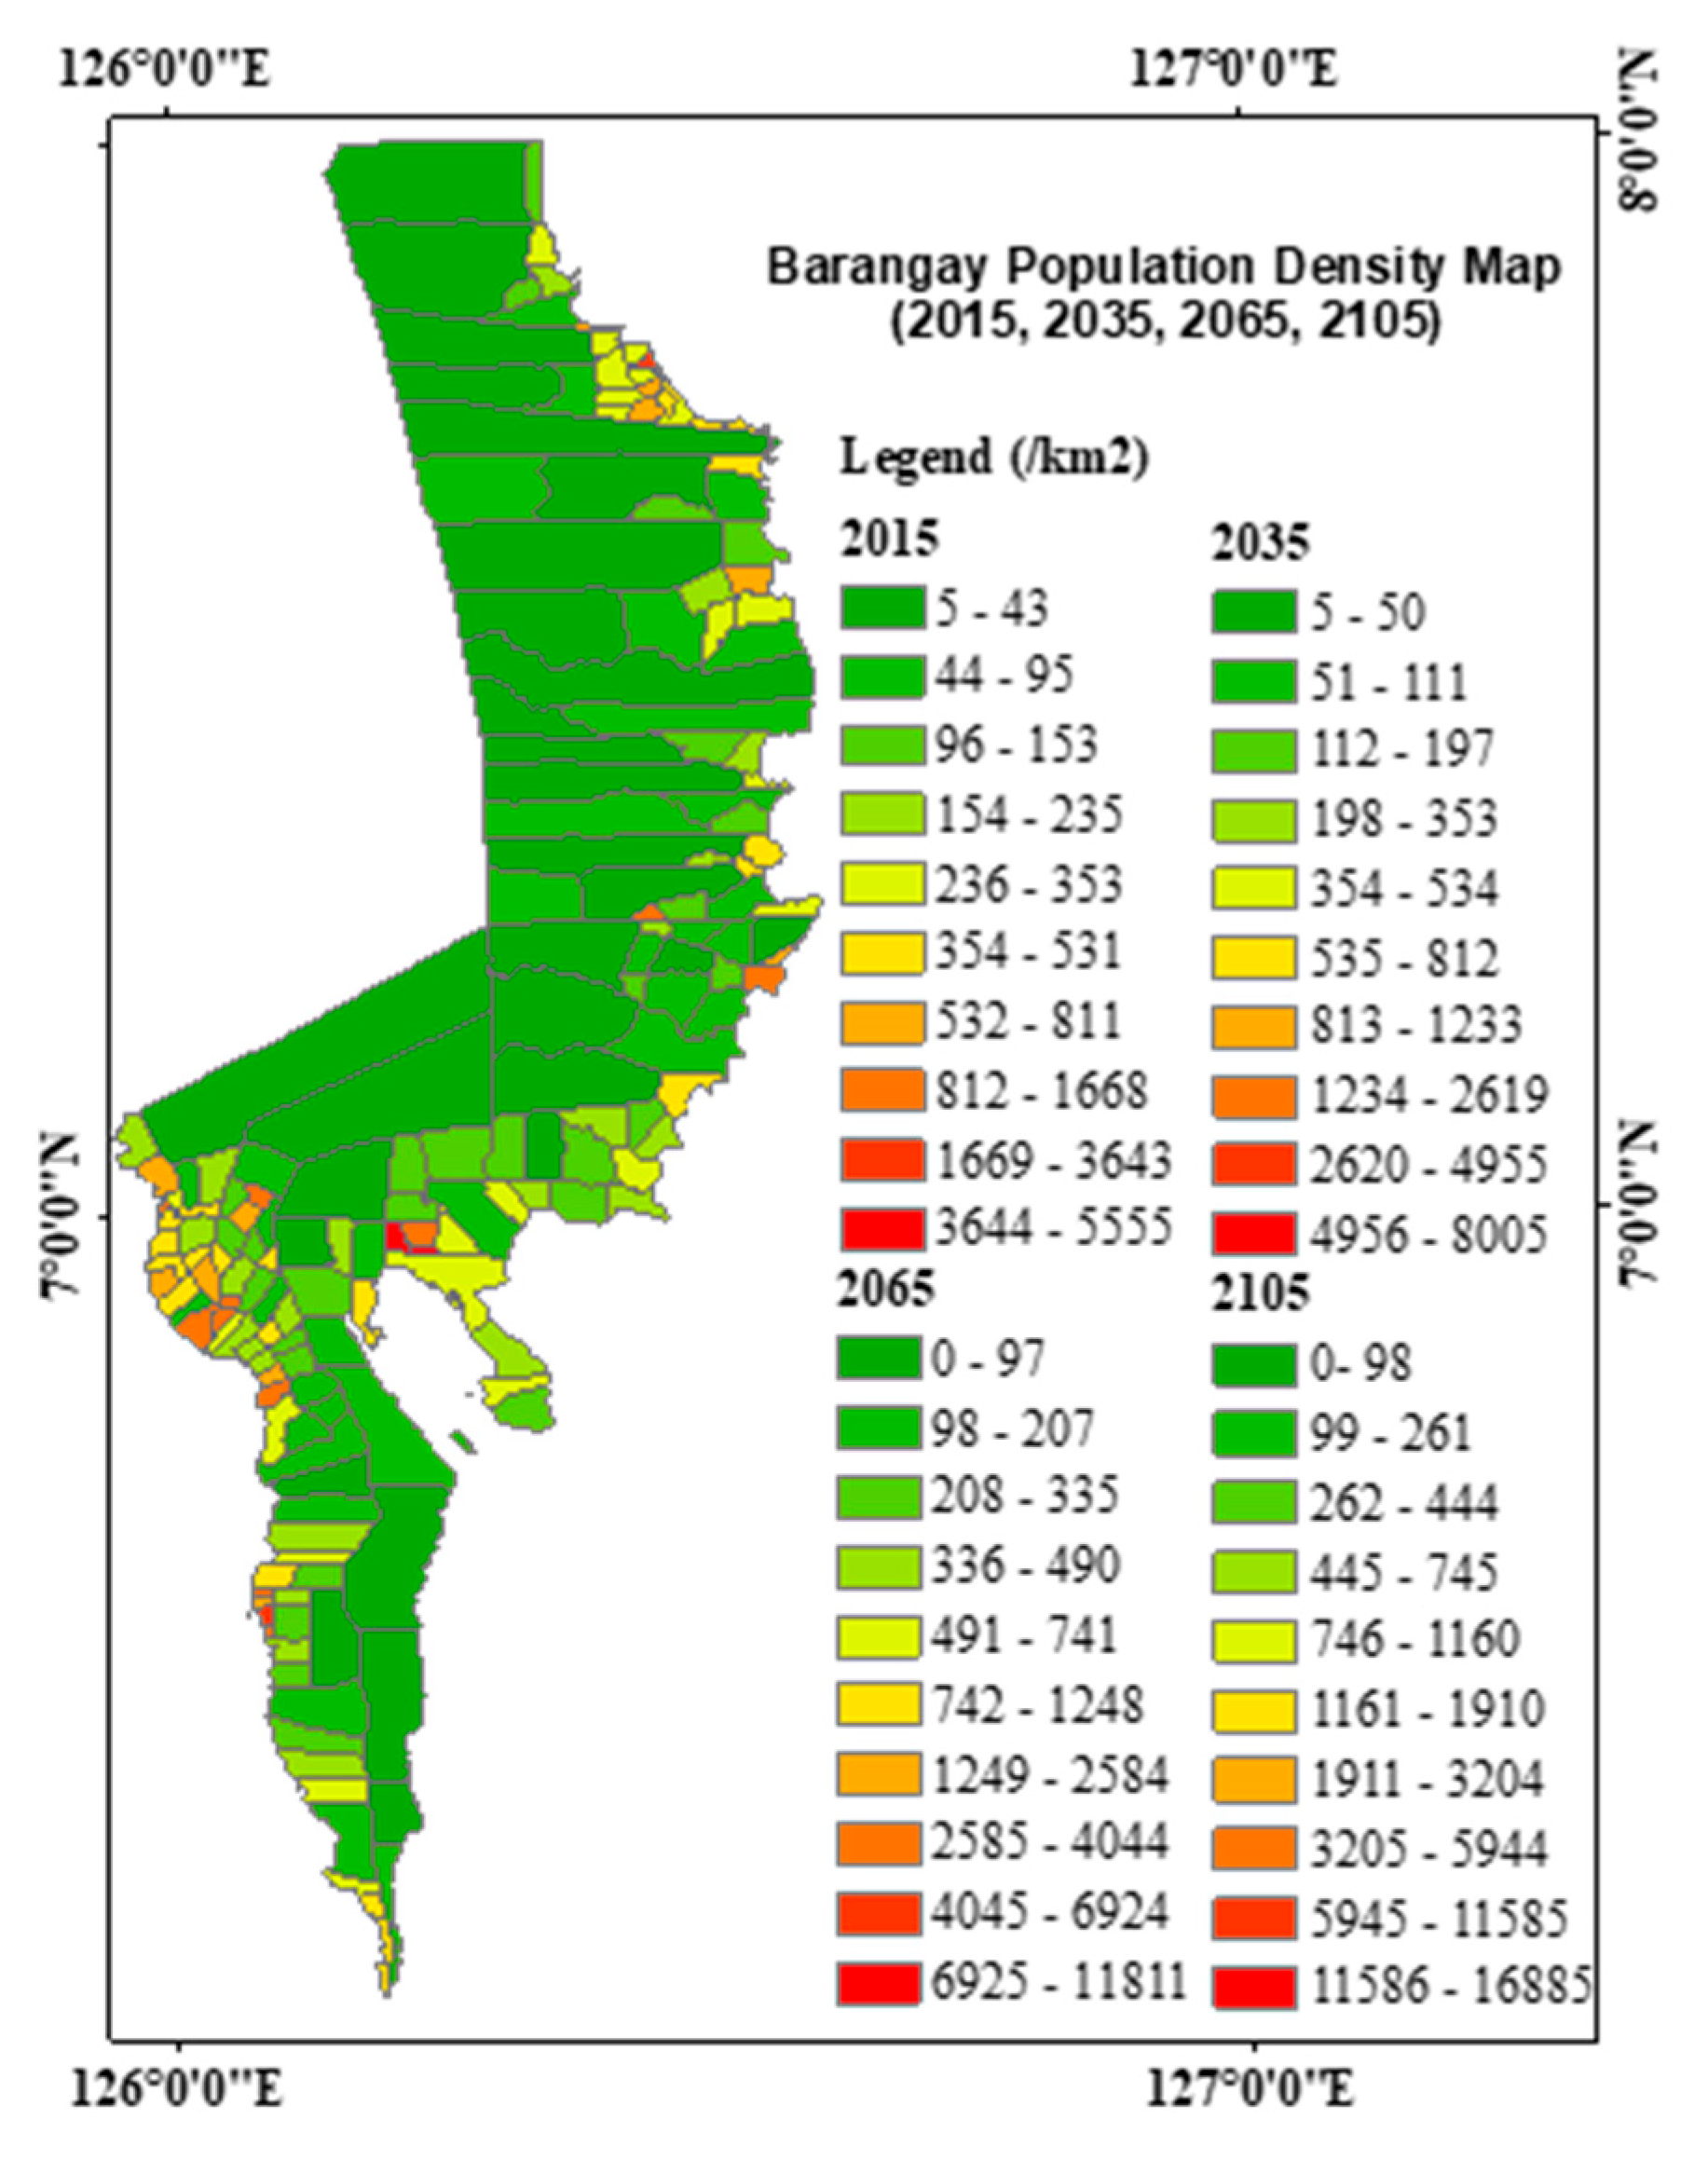
Vulnerability expresses the level of inability to resist a hazard or to respond when a disaster has occurred. For example, people who live in low-lying areas are more vulnerable to floods than people who live at higher elevations. Moreover, vulnerability is the most crucial component of flood risk because vulnerability determines if exposure to a hazard constitutes a threat. Flood vulnerability mapping is the process of determining the degree of susceptibility and exposure of a given place to flood [14]. The susceptibility and exposure issues include several factors, such as the age and health of the population, the socioeconomic activities, and the quality of buildings and their location with respect to floods. Pellicani et al. [40] quantified the risk by using the vulnerability factors like land use, structures, and infrastructures with respect to the flood-prone areas. In this study, the only indicator used for the assessment of vulnerability to floods is the population density. The vulnerability map obtained from the barangay (town) population density, as shown in Figure 7, is divided into five classifications from very low to very high regarding the flood hazard. Four scenarios (2015, 2035, 2065, and 2105) of the vulnerability map based on population projections using the AIM were developed to complement the hazard projections.
4.2. Hazard Map
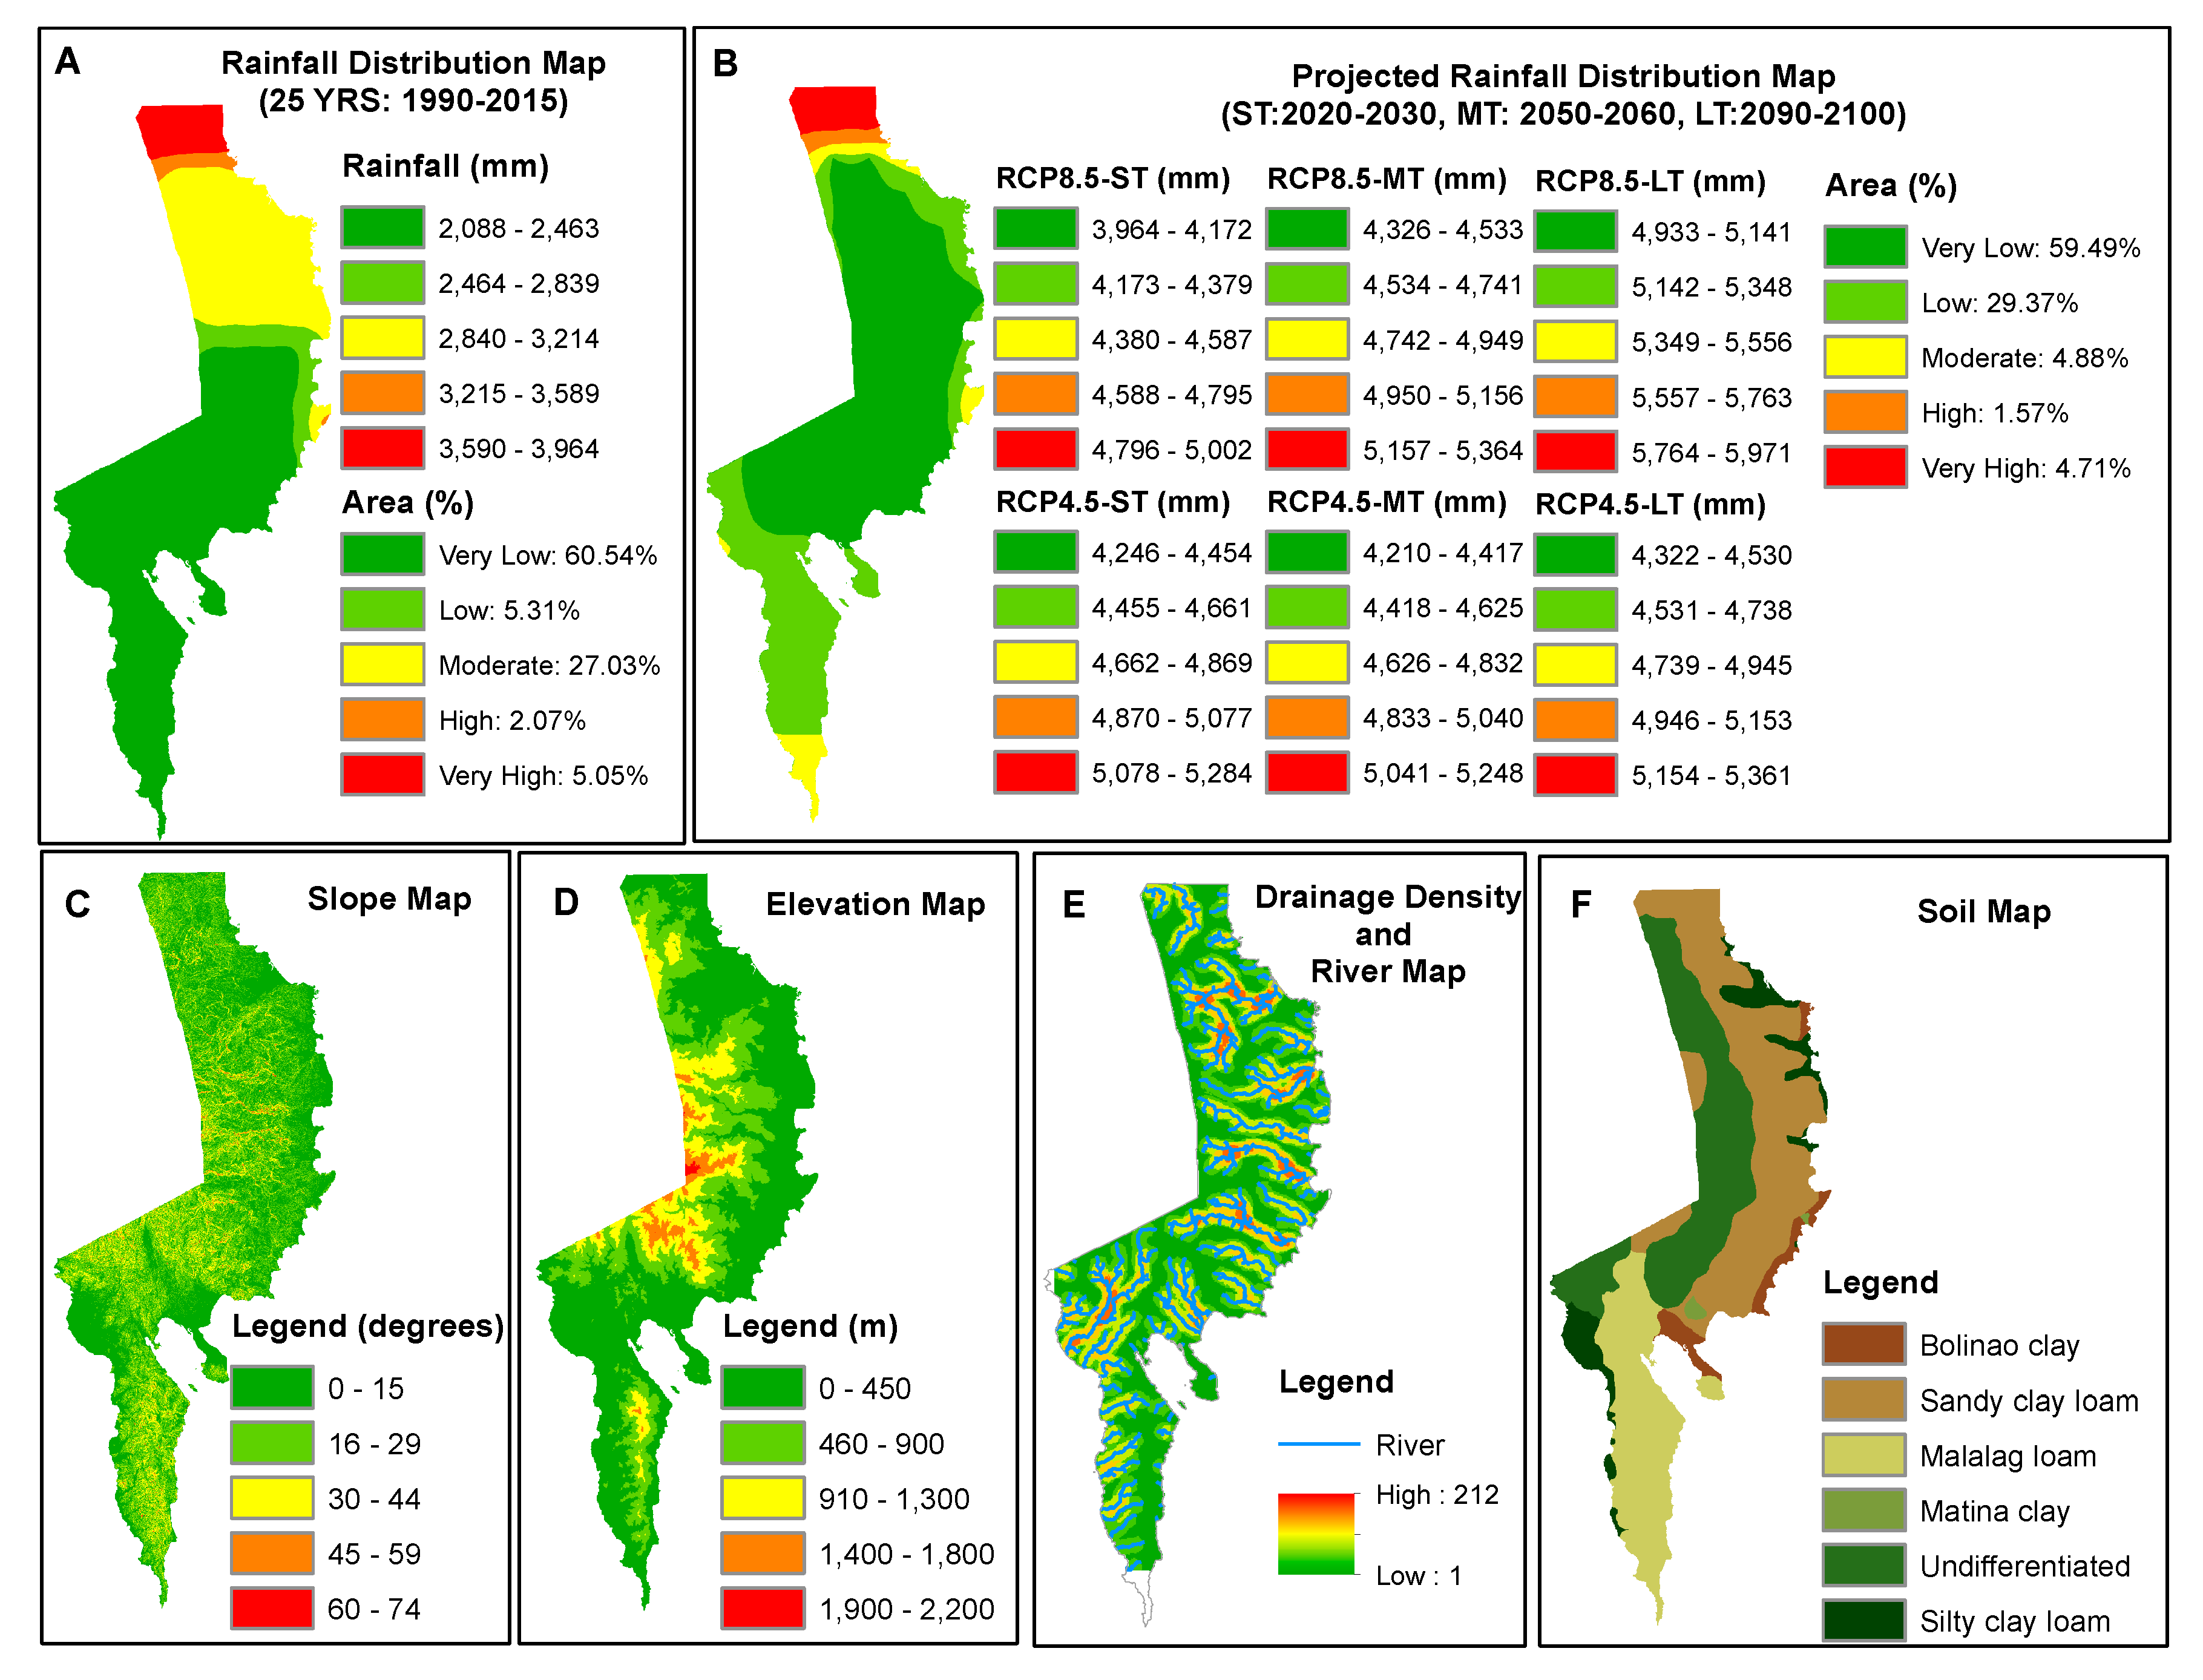
The six indicators for flood hazards are presented in Figure 8. Figure 9 shows that the AHP hazard map is a combination of indicators: rainfall (Figure 8A,B), slope (Figure 8C), elevation (Figure 8D), drainage density and distance to the main channel (Figure 8E), and soil (Figure 8F), respectively. Each indicator has different weights. In this paper, greater emphasis was placed on rainfall. The rainfall map (Figure 8A,B) shows that the East Coast municipalities have a higher incidence of rainfall compared to the Davao Gulf municipalities. The slope and elevation maps (Figure 8C,D) indicate that most of the areas in Davao Oriental are at low elevations, less than 217 m, and have slopes up to 16 degrees. All maps were classified based on an equal interval classification.
The multisource flood hazard mapping, where greater emphasis was placed on rainfall, is shown in Figure 8. Figure 8A,B are the different rainfall distributions under different scenarios. The rainfall distributions are difficult to compare from the current to the projected scenarios because no threshold is specified. However, note that the very low classification of rainfall in the projected scenarios (Figure 8B) belongs to the very high classification in the current scenario. This means that the rainfall pattern increases in the coming years. Additionally, it is evident that Davao Oriental will experience heavy rainfall in the coming years, especially under the RCP8.5 (see Figure 8B).
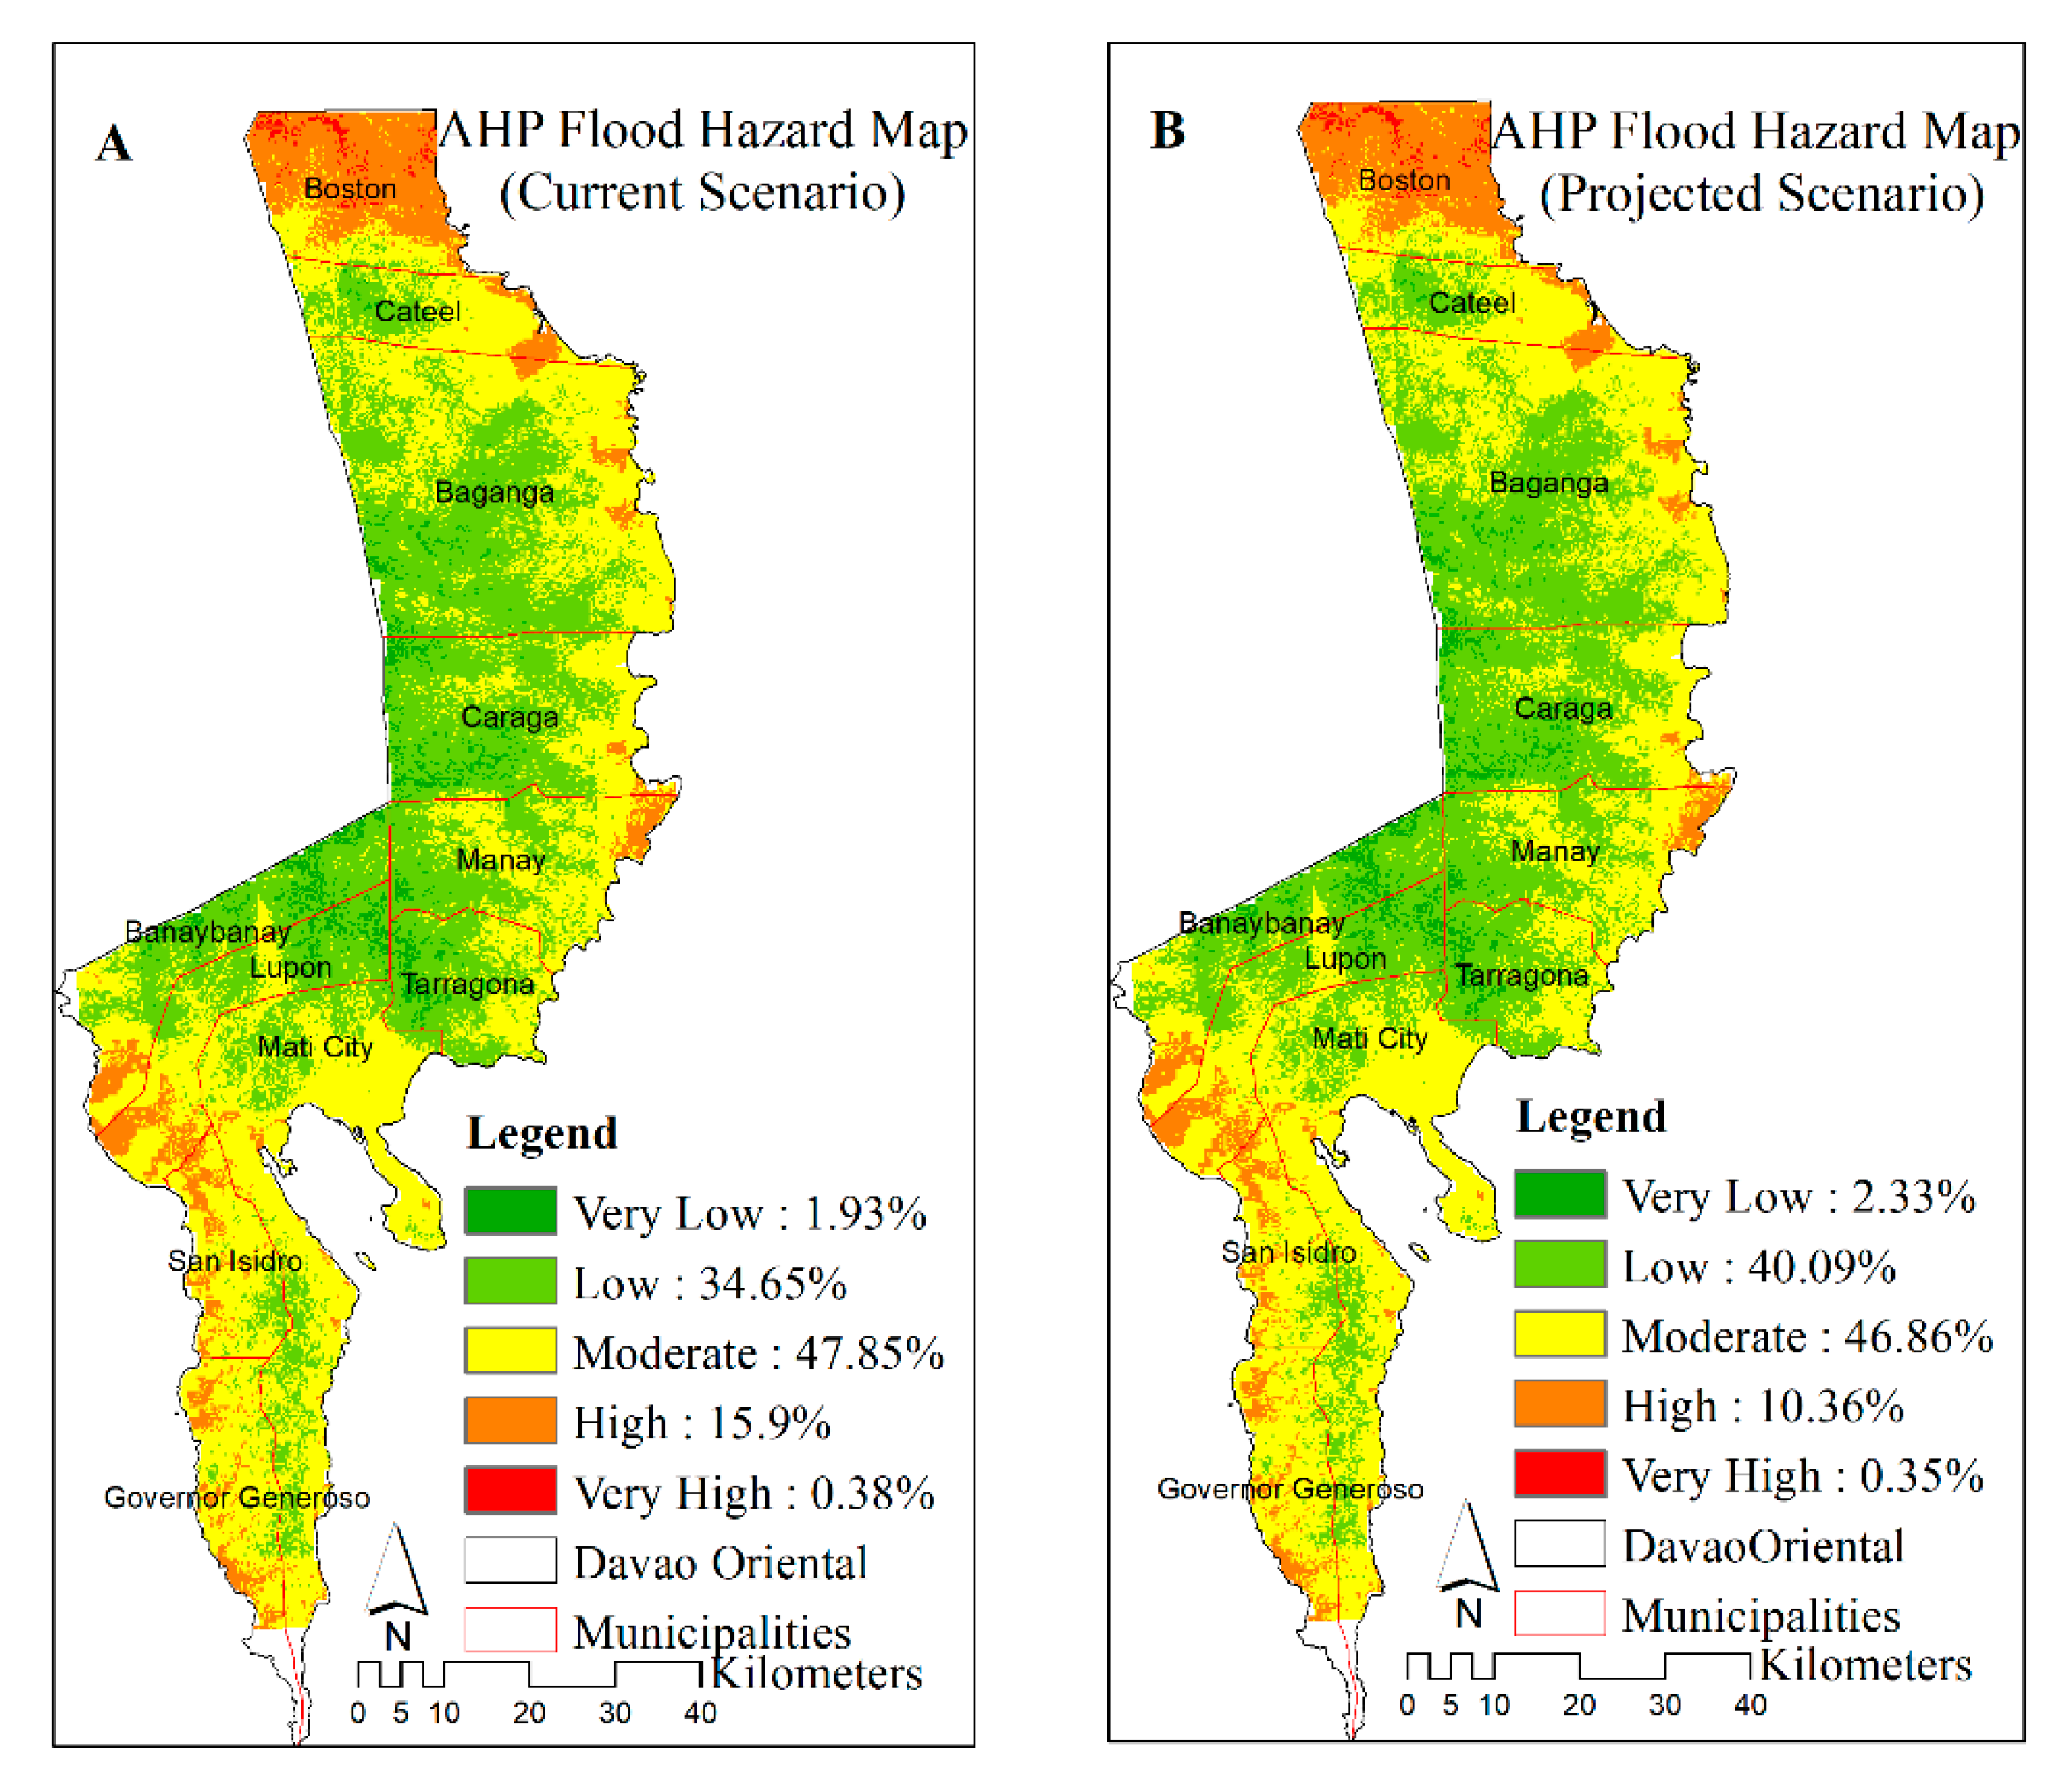
The resulting flood hazard map in Figure 9 indicates five classifications of risk—VL, L, M, H, and VH—as described in Section 3.2.3. Figure 9A is the current situation of the flood hazard map, and Figure 9B is the projected scenario of the flood hazard map in Davao Oriental. The changes in the area distribution in the flood hazard map from the current situation to the projected scenarios are minor. However, the intensity of rainfall will change and intensify in every future decade.
In the municipal level of flood hazard assessment (Figure 9), the majority of Boston municipality belongs to category H in the current to projected scenarios. Additionally, Boston is the only municipality with a VH category. The Cateel municipality changes from M and H into the L and M categories. The Baganga municipality changes dramatically from M and H into the L and M categories. On the other hand, the municipality of Caraga does not change very much, and there are small areas that change from M to H, mostly in the coastal areas. The municipalities of Manay and Tarragona have slight differences but still belong to the L and M categories.
On the other hand, in the Davao Gulf municipalities of Davao Oriental, many changes will occur in the future, especially in the coastal areas. Most of the changes will occur in the municipalities of Banaybanay, Lupon, San Isidro, and Governor Generoso. The majority of the areas in Governor Generoso and San Isidro change into M, and some parts change into H from the L and M categories in the current scenario. On the other hand, Lupon and Banaybanay are still in the same classifications from the current to the projected scenarios, but there are significant changes in some parts of the coastal areas in these two municipalities. Mati City still belongs to the M classification with some small changes in the H classification.
Overall, the VL, L, and M categories are increasing in Davao Oriental, while the H and VH are decreasing (Figure 9). The VL and L classes cover 1.93% and 34.65% of the total area of Davao Oriental, respectively. The two classifications (VL, L) increase to 2.33% and 40.09%, respectively. These two classes (VL, L) are areas with high elevations, high slopes, and low drainage densities.
On the other hand, the categories of the M, H, and VH classes were estimated to cover 47.85%, 15.9%, and 0.38% of the total area of Davao Oriental in the current scenario, respectively, and are mostly in the East Coast municipalities (Boston, Cateel, and Baganga). These are areas that have high occurrences of rainfall, high drainage densities, low elevations, and low slopes, and they are proximal to river channels and shorelines. The M classification decreases from 47.85% to 46.86% in these areas. The H and VH classifications decrease from 15.9% and 0.38% to 10.36% and 0.35%, respectively. This situation shows that majority of the province of Davao Oriental is classified as L to M in the flood hazard in the future.
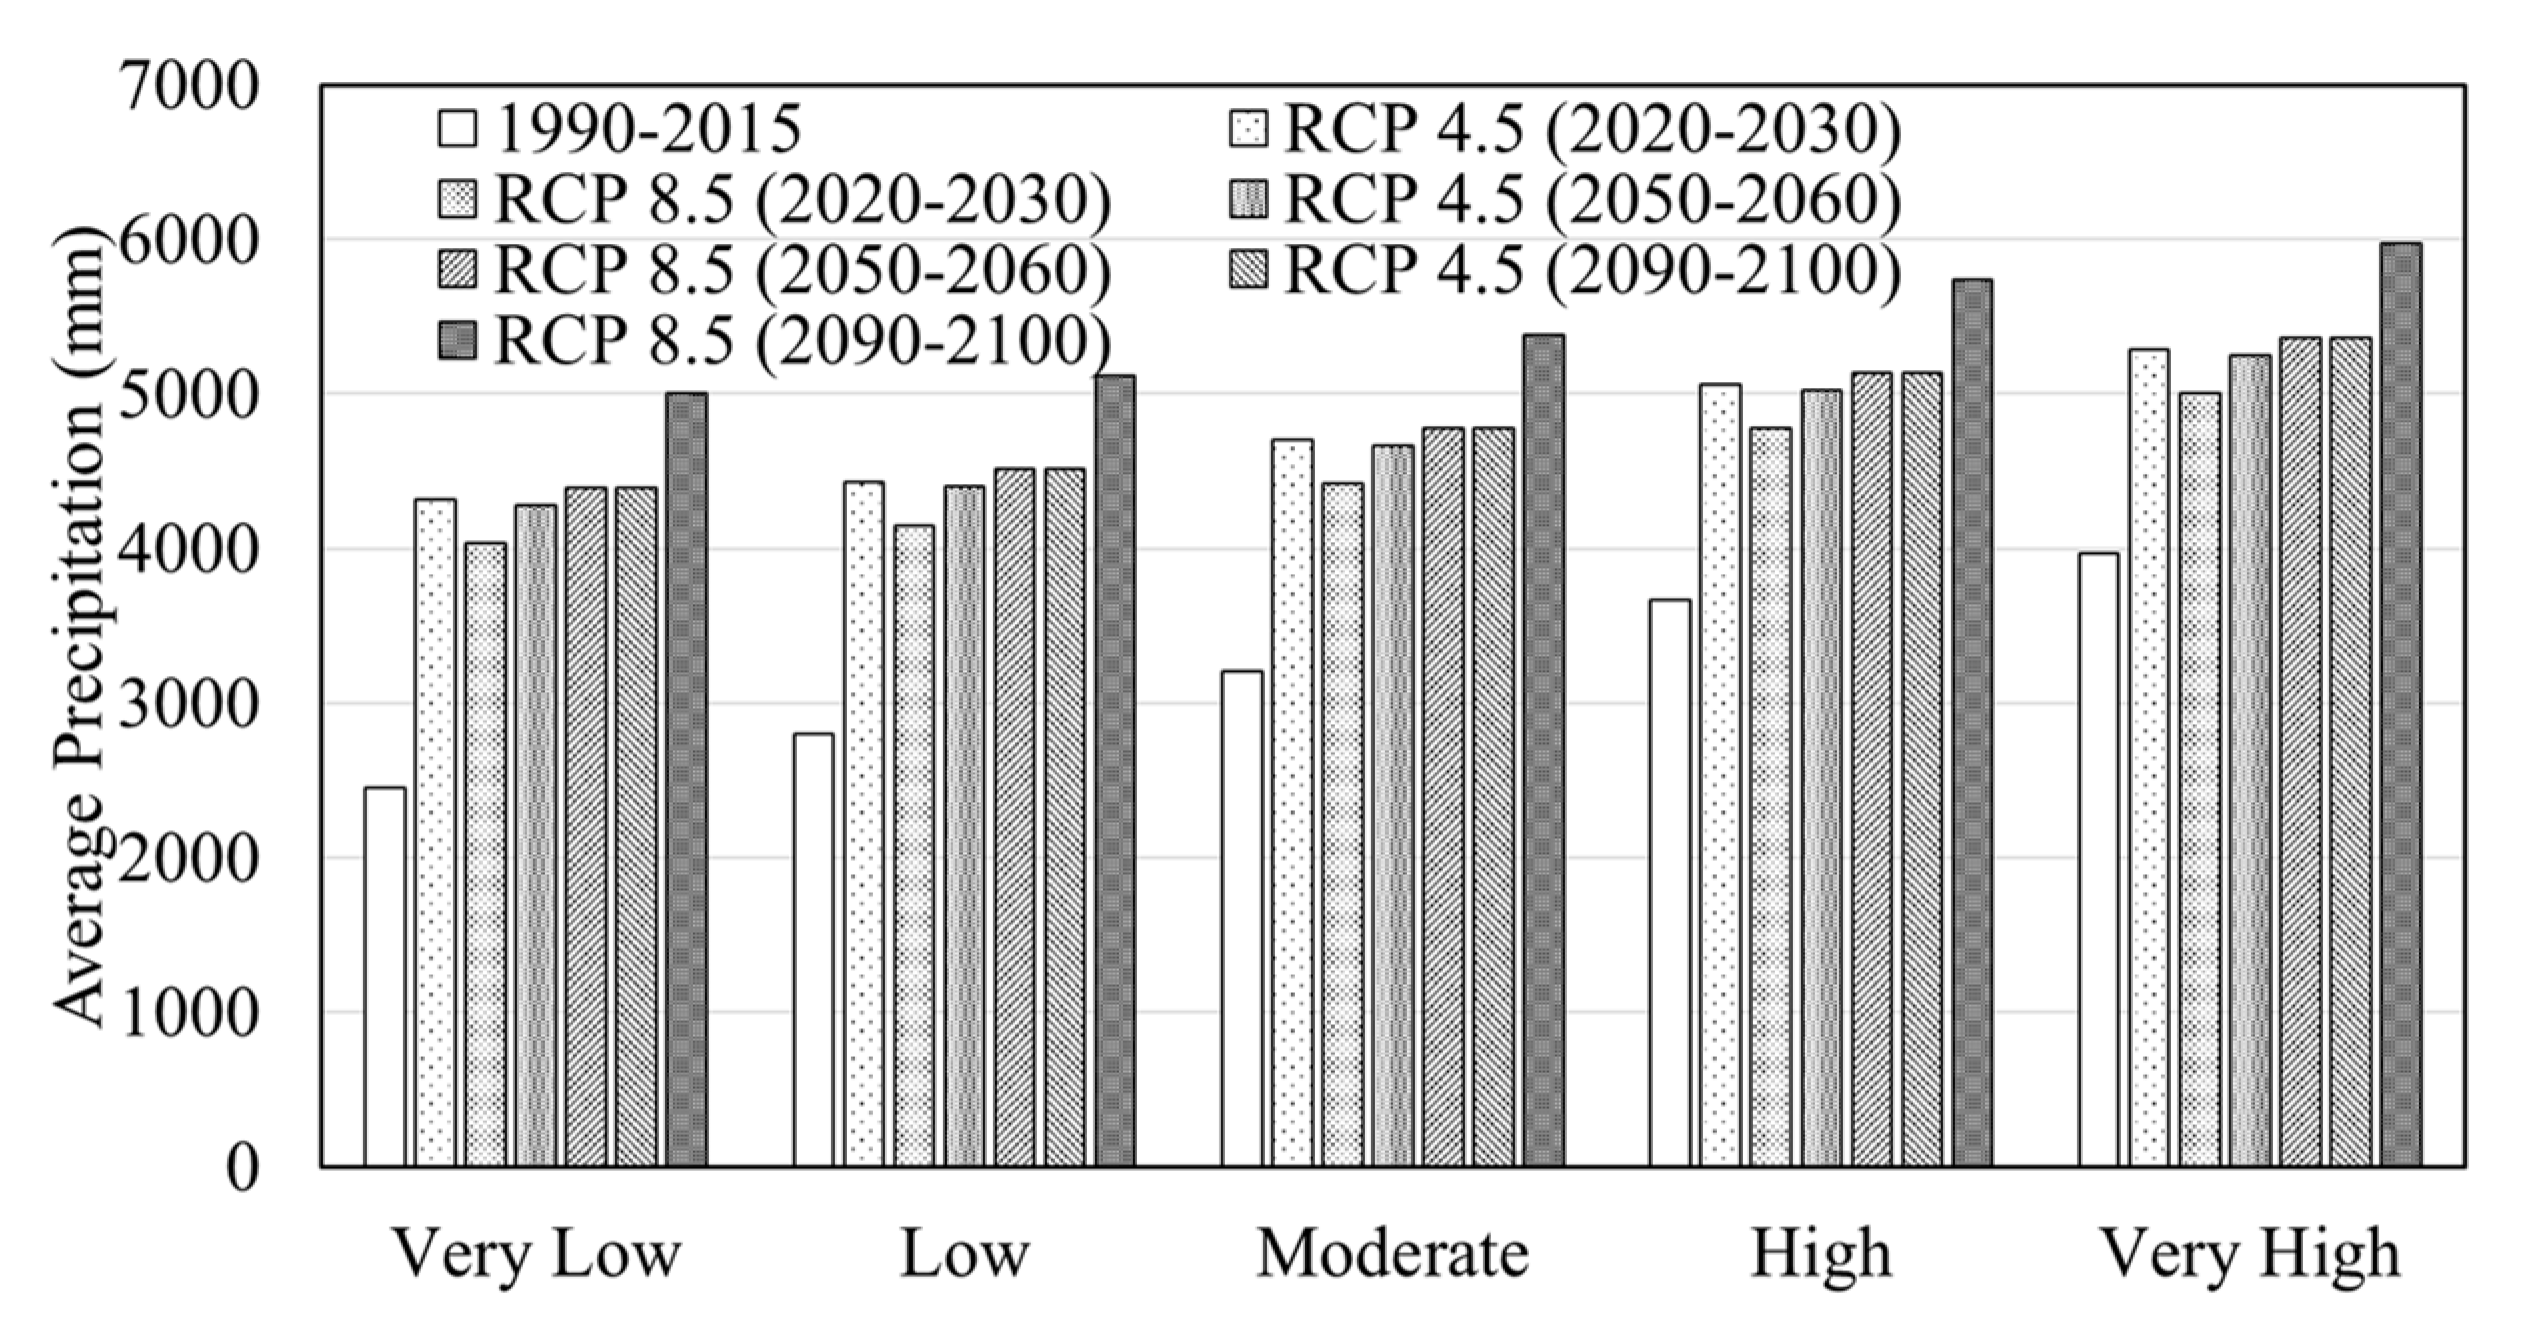
The hazard map shows that approximately 16% (current) and 11% (projected) of the area have H and VH hazard risks and that rainfall (42%) and slope (23%) are the most significant causative factors of flood occurrences. Unfortunately, the basis of the evaluation is the spatial distribution of the flood hazard map, where the classification of flood hazards into VL, L, M, V, and VH has no threshold values. Thus, it is difficult to directly compare the two hazard maps in the current and the projected scenarios. However, by referring to the absolute values of rainfall in Figure 8A,B, note that the very low (VL) category in the projected scenarios (Figure 8B) belongs to the very high (VH) classification in the current scenario. A gradual increase in rainfall from 2020 to 2100 is approximately 69% (Figure 10), implying that Davao Oriental will experience heavy rainfall in the future.
4.3. Risk Map
The flood risk map was generated by a weighted overlay of the hazard and vulnerability maps with equal weights under different scenarios. The current, short-term, medium-term, and long-term hazard maps were overlaid in the 2015, 2035, 2065, and 2105 vulnerability maps, respectively, using the population density projection.
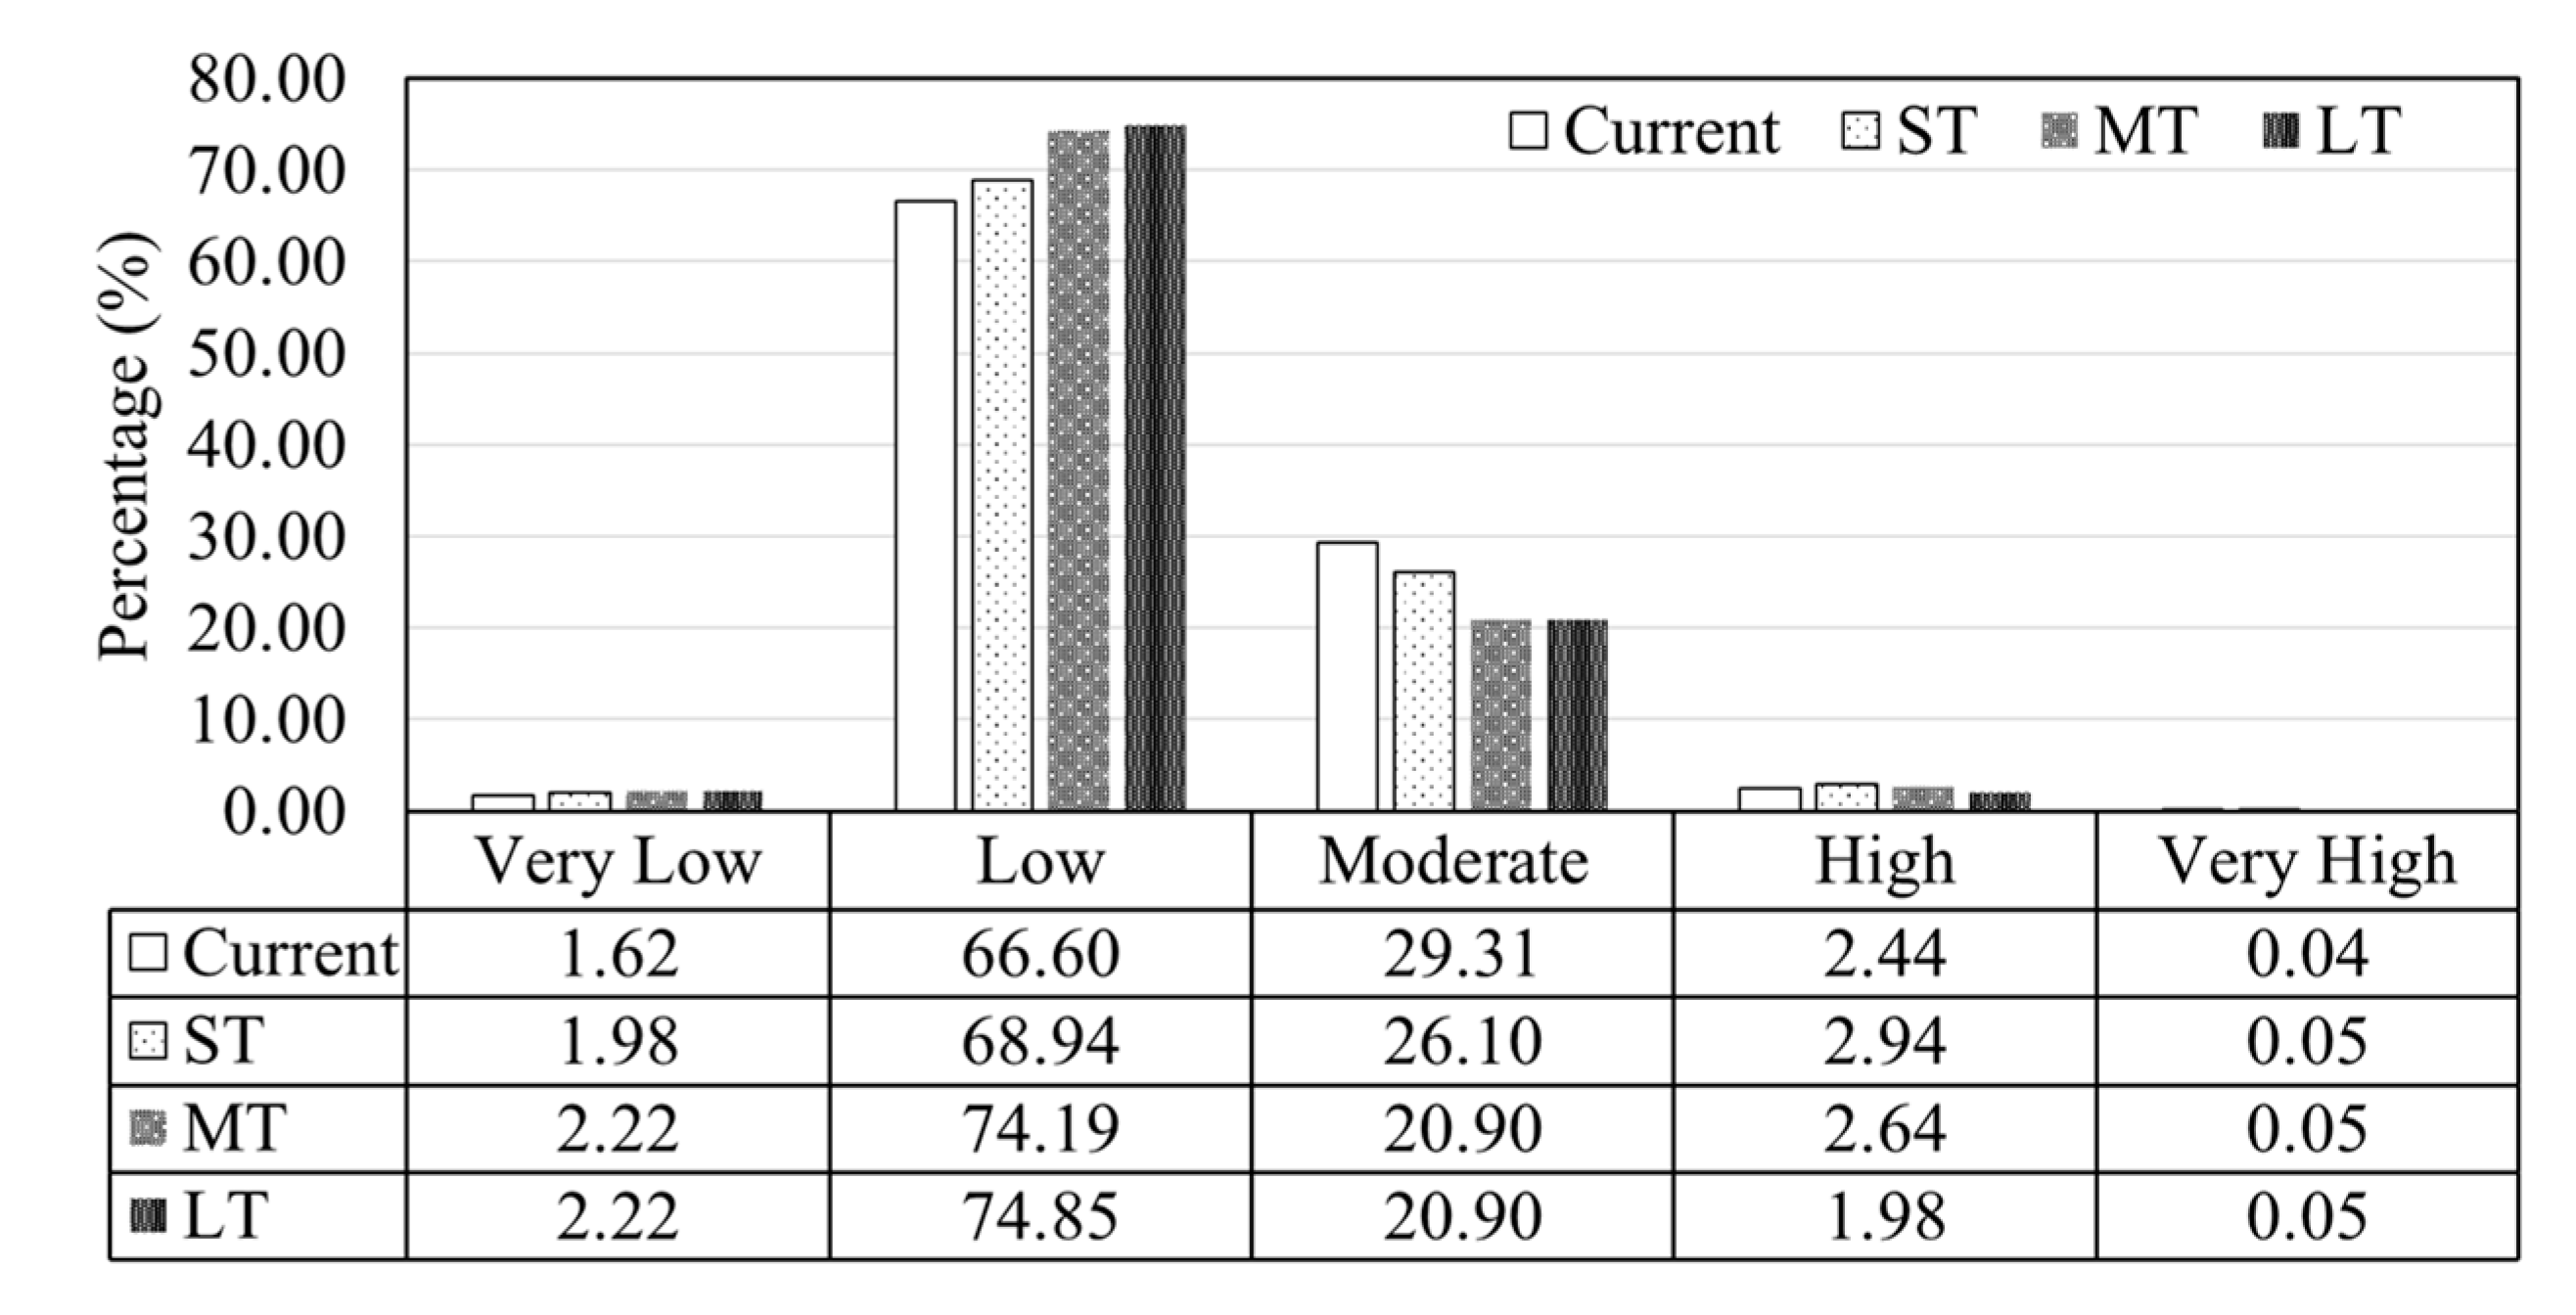
The flood risk map in Figure 11 was also classified into five categories. In the current scenario, the VL, L, and M classes cover 1.62%, 66.60%, and 29.31% of the total area, respectively. The categories of H and VH are estimated to be 2.44% and 0.04% of the total area, respectively; these areas are barangays with high population densities and are mostly in riverside and coastal areas.
In the short-term period, all classifications are increasing except for the M classification. Additionally, the VL classification increases from 1.98% to 2.22% in the medium-term and long-term periods. Moreover, the L classification increases from 68.94% to 74.19% in the medium-term period and 74.85% in the long-term period. Additionally, the H classification decreases from 2.94% to 2.64% in the medium-term period and eventually decreases to 1.98% in the long-term period (Figure 12). The VH classification has no increase from the short-term to the long-term period. It is notable that Davao Oriental can be classified as low to medium regarding the risk of flood (Figure 11 and Figure 12).
In most cases, the flood risk of the East Coast municipalities (Boston, Cateel, Baganga, Caraga, Manay, and Tarragona) decreases (Figure 11 and Table 7). In contrast, the flood risk of Davao Gulf municipalities (Banaybanay, Lupon, San Isidro, Governor Generoso, and Mati) increases due to the increase in population in these areas (Figure 11 and Table 7). These areas are mainly urban, there is a fishing industry, and they are the areas to which most of the people in Davao Oriental migrate.
Table 8 shows the lists of the barangays that have H and VH risks of flood. A total of 27, 38, and 29 barangays belong to the H risk of flood in the current, short-term, and medium/long-term periods, respectively. The barangays with a VH risk of flood increase from one in the current to two in the projected periods. Additionally, Cateel has the highest number of barangays that will experience the H and VH risk of floods in all periods. Most of the municipalities in Davao Gulf areas present an increasing number of barangays that will experience flood risks in the future. Moreover, one barangay of the municipality of Governor Generoso will experience a VH risk of flood in the future. These barangays need mitigation plans to cope with floods in the coming years. The results illustrate that the L category is increasing while the M category is decreasing through time. Davao Oriental belongs to low and medium risk of floods in the spatial area distribution.
5. Discussion
5.1. Temperature and Rainfall Projections
This study investigated temperature and rainfall projections to assess the impacts of climate change on flood risks in Davao Oriental. Area-averaged temperature and rainfall projections for the future were utilized from the 39 CMIP5 GCMs of the IPCC. The future temperatures from the CMIP5 predictions depict that Davao Oriental would experience approximately 1 °C and 3 °C increases under the RCP4.5 and RCP8.5 scenarios, respectively. However, the 39 area-averaged rainfall projections slightly increase in the coming years, which might be partially due to the coarse horizontal resolutions of GCMs and incomplete parameterizations of microphysics in GCMs. Among the 39 GCM models available from CMIP5, the GFDL-ESM2M model showed a good agreement in terms of increasing trends to the observed rainfall dataset at local stations. Thus, in this study, the GFDL-ESM2M model rainfall data were used for the rainfall criteria in the projection of the flood hazard and flood risk assessments.
The results of the rainfall from the GFDL-ESM2M model suggest that it will increase up to 69% in comparison with the current average rainfall in the next century. The increase in temperature and rainfall will significantly influence the floods in the future. As a result, the flood risk will be more intensive regarding its occurrences and scale and could be more extreme in the future.
5.2. Weighted Overlay Analysis
The crucial part of the MCDA is the weighted overlay. The weighted overlay combines all indicators to make the hazard, vulnerability, and risk maps that standardize the values from all indicators. Each indicator has its absolute value, such as the rainfall dataset in millimeters and the slope in degrees. A reclassification will classify the absolute values of the VL, L, M, H, and VH into 1, 2, 3, 4, and 5, respectively, in all indicators. This approach will result in a percentage area distribution of every indicator. Thus, the results will give importance to the percentage area distribution according to classification rather than the classification of the absolute value. Hence, the changes in rainfall from the current into the short term, medium term, and long term will not be shown in this analysis.
Another vital part of the weighted overlay analysis is the standardization of the grid resolution across all indicators. All indicators were changed into a raster dataset with a grid resolution of 30 m × 30 m. In the flood risk map, the vulnerability map was transformed into a raster dataset. The rasterization of the population density will change the population density according to the area of the barangay into the population density according to the grid resolution. This process turns the interpretation of the risk from barangay level into the raster level, where the risk is according to a 30 m × 30 m grid resolution. Additionally, most of the barangays in Davao Oriental are in rural areas that have a low population density. The rasterization process will significantly increase the low population number regarding the grid resolution. Additionally, in the projected scenarios (2035, 2065, and 2105) of the population density, some barangays will decrease their population in the future. These events will give high shares of the area distribution in the low category of population density in the future. Thus, the overlaying hazard map and vulnerability map to assess flood risk will illustrate that Davao Oriental belongs to the L to M flood risk classification because the flood risk map is generated by a weighted overlay of the hazard and vulnerability maps with equal weights. However, for the preparedness of the worst-case scenario in the disaster management and mitigation plan, giving a higher weighting value for the vulnerability map to assess flood risk is highly recommended.
5.3. Multicriteria Decision Analysis (MCDA)
Integrating multiple indicators (data sources) in the multicriteria analysis presents a real advantage, and the results show that the AHP approach allowed a better understanding of all of the indicators’ contributions in the flood assessment because a weight was given to each indicator. However, data from different sources with different resolutions were factors of bias during the processing and analysis. On the other hand, the addition of weights reduced the bias and uncertainty in the result.
The CR is the crucial element generating the hazard index (HI) for the MCDA using the AHP method. However, the AHP method shows some limitations due to the subjectivity in choosing the value of the indicator weighting from the arbitrary judgements of experts [12,14]. According to Saaty [30], this subjectivity problem was reduced by the CR test. The CR threshold must be less than 0.10 or 10% to make a coherent judgement. The lower the CR, the better, and if CR is zero (0), it means the hazard index is perfect. Unfortunately, the range of the CR between 0 and 9.9% is a rough estimation. The HI is coherent if the CR is 9.9% or the CR is 0%, but the weights of the criteria vary in every CR generation. Cabrera and Lee [12] presented the sensitivity of HI to varying CR values based on experiments in which the change in CR did not significantly affect the result of the flood hazard map. The overall average change according to the classification is 0.19%, and the changes are acceptable. The lowest criteria ratio is more appropriate to use, according to Saaty [30], so that the lower CR makes the judgement more coherent. Therefore, the CR with 0.02 was used for to obtain the flood risk in this study.
6. Conclusions
Climate change impacts on flood risks in the province of Davao Oriental, Philippines are assessed using a GIS-based flood risk assessment based on the MCDA in the AHP framework. The multicriteria data sources are rainfall, slope, elevation, drainage density, soil type, distance to the main channel, and population density. The rainfall projections were obtained from the 39 GCMs of CMIP5, and the population projection was also made using the AIM for four different periods—the current, short-term (2020–2030), medium-term (2050–2060), and long-term (2090–2100) periods—to assess flood risks under the two scenarios, RCP4.5 and RCP8.5.
The result of the flood risk map shows that Davao Oriental is in the L to M flood risk. The L flood risk classification is increasing from 67% in the current situation to 69% in the short-term, 74% in the medium-term, and 75% in the long-term periods. On the other hand, the M flood risk classification is decreasing from 29%, 26%, and 21% in the current, short-term, and medium/long-term periods, respectively. Approximately 3% in all periods are in the H to VH risk of flood. These areas are near the coastline and riverbanks with a high population density and need robust mitigation plans. However, note that as mentioned in Section 5.2, the flood hazard and risk maps present the classifications based on an area distribution in percentages rather than the classification from the absolute value. Therefore, for instance, the VH category of the absolute value in the current period is classified into VL in the future scenarios.
The results of flood risks at the barangay level show that the province of Davao Oriental is slightly exposed to the risk of floods. There are 27 in the current scenario, 38 in the short-term period, and 29 in the medium- and long-term periods out of 183 barangays that are in the H category of flood risk, respectively. Only one barangay in Cateel has a VH risk of flood in the current period, and one more barangay in Governor Generoso was added in this category in the medium- and long-term periods. This would require immediate attention from decision-makers to develop strategies for the future occurrences of floods within the province of Davao Oriental. An effective strategy should be drawn up at the barangay level, since each barangay has its own physical and social characteristics. Immediate strategies like installing weather measurement instruments in at least one station per municipality will give us precise weather forecasting, especially during extreme events like drought, heavy rainfalls, storms, and typhoon. Since the national government has no specific flood-risk mitigation plan, the municipal governments in coordination with the office of the disaster risk reduction and management council (DRRMC) can design a flood-risk education program in every barangay. The flood-risk education program is an education campaign on how to act before, during, and after the event of flooding.
Finally, the outcomes of this study can serve as a guide in creating disaster risk plans for the adaptation measures under climate change impacts in the province of Davao Oriental. In further work, adding more factors such as socioeconomic variables and land use/land cover into the vulnerability map and applying the AHP method can provide higher resolution in vulnerability assessments.
Author Contributions
J.C. developed the concept of this study under the supervision of H.S.L. The analysis was carried out by both authors. Both authors drafted the first version of the manuscript and worked on improving and finalizing the manuscript.
Funding
This research is partly supported by the Grant-in-Aid for Scientific Research (17K06577) from JSPS, Japan.
Acknowledgments
In The first author is supported by The Project for Human Resource Development Scholarship (JDS), Japan.
Conflicts of Interest
The authors declare no conflict of interest.
Appendix A. Summary of CMIP5 GCMs Used in Rainfall and Temperature Analysis

Table A1.
The 39 CMIP5 GCMs used in the analysis of rainfall and temperature projections.
| No. | Institution | Model Name | Spatial Resolution (Lat. × Lon., degree) |
|---|---|---|---|
| 1 | Commonwealth Scientific and Industrial Research Organization CSIRO), Australia and Bureau of Meteorology (BOM), Australia | ACCESS1-0 | 1.25 × 1.875 |
| 2 | ACCESS1-3 | 1.25 × 1.875 | |
| 3 | Beijing Climate Center, China Meteorological Administration | bcc-csm1-1 | 2.7906 × 2.8125 |
| 4 | bcc-csm1-1-m | 2.7906 × 2.8125 | |
| 5 | Beijing Normal University | BNU-ESM | 2.7906 × 2.8125 |
| 6 | Canadian Centre for Climate Modelling and Analysis, Canada | CanESM2 | 2.7906 × 2.8125 |
| 7 | National Center for Atmospheric Research, USA | CCSM4 | 0.9424 × 1.25 |
| 8 | National Science Foundation, Department of Energy, NCAR, USA | CESM1-BGC | 0.9424 × 1.25 |
| 9 | CESM1-CAM5 | 0.9424 × 1.25 | |
| 10 | Euro-Mediterraneo sui Cambiamenti Climatici, Italy | CMCC-CM | 0.7484 × 0.75 |
| 11 | CMCC-CMS | 3.7111 × 3.75 | |
| 12 | Centre National de Recherches Meteorologiques, Meteo-France, France | CNRM-CM5 | 1.4008 × 1.40625 |
| 13 | Commonwealth Scientific and Industrial Research Organization (CSIRO), Australia | CSIRO-Mk3-6-0 | 1.8653 × 1.875 |
| 14 | European Centre for Medium-Range Weather Forecasts | EC-EARTH | 1.1215 × 1.125 |
| 15 | Laboratory Numerical Model for Atmospheric Sciences and Geophysical Fluid Dynamics | FGOALS-g2 | 2.7906 × 2.8125 |
| >16 | >The First Institute of Oceanography Earth System Model | >FIO-ESM | >2 × 2.8125 |
| 17 | NOAA Geophysical Fluid Dynamics Laboratory, USA | GFDL-CM3 | 2 × 2.5 |
| 18 | GFDL-ESM2G | 2.0225 × 2.5 | |
| 19 | GFDL-ESM2M | 2.0225 × 2.5 | |
| 20 | NASA Goddard Institute for Space Studies | GISS-E2-H | 2 × 2.5 |
| 21 | GISS-E2-H-CC | 2 × 2.5 | |
| 22 | GISS-E2-R | 2 × 2.5 | |
| 23 | GISS-E2-R-CC | 2 × 2.5 | |
| 24 | Met Office Hadley Centre, UK | HadGEM2-AO | 1.25 × 1.875 |
| 25 | HadGEM2-CC | 1.25 × 1.875 | |
| 26 | HadGEM2-ES | 1.25 × 1.875 | |
| 27 | Institute for Numerical Mathematics, Russia Institut Pierre-Simon Laplace, France | Inmcm4 | 1.5 × 2 |
| 28 | IPSL-CM5A-LR | 1.8947 × 3.75 | |
| 29 | IPSL-CM5A-MR | 1.2676 × 2.5 | |
| 30 | IPSL-CM5A-LR | 1.8947 × 3.75 | |
| 31 | Atmosphere and Ocean Research Institute (The University of Tokyo), National Institute for Environmental Studies and Japan Agency for Marine-Earth Science and Technology | MIROC5 | 1.4008 × 1.40625 |
| 32 | MIROC-ESM | 2.7906 × 2.8125 | |
| 33 | MIROC-ESM-CHEM | 2.7906 × 2.8125 | |
| 34 | Ma× Planck Institute for Meteorology, Germany | MPI-ESM-LR | 1.8653 × 1.875 |
| 35 | MPI-ESM-MR | 1.8653 × 1.875 | |
| 36 | Meteorological Research Institute, Japan | MRI-CGCM3 | 1.12148 × 1.125 |
| 37 | MRI-ESM1 | 1.12148 × 1.125 | |
| 38 | Norwegian Climate Centre | NorESM1-M | 1.8947 × 2.5 |
| 39 | NorESM1-ME | 1.8947 × 2.5 |
References
- Stocker, T.F.; Qin, D.; Plattner, G.-K.; Tignor, M.; Allen, S.K.; Boschung, J.; Nauels, A.; Xia, Y.; Bex, V.; Midgley, P.M. (Eds.) IPCC Climate Change 2013: The Physical Science Basis, WG1. In The Fifth Assessment Report of the Intergovernmental Panel on Climate Change; Cambridge University Press: Cambridge, UK, 2013; p. 1535. [Google Scholar]
- Babel, M.S.; Agarwal, A.; Swain, D.K.; Herath, S. Evaluation of climate change impacts and adaptation measures for rice cultivation in Northeast Thailand. Clim. Res. 2011, 46, 137–146. [Google Scholar] [CrossRef] [Green Version]
- Dau, Q.V.; Kuntiyawichai, K. An assessment of potential climate change impacts on flood risk in central Vietnam. Eur. Sci. J. 2015, 1, 667–680. [Google Scholar]
- Hirabayashi, Y.; Mahendran, R.; Koirala, S.; Konoshima, L.; Yamazaki, D.; Watanabe, S.; Kim, H.; Kanae, S. Global flood risk under climate change. Nat. Clim. Chang. 2013, 3, 816–821. [Google Scholar] [CrossRef]
- The Intergovernmental Panel on Climate Change (IPCC). IPCC Special Report of the Intergovernmental Panel on Climate Change Managing the Risks of Extreme Events and Disasters to Advance Climate Change; Cambridge University Press: Cambridge, UK, 2012. [Google Scholar]
- Lee, H.S.; Trihamdani, A.R.; Kubota, T.; Iizuka, S.; Phuong, T.T.T. Impacts of land use changes from the Hanoi Master Plan 2030 on urban heat islands: Part 2. Influence of global warming. Sustain. Cities Soc. 2017, 31, 95–108. [Google Scholar] [CrossRef]
- Kubota, T.; Lee, H.S.; Trihamdani, A.R.; Phuong, T.T.T.; Tanaka, T.; Matsuo, K. Impacts of land use changes from the Hanoi Master Plan 2030 on urban heat islands: Part 1. Cooling effects of proposed green strategies. Sustain. Cities Soc. 2017, 32, 295–317. [Google Scholar] [CrossRef]
- Apurv, T.; Mehrotra, R.; Sharma, A.; Goyal, M.K.; Dutta, S. Impact of climate change on floods in the Brahmaputra basin using CMIP5 decadal predictions. J. Hydrol. 2015, 527, 281–291. [Google Scholar] [CrossRef]
- Huang, S.; Krysanova, V.; Hattermann, F. Projections of climate change impacts on floods and droughts in Germany using an ensemble of climate change scenarios. Reg. Environ. Chang. 2015, 15, 461–473. [Google Scholar] [CrossRef]
- Basconcillo, J.; Lucero, A.; Solis, A.; Sandoval, J.R.; Bautista, E.; Koizumi, T.; Kanamaru, H. Statistically Downscaled Projected Changes in Seasonal Mean Temperature and Rainfall in Cagayan Valley, Philippines. J. Meteorol. Soc. Jpn. Ser. II 2016, 94A, 151–164. [Google Scholar] [CrossRef]
- Coronas, J. Climate and Weather of the Philippines, 1903–1918; Bureau of Printing: Washington, DC, USA, 1920.
- Cabrera, J.S.; Lee, H.S. Flood risk assessment using gis-based multi-criteria analysis: A case study in Davao Oriental, Philippines. J. Hydro-Envion. Res. 2018. in review. [Google Scholar]
- Philippine Statistics Authority. Available online: https://www.psa.gov.ph/sites/default/files/attachments/hsd/pressrelease/R11.xlsx (accessed on 6 June 2017).
- Danumah, J.H.; Odai, S.N.; Saley, B.M.; Szarzynski, J.; Thiel, M.; Kwaku, A.; Kouame, F.K.; Akpa, L.Y. Flood risk assessment and mapping in Abidjan district using multi-criteria analysis (AHP) model and geoinformation techniques, (cote d’ivoire). Geoenviron. Disasters 2016, 3, 10. [Google Scholar] [CrossRef]
- Kazakis, N.; Kougias, I.; Patsialis, T. Assessment of flood hazard areas at a regional scale using an index-based approach and Analytical Hierarchy Process: Application in Rhodope–Evros region, Greece. Sci. Total Environ. 2015, 538, 555–563. [Google Scholar] [CrossRef] [PubMed]
- Wang, Y.; Li, Z.; Tang, Z.; Zeng, G. A GIS-Based Spatial Multi-Criteria Approach for Flood Risk Assessment in the Dongting Lake Region, Hunan, Central China. Water Resour. Manag. 2011, 25, 3465–3484. [Google Scholar] [CrossRef]
- Zhang, K.; Manning, T.; Wu, S.; Rohm, W.; Silcock, D.; Choy, S. Capturing the Signature of Severe Weather Events in Australia Using GPS Measurements. IEEE J. Sel. Top. Appl. Earth Observ. Remote Sens. 2015, 8, 1839–1847. [Google Scholar] [CrossRef]
- Mohammed, I.N.; Bomblies, A.; Wemple, B.C. The use of CMIP5 data to simulate climate change impacts on flow regime within the Lake Champlain Basin. J. Hydrol. Reg. Stud. 2015, 3, 160–186. [Google Scholar] [CrossRef]
- Wu, C.H.; Huang, G.R.; Yu, H.J. Prediction of extreme floods based on CMIP5 climate models: A case study in the Beijiang River basin, South China. Hydrol. Earth Syst. Sci. 2015, 19, 1385–1399. [Google Scholar] [CrossRef]
- Chatterjee, S.; Krishna, A.P.; Sharma, A.P. Geospatial assessment of soil erosion vulnerability at watershed level in some sections of the Upper Subarnarekha river basin, Jharkhand, India. Environ. Earth Sci. 2014, 71, 357–374. [Google Scholar] [CrossRef]
- Frey, H.; Paul, F. On the suitability of the SRTM DEM and ASTER GDEM for the compilation of topographic parameters in glacier inventories. Int. J. Appl. Earth Observ. Geoinf. 2012, 18, 480–490. [Google Scholar] [CrossRef]
- Ng, Z.F.; Akbari, A. ASTER-DEM Derived Flood Inundation Map Using 1D-2D Flood Modeller Pro in Kuantan River Basin. In Proceedings of the 2nd International Congress on Technology-Engineering & Science (ICONTES), Kuala Lumpur, Malaysia, 28–29 July 2016. [Google Scholar]
- Huong, D.T.V.; Nagasawa, R. Potential flood hazard assessment by integration of ALOS PALSAR and ASTER GDEM: A case study for the Hoa Chau commune, Hoa Vang district, in central Vietnam. J. Appl. Remote Sens. 2014, 8, 083626. [Google Scholar] [CrossRef]
- Othman, N.; Jafri, M.Z.M.; Lim, H.S.; Tan, K.C. Using ASTER GDEM and SRTM digital elevation models to generate contour lines over rugged terrain of Makkah. In Proceedings of the 2011 IEEE International Conference on Space Science and Communication (IconSpace), Penang, Malaysia, 12–13 July 2011; pp. 11–13. [Google Scholar]
- Reddy, G.P.O.; Kumar, N.; Sahu, N.; Singh, S.K. Evaluation of automatic drainage extraction thresholds using ASTER GDEM and Cartosat-1 DEM: A case study from basaltic terrain of Central India. Egypt. J. Remote Sens. Space Sci. 2018, 21, 95–104. [Google Scholar] [CrossRef]
- Tachikawa, T.; Kaku, M.; Iwasaki, A.; Gesch, D.B.; Oimoen, M.J.; Zhang, Z.; Danielson, J.J.; Krieger, T.; Curtis, B.; Haase, J.; et al. ASTER Global Digital Elevation Model. Version 2-Summary of Validation Results; NASA: Washington, DC, USA, 2011; p. 27.
- Ghangrekar, M.M.; Kharagpur, I. Module 5: Population Forecasting Lecture 5: Population Forecasting. Available online: http://scetcivil.weebly.com/uploads/5/3/9/5/5395830/m5_l5-population_forecasting.pdf (accessed on 4 December 2017).
- Alejandrino, I.K.; Lagmay, A.M.; Eco, R.N. Shallow Landslide Hazard Mapping for Davao Oriental, Philippines, Using a Deterministic GIS Model. In Communicating Climate-Change and Natural Hazard Risk and Cultivating Resilience: Case Studies for a Multi-disciplinary Approach; Drake, J.L., Kontar, Y.Y., Eichelberger, J.C., Rupp, T.S., Taylor, K.M., Eds.; Springer International Publishing: Cham, Switzerland, 2016; pp. 131–147. [Google Scholar]
- Gigović, L.; Pamučar, D.; Bajić, Z.; Drobnjak, S. Application of GIS-Interval Rough AHP Methodology for Flood Hazard Mapping in Urban Areas. Water 2017, 9, 360. [Google Scholar] [CrossRef]
- Saaty, T.L. The Analytic Hierarchy Process: Planning, Priority Setting, Resource Allocation; McGraw-Hill: New York, NY, USA, 1980; p. 287. [Google Scholar]
- Di Baldassarre, G.; Castellarin, A.; Montanari, A.; Brath, A. Probability-weighted hazard maps for comparing different flood risk management strategies: A case study. Nat. Hazards 2009, 50, 479–496. [Google Scholar] [CrossRef]
- Yahaya, S.; Ahmad, N.; Abdalla, R.F. Multicriteria Analysis for Flood Vulnerable Areas in Hadejia-Jama’are River Basin, Nigeria. Eur. J. Sci. Res. 2010, 42, 71–83. [Google Scholar]
- Elkhrachy, I. Flash Flood Hazard Mapping Using Satellite Images and GIS Tools: A case study of Najran City, Kingdom of Saudi Arabia (KSA). Egypt. J. Remote Sens. Space Sci. 2015, 18, 261–278. [Google Scholar] [CrossRef]
- Ebaid, H.M.; Farag, H.A.; Falaky, A.A.E. Using GIS and remote sensing approaches to delineate potential areas for runoff management applications in Egypt. Int. J. Environ. Sci. Eng. 2016, 7, 85–93. [Google Scholar]
- Nyarko, B.K. Application of a Rational Model in GIS for Flood Risk Assessment in Accra, Ghana. J. Spat. Hydrol. 2002, 2, 1–14. [Google Scholar]
- Apollonio, C.; Balacco, G.; Novelli, A.; Tarantino, E.; Piccinni, A. Land Use Change Impact on Flooding Areas: The Case Study of Cervaro Basin (Italy). Sustainability 2016, 8, 996. [Google Scholar] [CrossRef]
- National Oceanic and Atmospheric Administration (NOAA). Flash Flood Early Warning System Reference Guide; NOAA: Silver Spring, MD, USA, 2010; p. 204.
- Ganugula, G.V.B.; Sinha, R. GIS in Flood Hazard. Mapping: A Case Study of Kosi River Basin, India. GIS Dev. Wkly. 2005. [Google Scholar] [CrossRef]
- Saaty, T.L. A scaling method for priorities in hierarchical structures. J. Math. Psychol. 1977, 15, 234–281. [Google Scholar] [CrossRef]
- Pellicani, R.; Parisi, A.; Iemmolo, G.; Apollonio, C. Economic Risk Evaluation in Urban Flooding and Instability-Prone Areas: The Case Study of San Giovanni Rotondo (Southern Italy). Geosciences 2018, 8, 112. [Google Scholar] [CrossRef]
Figure 1.
Study area of Davao Oriental, Philippines: (A) The Philippines showing the admin boundary of Mindanao Island; (B) The Mindanao Island showing the admin boundary of Davao Oriental; (C) The province of Davao Oriental with the administrative boundaries of each municipalities and National Climate Data Center (NCDC) rainfall data points; (D) The area boundaries (Areas 1–4) defined for the rainfall projection analysis with the digital elevation model (DEM) and the two weather stations (DOST-RX1 and Hinatuan).

Figure 2.
Comparisons of the observed annual rainfalls at the (A) Hinatuan and (B) DOST-RXI Stations with the NCDC and Global Precipitation Climatology Centre (GPCC) rainfall datasets. The locations of DO20 and DO63 are 7.083° N, 125.95° E, and 8.00° N, 126.33°E, respectively.
Figure 2.
Comparisons of the observed annual rainfalls at the (A) Hinatuan and (B) DOST-RXI Stations with the NCDC and Global Precipitation Climatology Centre (GPCC) rainfall datasets. The locations of DO20 and DO63 are 7.083° N, 125.95° E, and 8.00° N, 126.33°E, respectively.

Figure 3.
Multicriteria data analysis (MCDA) for flood risk assessment in analytic hierarchy process (AHP) framework.
Figure 3.
Multicriteria data analysis (MCDA) for flood risk assessment in analytic hierarchy process (AHP) framework.

Figure 4.
Area-averaged temperature projections for Area 1 (see Figure 1D) from the 39 GCMs for the period of 2016–2100.
Figure 4.
Area-averaged temperature projections for Area 1 (see Figure 1D) from the 39 GCMs for the period of 2016–2100.

Figure 5.
Area-averaged (Area 1, 2, 3, and 4) rainfall projections from the 39 GCMs for the period of 2030–2100.
Figure 5.
Area-averaged (Area 1, 2, 3, and 4) rainfall projections from the 39 GCMs for the period of 2030–2100.

Figure 6.
Projected rainfalls GCMs—CMIP5 39 model’s comparison: (A) Models with increasing trends in the period of 2006–2015; (B) Period extended from 2006–2100 for the models with increasing trends where GFDL-ESM2M model has the highest trend compare to other models; (C) GFDL-ESM2M model trends under RCP4.5 and RCP8.5; and (D) the DJF seasonal rainfalls the GFDL-ESM2M under RCP4.5 and RCP8.5.

Figure 7.
Barangay population density for 2015, 2035, 2065 and 2105 in Davao Oriental. Population projections is made using the arithmetic increment method and used for vulnerability assessment.
Figure 7.
Barangay population density for 2015, 2035, 2065 and 2105 in Davao Oriental. Population projections is made using the arithmetic increment method and used for vulnerability assessment.

Figure 8.
Indicators for flood hazard map: (A) historical rainfall distribution from the NCDC dataset, (B) projected rainfall pattern for short-, mid- and long-term future under RCP 4.5 and RCP8.5 scenarios, (C) slope map, (D) elevation map, (E) drainage density and distance to the main channel, and (F) soil map.

Figure 9.
Multisource flood hazard maps classified into very low, low, medium, high, and very high categories. (A) Current scenario, and (B) Projected scenarios (2030, 2060, and 2100).
Figure 9.
Multisource flood hazard maps classified into very low, low, medium, high, and very high categories. (A) Current scenario, and (B) Projected scenarios (2030, 2060, and 2100).

Figure 10.
Rainfall patterns according to the classification from very low, low, medium, high, and very high categories for the observed data (1990–2015) and area-averaged projected rainfall (2020–2030, 2050–2060, and 2090–2100) from GFDL-ESM2M model under RCPs 4.5 and 8.5.
Figure 10.
Rainfall patterns according to the classification from very low, low, medium, high, and very high categories for the observed data (1990–2015) and area-averaged projected rainfall (2020–2030, 2050–2060, and 2090–2100) from GFDL-ESM2M model under RCPs 4.5 and 8.5.

Figure 11.
Flood risk maps: (A) current scenario, (B) short-term period (2020–2030), (C) medium-term (2050–2060) period, and (D) long-term (2090–2100) period. The flood risk maps under RCP4.5 and RCP8.5 scenarios are identical.
Figure 11.
Flood risk maps: (A) current scenario, (B) short-term period (2020–2030), (C) medium-term (2050–2060) period, and (D) long-term (2090–2100) period. The flood risk maps under RCP4.5 and RCP8.5 scenarios are identical.

Figure 12.
Flood risk assessment result in percentage in current, short-term (2020–2030), medium-term (2050–2060), and long-term (2090–2100) periods. The results under RCP4.5 and RCP8.5 are identical.
Figure 12.
Flood risk assessment result in percentage in current, short-term (2020–2030), medium-term (2050–2060), and long-term (2090–2100) periods. The results under RCP4.5 and RCP8.5 are identical.

Table 1.
Summary of the dataset used in this study; rainfall, climate change data, DEM, administrative map, soil type, population, and socioeconomic data.
Table 1.
Summary of the dataset used in this study; rainfall, climate change data, DEM, administrative map, soil type, population, and socioeconomic data.
| Data | Location/Station | Description | Duration/Year | Source | Data Format |
|---|---|---|---|---|---|
| Rainfall records | DOST-RXI Station | Daily observed rainfall at an elevation of 17.29 m | 2006–2015 | Philippine Atmospheric Geophysical and Astronomical Services Administration (PAGASA) | Spreadsheet file |
| Hinatuan Station | Daily observed rainfall at an elevation of 3 m | 1973–2015 | National Center for Environmental Information (www.ncdc.noaa.gov) | Text file | |
| NCDC dataset | Global daily precipitation with a spatial coverage of 0.5° lat. & 0.5° long. | 1979–2016 | National Climatic Data Center (ftp://ftp.cpc.ncep.noaa.gov/precip/CPC_UNI_PRCP/) | NetCDF | |
| GPCC dataset | Global daily land surface precipitation with a spatial resolution of 1° lat. & 1° long. | 1988–2013 | Global Precipitation Climatology Centre (http://gpcc.dwd.de) | NetCDF | |
| Rainfall and temperature projections | CMIP5 dataset | Multimodel daily rainfall and temperature predictions | 2006–2100 | Climate Variability and Predictability Project (http://clivar.ouce.ox.ac.uk/cmip5) | Text File |
| DEM | Davao Oriental | ASTER GDEM V2 with a spatial resolution of 30 m | 2011 |
| GeoTIFF |
| Administration map | Davao Oriental | Provincial, municipal and barangay boundaries. | 2015 |
| Shapefile |
| Soil Map | Davao Oriental | Soil types | 2007 | Philippine GIS Organization (www.philgis.org) | Shapefile |
| Population and Socioeconomic data | Davao Oriental | Census of Population and Housing | 2010 and 2015 | Philippine Statistics Authority (http://psa.gov.ph/) | Book and spreadsheet file |
Table 2.
Census of Population and Housing by municipality/city [13].
Table 2.
Census of Population and Housing by municipality/city [13].
| Municipality | District | Population | Area (km2) | Density (/km2) | No. of Brgy. | |||
|---|---|---|---|---|---|---|---|---|
| Ratio (%) | 2010 | 2015 | Annual Growth Rate (%) | |||||
| Baganga | 1st | 10.1 | 53,426 | 56,241 | 0.98 | 945.50 | 59 | 18 |
| Banaybanay | 2nd | 7.4 | 39,121 | 41,117 | 0.95 | 408.52 | 100 | 14 |
| Boston | 1st | 2.4 | 12,670 | 13,535 | 1.27 | 357.03 | 38 | 8 |
| Caraga | 1st | 7.2 | 36,912 | 40,379 | 1.72 | 642.70 | 63 | 17 |
| Cateel | 1st | 7.3 | 38,579 | 40,704 | 1.03 | 545.56 | 75 | 16 |
| Gov. Gen. | 2nd | 9.9 | 50,372 | 55,109 | 1.73 | 365.75 | 150 | 20 |
| Lupon | 2nd | 11.8 | 61,723 | 65,785 | 1.22 | 886.39 | 74 | 21 |
| Manay | 1st | 7.6 | 40,577 | 42,690 | 0.97 | 418.36 | 100 | 17 |
| Mati City | 2nd | 25.3 | 126,143 | 141,141 | 2.16 | 588.63 | 240 | 26 |
| San Isidro | 2nd | 6.4 | 32,424 | 36,032 | 2.03 | 220.44 | 160 | 16 |
| Tarragona | 1st | 4.7 | 25,671 | 26,225 | 0.41 | 300.76 | 87 | 10 |
| Total | 517,618 | 558,958 | 1.47 | 5679.64 | 98 | 183 | ||
Table 3.
Saaty Scale of relative importance and its description.
| Scale | Judgement of Preference | Description |
|---|---|---|
| 1 | Equal importance | Two factors contribute equally to the objective |
| 3 | Moderate | Experience and judgement slightly favor one over the other |
| 5 | Strong | Experience and judgement strongly favor one over the other |
| 7 | Very strong | Experience and judgement very strongly favor one over the other |
| 9 | Extreme importance | The evidence favoring one over other is of the highest possible validity |
| 2, 4, 6, 8 | Intermediate values | When compromise is needed |
Table 4.
Pairwise comparison matrix used in this study.
| Indicators | R | Sl | E | Dc | Dd | St |
|---|---|---|---|---|---|---|
| Rainfall (R) | 1 | 2 | 4 | 5 | 6 | 7 |
| Slope (Sl) | 1/2 | 1 | 2 | 3 | 4 | 5 |
| Elevation (E) | 1/4 | 1/2 | 1 | 2 | 3 | 4 |
| Distance to main channel (Dc) | 1/5 | 1/3 | 1/2 | 1 | 2 | 3 |
| Drainage (Dd) | 1/6 | 1/4 | 1/3 | 1/2 | 1 | 2 |
| Soil type (St) | 1/7 | 1/5 | 1/4 | 1/3 | 1/2 | 1 |
| Sum | 2.26 | 4.28 | 8.08 | 11.83 | 16.50 | 22.00 |
Table 5.
Matrix normalization with criteria weights (priority vector) and consistency measure (CM).
| Indicators | R | Sl | E | Dc | Dd | St | Total | PV | CM |
|---|---|---|---|---|---|---|---|---|---|
| Rainfall (R) | 0.44 | 0.47 | 0.49 | 0.42 | 0.36 | 0.32 | 2.61 | 0.418 | 6.24 |
| Slope (Sl) | 0.22 | 0.23 | 0.25 | 0.25 | 0.24 | 0.23 | 1.48 | 0.238 | 6.21 |
| Elevation (E) | 0.11 | 0.12 | 0.12 | 0.17 | 0.18 | 0.18 | 0.91 | 0.147 | 6.16 |
| Distance to main channel (Dc) | 0.09 | 0.08 | 0.06 | 0.08 | 0.12 | 0.14 | 0.58 | 0.095 | 6.06 |
| Drainage (Dd) | 0.07 | 0.06 | 0.04 | 0.04 | 0.06 | 0.09 | 0.37 | 0.061 | 6.02 |
| Soil type (St) | 0.06 | 0.05 | 0.03 | 0.03 | 0.03 | 0.05 | 0.25 | 0.041 | 6.06 |
| Sum | 1.00 | 1.00 | 1.00 | 1.00 | 1.00 | 1.00 | - | 1.000 | - |
Table 6.
Random index matrix and its corresponding number of criteria compared.
| Number of Criteria | 2 | 3 | 4 | 5 | 6 | 7 | 8 | 9 | 10 | 11 |
|---|---|---|---|---|---|---|---|---|---|---|
| RI | 0.00 | 0.58 | 0.90 | 1.12 | 1.24 | 1.32 | 1.41 | 1.45 | 1.49 | 1.51 |
Table 7.
Flood risk classification in each municipality (%).
| Municipality | Current Scenario | Short-Term (2020–2030) | ||||||||
| VL | L | M | H | VH | VL | L | M | H | VH | |
| Boston | - | 19.0 | 78.0 | 3.0 | - | - | 22.5 | 74.6 | 3.0 | - |
| Cateel | - | 57.5 | 30.8 | 11.1 | 0.6 | 0.6 | 64.6 | 26.3 | 8.1 | 0.4 |
| Baganga | - | 67.0 | 31.6 | 1.3 | - | 1.2 | 89.7 | 8.8 | 0.2 | - |
| Caraga | 2.4 | 83.6 | 13.5 | 0.5 | - | 3.2 | 82.3 | 14.0 | 0.5 | - |
| Manay | 1.2 | 85.1 | 11.1 | 2.6 | - | 1.2 | 76.7 | 19.5 | 2.6 | - |
| Tarragona | 4.2 | 74.2 | 21.6 | - | - | 4.2 | 73.6 | 22.3 | - | - |
| Mati | 0.1 | 68.4 | 29.1 | 2.3 | - | 0.01 | 64.0 | 33.6 | 2.4 | - |
| Lupon | 5.4 | 60.4 | 28.2 | 6.0 | - | 5.4 | 57.6 | 26.3 | 10.8 | - |
| Banaybanay | 8.2 | 74.4 | 17.1 | 0.3 | - | 8.1 | 72.3 | 14.7 | 4.9 | - |
| San Isidro | 0.5 | 65.1 | 31.9 | 2.6 | - | - | 55.6 | 37.5 | 6.9 | - |
| Governor Generoso | - | 63.0 | 34.8 | 2.3 | - | - | 40.6 | 55.8 | 3.1 | 0.5 |
| Municipality | Medium-Term (2050–2060) | Long-Term (2090–2100) | ||||||||
| VL | L | M | H | VH | VL | L | M | H | VH | |
| Boston | - | 23.9 | 73.6 | 2.4 | - | - | 24.0 | 76.0 | 0.04 | - |
| Cateel | 0.6 | 73.4 | 18.7 | 6.9 | 0.4 | 0.6 | 64.6 | 28.6 | 5.8 | 0.4 |
| Baganga | 1.2 | 90.5 | 8.0 | 0.2 | - | 1.2 | 90.5 | 8.1 | 0.2 | - |
| Caraga | 5.4 | 85.3 | 9.3 | 0.1 | - | 5.4 | 86.2 | 8.3 | 0.1 | - |
| Manay | 1.2 | 87.2 | 9.2 | 2.4 | - | 1.2 | 89.3 | 7.1 | 2.4 | - |
| Tarragona | 4.2 | 78.4 | 17.4 | - | - | 4.2 | 78.4 | 17.4 | - | - |
| Mati | 0.01 | 75.7 | 22.2 | 2.1 | - | 0.01 | 75.4 | 22.1 | 2.4 | - |
| Lupon | 5.4 | 64.4 | 19.5 | 10.7 | - | 5.4 | 65.0 | 21.7 | 7.9 | - |
| Banaybanay | 8.1 | 75.3 | 12.6 | 4.0 | - | 8.1 | 75.3 | 15.0 | 1.6 | - |
| San Isidro | - | 59.1 | 34.0 | 6.9 | - | - | 68.7 | 26.0 | 5.2 | - |
| Governor Generoso | - | 47.7 | 48.7 | 3.1 | 0.5 | - | 55.7 | 41.1 | 2.7 | 0.5 |
Table 8.
Summary of the number of barangays with high (H) and very high (VH) risk.
| Municipality | Number of Barangays | ||
|---|---|---|---|
| Current Scenario | Short Term | Medium/Long Term | |
| Boston | H (2) | H (2) | - |
| Cateel | VH (1), H (7) | VH (1), H (6) | VH (1), H (6) |
| Baganga | H (1) | H (2) | H (2) |
| Caraga | H (3) | H (2) | H (1) |
| Manay | H (2) | H (2) | H (2) |
| Mati | H (3) | H (3) | H (3) |
| Lupon | H (4) | H (7) | H (4) |
| Banaybanay | H (1) | H (7) | H (4) |
| San Isidro | H (1) | H (4) | H (3) |
| Governor Generoso | H (3) | H (3), VH (1) | H (4), VH (1) |
| Total | H = 27, VH = 1 | H = 38, VH = 2 | H = 29, VH = 2 |
© 2018 by the authors. Licensee MDPI, Basel, Switzerland. This article is an open access article distributed under the terms and conditions of the Creative Commons Attribution (CC BY) license (http://creativecommons.org/licenses/by/4.0/).
Share and Cite
MDPI and ACS Style
Cabrera, J.S.; Lee, H.S. Impacts of Climate Change on Flood-Prone Areas in Davao Oriental, Philippines. Water 2018, 10, 893. https://doi.org/10.3390/w10070893
AMA Style
Cabrera JS, Lee HS. Impacts of Climate Change on Flood-Prone Areas in Davao Oriental, Philippines. Water. 2018; 10(7):893. https://doi.org/10.3390/w10070893
Chicago/Turabian StyleCabrera, Jonathan Salar, and Han Soo Lee. 2018. "Impacts of Climate Change on Flood-Prone Areas in Davao Oriental, Philippines" Water 10, no. 7: 893. https://doi.org/10.3390/w10070893
Note that from the first issue of 2016, this journal uses article numbers instead of page numbers. See further details here.