Changes and Driving Forces of the Water-Sediment Relationship in the Middle Reaches of the Hanjiang River

1
Institute of Geodesy and Geophysics, Chinese Academy of Sciences, Wuhan 430077, China
2
University of Chinese Academy of Sciences, Beijing 100049, China
3
Key Laboratory for Environment and Disaster Monitoring and Evaluation, Wuhan 430077, China
4
State Key Joint Laboratory of Environment Simulation and Pollution Control, School of Environment, Beijing Normal University, Beijing 100875, China
*
Author to whom correspondence should be addressed.
Water 2018, 10(7), 887; https://doi.org/10.3390/w10070887
Submission received: 2 May 2018
/
Revised: 20 June 2018
/
Accepted: 29 June 2018
/
Published: 3 July 2018
(This article belongs to the Special Issue Watershed Hydrology, Erosion and Sediment Transport Processes
)
Abstract
:Riverine sediment transport plays an important role in the global geochemical cycle. With a growing interest in global riverine environmental changes, a better understanding of water-sediment relationship dynamics and their driving forces is crucial for basin management, which is particularly associated with cascade dam construction. In this contribution, a simple and effective sediment load reduction factor analysis is used to attribute the changes in river sediment load to different drivers. The Mann–Kendall (MK) trend test and the double-mass curve (DMC) method were combined to reveal the trends and causes of change in the water-sediment relationship from 1965 to 2015 in the middle reaches of the Hanjiang River. We found that sediment load trend decreased significantly, which was caused by a decrease in water yield (5.05%), and the relative contributions of precipitation decrease (1.66%). Furthermore, only one mutation could be identified in 1974 at Huangzhuang station. Evapotranspiration and vegetation coverage had slight decreasing effects on sediment load. The impact of human activities on the water-sediment relationship has intensified over the past 15 years. We therefore propose the establishment of an integrated basin-wide ecosystem and optimized reservoir operation rule for sustainable water use and sediment regulation.
1. Introduction
Rivers are basic transporting elements of fluvial sediments to the coastline; every significant alteration within a watershed will eventually affect the coastal sediment budget, leading to morphological alterations in the coastal field [1,2]. Changes in the water-sediment relationship can have important impacts on aquatic ecology, river channel evolution, nutrient fluxes, and river mouth morphodynamics, which link the geomorphological processes of the upper and lower reaches of a basin [3,4]. Changes of the critical shear stress influenced by both river channel scouring and bank erosion can further affect the water discharge and sediment transport, which will disturb river bottom topography, river bank morphology, river and lake linkages, delta area, and nutrient import [5,6]. Many previous studies have investigated the potential effects of sediment delivery by rivers on shoreline variation in relation to climate change and human interference [7,8,9]. Within a specific river basin [10], dynamic changes in the water-sediment relationship can be assessed to reflect the basin’s functions and services [11]. Exploring the causes of changes in the water-sediment relationship is crucial for studying biogeochemical cycles, soil degradation, water quality, agricultural sustainability, and stability in coastal areas [12,13]. Many studies have been carried out to analyse trends in variability or shifts in river sediments over time [14]. Examples include the Colorado River [15] in the United States; the Nile River [16] in Africa; the Ebro, Po, and Rhone Rivers [17,18] in Europe; the Mekong River [19] in Asia; and the Yangtze River [20,21,22] and Yellow River [23,24] in China. In general, the majority of previous studies focused on the dynamic trend of streamflow and sediment load; however, a more detailed study on the water-sediment relationship and its driving forces has rarely been attempted, especially with the quantitative assessment of the contribution of driving factors.
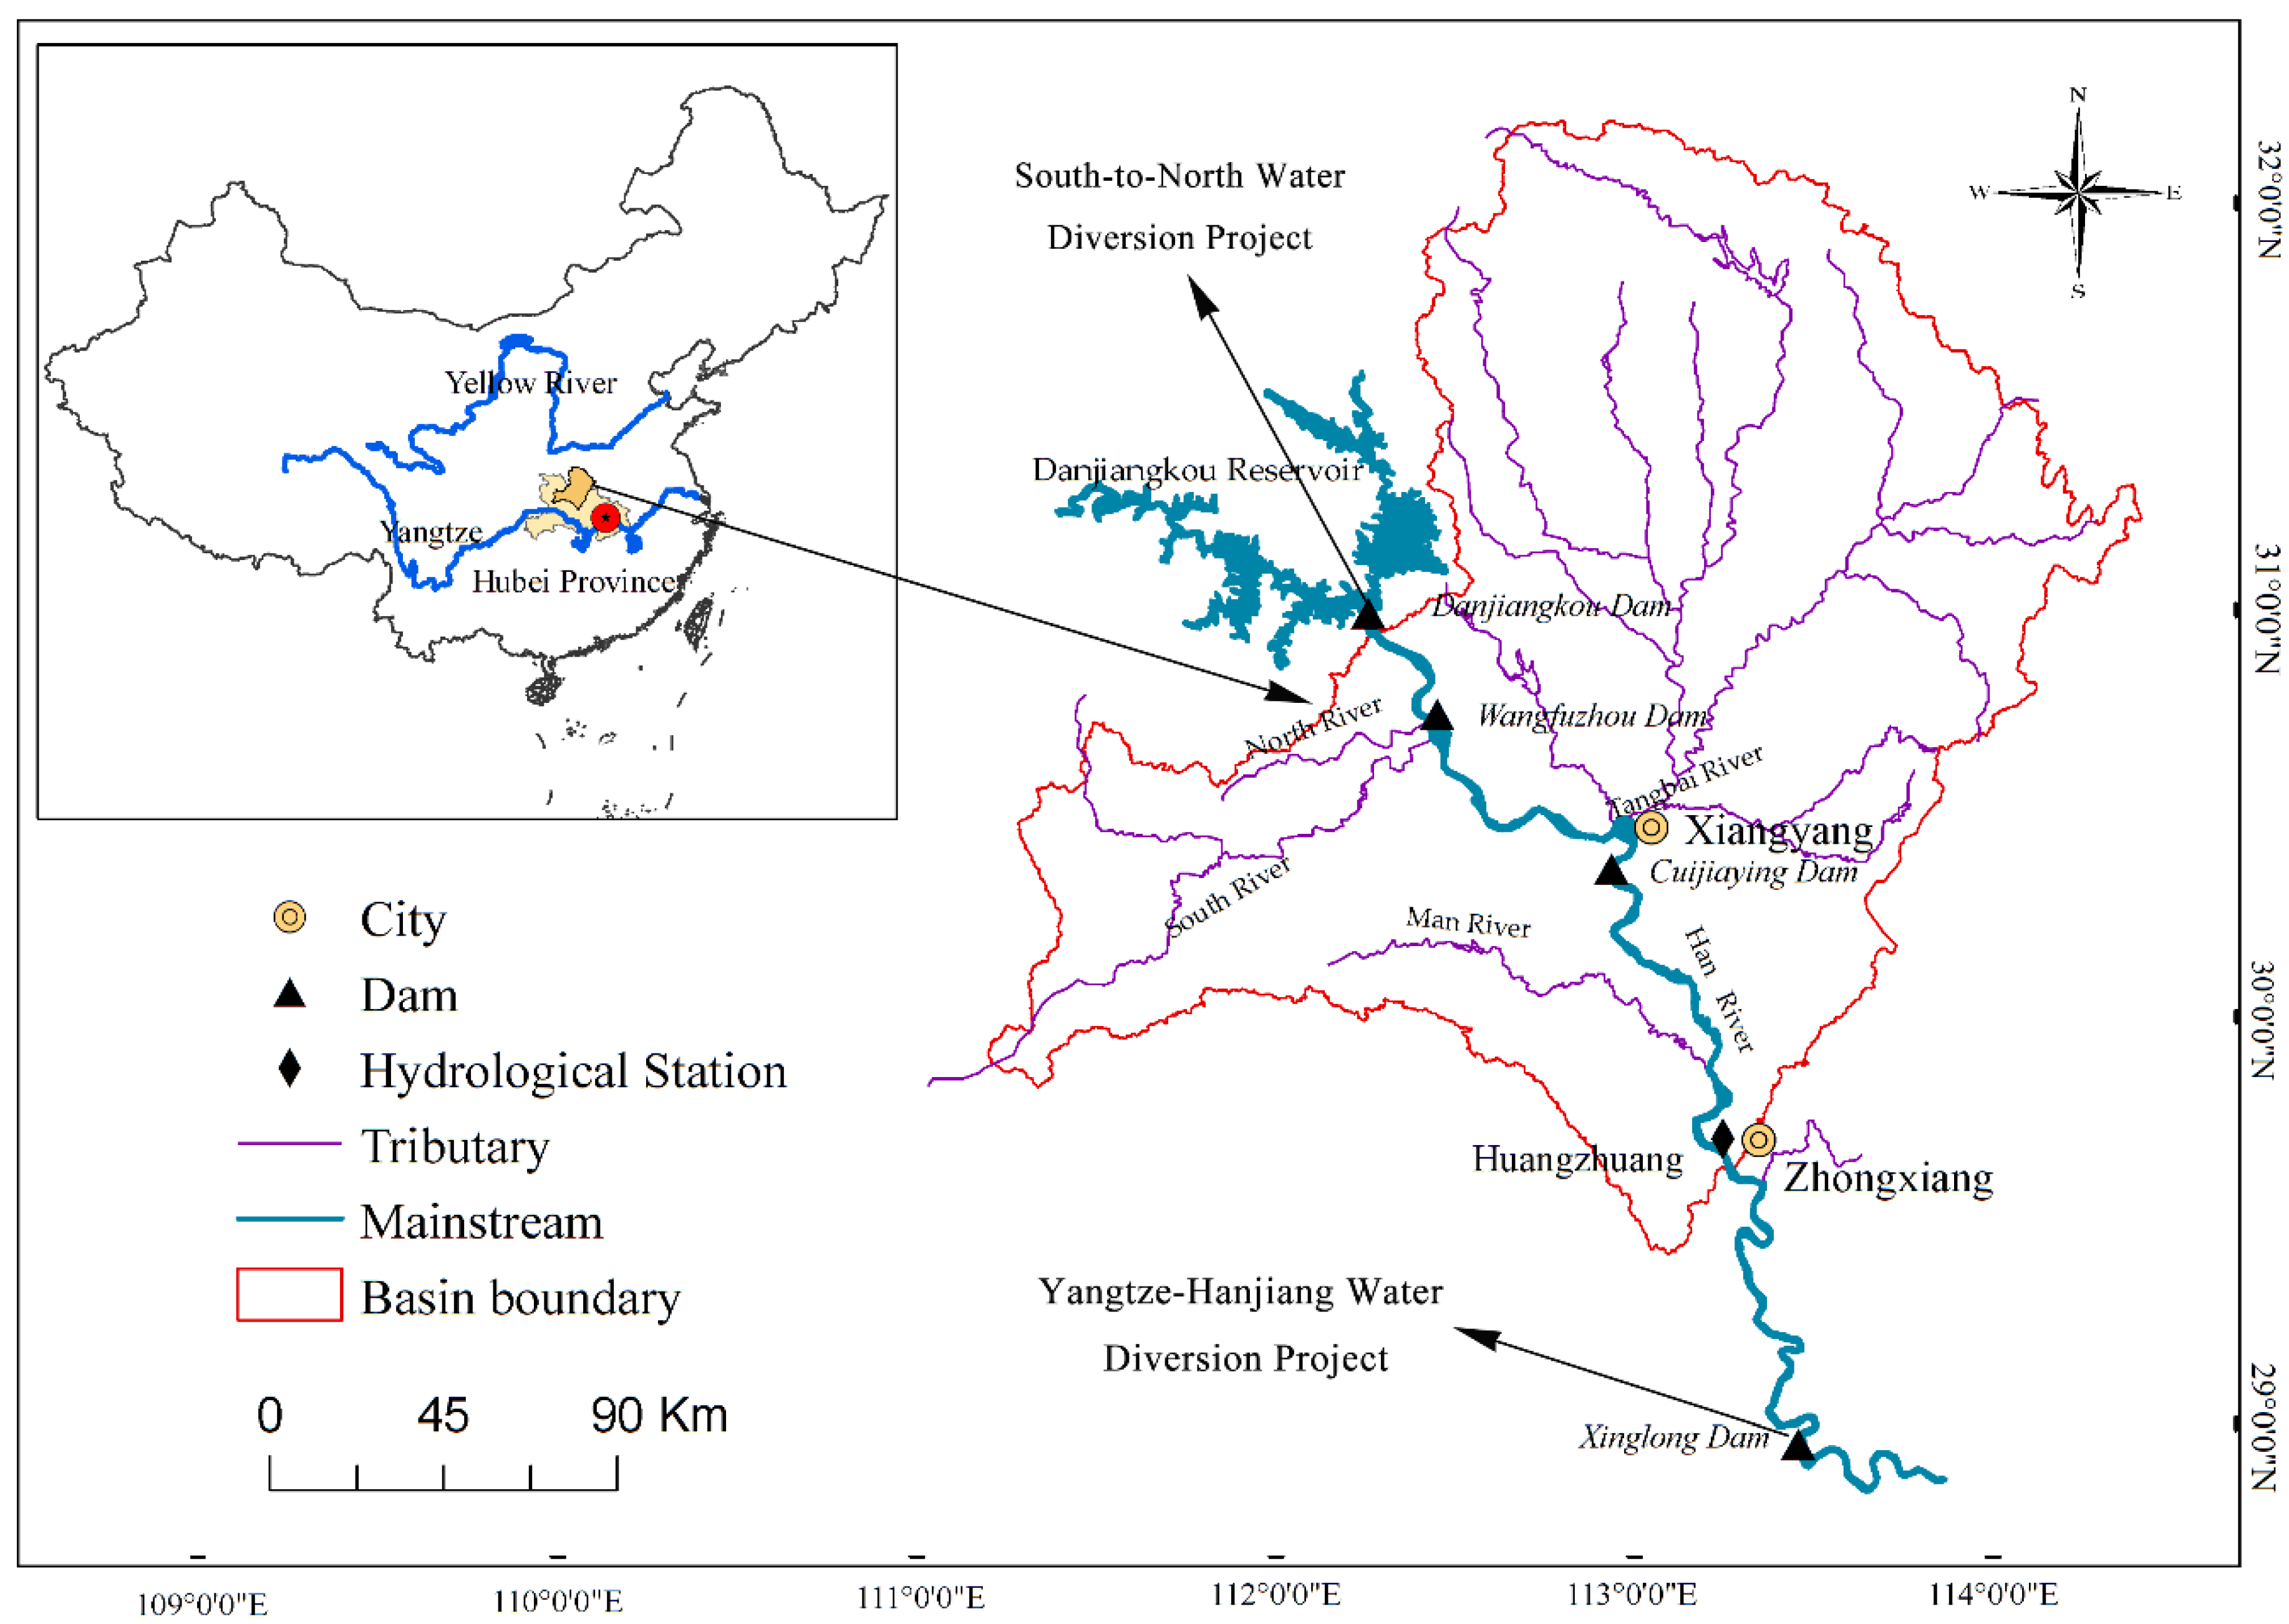
The Hanjiang River is the longest tributary of the Yangtze River, which plays a crucial role in balancing the water-sediment relationship of the Yangtze by collecting run-off from precipitation and transporting it to the ocean, along with sediment [25,26]. There are many concerns about the environmental consequences of the South-to-North Water Diversion Project (SNWDP) in China [27]. With the middle route of SNWDP, 9.5 × 10⁹ m3 water will be extracted every year from the Danjiangkou Reservoir starting in 2010, when the first phase of the project was finished, and 13 × 109 m3 water will be extracted every year from 2030 onwards when the second phase is finished, amounting to 27% and 37% of the respective current annual release from the reservoir downstream. Several projects have been proposed to mitigate the negative effects of the SNWDP on the Han River, including the Yangtze-Hanjiang Water Diversion Project, the Xinglong Water Conservancy Project, and the Wangfuzhou and Cuijiaying Reservoir [28]. However, the water diversion projects will inevitably alter hydrological processes in the watershed ecosystems and mitigation projects will bring new problems. The reservoir construction and water diversion projects can alter the downstream water-sediment budget by affecting the quantity and duration of runoff. The variability of streamflow is closely related to efficient sediment transportation. More importantly, the dam intercepts upstream sediments and reduces sediment content in the downstream flow. The relationship between erosion and sedimentation also changes. Hydrological processes within the middle-lower reaches of the Hanjiang River have been significantly altered due to water diversions and cascade reservoirs, although flood-control standards have been improved, which ensure regional water security. Comparatively, the natural environment in the upper reaches of the Hanjiang River is less affected by human activities. In the lower reaches of the Hanjiang River, the Xinglong Water Conservancy Project has alleviated water resource issues. In contrast, however, environmental issues in the middle reaches of the Hanjiang River have recently attracted a lot of attention. Therefore, this study chose the middle reaches of the Hanjiang River as the study area.
Previous studies in the middle-lower reaches of Hanjiang River have focused on the aquatic environment [29], environmental risk assessments [30,31], simulation of reservoir operations [32], and the crop water footprint [33]. Although many studies have been carried out in the middle-lower reaches of the Hanjiang River, there is a lack of research on the trends and causes of changes in the water-sediment relationship, especially the quantitative assessment of the contributions of influencing factors, such as precipitation, water yield capacity, and sediment concentration. To better understand the water and sediment relationships in this part of the Hanjiang River, an evaluation of changes in the water-sediment relationship, a water-sediment factors identity approach, and an analysis of the driving forces are urgently needed. In this study, a simple and effective sediment load reduction factor analysis approach was used to diagnose the contributions of precipitation, water yield capacity (the ratio of river discharge to precipitation), and sediment concentrations to the relative rate of change in sediment load in the middle reaches of the Hanjiang River. In addition, a time series analysis and double-mass curve (DMC) method were combined to reveal the trends and causes of changes in the water-sediment relationship. We addressed the following research questions in this paper: (1) what is the trend of sediment load change in the middle reaches of the Hanjiang River; (2) how does the water-sediment relationship change, and what are the factors affecting the sediment change; (3) what sediment yield reduction is caused by streamflow reduction, precipitation, and sediment concentration; (4) what are the main causes of variability in the water-sediment relationship; and (5) how can anthropogenic activities and their contribution to a reduction of sediment load be quantified?
2. Study Area and Data
The Hanjiang River is the longest tributary of the Yangtze River; with a length of 1570 km, and its basin area covers 170,400 km2; it is located in a typical subtropical monsoon climate area where annual precipitation varies from 700 to 1100 mm [34]. The maximum average monthly flow during the wet period is 3365 m3/s in Shayang, while the minimum average monthly flow in the dry period is 369 m3/s in Huangjiagang [35]. The elevation gradually decreases from the upper to the lower reaches of the Hanjiang River basin. Danjiangkou Reservoir is situated in the Xichuan (Henan Province) and Danjiangkou Counties (Hubei Province), separating the Hanjiang River into the higher and the mid-lower reaches. Danjiangkou to Zhongxiang make up the middle reaches of Hanjiang River, which are located in the Hubei Province of central China. The location of the middle Hanjiang River is shown in Figure 1. The Danjiangkou Reservoir was completed in 1974, which became a principle water provider for China’s Central Line Project of South-to-North Water Diversion. The project diverts 14.14 billion cubic meters of water a year, on average. In addition, there are a number of dams already under construction that are known as the cascade dams project, for which the Wangfuzhou and Cuijiaying Reservoirs as well as the Xinglong Water Conservancy Project have already been completed. Information on the dams is provided in Table 1. The project improves flood-control standards for the middle-lower reaches of the Hanjiang River and ensures regional water security, especially for resolving Beijing’s domestic water problems [36,37]. However, reservoir construction and water diversions have tremendous impacts on watershed ecosystems, and the hydrological processes of the middle-lower reaches of the Hanjiang River have been dramatically altered and fragmented.
Annual and cumulative streamflow values were extracted from daily records at the hydrological station. Annual sediment concentrations and loads from 1965–2001 were obtained from the Yangtze River Water Resources Commission, and daily records from 2001–2015 were obtained from the Hanjiang Hydrological Yearbook. Annual and cumulative rainfall values in this paper were extracted from daily records at the meteorological station. The gross domestic product (GDP) data in Jinmen City from 1965 to 2015 were derived from the National Bureau of Statistics. A MODIS (moderate-resolution imaging spectroradiometer)-NDVI (normalized difference vegetation index) dataset was provided by the National Aeronautics and Space Administration (NASA) in Washington, DC, USA, and contains MOD13Q1 products over the North China Plain from 2000 to 2013, with a temporal resolution of 16 days and a spatial resolution of 250 m × 250 m. The MODIS Reprojection Tool (MRT) software was used to convert the dataset projection and combine the data; ArcGIS and the Environment for Visualizing Images(ENVI) software were used to process the NDVI data. Fractional vegetation coverage (FVC) was calculated using the MOD13Q1 products, and the maximum value composites method was used to obtain monthly and annual NDVI values based on the 16-day NDVI data series. Daily potential evapotranspiration was calculated using the Food and Agriculture Organization (FAO) Penman-Monteith method, based on the mean, maximum, and minimum air temperatures, relative humidity, vapor pressure, wind speed of 2 m, and bright sunshine hours obtained from meteorological data. Pearson correlation coefficients and linear regression in this paper were calculated using the Statistical Product and Service Solutions(SPSS). The raw data sources are shown in Table 2.
3. Methodology
3.1. Trend Analysis and Breakpoint Detection
The nonparametric Mann–Kendall’s test developed by H.B. Mann (1945) and M.G. Kendall (1990) is widely used to assess the significance of monotonic trends in hydro-meteorological time series [38,39]. This test has two advantages: (1) it can handle non-normal and censored data; and (2) it has a high asymptotic efficiency [40]. Due to its high efficiency, wide application range, and low data requirements, the Mann–Kendall (MK) trend test was employed in this study. Given the time series of X(x1, x2, …, xn), with its length n, the statistic S is defined as:
where sgn() is determined as follows:
where xi and xj are sequential data values. Assuming that the data are identically distributed, the mean of the data μx = 0, the MK test statistic Z is given by Equation (3):
where var(S) is the variance of S, at the given significance level α, if |Z| ≥ Z1−α/2, the original hypothesis is rejected [41,42]. That is, the null hypothesis is rejected at a significance level of 0.05 and 0.01 if |Z| ≥ 1.96 (or 2.33), respectively. In this study, a significance level of α = 0.05 was applied. If the calculated Z statistic is positive, the trend is increasing; otherwise, the statistic trend is decreasing. To avoid confusion, we used Zyear to represent the Z value calculated for each successive two year period, and the Z value of the entire study period was represented by Zall in the results and discussion section. Meanwhile, we adopted a simple linear regression analysis to confirm the trend results given by the Mann–Kendall test after comparison between linear fitting and nonlinear fitting.
When using the MK test to detect anomalies in the time series, the test statistic (UFi) is given as follows:
where xi is an independent and identically distributed random variable with a sample size of n. E(Si) and var(Si) are the mean and variance of the cumulative number S, respectively, which are explained by Equation (7):
where UBi is the statistic calculated for the reverse series by the above procedure, while UBi = −UFi, i = n, n − 1, …, 1, and UB = 0. There is a significant increasing trend if UFi > 0, while a significant decreasing trend is present if UFi < 0. The significance trend is tested when the curve exceeds the critical line |Z| = 1.96. When the statistic curves have intersections at confidence level α, the intersection point may be the start of a mutation.
3.2. Sediment Load Reduction Factors Analysis
The advantage of this sediment load reduction factors analysis approach is that it is simple and efficient. It can evaluate the role of each driver in the observed sediment load trends and clarify their relative contributions. In this paper, we used the simple sediment reduction factors analysis approach to evaluate the contribution of precipitation (P), water yield capacity (r, the ratio of river discharge to precipitation), and sediment concentration (s, the ratio of annual sediment mass flux to discharge) to the relative rate of sediment load change in the middle reaches of the Hanjiang River. River sediment load has been expressed as a product of three driving factors. The water-sediment factors identity approach combines average precipitation (P) and river flow (R) variables in a causal relationship with sediment load (S), so that S can be regarded as the integration of the three variables, which is described by the following equation [43,44]:
where S is sediment load; P is precipitation; R is stream flow; r is water yield capacity, which represents the water yield capacity of a catchment or region for a given precipitation level; and s is the sediment concentration (the ratio of annual sediment mass flux to flow). Then we defined the proportional rate of change of a quantity X(t) as c(X) = X−1dX/dt. Through Equation (9), the counterpart of the sediment load reduction factors analysis for proportional growth rates can be rewritten as Equation (10):
In this study, the above identity was applied to diagnose the role of each driver in the observed sediment load trend by using an extended precipitation time series (P), water yield capacity (r), and sediment concentration (s). The theoretical proportional change rate, which summed factors including P, r, and s, closely approximates the rate of S that was actually observed. The relative contribution of each identity factor is the ratio of its proportional change rate to the proportional change rate of S during the same period.
3.3. Double-Mass Curve Method
The double-mass curve (DMC) method is practical, visual, and simple, and has been widely used to test the consistency of hydrometeorological data and estimate the impacts of climate change and anthropogenic activities on ecological hydrology [45,46]. The theory of the double mass curve is based on the fact that a plot of the two cumulative quantities during the same period will have a straight line as long as the proportionality between the two remains unchanged; the slope of the line represents the proportionality. Both variables should have the same physical cause, or they would exhibit a clear causal relationship in the application of the DMC method [47]. Generally, if river flow has not been affected by human activities, the curve characteristics will be similar, because the runoff yield mechanisms are the same. This method can be used to smooth a time series and suppress random features to reveal primary trends over time [48]. Any change in the gradient of this line is likely attributed to changing human activities. In this study, double-mass curves for sediment and stream flow, as well as sediment load and precipitation, were plotted for three different periods (1965–1974, 1974–2000, and 2000–2015) in order to estimate the changes in the slope of the regression.
4. Results and Discussion
4.1. Trends in Water, Sediment Load, and Vegetation Coverage
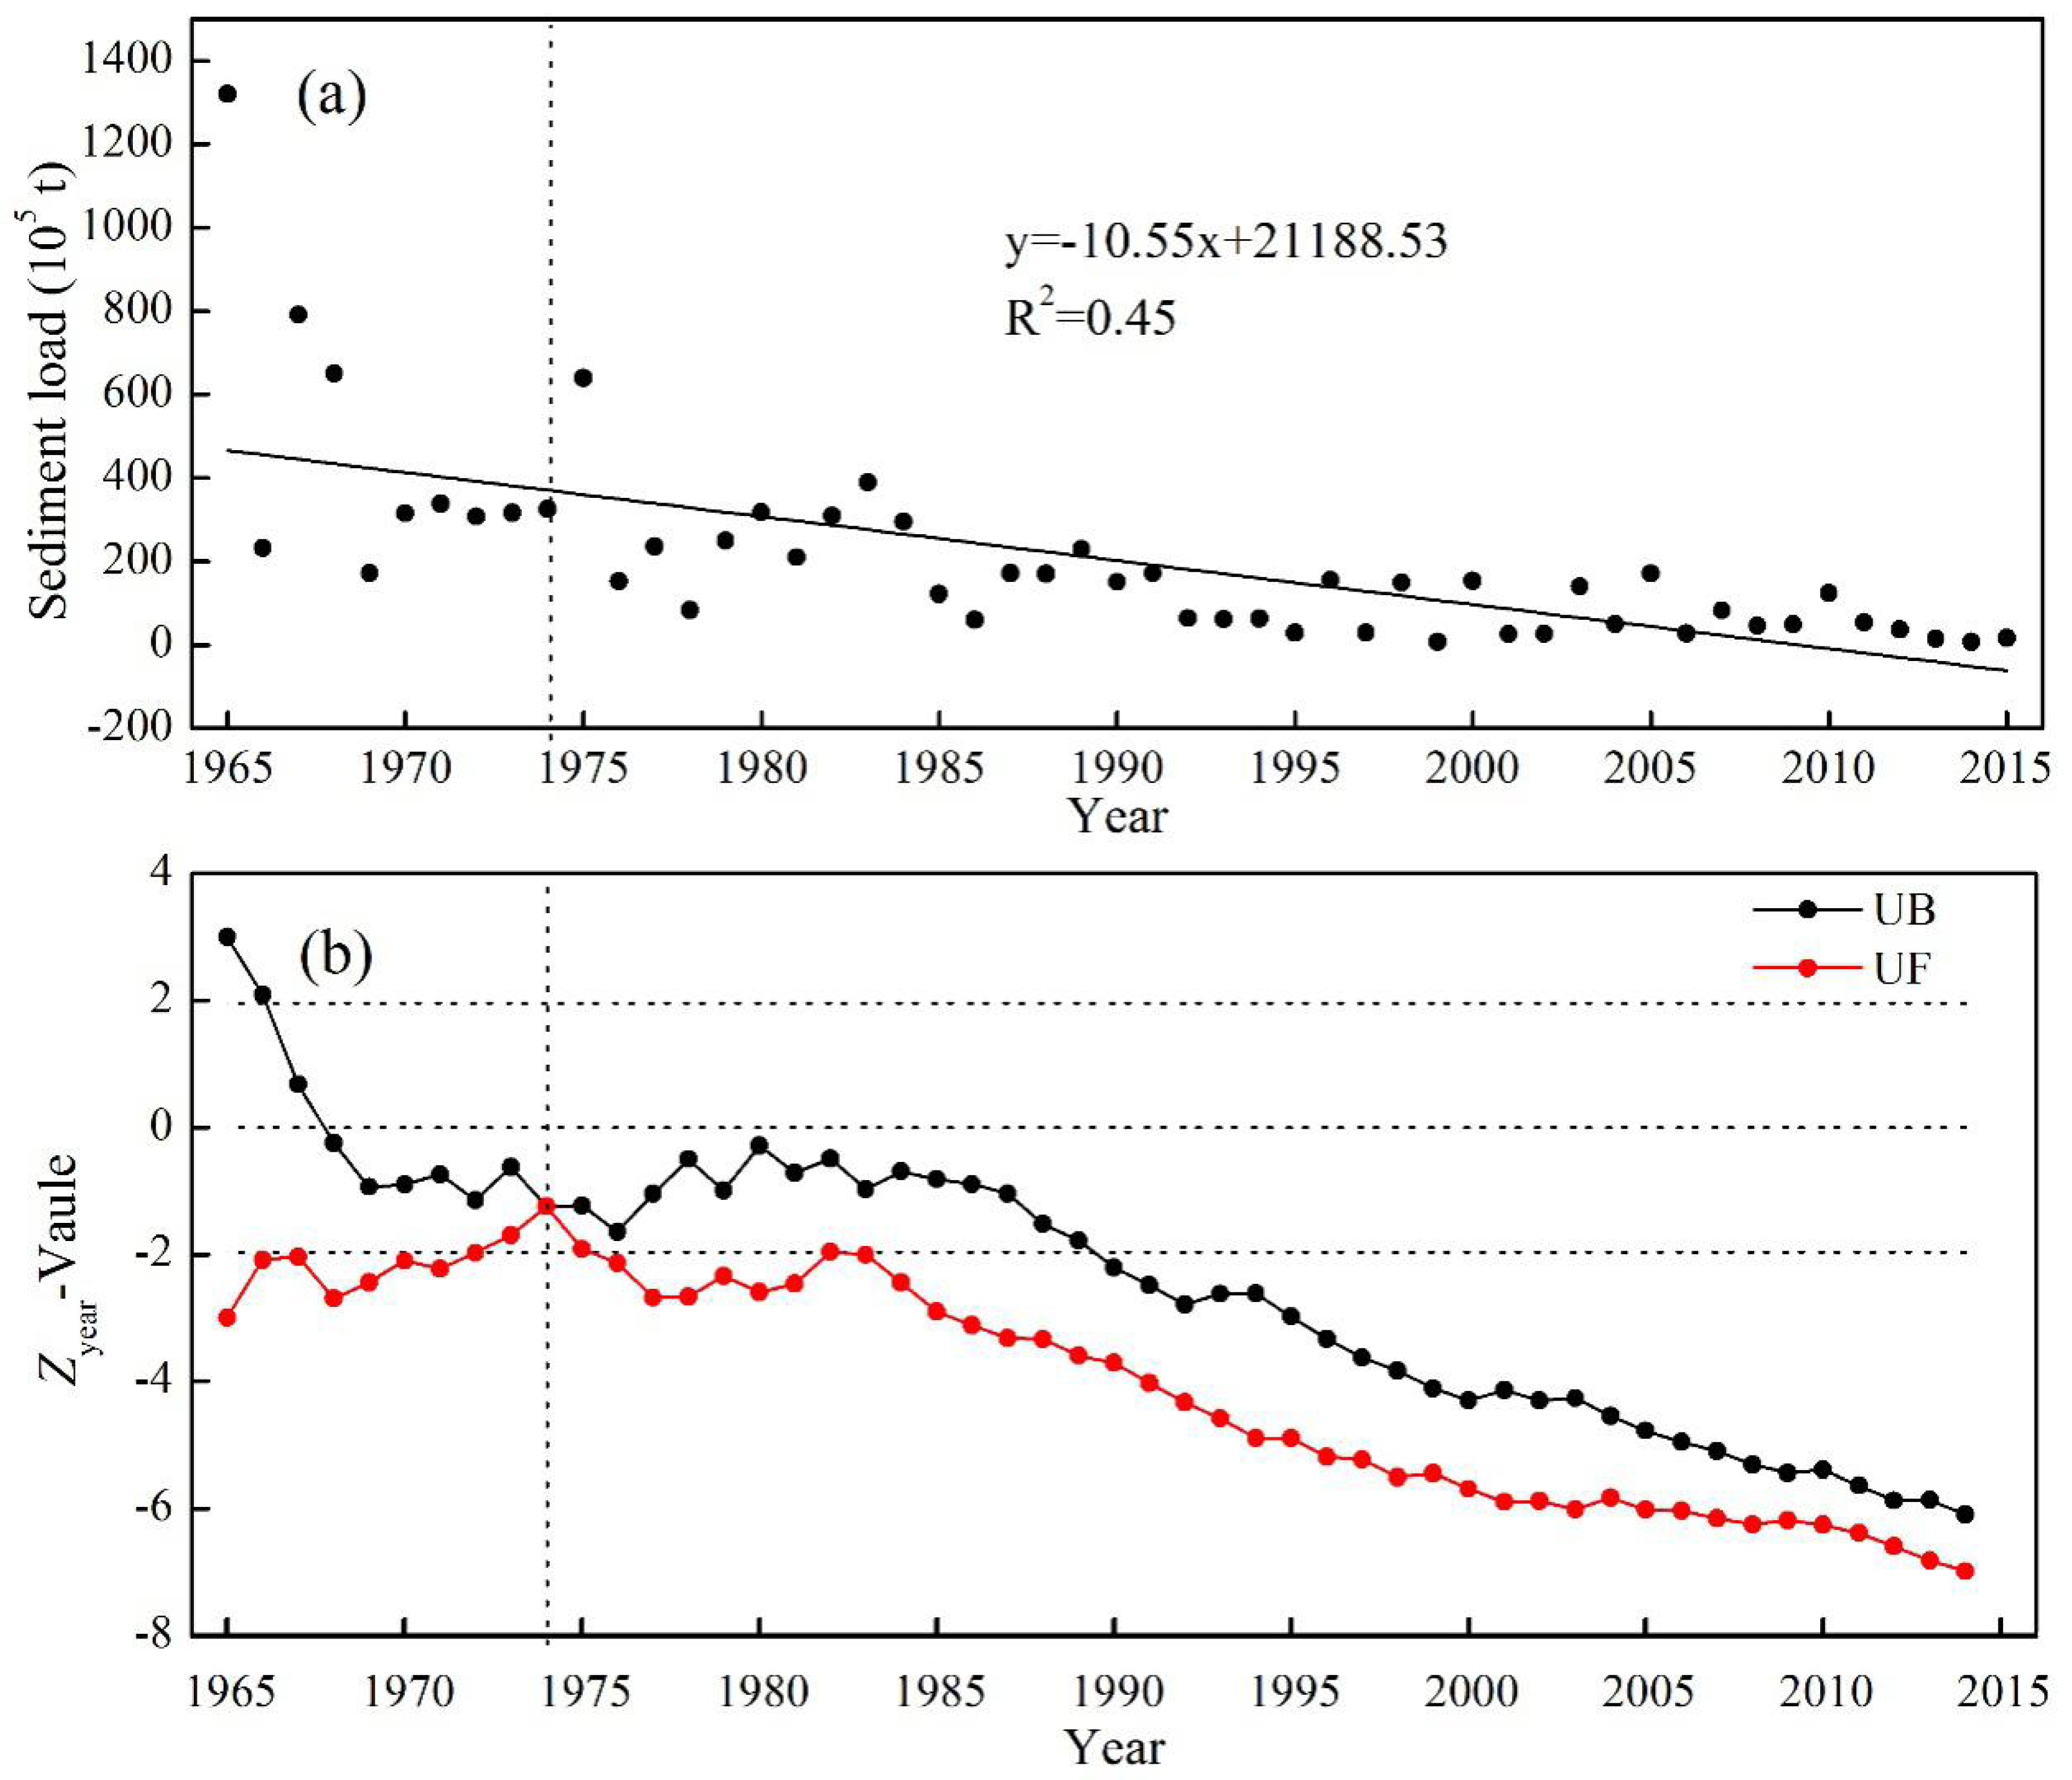
Figure 2a shows the trend of change and variability for annual sediment load at Huangzhuang station during 1965–2015. We found that there was a significant decrease in annual sediment load over the last five decades (−10.55 × 10⁶ kg/year, Z value of 6.09). The slope of the linear fit was −10.55 with an R2 value of 0.45. Only one intersection could be identified as a mutation in sediment load at the significance level of 0.05 at Huangzhuang station (Figure 2b). This decline was mainly caused by the construction of the Danjiangkou Reservoir in 1974, which has a storage capacity of 294.8 km3 and a high capacity for trapping sediment.
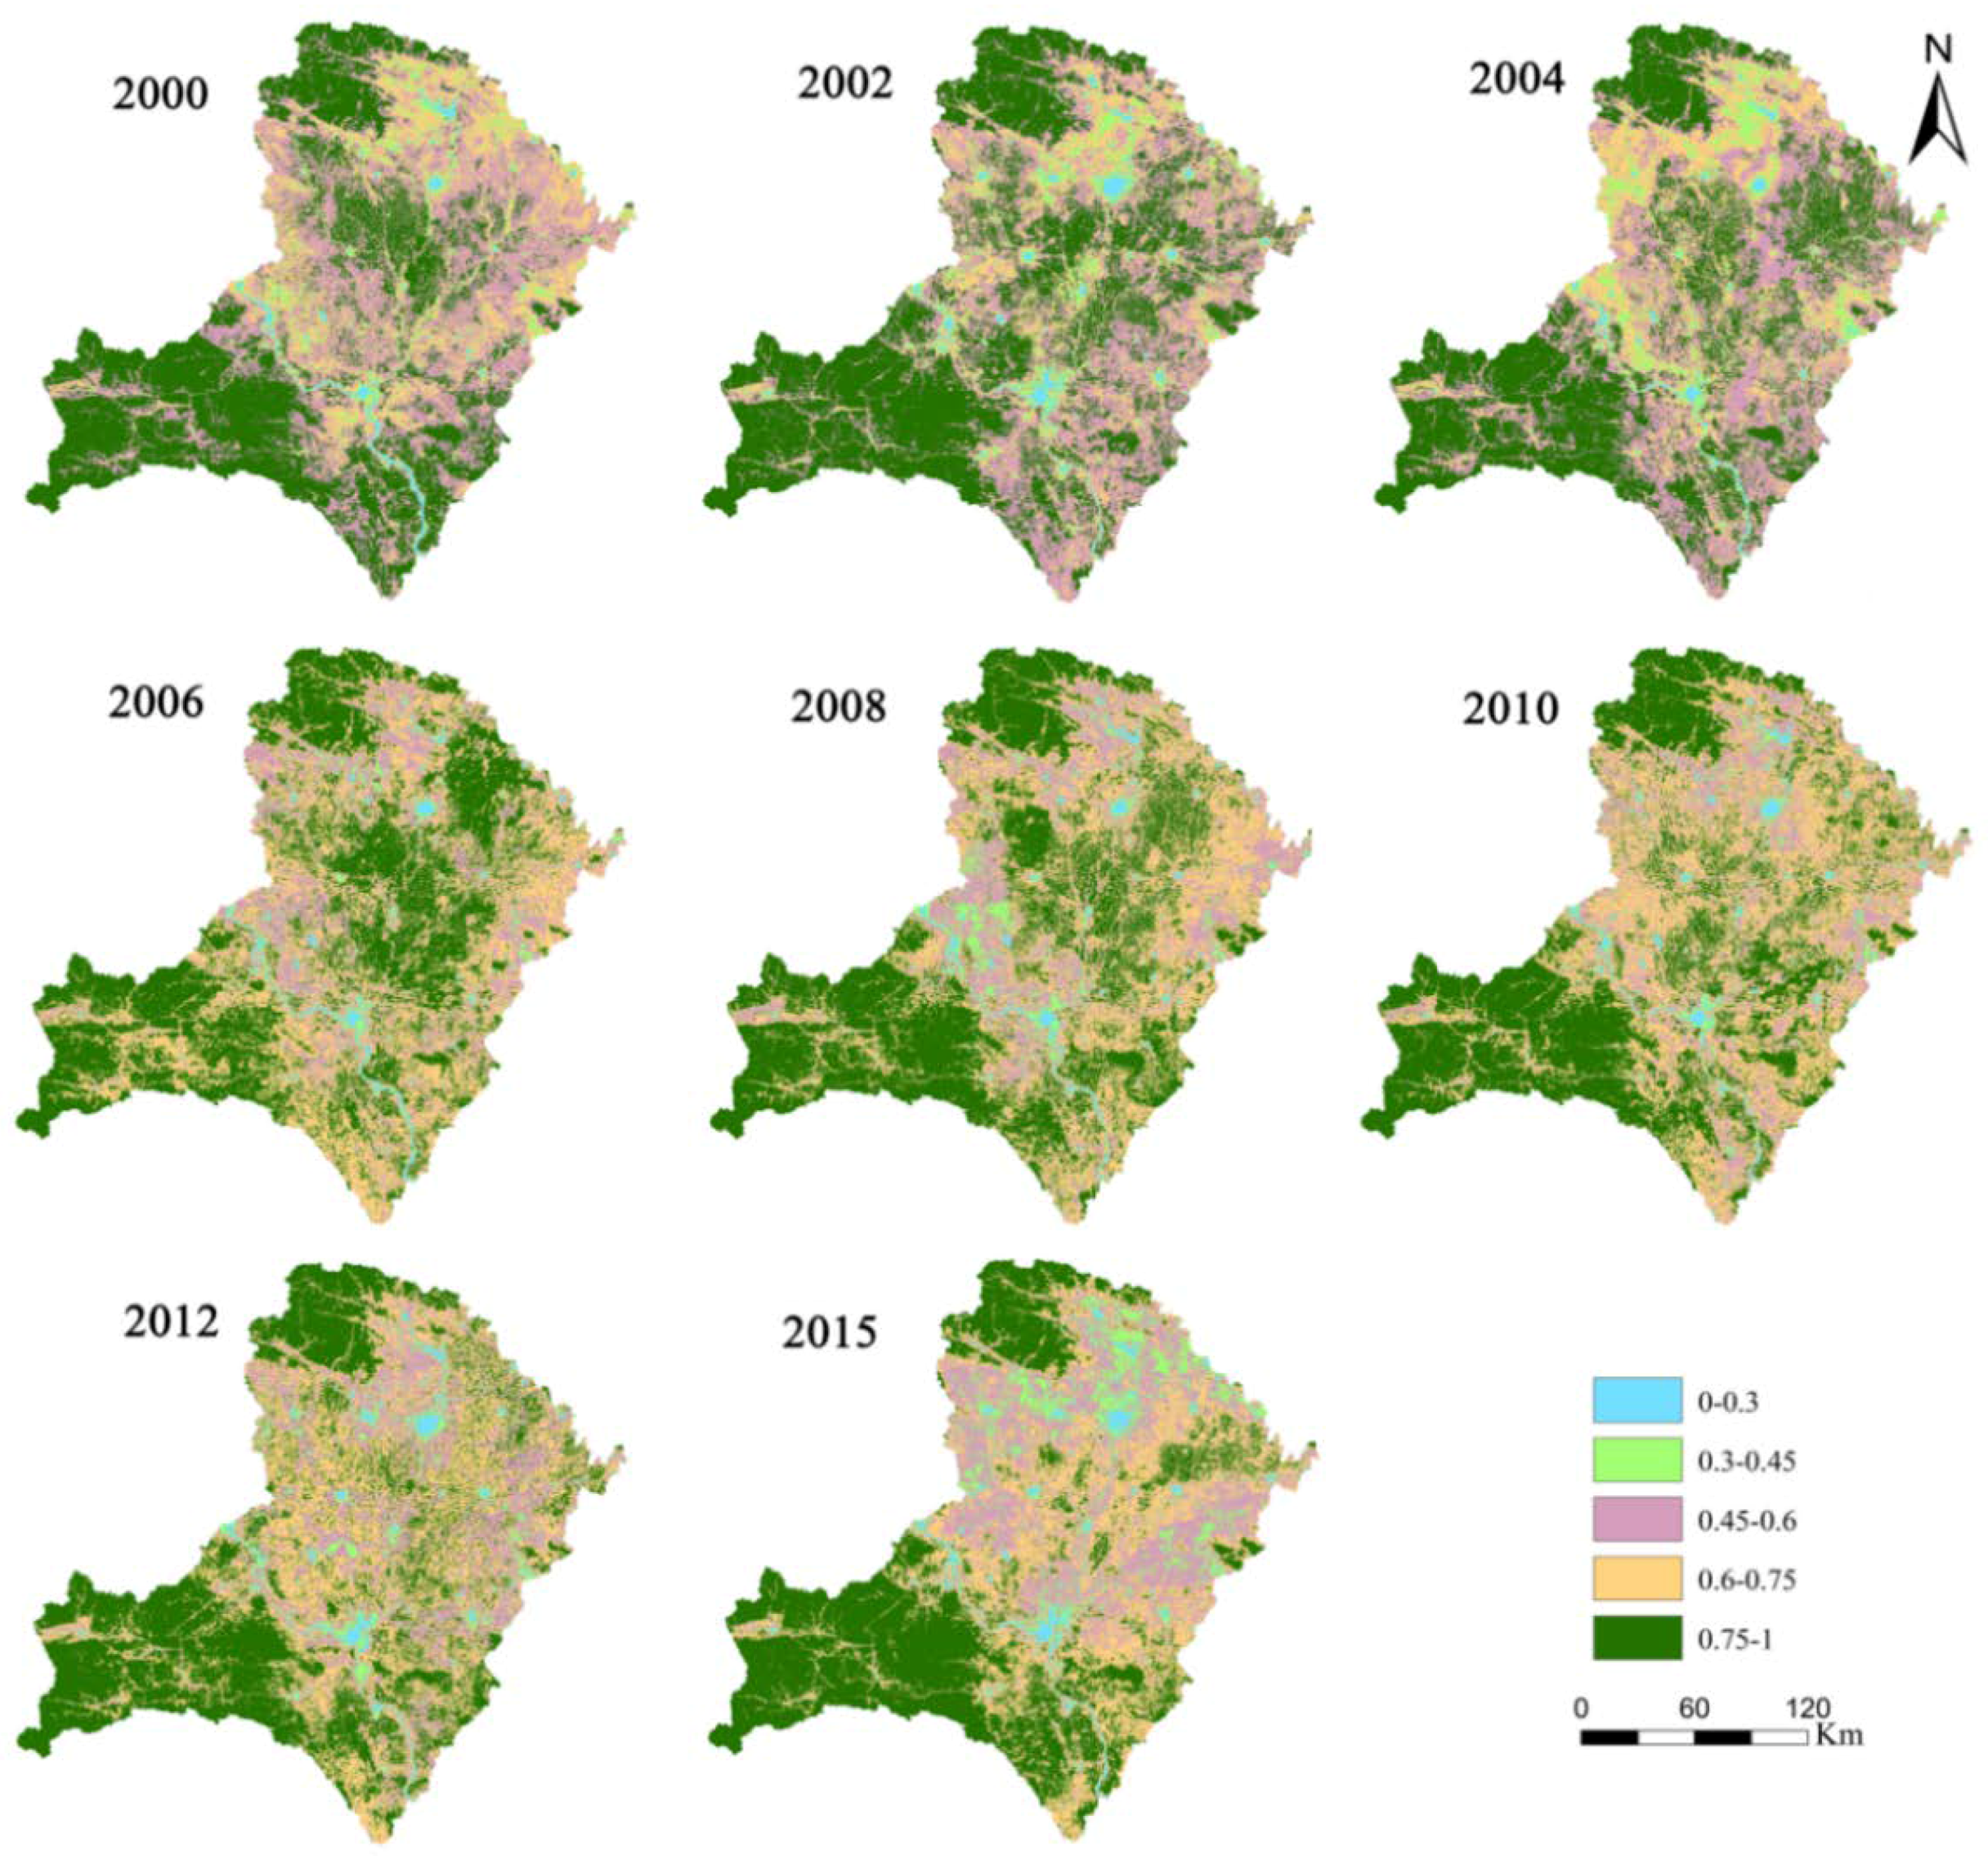
Table 3 shows the trends in precipitation and water discharge estimated by the MK test method for Huangzhuang station from 1965 to 2015. We found that water discharge decreased slightly over the study period (−0.23 × 10⁴ m3/year, with a Z value of 1.45 and a mean value of 50.8 × 10⁴ m3/year). In contrast, precipitation showed an insignificant trend at the 0.05 confidence level, with a Z value of −0.39. Potential evapotranspiration increased slightly at the 0.05 confidence level, with a Z value of 1.39. Finally, vegetation coverage decreased significantly between 2000 and 2015, with a slope of −0.67 and a mean value of 0.89. Figure 3 shows the vegetation coverage for the study area, classified into five categories. High vegetation coverage (75–100%) typically included mountainous areas with almost no human interference. Urban and large water bodies had relatively sparse or no vegetation. The low and medium vegetation coverage areas were mainly distributed in the agriculture and animal husbandry mixed zone.
4.2. Variability of the Water-Sediment Relationship
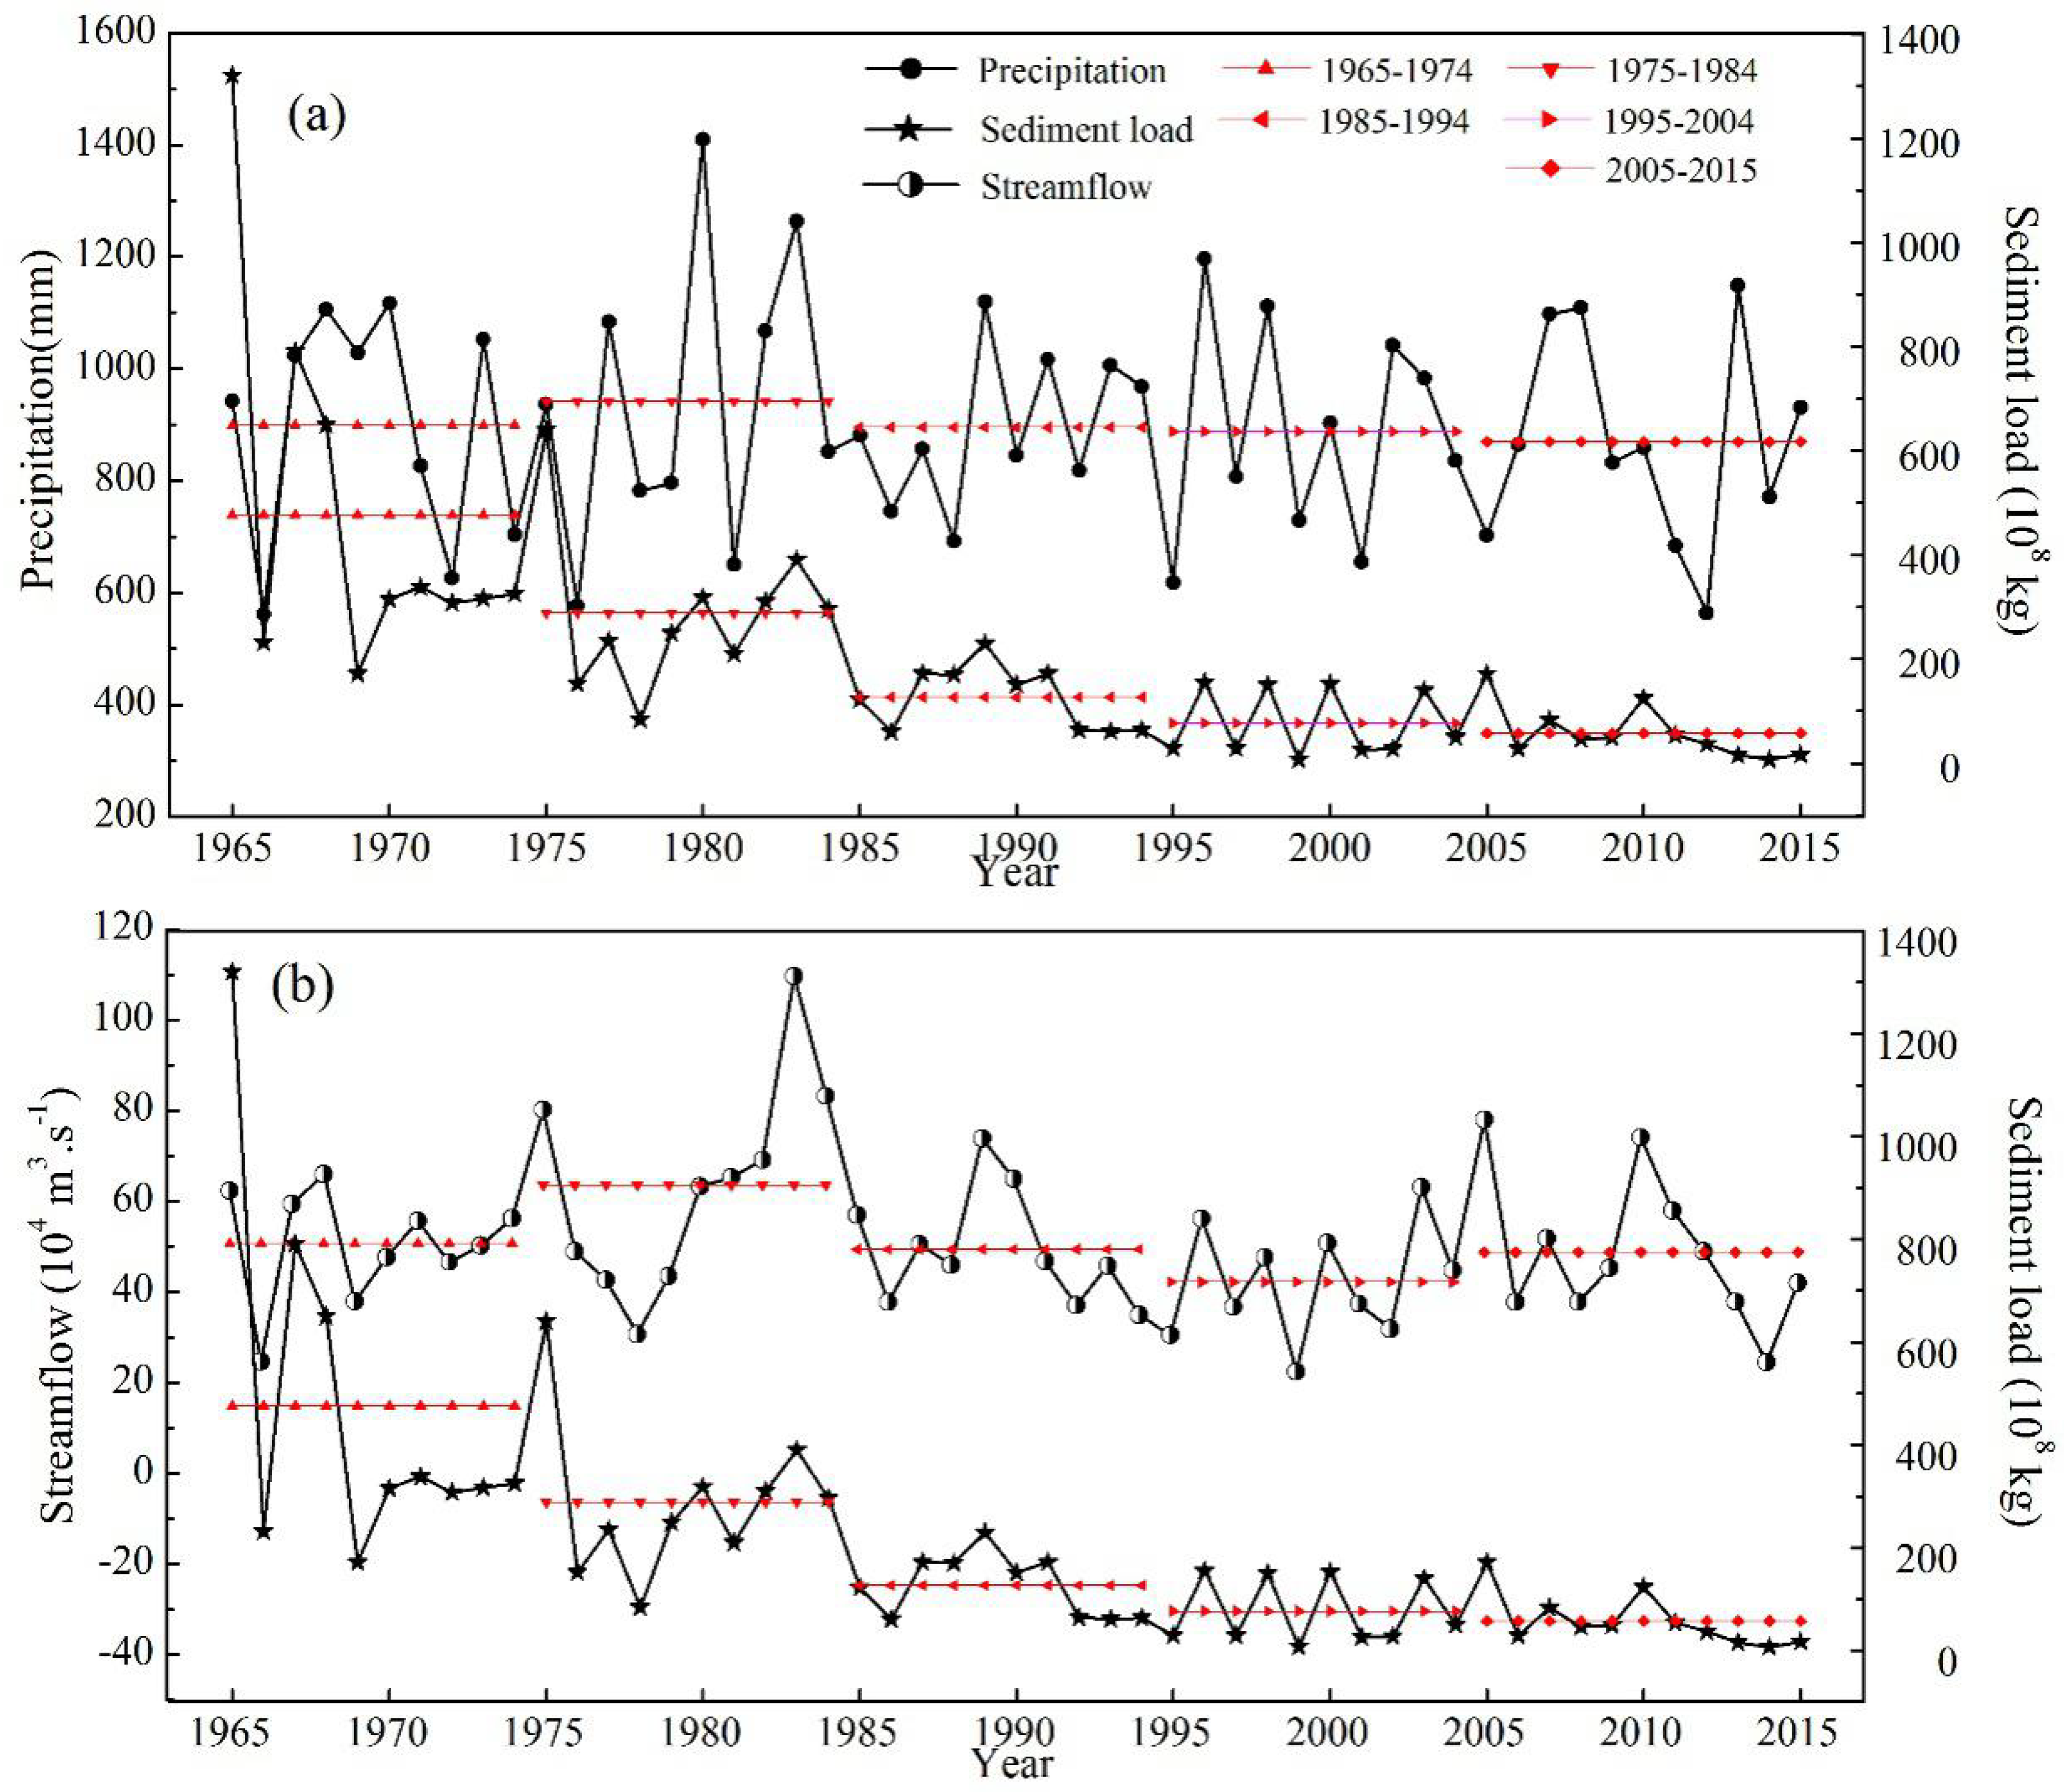
Table 4 shows the decadal variability of the water-sediment factors. The annual maximum and minimum sediment loads at Huangzhuang station during the study period were 1320 × 108 kg in 1965 and 7 × 10⁸ kg in 2014, respectively. Meanwhile, the highest and lowest decadal sediment loads occurred during 1965–1975 and 2005–2015, with respective mean values of 476.65 × 10⁸ kg (1965–1975) and 57.4 × 10⁸ kg (2005–2015). The maximum and minimum annual streamflow during this time were 109.582 × 10⁴ m3 (1983) and 22.4863 × 10⁴ m3 (1999), respectively. The highest and lowest decadal streamflow appeared in 1975–1985 and 1995–2005, respectively, with decadal mean values of 63.61 × 10⁴ m3 (1975–1985) and 42.12 × 10⁴ m3 (1995–2005) (Figure 4b). Additionally, the maximum and minimum annual precipitation values were 1409.6 mm in 1966 and 562.2 mm in 1966, respectively. The highest and lowest decadal precipitation totals occurred in 1975–1985 and 2005–2015, with respective decadal mean values of 942.06 (1975–1985) and 869.58 mm (2005–2015) (Figure 4a). In conclusion, there were greater reductions in annual sediment load than for water discharge and precipitation during the period of 1965–1995. This inconsistency in the rate of change of the two parameters resulted in variability of the water-sediment relationship, which was reflected in the sediment concentrations.
4.3. Driving Forces
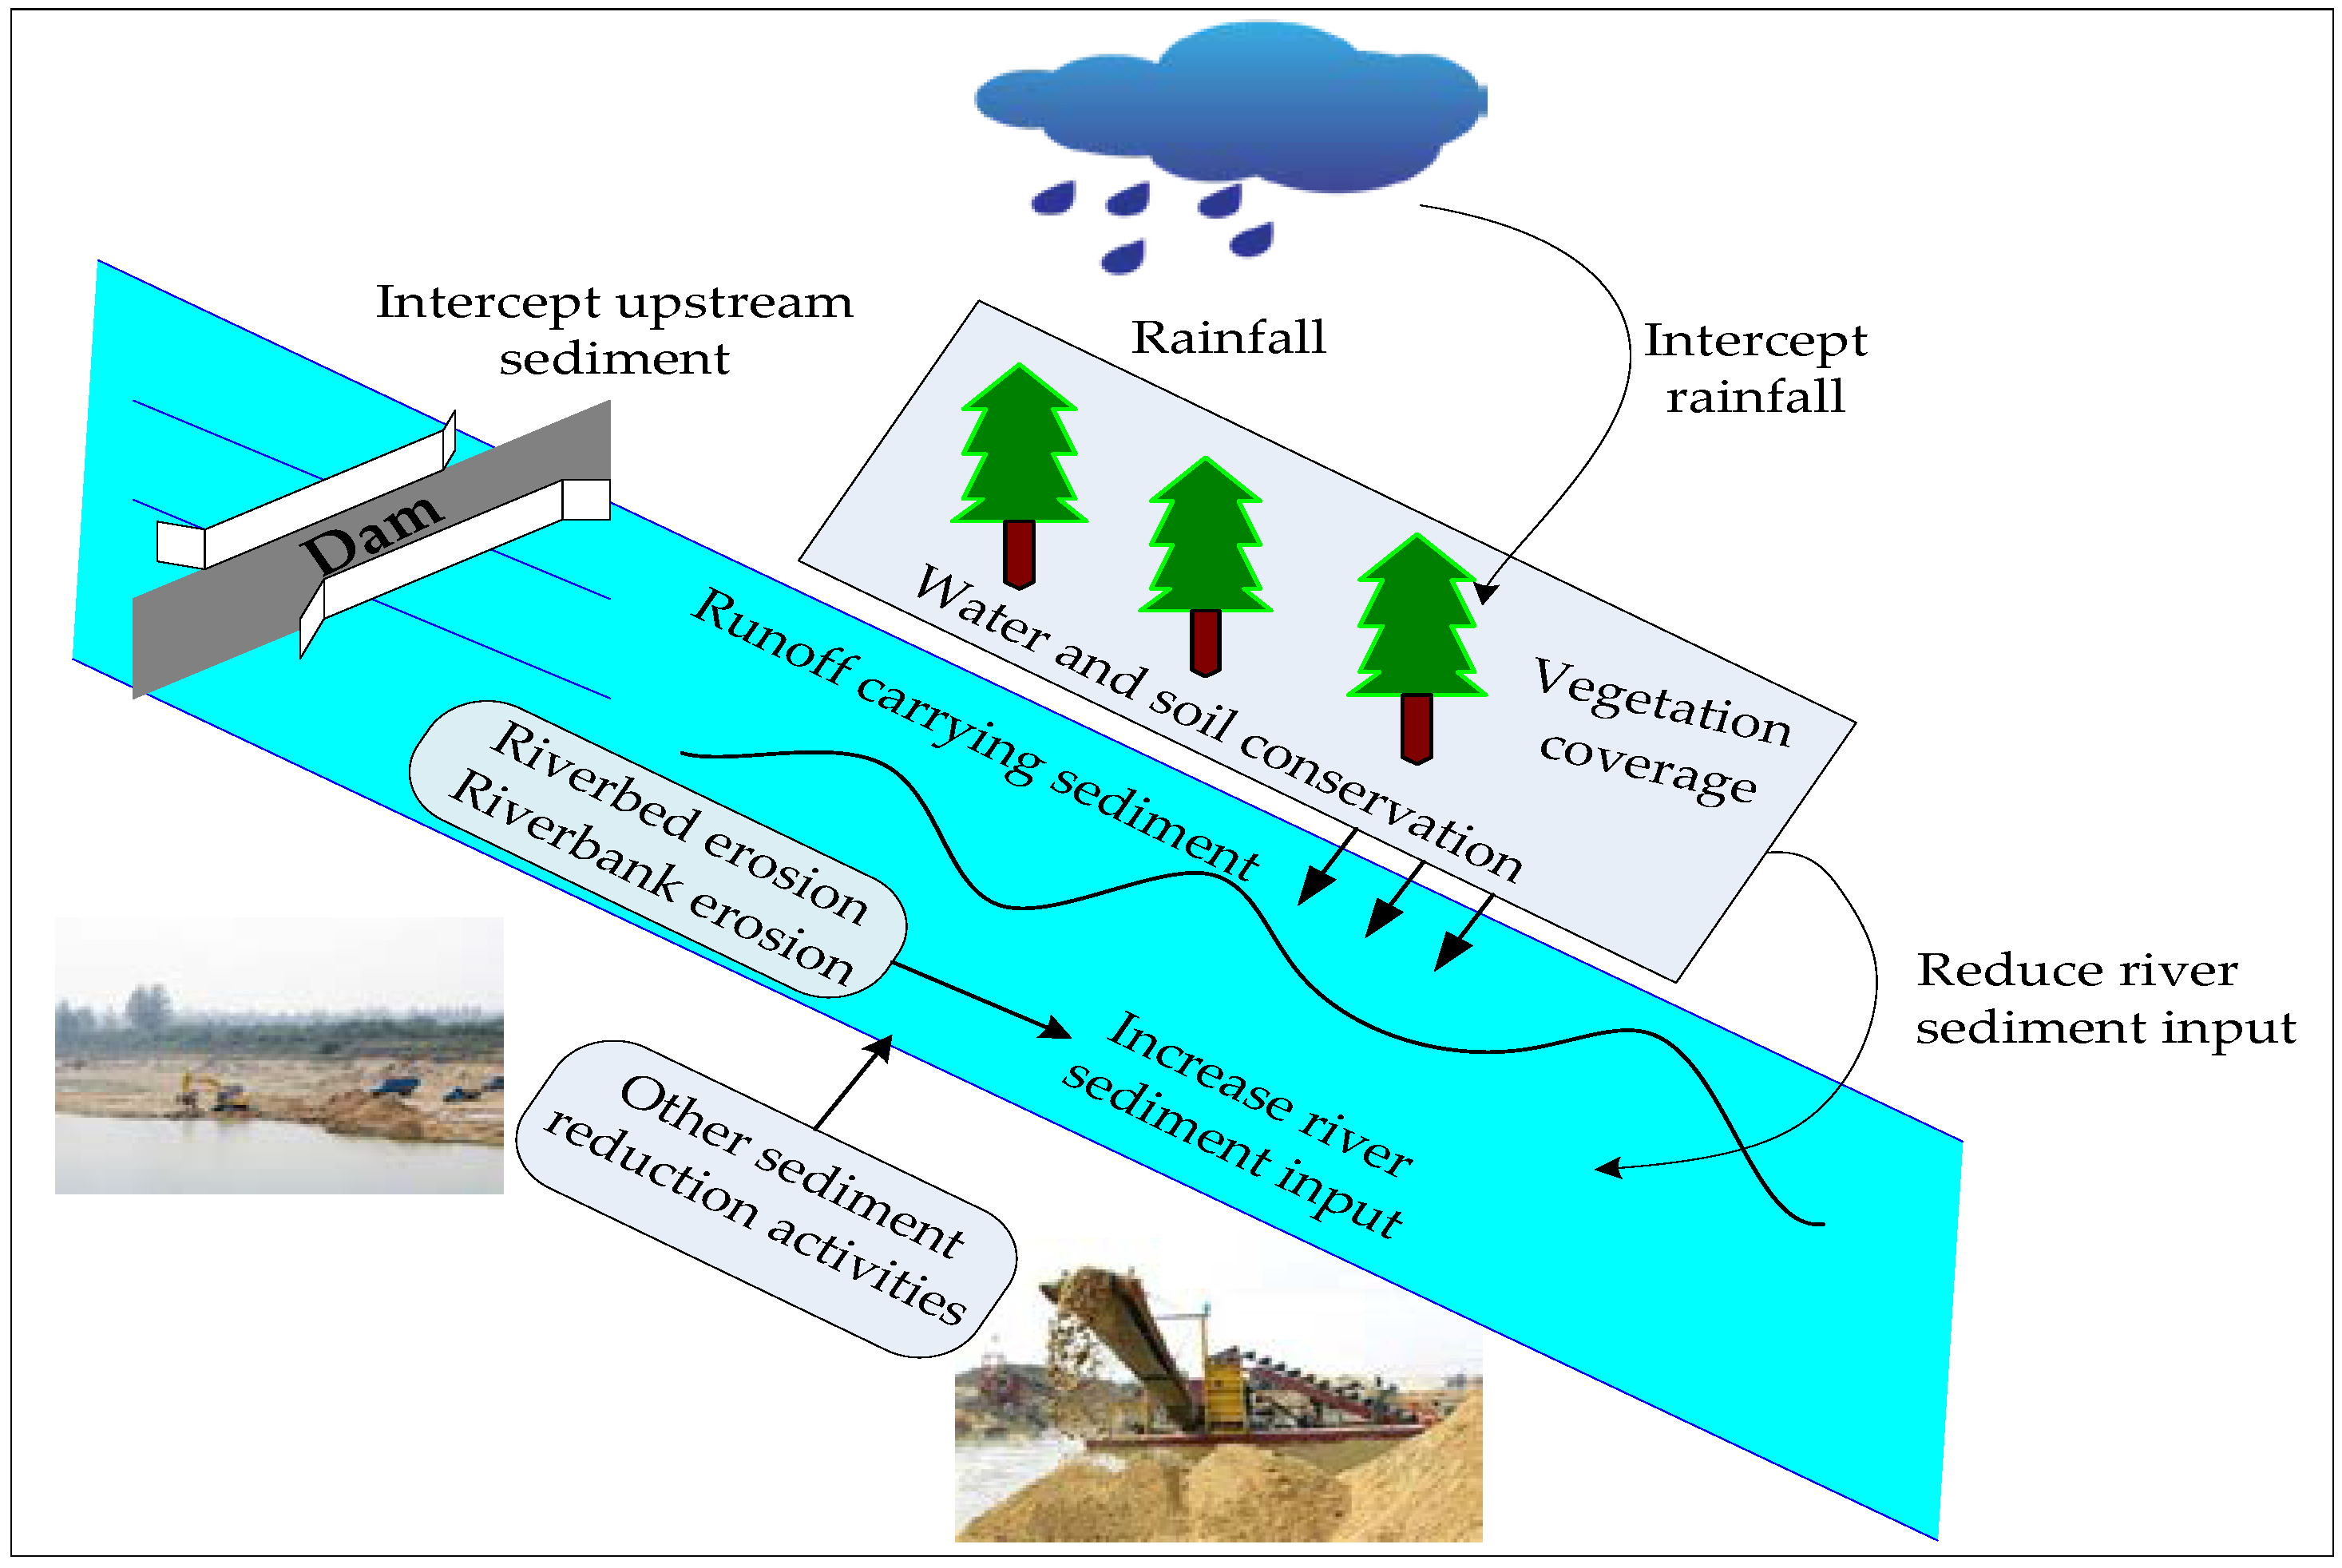
The main factors related to sediment yield were rainfall, runoff, reservoir construction, sand extraction, and vegetation coverage in the watershed. Vegetation restoration reduced slope erosion and runoff yield, and the reduction in runoff decreased incision in gullies, so the frequency of hyperconcentrated flows declined. In addition to vegetation restoration, economic development and increased human activity have also reduced sediment yield. China is now in a period of rapid economic growth, which has had great impacts on the river basin environment. Due to real estate development and municipal construction, river sand mining activities have become popular. In addition, reservoirs have a strong ability to retain sediment, while building dams can cut off the strong coupling between hyperconcentrated flows and gravitational erosion by raising the base level and reducing the slopes of gullies, causing hyperconcentrated flows to lose energy and leading to sediment deposition. The main factors related to sediment yield are shown in Figure 5. To better measure the degree of correlation between factors and sediment load, we tested the correlation between sediment and possible factors of influence at a significance level of p = 0.01. The Pearson correlation coefficients between sediment load and precipitation, and sediment load and vegetation coverage, were 0.23 (p = 0.1) and 0.39 (p = 0.1), respectively. Furthermore, analysis of the sediment load and water discharge series revealed a statistically significant correlation, with a coefficient of 0.47 (p = 0.001), as indicated by the factor identity results. However, the correlation coefficient between sediment load and potential evapotranspiration was not significant. The correlation coefficient between sediment load and gross domestic product in the middle reaches of the Hanjiang River was 0.31 (p = 0.01). The results showed that streamflow and economic development had the strongest correlation with reduced sediment load. Rainfall and vegetation coverage had a slight correlation with reduced sediment load, and the correlation between evapotranspiration and sediment load was not significant.
The relative contributions of major natural factors were calculated using the sediment load reduction factors analysis approach. Precipitation was the main natural source of water and the most important erosive force for the production of sediment load. Surface runoff was mainly formed and affected by rainfall, and the rainfall intensity directly impacted the degree of soil erosion. Here, water yield capacity mainly refers to runoff coefficients, as the water yield capacity affects its ability to carry sediment. Figure 6a shows the relative contributions of precipitation, rainfall water yield capacity, and changes in sediment concentration in river flow to sediment load reduction in the middle reaches of the Hanjiang River after the change point, using the sediment load reduction factors analysis function. We also identified two periods with an increasing s during the period from 1965 to 2015, in the temporal dynamic processes shown in Figure 6b. The variable s represents the sediment concentration, which refers the ratio of annual sediment mass flux to flow. Increasing s indicates either increased annual sediment load or decreased annual flow. However, we found that the annual sediment load time series followed a downward trend in the “Trends in water, sediment load, and vegetation coverage” section. Therefore, we suggest that the reduction in flow led to an increase of s. This implies that both the capacity of precipitation yield water and sediment in the basin have decreased; however, they have decreased at different rates. Therefore, the relationship between water and sediment has changed. Moreover, it was found that all three variables had a positive effect on sediment load reduction. The relative contributions of precipitation change and water yield capacity were quantitatively evaluated. On average, water yield capacity (5.05%) contributed more than precipitation change (1.66%) to the reduction in water discharge.
4.4. Contributions of Anthropogenic Activities and Climate Variability
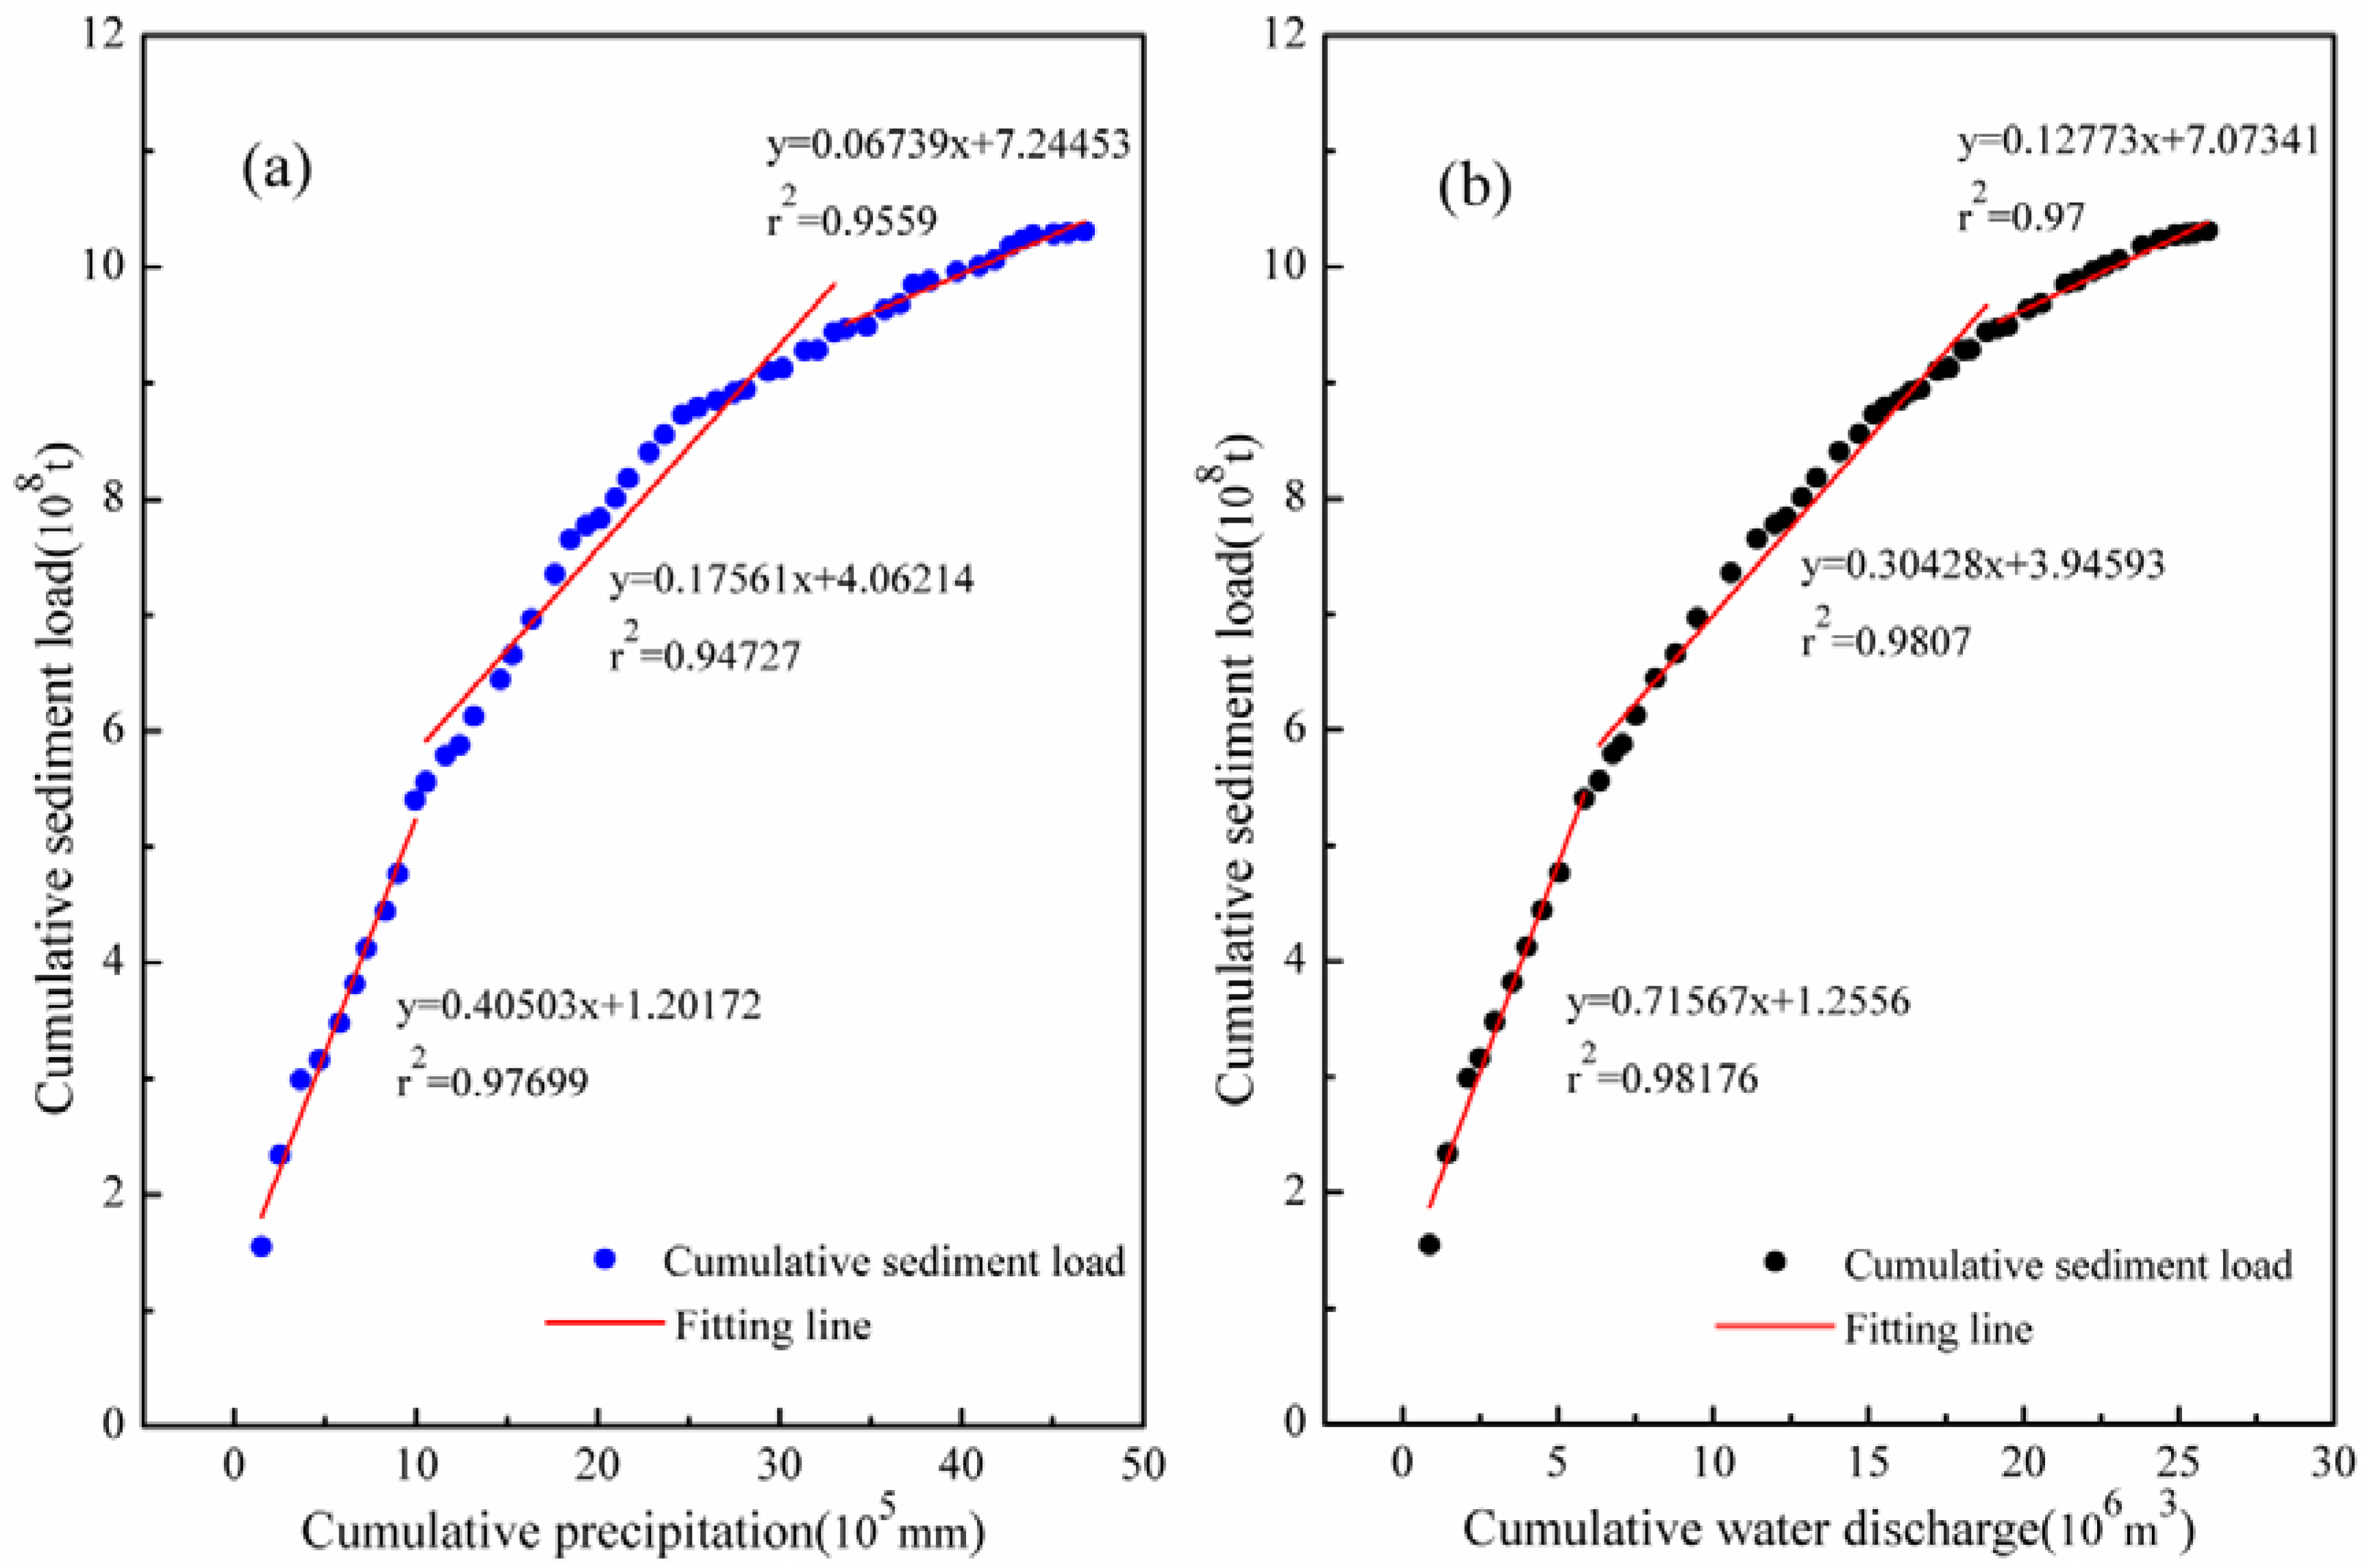
The double-mass curves of precipitation-sediment and water discharge-sediment for 1965–2015 in the Hanjiang River are shown in Figure 7. To better analyse the effects of anthropogenic activities over time on water and sediment load, we used linear sub-fitting methods according to when cascade dams were constructed. The Danjiangkou reservoir was built in 1974, and two other cascade dams (Wangfuzhou and Cuijiaying) were built in 1999 and 2000, so three temporal sections (1965–1974, 1975–2000, and 2000–2015) were analysed separately using different regression equations. Clear transition points were identified between the three regression lines for both precipitation-sediment and water discharge-sediment in the study basin. As seen in Figure 7, the DMCs prior to reservoir construction had slopes of 0.41 and 0.72 for the period 1965–1974 for precipitation-sediment load and discharge-sediment load, respectively. The DMCs exhibited a significant downward trend for the ratio of precipitation to sediment over the two periods (1974–2000; 2000–2015) at Huangzhuang station, with respective slopes of 0.17561 and 0.06739. Similarly, the DMCs of water discharge-sediment had a downward trend over the two periods (1974–2000; 2000–2015) with respective slopes of 0.30 and 0.13. Comparing the regression lines for the three periods, we found that the linear fit for the last period (2000–2015) had a more prominent downward trend. It should be noted that the relative reductions in cumulative water discharge-sediment load were greater than the relative reductions in cumulative precipitation-sediment load. The main reason for this result was that the effect of human activity on water discharge was more direct than that of rainfall. The capacities of the Danjiangkou, Wangfuzhou, and Cuijiaying Reservoirs are 290.5, 31, and 24.5 billion m3, respectively. The enormous water storage capacity of these reservoirs has a large impact on downstream water discharge. Reservoirs can also intercept sediment from upstream, which exacerbates the reduction of sediment load.
In summary, the results indicated that human activities increasingly influenced the transformation of the hydrological regime in the middle and lower reaches of the Hangiang River. The construction of the Danjiangkou reservoir and cascade dams was a hysteresis and uninterrupted process, and the impact of human activities on the water-sediment relationship intensified over the past 15 years. Different vegetation coverage levels in different parts of the river, industrial water use, and water use for agricultural irrigation may have been other factors that directly affected the sediment load. In light of the actual situation in the middle Hanjiang River basin, human activities here mainly refer to the impact of water conservancy projects. In addition, the rapid development of urbanization led to the development of real estate and infrastructure construction, which further stimulated unreasonable sand mining activities. Thus, it is time for the government to formulate an effective strategy for the optimization of the joint operation of the reservoirs and the control of unreasonable sand mining activities. A levy on ecological environmental compensation is an effective measure to promote the development of river restoration work.
5. Conclusions
This study analyzed temporal changes in sediment load, the water-sediment relationship, and their driving forces from 1965 to 2015 in the middle reaches of the Hanjiang River. An MK trend test was employed to detect trend shifts in sediment load, water discharge, precipitation, fractional vegetation coverage, and potential evapotranspiration (ET). Then we used a simple sediment load reduction factors analysis approach to diagnose the contributions of precipitation (P), water yield capacity (r), and sediment concentration (s) to the relative rate of change in the sediment load. Finally, DMC was used to analyze the driving forces of variability in the sediment load and water-sediment relationship. Some central conclusions can be summarized as follows:
(1) The sediment load time series exhibited a downward trend from 1965 to 2015, and only one intersection point was identified as a significant abrupt change-point in sediment load at Huangzhuang station, which was in 1973. Vegetation coverage and water discharge decreased slightly, and annual sediment load displayed greater reductions than the water discharge and precipitation over the period from 1965–1995. This inconsistency in the rates of change of the two parameters resulted in variability of the water-sediment relationship, which was reflected in the sediment concentration.
(2) The results of the driving force analysis showed that streamflow change had the greatest influence on sediment load reduction. Rainfall and vegetation coverage had a slight effect on the sediment content decreases, and the effect of evaporation was not significant. Additionally, the impact of economic development on sediment reduction could not be ignored.
(3) The sediment reduction factors analysis found that all three variables had a positive effect on sediment load reduction in the tributaries. The relative contributions of precipitation change and water yield capacity were quantitatively evaluated. On average, water yield capacity contributed more than precipitation change to the reduction of water discharge.
(4) Clear transition points were identified between the three regression lines for both precipitation-sediment and water discharge-sediment in the study basin. Reservoir construction had an important impact on changes in sediment load. The impacts of human activities on the water-sediment relationship have intensified over the past 15 years. The relative reductions in cumulative water discharge-sediment load were greater than the relative reductions in cumulative precipitation-sediment.
Sediment load reduction has been a result of the combined effects of human activity and climate change. Changes in the water-sediment relationship have been the synergistic results of multiple factors that require more in-depth research. The impacts of variations in land use change, soil and the river-hillslope connectivity, geology, and soil coverage require more in-depth research. Furthermore, harmonizing the relationship between water and sediment is the most difficult reservoir management aspect in the Hanjiang River. We propose the establishment of an integrated basin-wide ecosystem and reservoir optimization scheduling scheme for sustainable water use and sediment regulation. This research provides information for the determination of multi reservoir optimal manipulation and is instructive for the detection of changes of sediment load in other watersheds that are also subject to human interference.
Author Contributions
X.L. (Xiaorong Lu) conceived and designed this study. X.W. made substantial contributions to acquisition, analysis, and interpretation of the data. Q.Y. contributed to the calculations. This manuscript was prepared by C.Y. X.L. (Xi Liu) provided valuable suggestions for the revision and was involved in polishing the language. All authors read and approved the submitted manuscript, agreed to be listed and accepted the final version for publication.
Funding
This research was funded by: (1) The National Natural Science Foundation of China (Grant No. 41571202); (2) The National Natural Science Foundation of China (Grant No. 41171426); and (3) Natural Science Foundation of Hubei Province, China (Project No. 2014CFB330).
Conflicts of Interest
The authors declare no conflict of interest.
References
- Murgulet, D.; Murgulet, V.; Spalt, N.; Douglas, A.; Hay, R.G. Impact of hydrological alterations on river-groundwater exchange and water quality in a semi-arid area: Nueces River, Texas. Sci. Total Environ. 2016, 572, 595–607. [Google Scholar] [CrossRef] [PubMed]
- Liang, W.; Bai, D.; Wang, F.; Fu, B.; Yan, J.; Wang, S.; Yang, Y.; Long, D.; Feng, M. Quantifying the impacts of climate change and ecological restoration on streamflow changes based on a Budyko hydrological model in China’s Loess Plateau. Water Resour. Res. 2015, 51, 6500–6519. [Google Scholar] [CrossRef]
- Samaras, A.G.; Koutitas, C.G. An integrated approach to quantify the impact of watershed management on coastal morphology. Ocean Coast. Manag. 2012, 69, 68–77. [Google Scholar] [CrossRef]
- Kim, J.; Choi, J.; Choi, C.; Hwang, C. Forecasting the Potential Effects of Climatic and Land-Use Changes on Shoreline Variation in Relation to Watershed Sediment Supply and Transport. J. Coast. Res. 2016, 33. [Google Scholar] [CrossRef]
- Liu, B.Y.; Nearing, M.A.; Shi, P.J.; Jia, Z.W. Slope length effects on soil loss for steep slopes. Soil Sci. Soc. Am. J. 1994, 64, 1759–1763. [Google Scholar] [CrossRef]
- Poesen, J.; Nachtergaele, J.; Verstraeten, G.; Valentin, C. Gully erosion and environmental change: importance and research needs. CATENA 2003, 50, 91–133. [Google Scholar] [CrossRef]
- Pesce, M.; Critto, A.; Torresan, S.; Giubilato, E.; Santini, M.; Zirino, A.; Ouyang, W.; Marcomini, A. Modelling climate change impacts on nutrients and primary production in coastal waters. Sci. Total Environ. 2018, 628, 919–937. [Google Scholar] [CrossRef]
- Zhang, W.; Xu, Y.; Hoitink, A.J.F.; Sassi, M.G.; Zheng, J.; Chen, X.; Zhang, C. Morphological change in the Pearl River Delta. China Mar. Geol. 2015, 363, 202–219. [Google Scholar] [CrossRef]
- Samaras, A.G.; Koutitas, C.G. The impact of watershed management on coastal morphology: A case study using an integrated approach and numerical modeling. Geomorphology 2014, 211, 52–63. [Google Scholar] [CrossRef]
- Gao, P.; Mu, X.M.; Wang, F.; Li, R. Changes in streamflow and sediment discharge and the response to human activities in the middle reaches of the Yellow River. Hydrol. Earth. Syst. Sci. 2010, 7, 347–350. [Google Scholar] [CrossRef]
- Bao, Z.; Zhang, J.; Wang, G.; Fu, G.; He, R.; Yan, X.; Jin, J.; Liu, Y.; Zhang, A. Attribution for decreasing streamflow of the Haihe River basin, northern China: Climate variability or human activities. J. Hydrol. 2012, 460–461, 117–129. [Google Scholar] [CrossRef]
- Yang, S.L.; Zhao, Q.Y.; Belkin, I.M. Temporal variation in the sediment load of the Yangtze river and the influences of human activities. J. Hydrol. 2002, 263, 56–71. [Google Scholar] [CrossRef]
- Chen, X.; Yan, Y.; Fu, R.; Dou, X.; Zhang, E. Sediment transport from the Yangtze River, China, into the sea over the Post-Three Gorge Dam Period: A discussion. Quat. Int. 2008, 186, 55–64. [Google Scholar] [CrossRef]
- Walling, D.E.; Fang, D. Recent trends in the suspended sediment loads of the world’s rivers. Glob. Planet. Chang. 2003, 39, 111–126. [Google Scholar] [CrossRef]
- Turner, B.L. The Earth as Transformed by Human Action: Global and Regional Changes in the Biosphere over the Past 300 Years; CUP Archive; Cambridge University Press: Cambridge, UK, 1990. [Google Scholar]
- Stanley, D.J.; Warne, A.G. Nile Delta in Its Destruction Phase. J. Coastal. Res. 1998, 14, 795–825. [Google Scholar]
- Syvitski, J.P.M.; Kettner, A.J. On the flux of water and sediment into the Northern Adriatic Sea. Cont. Shelf. Res. 2007, 27, 296–308. [Google Scholar] [CrossRef]
- Syvitski, J.P.M.; Saito, Y. Morphodynamics of deltas under the influence of humans. Glob. Planet. Chang. 2007, 57, 261–282. [Google Scholar] [CrossRef]
- Wang, H.; Saito, Y.; Zhang, Y.; Bi, N.; Sun, X.; Yang, Z. Recent changes of sediment flux to the western Pacific Ocean from major rivers in East and Southeast Asia. Earth-Sci. Rev. 2011, 108, 80–100. [Google Scholar] [CrossRef]
- Dai, Z.; Fagherazzi, S.; Mei, X.; Gao, J. Decline in suspended sediment concentration delivered by the Changjiang (Yangtze) River into the East China Sea between 1956 and 2013. Geomorphology 2016, 268, 123–132. [Google Scholar] [CrossRef]
- Li, Q.; Yu, M.; Lu, G.; Cai, T.; Bai, X.; Xia, Z. Impacts of the Gezhouba and Three Gorges reservoirs on the sediment regime in the Yangtze River, China. J. Hydrol. 2011, 403, 224–233. [Google Scholar] [CrossRef]
- Luo, X.X.; Yang, S.L.; Zhang, J. The impact of the Three Gorges Dam on the downstream distribution and texture of sediments along the middle and lower Yangtze River (Changjiang) and its estuary, and subsequent sediment dispersal in the East China Sea. Geomorphology 2012, 179, 126–140. [Google Scholar] [CrossRef]
- Wang, H.; Yang, Z.; Li, G.; Jiang, W. Wave Climate Modeling on the Abandoned Huanghe (Yellow River) Delta Lobe and Related Deltaic Erosion. J. Coast. Res. 2006, 22, 906–918. [Google Scholar] [CrossRef]
- Wang, H.; Yang, Z.; Saito, Y.; Liu, J.P.; Sun, X.; Wang, Y. Stepwise decreases of the Huanghe (Yellow River) sediment load (1950–2005): Impacts of climate change and human activities. Glob. Planet. Chang. 2007, 57, 331–354. [Google Scholar] [CrossRef]
- Xu, K.; Milliman, J.D.; Yang, Z.; Wang, H. Yangtze sediment decline partly from Three Gorges Dam. Eos Trans. Am. Geophys. Union 2013, 87, 185–190. [Google Scholar] [CrossRef]
- Dai, S.B.; Yang, S.L.; Li, M. The sharp decrease in suspended sediment supply from China’s rivers to the sea: Anthropogenic and natural causes. Int. Assoc. Sci. Hydrol. Bull. 2009, 54, 135–146. [Google Scholar] [CrossRef]
- Wang, Y.; Wang, D.; Wu, J. Assessing the impact of Danjiangkou reservoir on ecohydrological conditions in Hanjiang river, China. Ecol. Eng. 2015, 81, 41–52. [Google Scholar] [CrossRef]
- Wang, Y.; Zhang, W.; Zhao, Y.; Peng, H.; Shi, Y. Modelling water quality and quantity with the influence of inter-basin water diversion projects and cascade reservoirs in the Middle-lower Hanjiang River. J. Hydrol. 2016, 541, 1348–1362. [Google Scholar] [CrossRef]
- Chen, H.C.; Du, P. Potential ecological benefits of the middle route for the south-north water diversion project. Tsinghua Sci. Technol. 2008, 13, 715–719. [Google Scholar] [CrossRef]
- He, W.; He, Q.; Zhou, J. Soil weathering-water environment-ecological risks in Hanjiang River Basin, China. Quat. Int. 2015, 380–381, 297–304. [Google Scholar] [CrossRef]
- Xin, X.K.; Li, K.F.; Finlayson, B.; Yin, W. Evaluation, prediction, and protection of water quality in Danjiangkou Reservoir, China. Water Sci. Eng. 2015, 8, 30–39. [Google Scholar] [CrossRef]
- Li, Y.; Cui, Q.; Li, C.; Wang, X.; Cai, Y.; Cui, G.; Yang, Z. An improved multi-objective optimization model for supporting reservoir operation of China’s South-to-North Water Diversion Project. Sci. Total Environ. 2016, 575, 970. [Google Scholar] [CrossRef] [PubMed]
- Wei, Y.; Tang, D.; Ding, Y.; Agoramoorthy, G. Incorporating water consumption into crop water footprint: A case study of China’s South-North Water Diversion Project. Sci. Total Environ. 2016, 545–546, 601. [Google Scholar] [CrossRef] [PubMed]
- Yang, Q.; Xie, P.; Shen, H.; Xu, J.; Wang, P.; Zhang, B. A novel flushing strategy for diatom bloom prevention in the lower-middle Hanjiang River. Water Res. 2012, 46, 2525–2534. [Google Scholar] [CrossRef] [PubMed] [Green Version]
- Lu, X.; Wang, X.; Zhang, L.; Zhang, T.; Yang, C.; Song, X.X.; Yang, Q. Improving forecasting accuracy of river flow using gene expression programming based on wavelet decomposition and de-noising. Hydrol. Res. 2017, 49, nh2017115. [Google Scholar] [CrossRef]
- Liu, C.; Zheng, H. South-to-north Water Transfer Schemes for China. Int. J. Water Resour. Dev. 2002, 18, 453–471. [Google Scholar] [CrossRef]
- Gu, W. Risk Evaluation of Water Shortage in Source Area of Middle Route Project for South-to-North Water Transfer in China. Water Resour. Manag. 2012, 26, 3479–3493. [Google Scholar] [CrossRef]
- Mann, H.B. Nonparametric Tests against Trend. Econometrica 1945, 13, 245–259. [Google Scholar] [CrossRef]
- Kendall, M.G. Rank correlation methods. Br. J. Psychol. 1990, 25, 86–91. [Google Scholar] [CrossRef]
- Mann, H.B.; Whitney, D.R. On a Test of Whether one of Two Random Variables is Stochastically Larger than the other. Ann. Math. Stat. 1947, 18, 50–60. [Google Scholar] [CrossRef]
- Sagarika, S.; Kalra, A.; Ahmad, S. Evaluating the effect of persistence on long-term trends and analyzing step changes in streamflows of the continental United States. J. Hydrol. 2014, 517, 36–53. [Google Scholar] [CrossRef]
- Chen, Y.D.; Zhang, Q.; Xu, C.Y.; Lu, X.; Zhang, S. Multiscale streamflow variations of the Pearl River basin and possible implications for the water resource management within the Pearl River Delta, China. Quat. Int. 2010, 226, 44–53. [Google Scholar] [CrossRef]
- Wang, S.; Fu, B.; Liang, W.; Liu, Y.; Wang, Y. Driving forces of changes in the water and sediment relationship in the Yellow River. Sci. Total Environ. 2017, 576, 453–461. [Google Scholar] [CrossRef] [PubMed]
- Wang, S.; Fu, B.; Piao, S.; Lü, Y.; Ciais, P.; Feng, X.; Wang, Y. Reduced sediment transport in the Yellow River due to anthropogenic changes. Nat. Geosci. 2016, 9, 38–41. [Google Scholar] [CrossRef]
- Weiss, L.L.; Wilson, W.T. Evaluation of significance of slope changes in double mass curves. Eos Trans. Am. Geophys. Union 1953, 34, 893–896. [Google Scholar] [CrossRef]
- Ward, J.M.; Jackson, C.R. Sediment trapping eithin forestry streamside management zones: Georgia piedmont, USA. J. Am. Water Resour. Assoc. 2010, 40, 1421–1431. [Google Scholar] [CrossRef]
- Yihdego, Y.; Webb, J. An Empirical Water Budget Model as a Tool to Identify the Impact of Land-use Change in Stream Flow in Southeastern Australia. Water Resour. Manag. 2013, 27, 4941–4958. [Google Scholar] [CrossRef]
- Brierley, G.; Fryirs, K.; Outhet, D.; Massey, C. Application of the River Styles framework as a basis for river management in New South Wales, Australia. Appl. Geogr. 2002, 22, 91–122. [Google Scholar] [CrossRef]
- Duan, C.; Wu, L.; He, L.; Wang, S. Spatio-temporal distribution pattern of vegetation coverage in Junggar Basin, Xinjiang. Acta Ecol. Sin. 2016, 36, 72–76. [Google Scholar] [CrossRef]
- Duo, A.; Zhao, W.; Qu, X.; Jing, R.; Xiong, K. Spatio-temporal variation of vegetation coverage and its response to climate change in North China plain in the last 33 years. Int. J. Appl. Earth Obs. Geoinf. 2016, 53, 103–117. [Google Scholar] [CrossRef]
Figure 1.
Location of the middle reaches of the Hanjiang River.

Figure 2.
Trends in annual sediment load at the Huangzhuang station from 1965–2015. (a) the trend of change and variability for annual sediment load; (b) the MK trend test for the annual sediment load.
Figure 2.
Trends in annual sediment load at the Huangzhuang station from 1965–2015. (a) the trend of change and variability for annual sediment load; (b) the MK trend test for the annual sediment load.

Figure 3.
Vegetation coverage maps for the middle reaches of the Hanjiang River from 2000–2015. Classification of vegetation cover: 0–0.3 represents almost no vegetation, such as water bodies, urban areas, or bare soil; 0.3–0.45 represents regions with medium to low vegetation cover; 0.45–0.6 represents areas with medium vegetation coverage; 0.6–0.75 represents areas with medium to high vegetation cover; and 0.75–1 represents areas with high vegetation cover, such as forests, grasslands, and plantations [49,50].

Figure 4.
Decadal variability in the water-sediment relationship. (a) variability of the sediment load and precipitation; (b) variability of the sediment load and streamflow.
Figure 4.
Decadal variability in the water-sediment relationship. (a) variability of the sediment load and precipitation; (b) variability of the sediment load and streamflow.

Figure 5.
Hanjiang River sediment input and related factors.

Figure 6.
Driving forces of sediment load reduction and dynamic processes in the middle reaches of the Hanjiang River. (a) The relative contributions of precipitation (P), water yield capacity (r), and sediment concentration in stream flow (s) to the sediment load reductions after the change point using the sediment load factors identity; (b) the dynamic processes contributing to sediment load reduction.

Figure 7.
Double-mass curves of precipitation-sediment load and water discharge-sediment load in the middle reaches of the Hanjiang River. (a) DMCs of precipitation-sediment; (b) DMCs of water discharge-sediment-sediment.
Figure 7.
Double-mass curves of precipitation-sediment load and water discharge-sediment load in the middle reaches of the Hanjiang River. (a) DMCs of precipitation-sediment; (b) DMCs of water discharge-sediment-sediment.


Table 1.
Reservoirs in the middle reaches of the Hanjiang River.
| Name | Completion Time | Normal Storage Water Level (m) | Total Capacity (1 × 10¹⁰ m3) |
|---|---|---|---|
| Danjiangkou | 1974 | 170.00 | 29.05 |
| Wangfuzhou | 1999 | 86.23 | 3.10 |
| Cuijiaying | 2000 | 62.73 | 2.45 |
Table 2.
Raw data sources.
| Terms | Source |
|---|---|
| Sediment data | Yangtze River Water Resources Commission, Hanjiang Hydrological Yearbook |
| Streamflow data | Hubei Province Hydrology and Water Resources Bureau |
| Meteorological data | China Meteorological Data Sharing Network |
| GDP | Statistical bulletin of national economic and social development in Hubei province |
| NDVI data | National Aeronautics and Space Administration |
Table 3.
Trends for annual precipitation, water discharge, potential evapotranspiration, vegetation coverage, and sediment load using the Mann–Kendall (MK) test and linear regression at Huangzhuang station.
Table 3.
Trends for annual precipitation, water discharge, potential evapotranspiration, vegetation coverage, and sediment load using the Mann–Kendall (MK) test and linear regression at Huangzhuang station.
| Factors | MK Test | Linear Regression | ||
|---|---|---|---|---|
| Zall | Sig. Level | Slope | Sig. Level | |
| Sediment load (106 kg/year) | 6.09 | 0.01 | −10.55 | 0.001 |
| Precipitation (mm/year) | −0.39 | 0.05 | 18.90 | 0.10 |
| Water discharge (104 m3/year) | 1.45 | 0.01 | −0.23 | 0.05 |
| Potential evapotranspiration (mm/year) | 1.39 | 0.01 | 9.86 | 0.05 |
| Vegetation coverage (%) | - | - | −0.67 | 0.05 |
Table 4.
The decadal characteristics of water-sediment factor variables.
| Periods | Factors | Mean Value | Maximum | Minimum |
|---|---|---|---|---|
| 1965–1975 | Precipitation (mm) | 899 | 1117 | 562 |
| Streamflow (104 m3) | 51 | 66 | 25 | |
| Sediment loads (108 kg) | 477 | 1320 | 172 | |
| 1975–1985 | Precipitation (mm) | 942 | 1410 | 576 |
| Streamflow (104 m3) | 64 | 110 | 31 | |
| Sediment loads (108 kg) | 288 | 640 | 84 | |
| 1985–1995 | Precipitation (mm) | 895 | 1120 | 693 |
| Streamflow (104 m3) | 49 | 74 | 35 | |
| Sediment loads (108 kg) | 127 | 230 | 60 | |
| 1995–2005 | Precipitation (mm) | 888 | 1197 | 618 |
| Streamflow (104 m3) | 42 | 63 | 22 | |
| Sediment loads (108 kg) | 77 | 155 | 7 | |
| 2005–2015 | Precipitation (mm) | 870 | 1149 | 564 |
| Streamflow (104 m3) | 49 | 78 | 25 | |
| Sediment loads (108 kg) | 57 | 171 | 7 |
© 2018 by the authors. Licensee MDPI, Basel, Switzerland. This article is an open access article distributed under the terms and conditions of the Creative Commons Attribution (CC BY) license (http://creativecommons.org/licenses/by/4.0/).
Share and Cite
MDPI and ACS Style
Lu, X.; Wang, X.; Yang, C.; Liu, X.; Yang, Q. Changes and Driving Forces of the Water-Sediment Relationship in the Middle Reaches of the Hanjiang River. Water 2018, 10, 887. https://doi.org/10.3390/w10070887
AMA Style
Lu X, Wang X, Yang C, Liu X, Yang Q. Changes and Driving Forces of the Water-Sediment Relationship in the Middle Reaches of the Hanjiang River. Water. 2018; 10(7):887. https://doi.org/10.3390/w10070887
Chicago/Turabian StyleLu, Xiaorong, Xuelei Wang, Chao Yang, Xi Liu, and Qing Yang. 2018. "Changes and Driving Forces of the Water-Sediment Relationship in the Middle Reaches of the Hanjiang River" Water 10, no. 7: 887. https://doi.org/10.3390/w10070887
Note that from the first issue of 2016, this journal uses article numbers instead of page numbers. See further details here.