Effect of Temporal Resolution of Rainfall on Simulation of Urban Flood Processes

Department of Hydraulic Engineering, State Key Laboratory of Hydroscience and Engineering, Tsinghua University, Beijing 100084, China
*
Author to whom correspondence should be addressed.
Water 2018, 10(7), 880; https://doi.org/10.3390/w10070880
Submission received: 29 May 2018
/
Revised: 24 June 2018
/
Accepted: 26 June 2018
/
Published: 2 July 2018
(This article belongs to the Section Urban Water Management)
Abstract
:Rainfall exhibits substantial variability, and its temporal resolution considerably affects simulation of hydrological processes. This study aims to investigate the effect of the temporal resolution of rainfall (TRR) on urban flood modeling and to explore how high TRR is required. A routing-enhanced detailed urban stormwater (REDUS) model, which has four layers and accounts for complex urban flow paths, was developed and then applied to the campus of Tsinghua University, Beijing, China. For 30 rainfall events at 1-min resolution, the rainfall accuracy index (RAI) was used to describe the discrepancy of rainfall patterns by upscaling. Through hydrodynamic modelling, the effect of TRR was quantified by the relative error of flood volume and peak in typical areas. The results show that (1) flood peak is sensitive to TRR while flood volume is generally not; (2) with lower TRR, discharge peak is underestimated, and a power function is proposed to express the relationship between the effect of TRR and the characteristics of rainfall and underlying surfaces; and (3) rainfall data of 5-min resolution for urban areas smaller than 1 km2, or at least 15-min resolution for larger areas, are required to constrain the relative biases of flood peak within 10%.
1. Introduction
Rainfall is one of the key drivers of urban hydrological process and demonstrates high temporal and spatial variability [1]. In 1997, Singh [2] summarized how the hydrograph is affected by the temporal and spatial distribution of rainfall and identified that the influence of rainfall also depends on watershed characteristics. Rainfall variability makes it important to adopt an appropriate rainfall resolution to model hydrological response, especially in urban catchments with short response time [3,4]. In particular, for small urban catchments with drainage area no more than 10 km2, the temporal resolution of rainfall (TRR), rather than the spatial resolution of rainfall (SRR), has larger effect on hydrodynamic modelling [5,6]. Data with high TRR contribute to urban hydrology research in many aspects, such as analysing the water balance at short time scale [7], capturing the accurate peak discharge time for flooding events [8], and reducing the uncertainty of hydrological simulation [9].
Previously, studies of the effects of TRR were limited by rainfall monitoring techniques. Variogram analysis was conducted theoretically to describe temporal (or spatial) variability as the characteristic scale, which was defined as the temporal (or spatial) distance by which two individual points show statistical independence [3]. Based on this method, Berne et al. [10] proposed the relationship between the required characteristic scales of rainfall and urban catchments, and then derived the required rainfall resolution for urban hydrological applications. Emmanuel et al. [11] summarized the characteristic scales of rainfall of different types. Also, stochastic rainfall generator and statistics downscaling methods were widely used to obtain high temporal resolution rainfall series [12,13,14,15,16].
With the development of monitoring techniques, more high-resolution rainfall observations become available for TRR effect studies. Radar measurements can provide rainfall data of high TRR and SRR simultaneously [17]. For instance, Ochoa-Rodriguez et al. [5] studied 7 urban catchments of areas between 3 and 8 km2 and used 16 different combinations of TRR and SRR to investigate their effects on simulated flow. Rafieeinasab et al. [18] studied 5 urban catchments with sizes varying from 3.4 to 54.6 km2 and assessed the sensitivity of hydrological simulation to the temporal and spatial resolutions of precipitation and hydrologic modelling. Peleg et al. [19] distinguished the effect of TRR and SRR with the help of a stochastic spatially distributed rainfall generator. In addition to rainfall radars, disdrometers can provide detailed rainfall information such as raindrop size distributions and fall velocities, from which the accurate rainfall intensity can be estimated at high temporal resolution [20]. Using this instrument, Yang et al. [6] found that the discharge peak is highly related to the peak intensity of 30-min rainfall, while the effect of TRR is weakly related to rainfall volume. Notato et al. [21] emphasized that higher resolution of rainfall inputs can result in lower uncertainty of model outputs. Besides, Thorndahl et al. [22] summarized related studies and achieved that the effect of rainfall resolutions on hydrological modelling decreases as the catchment size increases, where the catchment characteristics play a dominant role, followed by storm characteristics.
The findings above help to understand the effect of rainfall resolutions, however, due to the limited accuracy and availability of observations [23], study on the effect of TRR is still insufficient. It is stated that the effect of TRR works together with the characteristics of rainfall and catchment conceptually [24], but the relationship is little examined in urban areas smaller than 3 km2 and is still lacking a quantitative description.
Urban hydrologic or hydrodynamic models are essential in investigations of the effect of TRR [25,26]. These models act as filters, that is, they can smooth the influence of temporal and spatial variability of rainfall forcing [27]. Due to the different degrees of the “smooth effect”, the varying sensitivity of models to rainfall inputs lead to different evaluation results of the effects of TRR. Aronica et al. [28] found that SWMM model shows a higher sensitivity to TRR than hydrological parameters, while UDTM model [29] has an opposite property. Meselhe et al. [30] compared a conceptual model HMS with a physically based hydrologic model MIKE SHE and illustrated that the physically based model is more affected by temporal rainfall sampling. Gires et al. [31] also achieved a 1D/2D model, Multi-Hydro, that is more sensitive to rainfall variability than the simpler 1D model. Therefore, it is important to test the significance of TRR using a detailed model along with high resolution rainfall as input to resolve the resolution consistency [5,32], which can thus provide more sensible recommendations on rainfall resolution required for detailed urban flood modelling.
This paper aims to investigate three questions: (1) What are the effects of TRR on simulation of flood processes when using a detailed urban hydrodynamic model, especially for urban areas smaller than 3 km2? (2) What is the relationship between the effect of TRR and the characteristics of rainfall and underlying surfaces? and (3) How high TRR can meet the demands for accurate urban flood modelling? We take the campus of Tsinghua University as the study area (Section 2.1) and collect high temporal resolution rainfall and hydrological data (Section 2.2). A routing-enhanced detailed urban stormwater model, REDUS, is developed to finely account for complex urban flow paths (Section 2.3). Based on the 1-min resolution rainfall data for up to 30 events, we generate rainfall data with different temporal resolutions and use a dimensionless index to describe the match degree of upscaled rainfall patterns with the original 1-min resolution data (Section 2.4), and select typical areas (grids and subcatchments) with different underlying surface characteristics for analysis (Section 2.5). We evaluate the effect of TRR on simulation of flood processes (Section 2.6) and its variation with characteristics of rainfall and underlying surfaces. Results and discussion can be found in Section 3, followed by conclusions in Section 4.
2. Data and Methods
2.1. Study Area
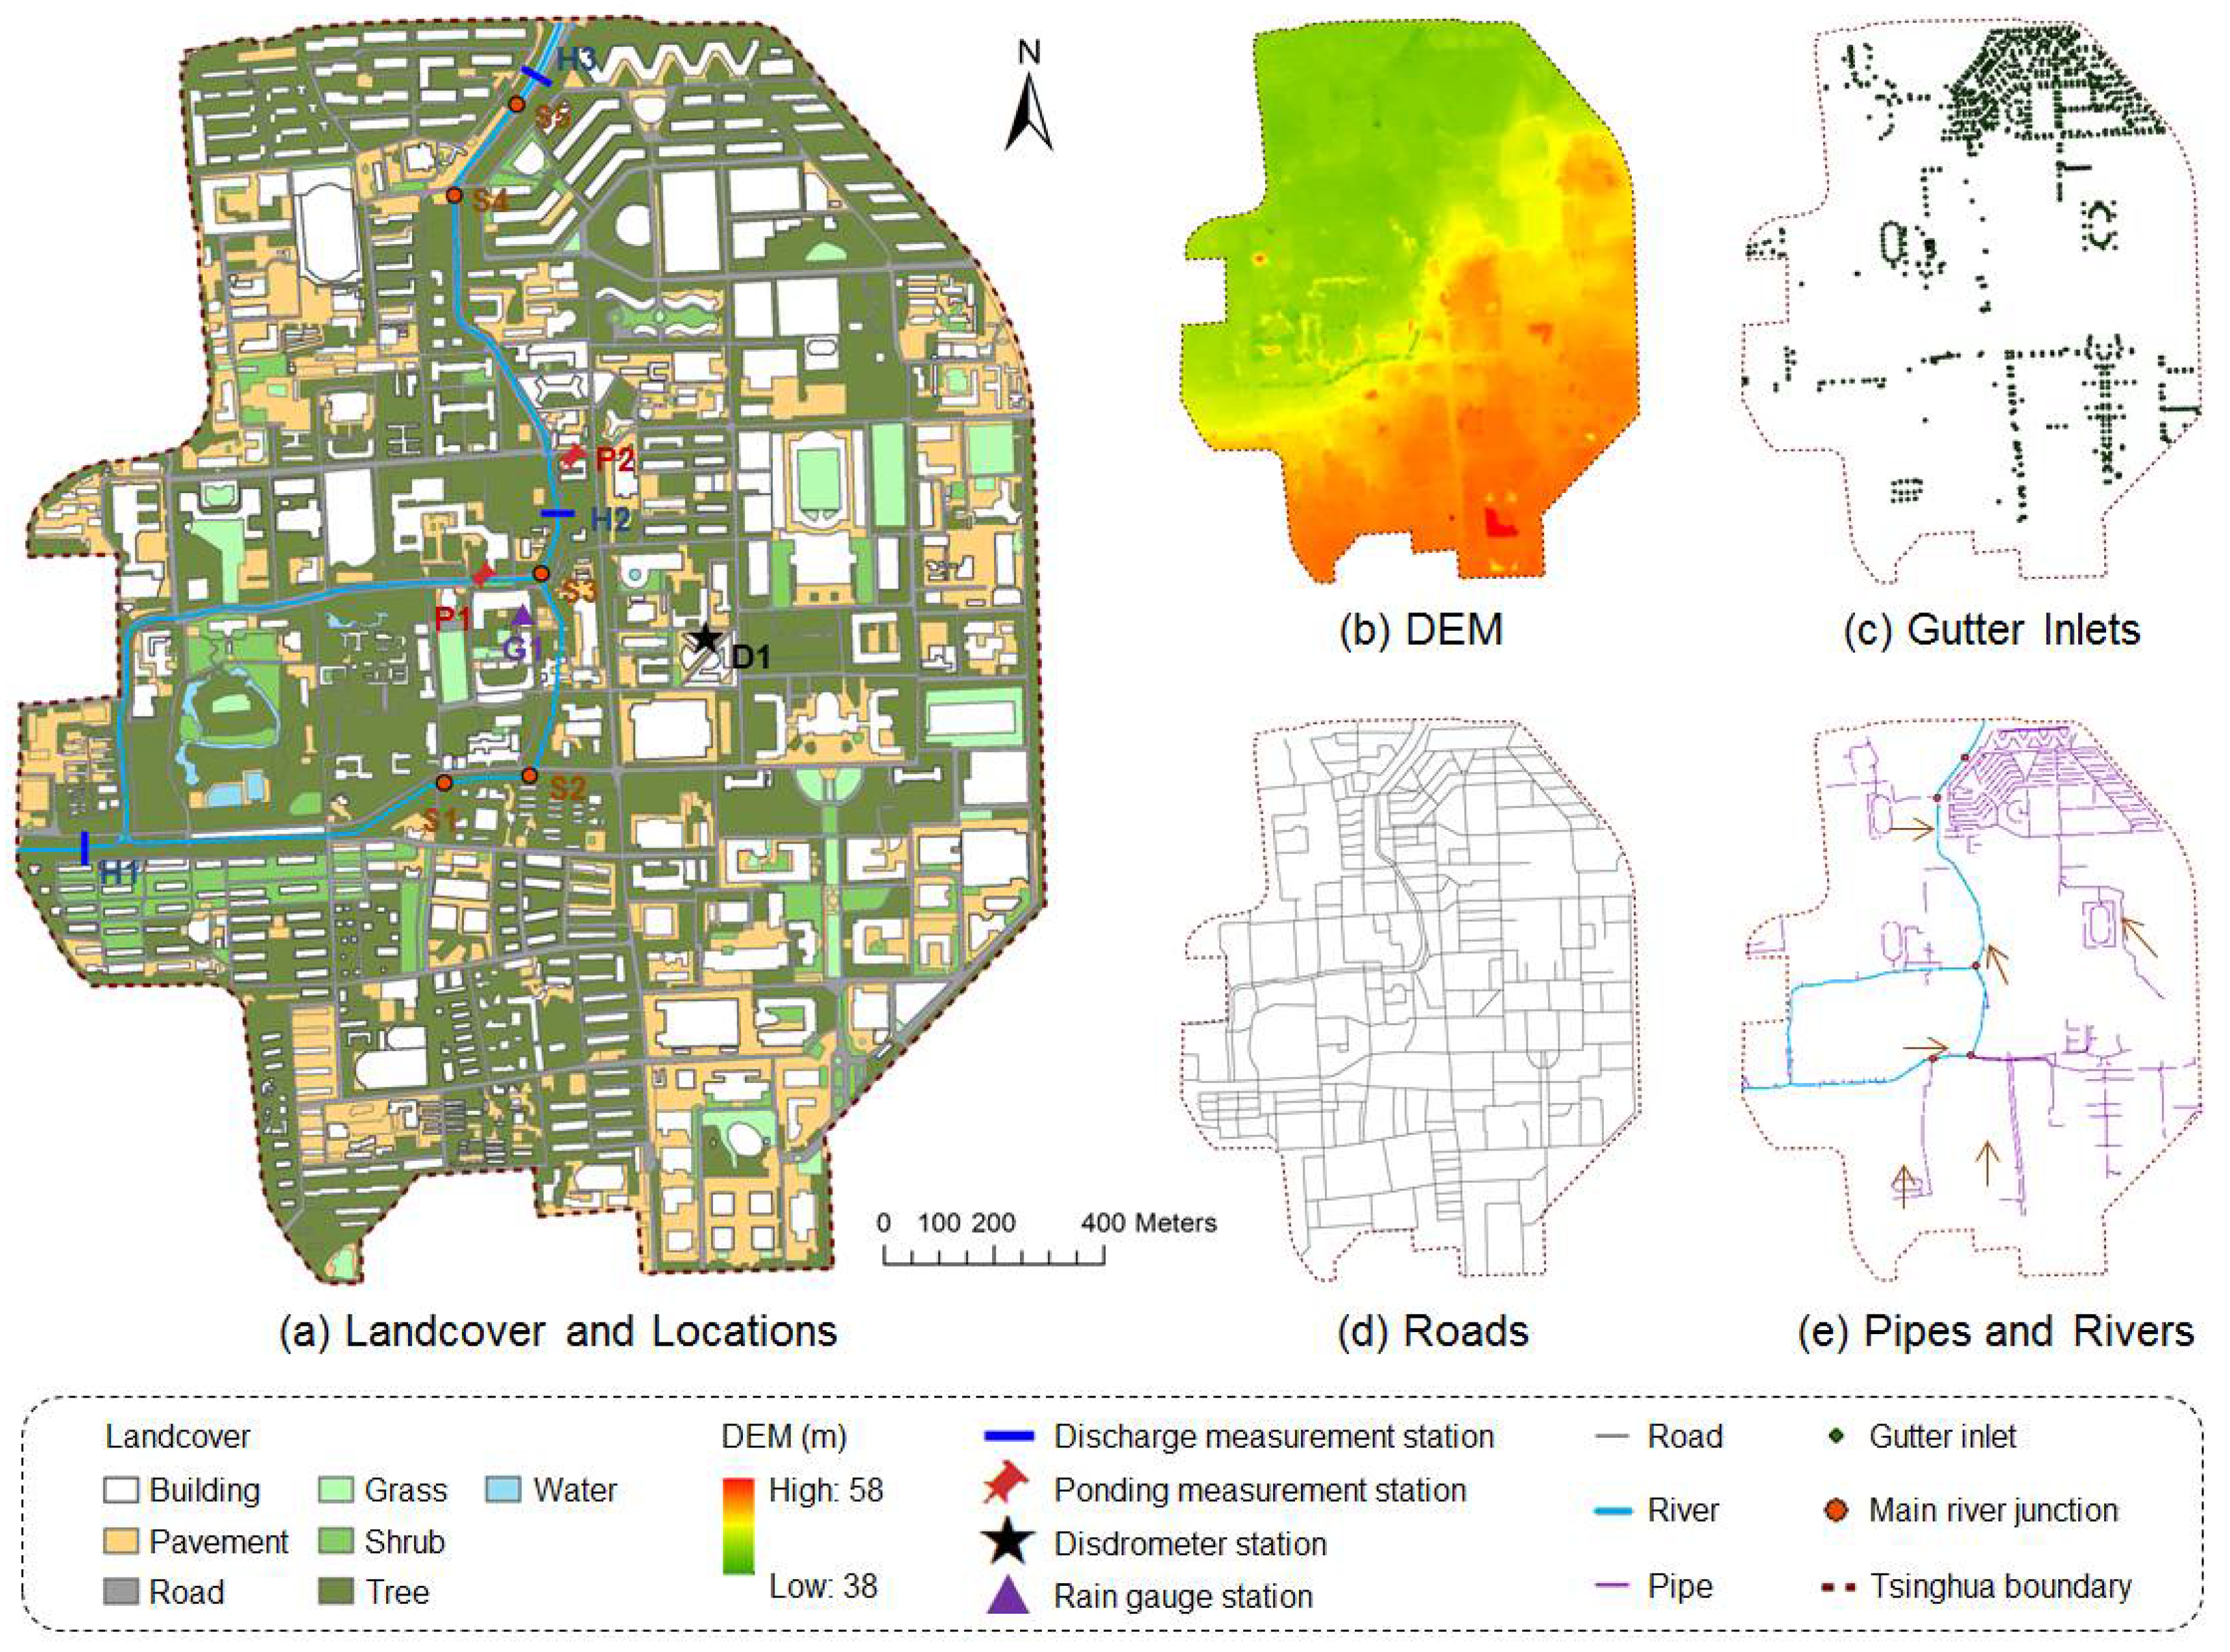
In this paper, we investigated the campus of Tsinghua University, an area of 3.26 km2, which is located in Haidian District, northwest of Beijing City. This area is separated from neighboring units by walls and thus forms a relatively independent area. Dense infrastructures such as buildings, roads, drainage pipe networks etc., are distributed over the campus (Figure 1a), and the average impervious degree of the underlying surface is 53% (similar as overall impervious degree of Beijing [33]). The topography of the area is high in the southeast and low in the northwest (Figure 1b). An artificial lining channel, Wanquan River, passes through the campus from west to north. Most of the runoff flows along the surface and drainage pipe networks and then drains into the river with a catchment area 2.40 km2, while the rest runoff drains into the municipal networks and flows out of the campus.
To represent the complex underlying conditions of the study area, a high-resolution dataset (Figure 1) consisting of land cover, DEM, gutter locations, road and pipe networks, were compiled in this study. The land cover data were created based on observations of high-resolution satellite images (0.8 m panchromatic/3.2 m multispectral), with a spatial resolution of 2 m and seven land cover types, including tree, shrub, grassland, water, road, pavement, and building. The surface elevation data were based on fine field measurements by professional team for more than 21,000 points. The DEM data were of 1 m spatial resolution and created by interpolation of the surface elevation data. The drainage pipe network data were provided by Tsinghua University, which consisted of pipes of a total length of 30 km and 1304 gutter inlets. The high-resolution dataset allowed the detailed stormwater modelling in the study.
2.2. Rainfall and Hydrological Data of High Temporal Resolution
The 1-min resolution rainfall data were collected using a disdrometer (OTT Parsivel2, made in Kempten, Germany) installed on the roof of a tall building in the campus (Figure 1). The observation period began in late August 2014, from which we selected 30 rainfall events for the analyses. Rainfall occurred with intervals of no more than 10 h was taken as one single event. Only events with rainfall depth exceeding 5 mm were picked up for this study. The characteristics of the 30 events are shown in Table 1. The event rainfall depth ranges from 5.5 mm to 196.3 mm, peak rainfall intensity varies from 0.10 mm·min−1 to 4.08 mm·min−1, and the duration spans from 100 min to 4613 min, covering the high temporal variability of actual rainfall in this region [1]. Compared with the observations from the rain gauge 350 m away (Figure 1 and Figure 2), the measurements by this disdrometer were then used as the representative rainfall data of the entire study area, in particular considering the small size of the area [10] and immediate proximity of the disdrometer site to the center of the study area.
Hydrological observations were carried out at three sections on the river, i.e., the inlet, the rear of the branch junction, and the outlet (Figure 1). The measurement items included water level, flow velocity, and flow rate using a non-contact open channel radar flowmeter (HZ-SVR-24Q, made in Shanghai, China) with an accuracy of 0.01 m·s−1 for flow velocity and 2 mm for water level. Four events have been recorded since late July 2017 and were used to calibrate and validate a detailed stormwater model (described in Section 2.3.3).
In addition, ponding depth measurements were collected using water level loggers (HOBO U20-001-04, made in Bourne, MA, USA), installed at the front and rear of the branch junction (Figure 1). Two events in August 2017 were recorded and used to validate the model (described in Section 2.3.3). The ponding process is another important proxy of performance of urban hydrodynamic models, which can also show the performance along some specific flow paths in urban area, in addition to at the outlet of catchment.
2.3. REDUS Model
2.3.1. Model Framework
A routing-enhanced detailed urban stormwater (REDUS) model was developed to account for complex urban flow paths and exploit high-resolution rainfall data. This model has four layers including surface, road network, pipe network, and river network (Figure 3). This structure takes advantage of the distributed urban drainage model [34] and the multi-level urban flooding model [35]. The model is grid-based, whose parameters for each grid, such as impervious degree, roughness etc., are derived from the detailed land cover information. After the rainfall infiltration and interception, the generated runoff, instead of flowing directly into the pipe network through main junctions, flows first in the road network and then drains into the pipe network from gutter inlets. Storing and draining process on sinks can also be calculated. At the end, runoff flows into rivers and gets discharged out of the study area.
One advantage of the REDUS model is the detailed formulation of urban hydrodynamic process with the help of high resolution data of underlying surfaces. Due to the fine grids and flexible consideration of flow within and between them, the calculation area discretization no longer relies on the drainage divisions. Based on the high-resolution DEM, flow paths can be determined automatically. The actual gutter inlets can serve as the water exchange channels between road and pipe networks, and the pipe data can be seamlessly incorporated in the model without any structural simplification.
The REDUS model adopts a modular concept, in which the calculation approaches can be selected flexibly for different research targets. Unlike traditional 1D-1D or 2D-1D (surface and pipe) models [25], REDUS model can be regarded as a 1D-1D-1D (surface, road ,and pipe) model, which finds a balance between accuracy and efficiency and is easy to be popularized.
2.3.2. Model Configuration
The whole campus was discretized into 1304 grids of 50 m × 50 m. In this simulation, the Green-Ampt model and the nonlinear reservoir model were set as the infiltration and surface concentration options in REDUS, respectively. The grid-to-grid overland flow was calculated by the D8 approach [36]. The draingage from sink grids occurred when their water table was higher than that of the neighboring road junctions at a rate determined by the water head difference. Based on the underlying and infrastructure data, the flow paths were determined by the topological relationship of the four layers. One-dimensional dynamic wave algorithm was used for water flows on roads, in pipes, and rivers, and the weir equation was used to calculate the inflow process of gully inlets. A zero-flux boundary was prescribed for the whole surface area considering the surrounding walls, and the river section in the northernmost was regarded as the main runoff outlet of the area. Since the simulations were performed for individual events rather than a continuous series, the river stage and soil moisture were set in dry states as the initial conditions. We used 1 min and 10 s as the integral time steps for hydrological and hydraulic simulations to maintain calculation accuracy and stability.
2.3.3. Model Calibration and Validation
The main parameters for grid runoff in the REDUS model include area size, flow width, impervious degree, slope, Manning’s roughness for impervious area, depression storage for pervious area, and infiltration related parameters. The flow routing parameters include roughness of road, pipe, and river. Since the model structure has already considered the complexity of the surface concentration, flow width can be set as the grid size directly. Besides, area size, impervious degree, and slope can be directly obtained from the underlying surface data. The parameters to be calibrated are Manning’s roughness, depression storage, infiltration related parameters and roughness in the multi-layer drainage systems. We set the initial value and range of parameters on basis of the following principles [37,38]. Firstly, Manning’s roughness and depression storage were set for each type of land cover, with values determined for each grid using the area-weighted method. Secondly, the backfill and compaction of urban soil were taken into account when setting infiltration related parameters, and the siltation situation were considered in setting roughness.
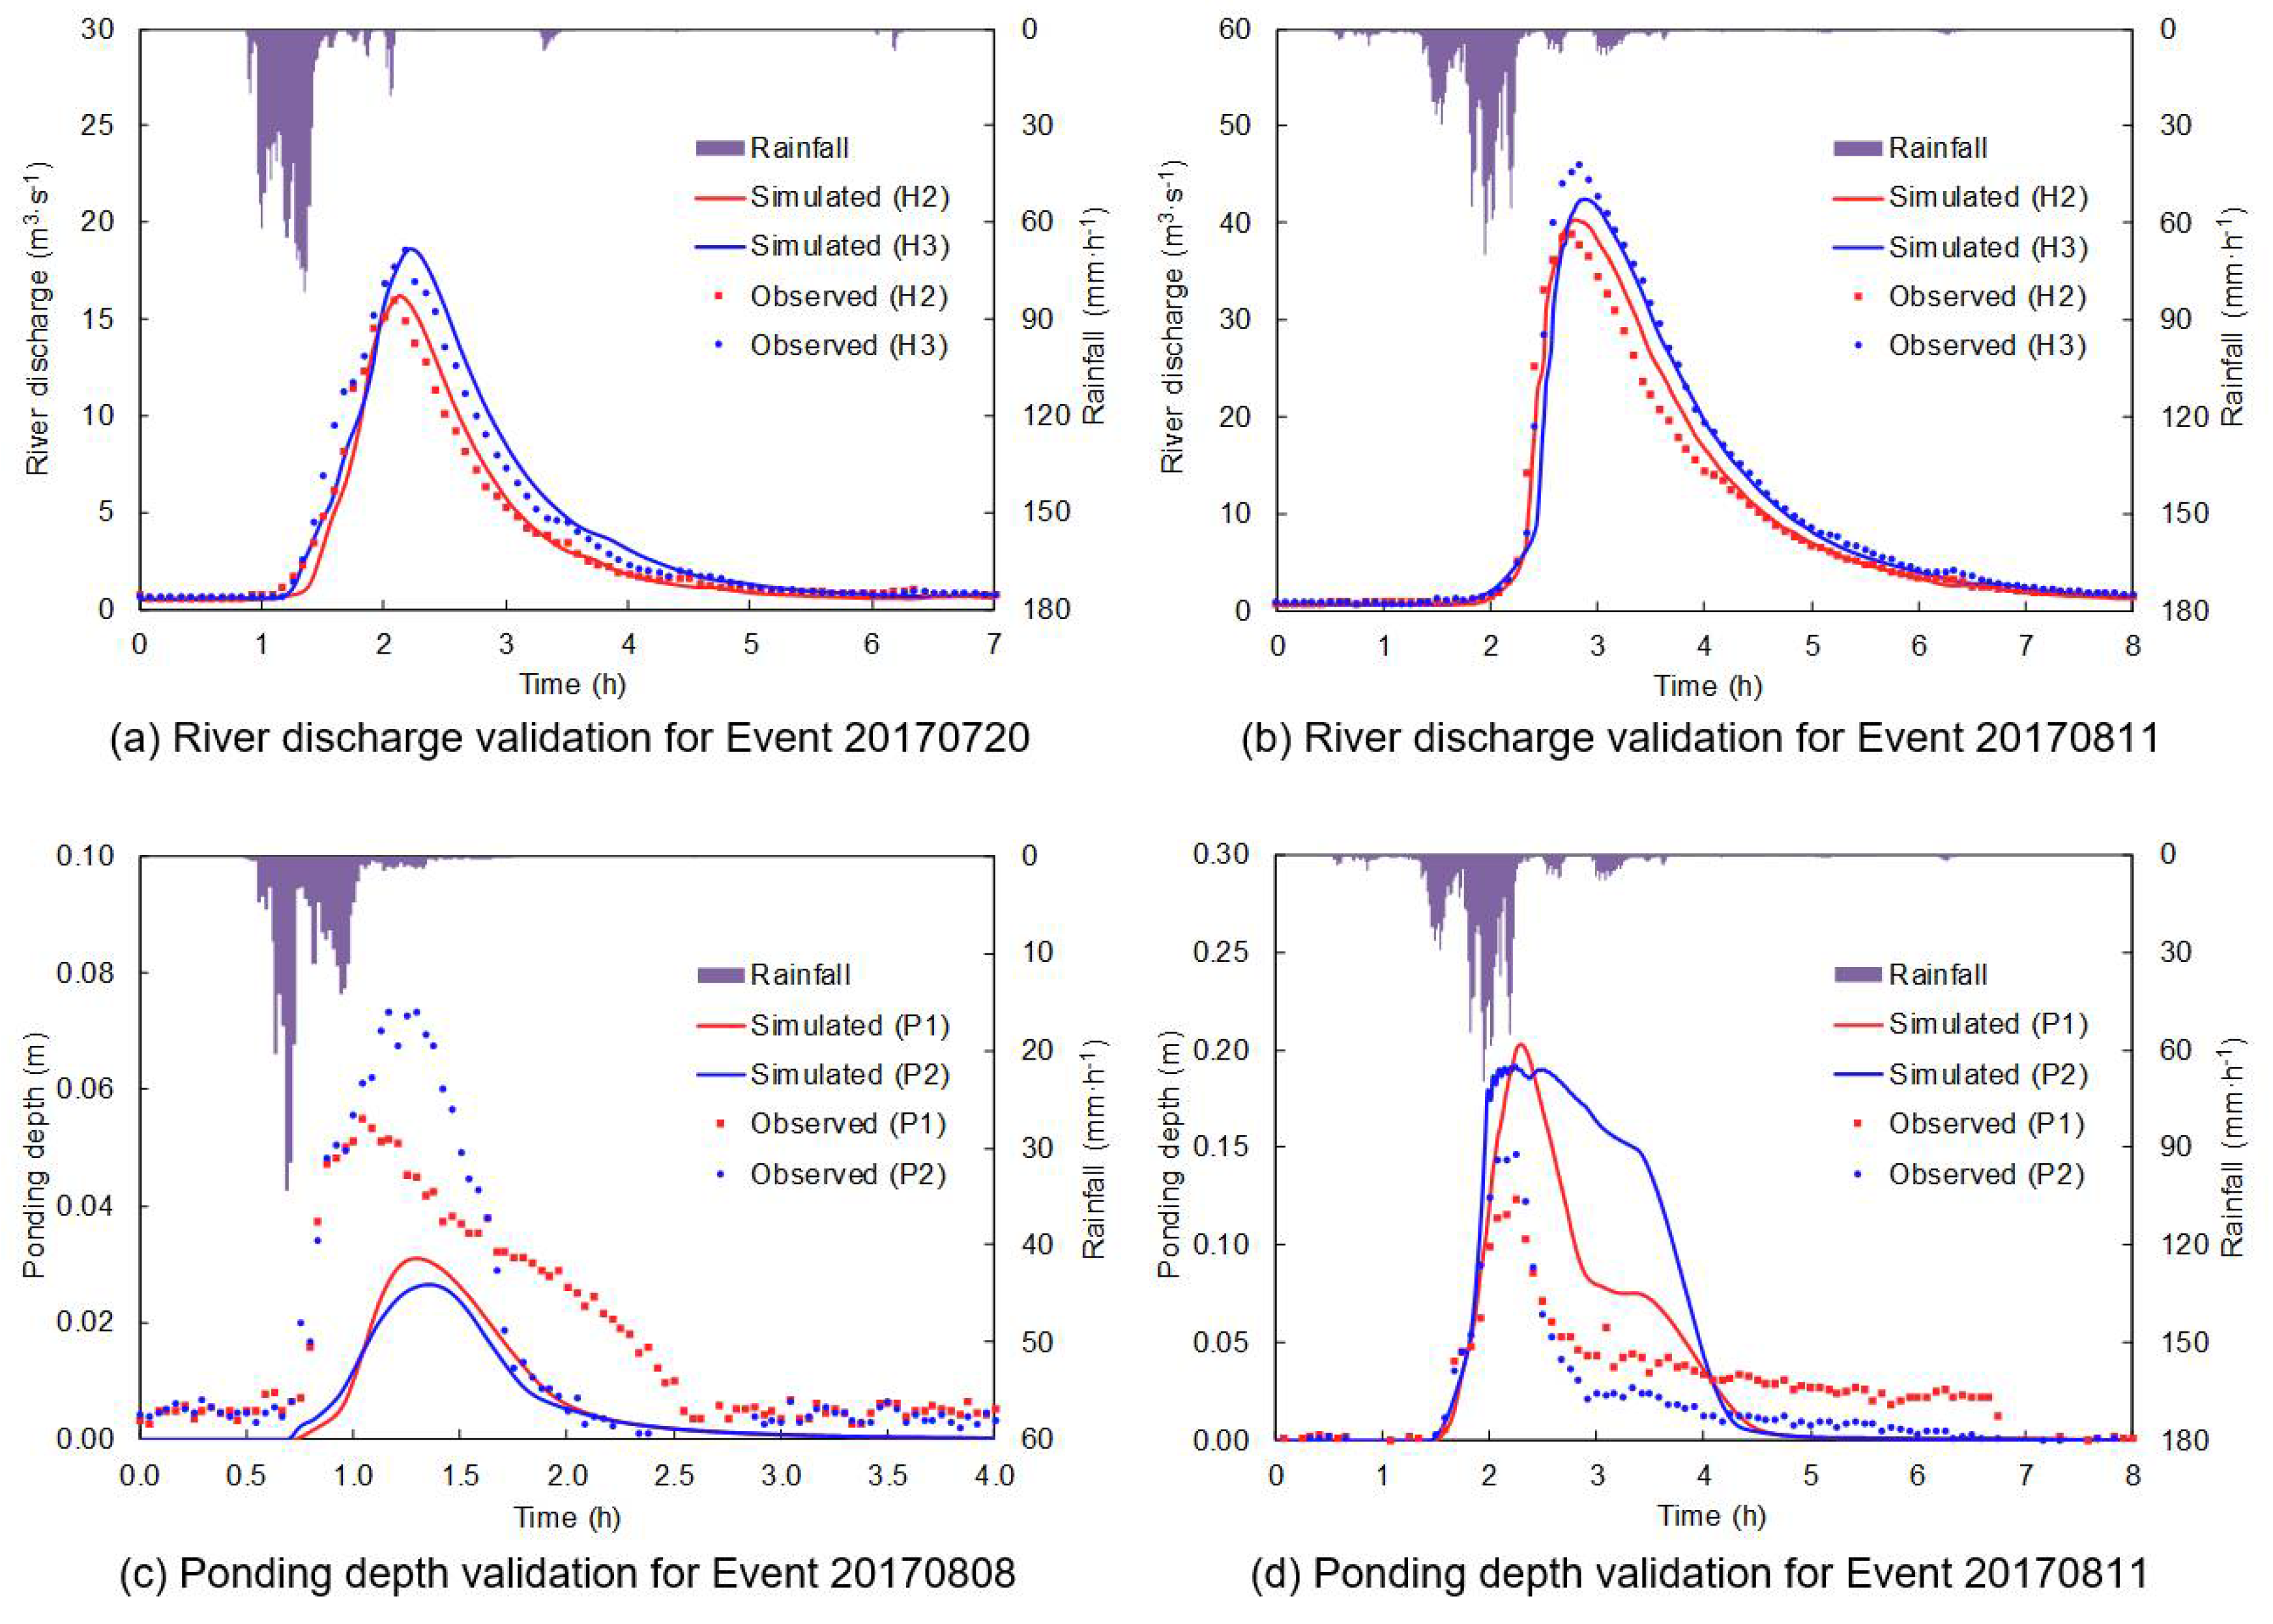
Five rainfall events with the measured hydrological data were used for calibration and validation (see characteristics in Table 1). We used river discharge data of Event 20170720 for manual calibration and the others for validation. Table 2 shows the calibration results of the parameters, and Figure 4 shows the partial results of the model calibration and validation at multi points. These results confirm that the simulation of river discharge is reasonably well, with Nash efficiency coefficient for all the events and points exceeding 0.88. Furthermore, the model can reproduce the rise and fall of ponding depth, with an average relative error of ponding duration about 20%. There is an obvious discrepancy of absolute value of ponding depth, most likely due to the insufficient consideration of local micro-topography in the model.
2.4. Characteristics of Rainfall Data and Upscaling
The 30 events with 1-min resolution rainfall were aggregated to obtain rainfall data at other resolutions, including 5 min, 10 min, 15 min, 20 min, 30 min, 60 min, and the whole duration [6,10,17,21]. Particularly, for the rainfall with the resolution of whole duration, it means the original rainfall process was replaced with the stable average rainfall intensity. As a result, we obtained 30 (events) × 8 (resolutions) rainfall sets, which were used as model inputs to evaluate the effect of TRR on simulation of flood processes.
The rainfall accuracy index (RAI), which is dimensionless, was employed to quantify how rainfall patterns change due to aggregation [28]. RAI is computed in the same method of computing Nash efficiency coefficient, which is used to evaluate the approximation between simulation and observation in order to examine the model’s accuracy. Here, the 1-min rainfall is taken as the observation value, and the upscaled rainfall time series are taken as the simulation value. RAI is calculated as follows:
where (mm·h−1) is the rainfall intensity of 1-min resolution at t time, (mm·h−1) is the rainfall intensity of m min resolution at t time, (mm·h−1) is the average intensity of 1-min rainfall, and T is the duration.
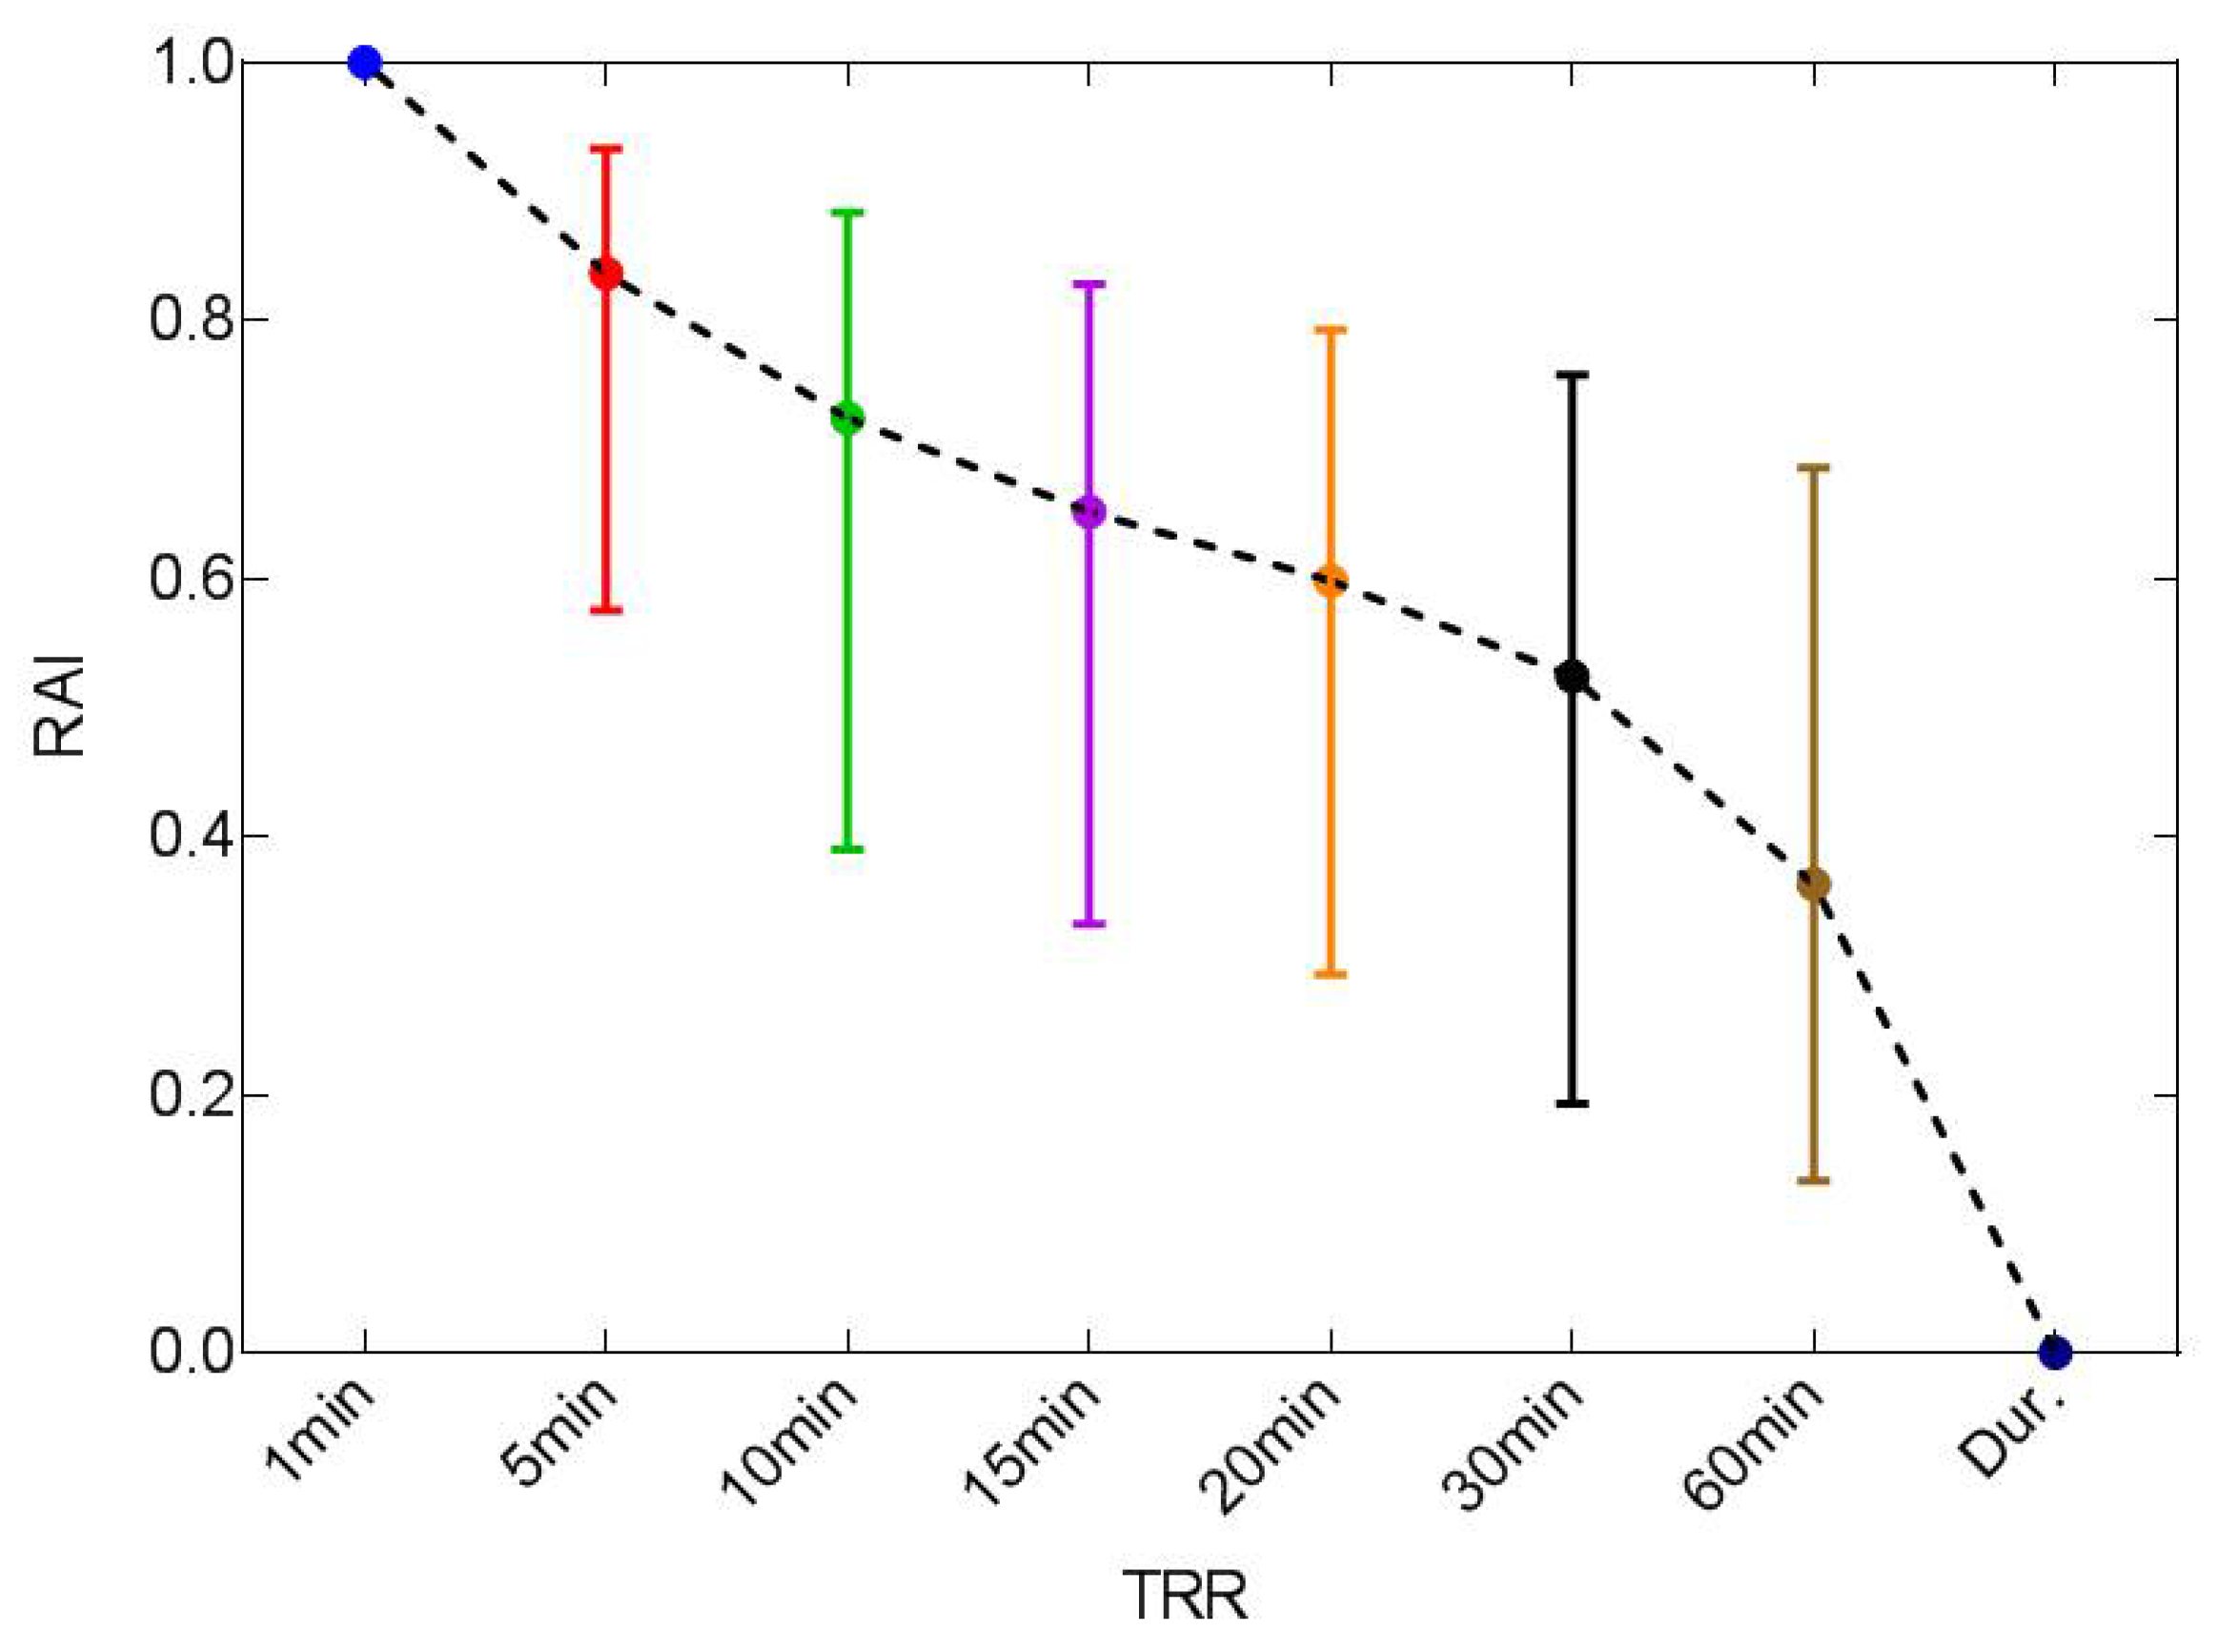
Figure 5 shows the relationship between RAI and resolution for the 30 events. Consistent with the definition of RAI, the RAI of 1-min rainfall is 1, and the RAI of the whole-duration resolution rainfall is 0. It can be seen that RAI decreases gradually from 1 to 0 as the resolution decreases from 1 min to the whole duration. The result suggests that the rainfall patterns change significantly with temporal resolution. For a specific rainfall resolution, RAI usually varies in a range approximately 0.4–0.6 for different events, showing the different variability of original 1-min rainfall. In general, RAI can be considered as a good indicator to quantify variations in rainfall patterns across different temporal resolutions.
2.5. Selection of Typical Areas with Different Underlying Surface Characteristics
To evaluate the effect of TRR along with different underlying surface characteristics, simulation results from the following two types of areas (characteristics refer to Table 3) were retrieved in the later analysis:
- (1)
- Grids without lateral inflow: Three groups of such grids with impervious degrees of 0%, 50%, and 100% were chosen with each group consists of 20 grids on average. As these grids are hydrologically isolated from adjacent grids without lateral inflow, only rainfall infiltration and concentration can occur and thus result in the same drainage area as grid size. The comparison of their runoff simulation results can indicate the relationship between the effect of TRR and impervious degree.
- (2)
- Subcatchments with outlets in the main river junctions: Five subcatchments were selected which drain to the corresponding junction points (S1–S5) in Figure 1, and their areas were identified up along the flow paths until reaching the source grids. The chosen subcatchments have different sizes in drainage areas but similar impervious degrees (the value of Subcatchment 1 is slightly lower than those of the other four, which will be discussed in Section 3.4). Therefore, the comparison of their discharge simulation results can indicate the relationship between the effect of TRR and drainage area.
2.6. Evaluation of the Effect of TRR
The simulation was conducted for 30 (events) × 8 (resolutions) rainfall sets. The relative error (RE), which is a dimensionless index, was applied to evaluate the effect of TRR. The results of original 1-min rainfall process were used as reference, and REs of other results for each event were computed, which is similar to the method used by Ochoa-Rodriguez et al. [5]. The evaluation items included volume and peak for gird runoff and subcatchment discharge. RE is calculated as follows:
where Qm can represent flood volume (m3) or flood peak (m3·s−1), in the rainfall resolution of m min; while Q1 represents its counterpart in the rainfall resolution of 1 min. RE < 0 suggests underestimated simulation results of flood due to the low resolution of rainfall. In this paper, we refer larger RE to a higher absolute value of RE if not stated otherwise.
3. Results and Discussion
3.1. Rainfall–Runoff Relationship at Grid Scale
The rainfall–runoff relationship was first analyzed at grid scale based on the simulation results of 1-min rainfall, which is necessary to understand the effect of TRR on urban flood process. The relationship between rainfall depth and runoff depth is shown in Figure 6a. Runoff depth increases substantially as rainfall depth increases. For the complete impervious grids (Group 3), runoff depth almost equals rainfall depth. In contrast, for the complete pervious grids (Group 1), runoff occurs only when rainfall exceeds a certain threshold (~30 mm in this case), and runoff is determined by both rainfall depth and rainfall pattern due to the associated infiltration process. For the 50% impervious grids (Group 2) mimicing the realistic surface condition, the runoff depth is between those of Groups 1 and 3. Therefore, the impervious degree is a key determinant in the relationship between rainfall depth and runoff depth.
Figure 6b shows the relationship between rainfall peak and runoff peak. Although runoff peak also tends to increase with rainfall peak, the correlation is not as strong as that between rainfall depth and runoff depth. This outcome is attributable to the fact that the transfer rate of peak is more related to the rainfall pattern. It is also observed that the runoff peak over more impervious grids is remarkably higher than that of less impervious ones.
It is noted that the study of rainfall–runoff relationship in this section is based on the observed rainfall scenarios, rather than the design scenarios. The design rainfall series of different return periods generally keep the rainfall pattern steady with the same frequency or ratio amplification, which will result in a better correlation between rainfall and runoff.
3.2. Effect of TRR at Grid Scale
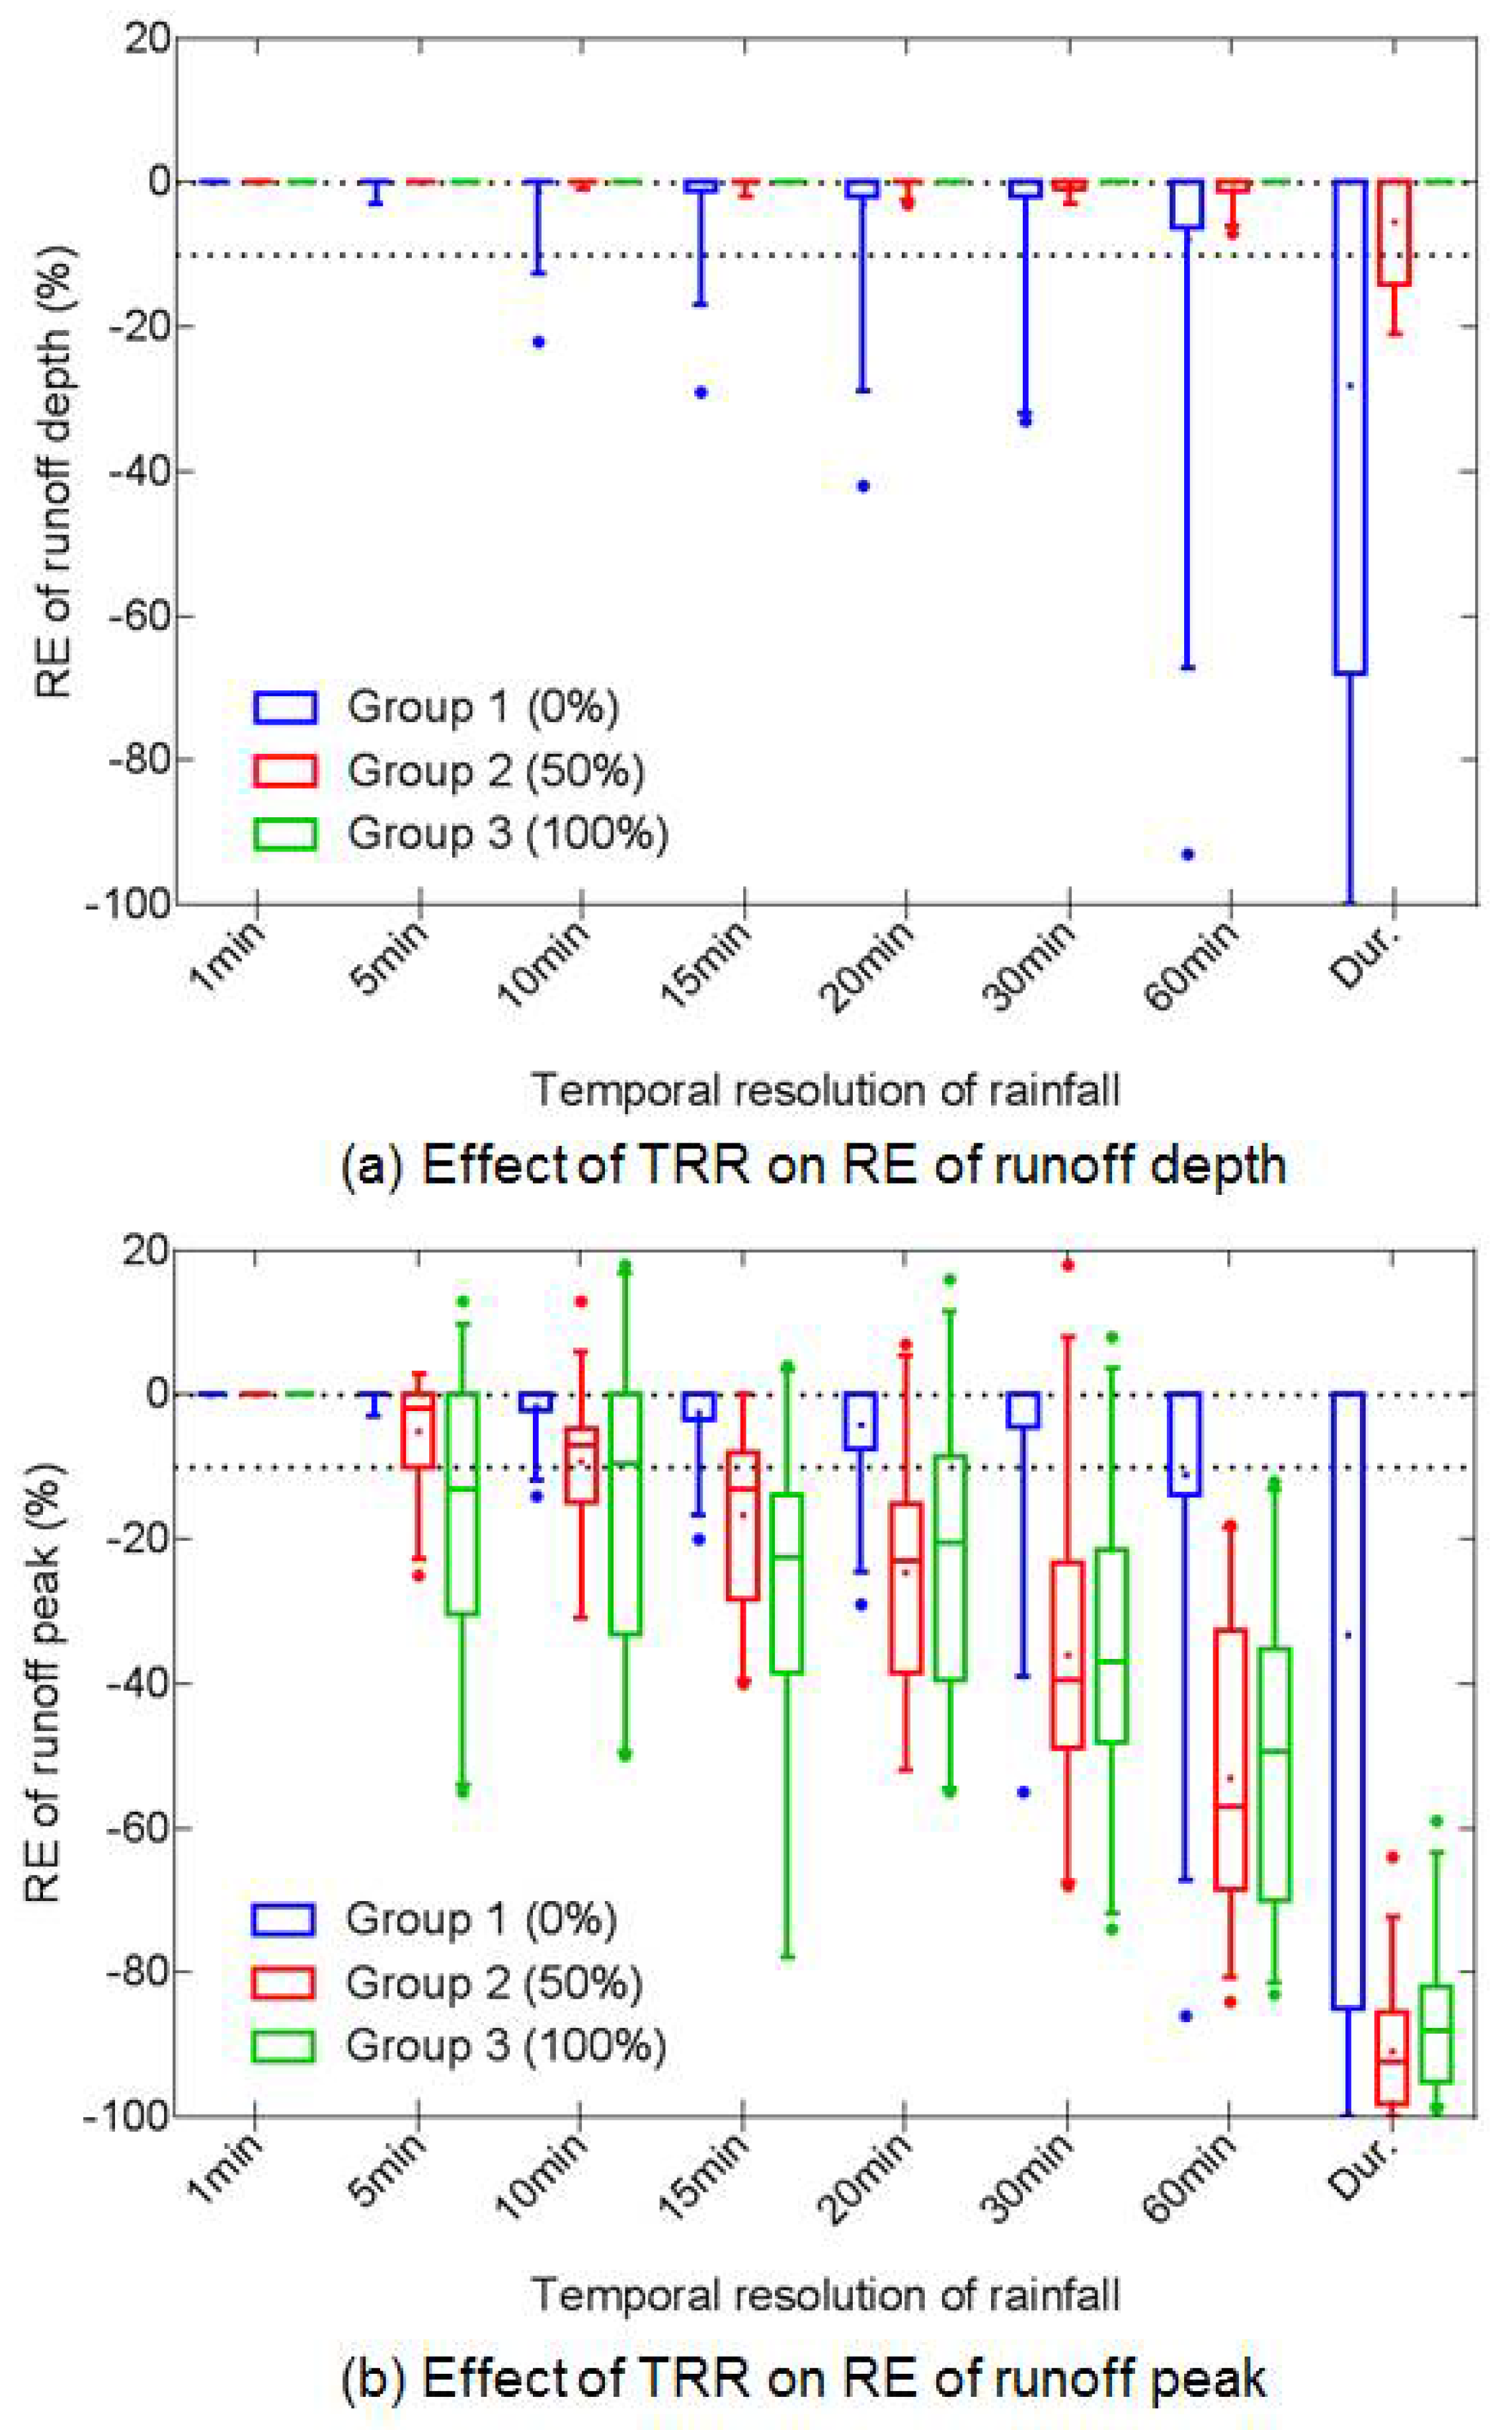
We examined the effects of TRR at gird scale on both runoff depth and runoff peak. TRR does not affect the results of the complete impervious grids in terms of runoff depth (Figure 7a). It is because runoff depth equals rainfall depth minus depression storage, which is determined by the water balance rather than the rainfall process. On the contrary, for the complete pervious grids, RE of runoff depth decreases with TRR due to the infiltration-excess runoff process that is more influenced by the detailed rainfall process. The results of 50% impervious grids are identical to those of Group 3, which indicates that most of the runoff depth comes from impervious subarea.
Compared to runoff depth, runoff peak shows higher sensitivity to TRR (Figure 7b). Runoff peaks of all the three groups tend to decrease with lower TRRs. The runoff peaks of impervious grids are more intensively affected by TRR than those of pervious grids, while the 50% and 100% impervious grids demonstrate similar responses to the varying TRR. The results confirm that for the urban grids dominated by impervious surfaces, fine rainfall data with a temporal resolution no lower than 5 min are needed to achieve a relative error within 10%.
In this section, it is demonstrated that runoff peak is sensitive to TRR, while runoff depth shows minimal influence of TRR, which is consistent with previous studies [5,6]. In addition, it emphasizes that the impervious degree, one of the crucial properties of urban areas for hydrologic cycle [39], has a strong effect on the sensitivity of runoff depth and peak to TRR.
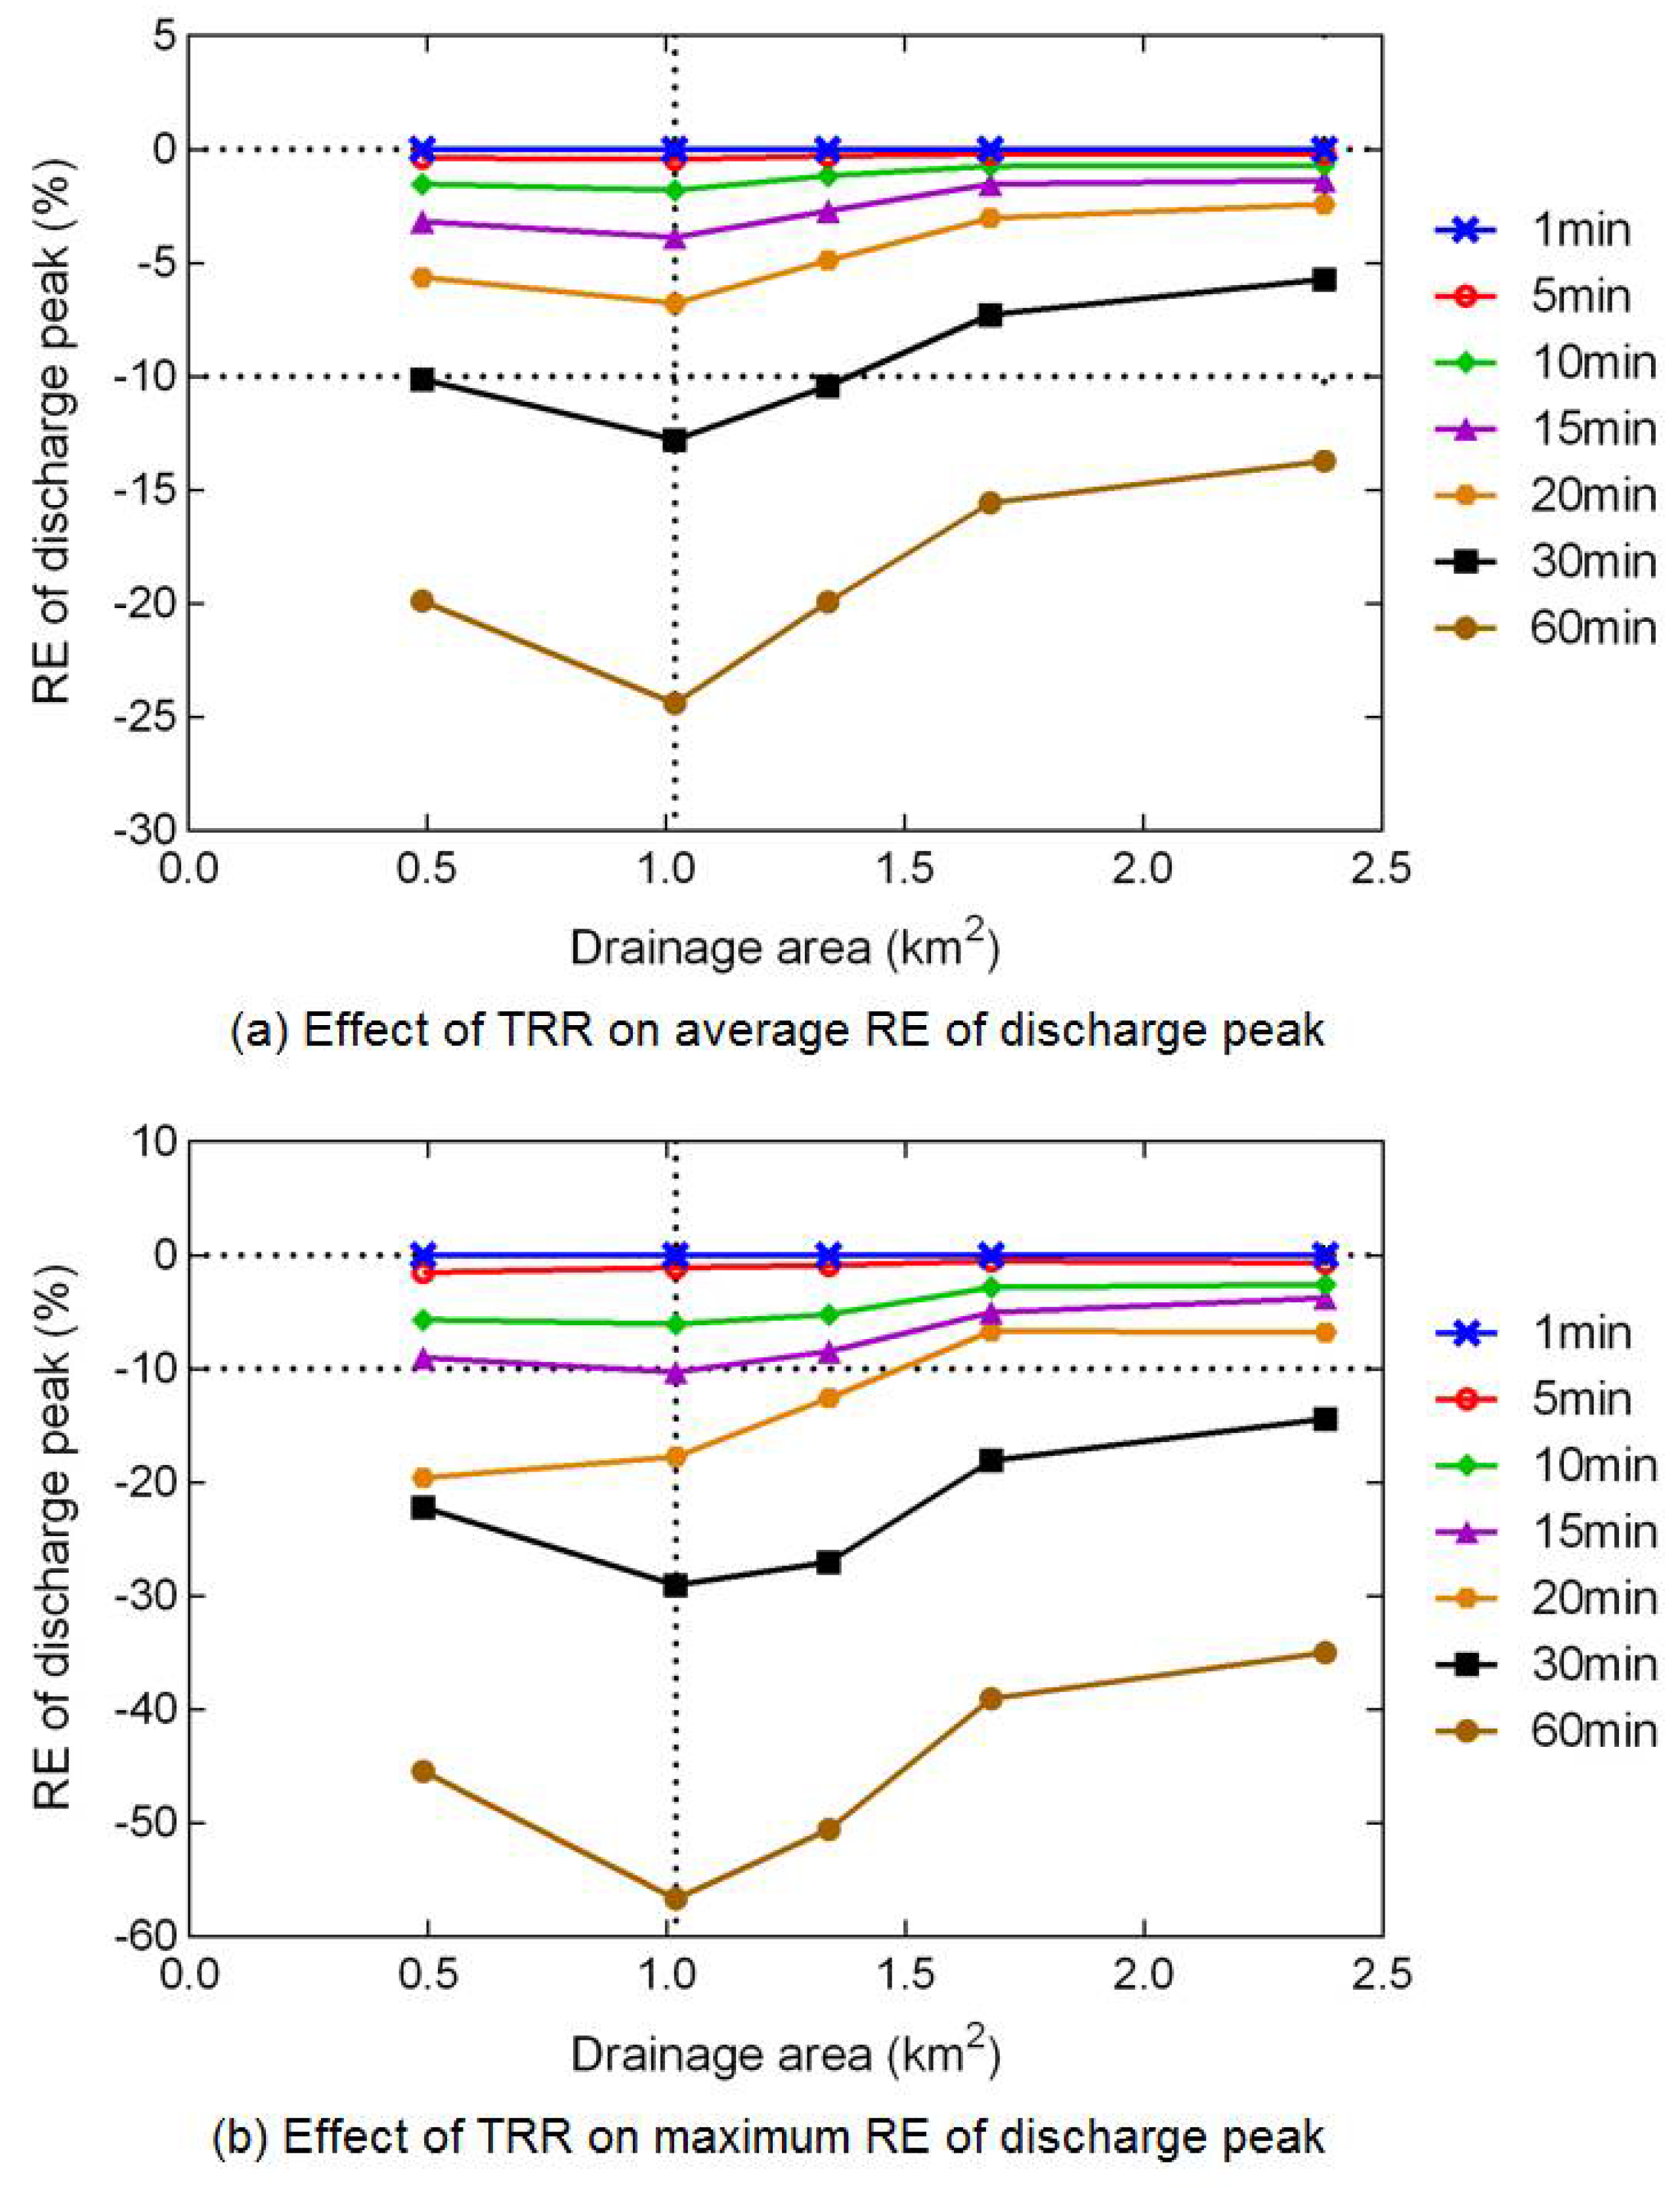
3.3. Effect of TRR at Subcatchment Scale
Compared with the flood process occurring in the grids, there are interactions between grids and in the multi-layer drainage system for subcatchment discharge. It is proved above that TRR has minimal effect on runoff depth, and the interactions mentioned above also affect it slightly, so the effect of TRR on the flood volume of subcatchments can be insignificant. Thus, in this section, we focus on the effect of TRR on flood peak, with the average effect shown in Figure 8a and the largest effect in Figure 8b.
The effect of TRR on the flood peak weakens as the discharge area increases, indicating the routing process can reduce the sensitivity of flood peak to TRR. Compared with other subcatchments, Subcatchment 1 shows less influence of TRR possibly due to its lower impervious degree. Meanwhile, it is pointed out here that the unknown effects of other characteristics of the underlying surfaces cannot be excluded. By comparing the average and largest effects, we find that the effect of TRR on discharge peak of subcatchments varies across different events, as suggested by the large difference between the average and maximum RE results. Overall, it is concluded that at least 15-min rainfall data are required to limit the relative error within 10%.
The variation in discharge peak with drainage area beyond 1 km2 is consistent with the previous studies [4,5,6,32]. Furthermore, this finding suggests that subcatchments smaller than 1 km2 can only represent the local conditions of underlying surfaces rather than the entire area, and the large variability of underlying characteristics (e.g., the impervious degree) can bring in large uncertainties to the effect of TRR. Further study needs to verify the threshold of the drainage area based on investigations of more sample watersheds.
3.4. Variation of Effect of TRR with the Characteristics of Rainfall and Underlying Surfaces
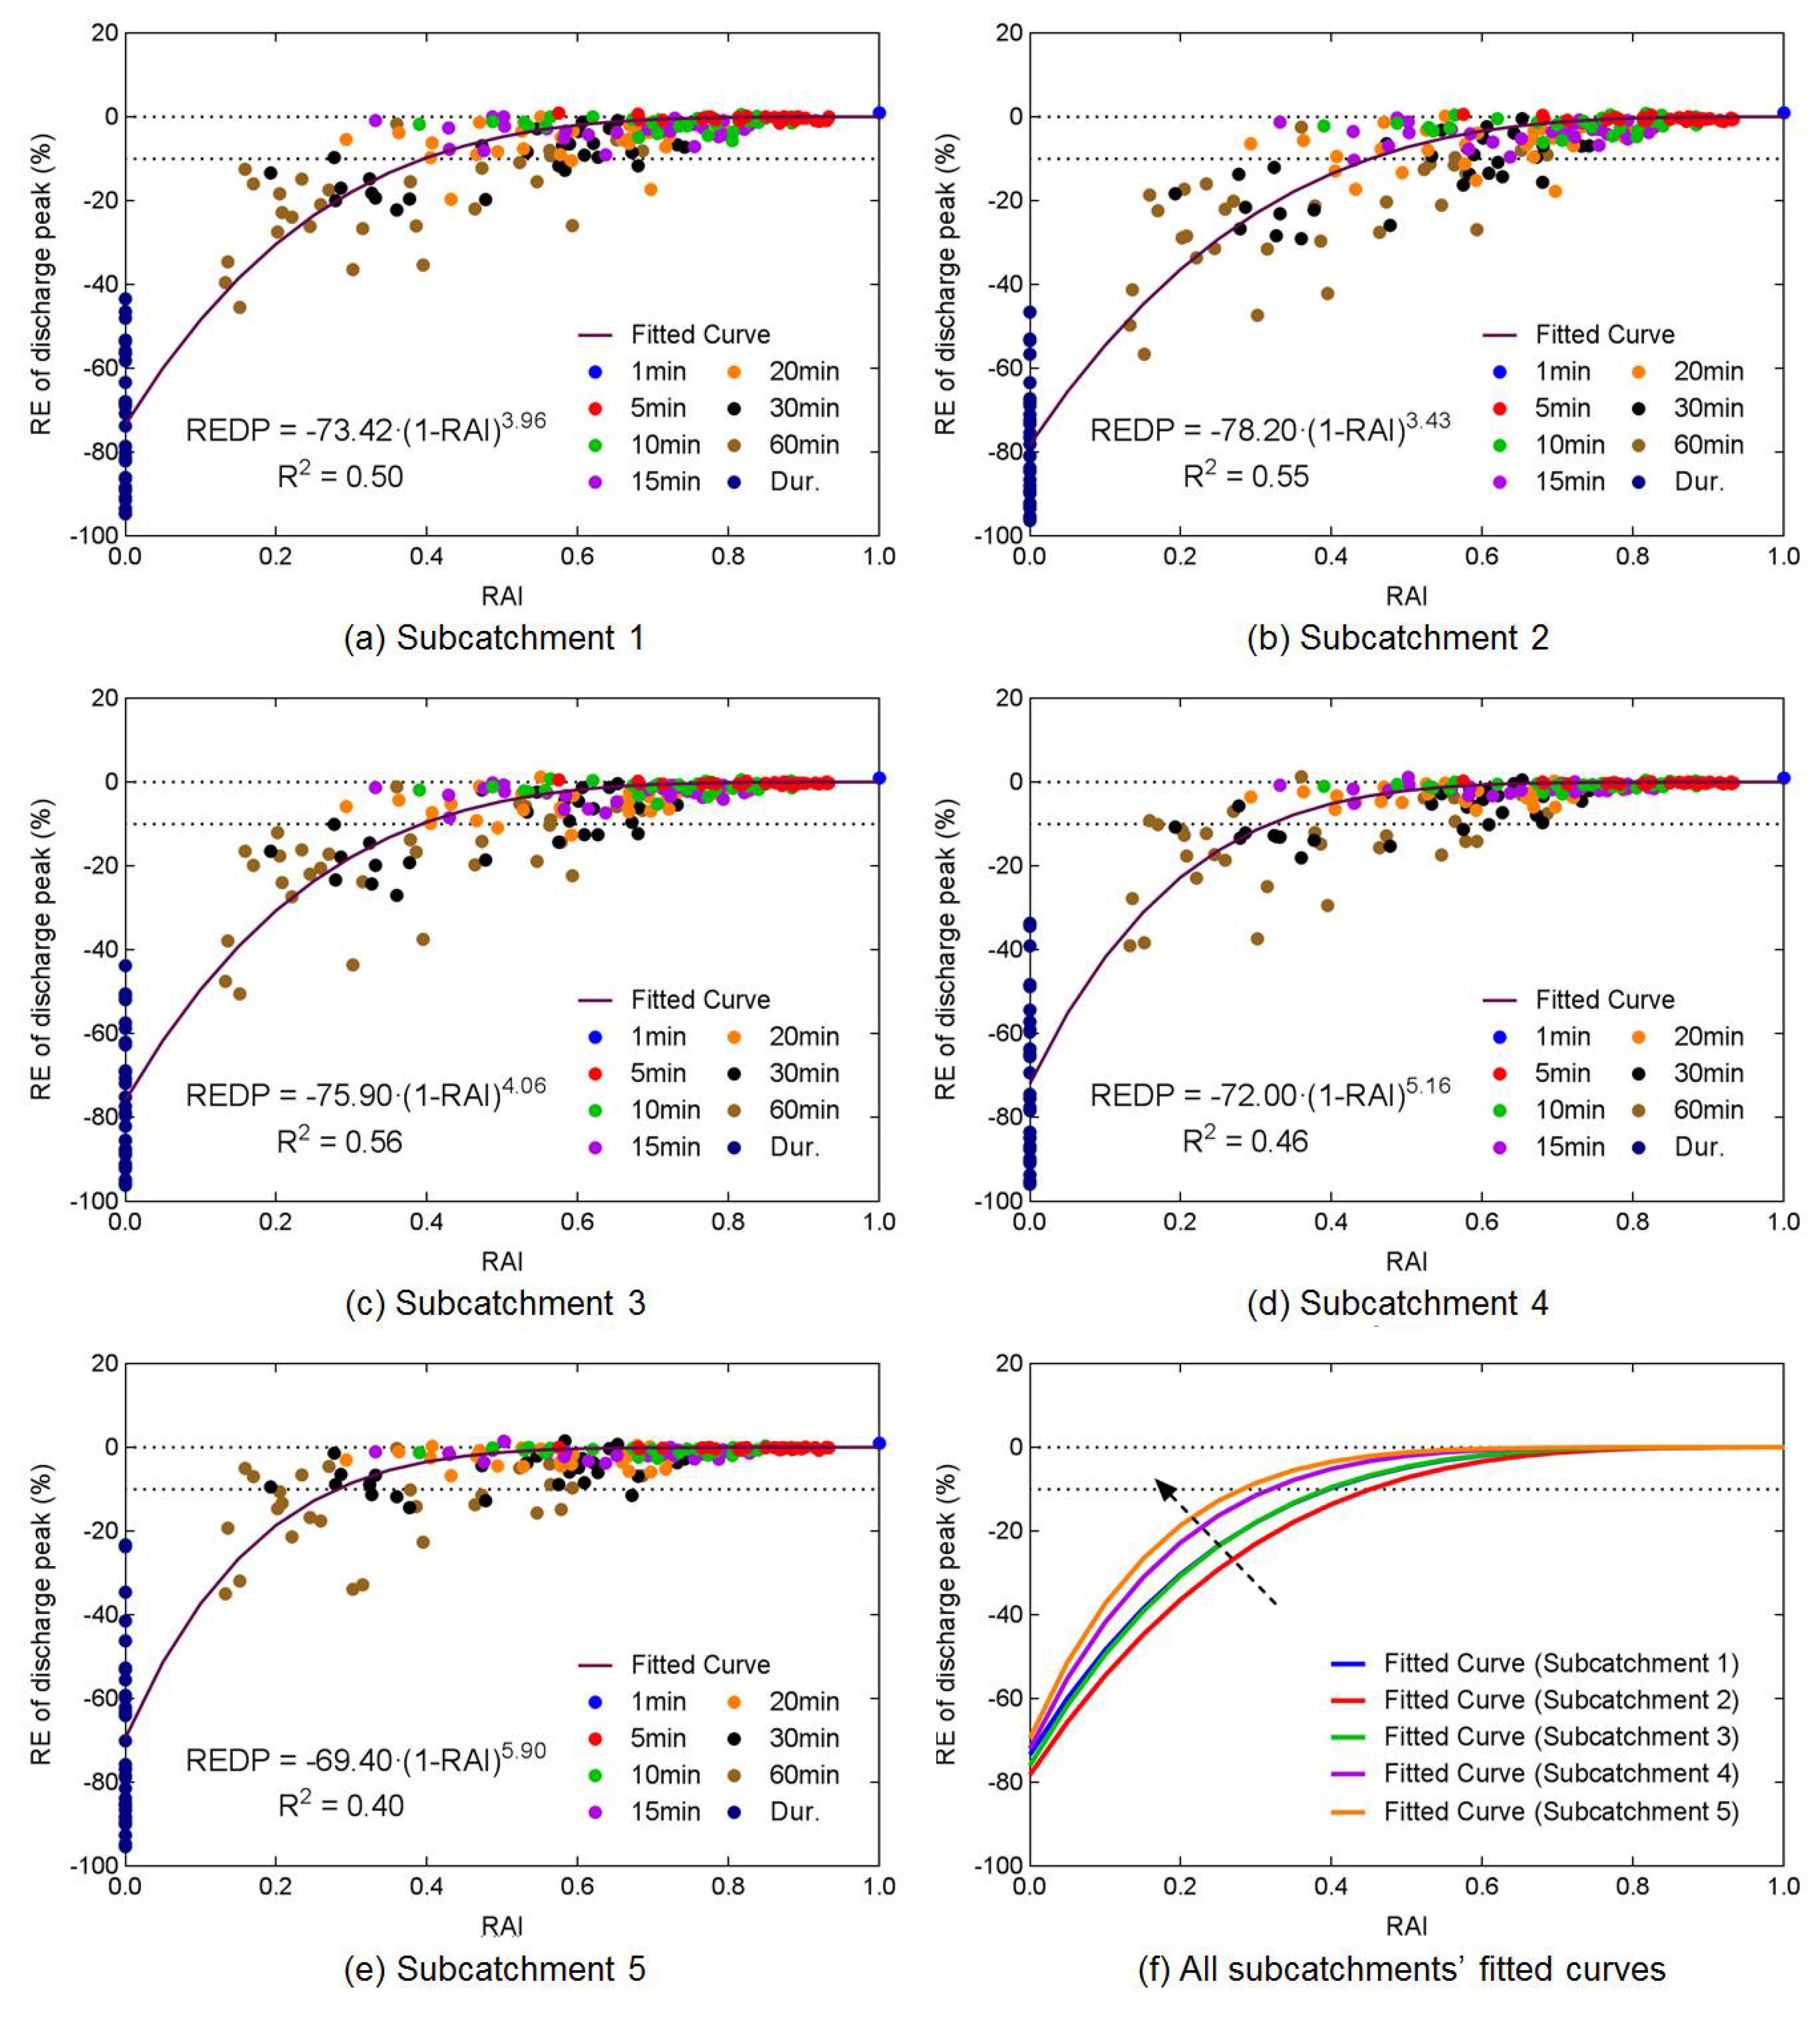
The above results show that the effect of TRR on simulation of urban flood processes, especially on flood peak, is closely related to the characteristics of rainfall and underlying surfaces. However, by simply using the depth or peak value to characterize the rainfall, we cannot find a good relationship between the effect of TRR and rainfall (similar to Yang et al. [6]). Instead, we used rainfall accuracy index (RAI) to quantify the effect of TRR on hyetograph for each event and then proposed a method to describe the relationship between the effect of TRR and the characteristics of rainfall and underlying surfaces.
The REs of discharge peak against RAIs of all rainfall series for the five subcatchments are shown in Figure 9a–e, respectively. There is an obvious trend that a smaller RAI (i.e., a less varying rainfall pattern) results in a lower discharge peak. According to the monotonic relationship between TRR and RAI (shown in Figure 5), the absolute value of RE of discharge peak increases as TRR decreases. For events of the same resolution, RE varies each other due to the different RAIs caused by the variability of original 1-min rainfall. For the most sensitive subcatchment, Subcatchment 2 in this study, an RAI smaller than 0.45 will lead to an RE with the absolute value larger than 10%.
An empirical power function is proposed to describe the relationship between RE of flood peak and RAI as follows:
where REDP (%) denotes the relative error of discharge peak. a and b are two dimensionless parameters related to the underlying characteristics: a (>0) represents the effect on discharge peak of using a stable rainfall process instead of the actual one, while b (>1) implies the sensitivity of discharge peak to rainfall pattern.
The fitted functions for each subcatchment are shown in Figure 9a–e, whose fitting performance is acceptable with coefficients of determination about 0.5 on average. a equals the average simulation result of the rainfall inputs of whole-duration resolution, and b is obtained by curve fitting using least square method. The five fitting curves are summarized in Figure 9f, from which the qualitative law of variation of a and b with the underlying surface characteristics can be obtained. When the drainage area is smaller until 1 km2 or the impervious degree is larger, a becomes larger and b becomes smaller, indicating a larger effect of TRR on discharge peak.
The empirical power function proposed here (i.e., Equation (3)) can illustrate the relationship between the effect of TRR (represented by REDP) and the characteristics of rainfall (represented by RAI) and underlying surfaces (represented by parameters a and b). However, there are still some limitations. It cannot explain the increase of flood peak for several scenarios and tends to underestimate the effect of TRR when the discrepancy of rainfall pattern is relatively small, i.e., RAI > 0.5. Further work need to focus on how to calculate a and b with the underlying surface characteristics quantitatively by multi-case study.
4. Conclusions
The responses of flood volume and peak to temporal resolution of rainfall (TRR) were studied. The focus was given to the campus of Tsinghua University, which covers an area of about 3 km2 and has typical urban characteristics and high-resolution rainfall, discharge, and land cover data. The proposed REDUS model is demonstrated to be capable of accounting for the complex urban flow paths. The main findings are summarized as follows:
- (1)
- For urban areas characterized by impervious surfaces, flood peak is sensitive to TRR while flood volume is generally not;
- (2)
- Flood peak can be underestimated with lower temporal resolution rainfall data. The biases between the discharge peak of very fine temporal resolution rainfall data and that of lower resolution data decrease with rainfall accuracy index (RAI, an index accounting for the match degree between the upscaled and original rainfall patterns). A power function is proposed to express this relationship, and a set of consistent curves are obtained for underlying surfaces of different characteristics;
- (3)
- Rainfall data of 5-min resolution for urban areas smaller than 1 km2, or at least 15-min resolution for larger area, are required to constrain the relative biases of flood peak within 10%.
Although the study is based on a single case study, we think the power function proposed will be valid for other regions, as the climate characteristics can be considered in the variation of RAI with TRR. Studies should be carried out with more cases of different climatic and topographic conditions to further verify the parameters used in the power function and the threshold of drainage area.
This study took advantages of high-resolution observation data sets, which yield insights into actual urban hydrological processes. Further work needs to be carried out, such as on the effects on hydrologic process of the spatial resolution of underlying surface properties and the coupling effects of both temporal and spatial characteristics of urban areas.
Author Contributions
Conceptualization, H.L. and G.N.; Data curation, H.L., X.C., and Y.M.; Funding acquisition, G.N. and F.T.; Methodology, H.L.; Software, H.L. and X.C.; Supervision, G.N.; Writing-original draft, H.L.; Writing-review & editing, G.N. and F.T.
Funding
This research was funded by Ministry of Science and Technology of the People’s Republic of China, grant number 2013DFG72270.
Acknowledgments
The land cover data were provided by the Northwest Institute of Eco-Environment and Resources, CAS. The digital terrain data and pipe data were provided by Tsinghua University. We would like to thank Binliang Lin of Tsinghua University for kindly providing the ponding depth data and thank Zhentao Cong of Tsinghua University for the rain gauge data. We appreciate the help of Tsinghua University and Shanghai Hangzheng Corporation in the hydrologic monitoring experiment. Further, we would like to thank Tongtiegang Zhao, Long Yang, Ting Sun and Fushan Wang for their contributions in writing assistance and thank the two anonymous reviewers and the editor whose comments led to great improvement of this paper.
Conflicts of Interest
The authors declare no conflict of interest.
References
- Yang, W.-Y.; Li, Z.; Sun, T.; Ni, G.-H. Better knowledge with more gauges? Investigation of the spatiotemporal characteristics of precipitation variations over the Greater Beijing Region. Int. J. Climatol. 2016, 36, 3607–3619. [Google Scholar] [CrossRef]
- Singh, V.P. Effect of spatial and temporal variability in rainfall and watershed characteristics on stream flow hydrograph. Hydrol. Process. 1997, 11, 1649–1669. [Google Scholar] [CrossRef]
- Cristiano, E.; ten Veldhuis, M.; van de Giesen, N. Spatial and temporal variability of rainfall and their effects on hydrological response in urban areas—A review. Hydrol. Earth Syst. Sci. 2017, 21, 3859–3878. [Google Scholar] [CrossRef]
- Ten Veldhuis, M.; Zhou, Z.; Yang, L.; Liu, S.; Smith, J. The role of storm scale, position and movement in controlling urban flood response. Hydrol. Earth Syst. Sci. 2018, 22, 417–436. [Google Scholar] [CrossRef] [Green Version]
- Ochoa-Rodriguez, S.; Wang, L.; Gires, A.; Pina, R.D.; Reinoso-Rondinel, R.; Bruni, G.; Ichiba, A.; Gaitan, S.; Cristiano, E.; van Assel, J.; et al. Impact of spatial and temporal resolution of rainfall inputs on urban hydrodynamic modelling outputs: A multi-catchment investigation. J. Hydrol. 2015, 531, 389–407. [Google Scholar] [CrossRef]
- Yang, L.; Smith, J.A.; Baeck, M.L.; Zhang, Y. Flash flooding in small urban watersheds: Storm event hydrologic response. Water Resour. Res. 2016, 52, 4571–4589. [Google Scholar] [CrossRef]
- Smith, B.K.; Smith, J.A.; Baeck, M.L.; Villarini, G.; Wright, D.B. Spectrum of storm event hydrologic response in urban watersheds. Water Resour. Res. 2013, 49, 2649–2663. [Google Scholar] [CrossRef] [Green Version]
- Wright, D.B.; Smith, J.A.; Baeck, M.L. Flood frequency analysis using radar rainfall fields and stochastic storm transposition. Water Resour. Res. 2014, 50, 1592–1615. [Google Scholar] [CrossRef] [Green Version]
- Cecinati, F.; de Niet, A.C.; Sawicka, K.; Rico-Ramirez, M.A. Optimal temporal resolution of rainfall for urban applications and uncertainty propagation. Water 2017, 9, 762. [Google Scholar] [CrossRef]
- Berne, A.; Delrieu, G.; Creutin, J.; Obled, C. Temporal and spatial resolution of rainfall measurements required for urban hydrology. J. Hydrol. 2004, 299, 166–179. [Google Scholar] [CrossRef]
- Emmanuel, I.; Andrieu, H.; Leblois, E.; Flahaut, B. Temporal and spatial variability of rainfall at the urban hydrological scale. J. Hydrol. 2012, 430–431, 162–172. [Google Scholar] [CrossRef]
- Krajewski, W.F.; Lakshmi, V.; Georgakakos, K.P.; Jain, S.C. A Monte Carlo study of rainfall sampling effect on a distributed catchment model. Water Resour. Res. 1991, 27, 119–128. [Google Scholar] [CrossRef]
- Ogden, F.L.; Julien, P.Y. Runoff sensitivity to temporal and spatial rainfall variability at runoff plane and small basin scales. Water Resour. Res. 1993, 29, 2589–2597. [Google Scholar] [CrossRef]
- Peleg, N.; Morin, E. Stochastic convective rain-field simulation using a high-resolution synoptically conditioned weather generator (HiReS-WG). Water Resour. Res. 2014, 50, 2124–2139. [Google Scholar] [CrossRef] [Green Version]
- Peleg, N.; Fatichi, S.; Paschalis, A.; Molnar, P.; Burlando, P. An advanced stochastic weather generator for simulating 2-D high-resolution climate variables. J. Adv. Model. Earth Syst. 2017, 9, 1595–1627. [Google Scholar] [CrossRef] [Green Version]
- Benoit, L.; Allard, D.; Mariethoz, G. Stochastic rainfall modelling at sub-kilometer scale. Water Resour. Res. 2018. [Google Scholar] [CrossRef]
- Bruni, G.; Reinoso, R.; van de Giesen, N.C.; Clemens, F.H.L.R.; ten Veldhuis, J.A.E. On the sensitivity of urban hydrodynamic modelling to rainfall spatial and temporal resolution. Hydrol. Earth Syst. Sci. 2015, 19, 691–709. [Google Scholar] [CrossRef] [Green Version]
- Rafieeinasab, A.; Norouzi, A.; Kim, S.; Habibi, H.; Nazari, B.; Seo, D.; Lee, H.; Cosgrove, B.; Cui, Z. Toward high–resolution flash flood prediction in large urban areas—Analysis of sensitivity to spatiotemporal resolution of rainfall input and hydrologic modeling. J. Hydrol. 2015, 531, 370–388. [Google Scholar] [CrossRef]
- Peleg, N.; Blumensaat, F.; Molnar, P.; Fatichi, S.; Burlando, P. Partitioning the impacts of spatial and climatological rainfall variability in urban drainage modeling. Hydrol. Earth Syst. Sci. 2017, 21, 1559–1572. [Google Scholar] [CrossRef]
- Song, Y.; Han, D.; Rico-Ramirez, M.A. High temporal resolution rainfall rate estimation from rain gauge measurements. J. Hydroinform. 2017, 19, 930–941. [Google Scholar] [CrossRef] [Green Version]
- Notaro, V.; Fontanazza, C.M.; Freni, G.; Puleo, V. Impact of rainfall data resolution in time and space on the urban flooding evaluation. Water Sci. Technol. 2013, 68, 1984–1993. [Google Scholar] [CrossRef] [PubMed]
- Thorndahl, S.; Einfalt, T.; Willems, P.; Nielsen, J.E.; ten Veldhuis, M.; Arnbjerg-Nielsen, K.; Rasmussen, M.R.; Molnar, P. Weather radar rainfall data in urban hydrology. Hydrol. Earth Syst. Sci. 2017, 21, 1359–1380. [Google Scholar] [CrossRef] [Green Version]
- Müller, H.; Haberlandt, U. Temporal rainfall disaggregation using a multiplicative cascade model for spatial application in urban hydrology. J. Hydrol. 2018, 556, 847–864. [Google Scholar] [CrossRef]
- Wright, D.B.; Smith, J.A.; Villarini, G.; Baeck, M.L. Long-term high-resolution radar rainfall fields for urban hydrology. J. Am. Water Resour. Assoc. 2014, 50, 713–734. [Google Scholar] [CrossRef]
- Fletcher, T.D.; Andrieu, H.; Hamel, P. Understanding, management and modelling of urban hydrology and its consequences for receiving waters: A state of the art. Adv. Water Resour. 2013, 51, 261–279. [Google Scholar] [CrossRef]
- Elga, S.; Jan, B.; Okke, B. Hydrological modelling of urbanized catchments: A review and future directions. J. Hydrol. 2015, 529, 62–81. [Google Scholar] [CrossRef]
- Emmanuel, I.; Andrieu, H.; Leblois, E.; Janey, N.; Payrastre, O. Influence of rainfall spatial variability on rainfall-runoff modelling: Benefit of a simulation approach? J. Hydrol. 2015, 531, 337–348. [Google Scholar] [CrossRef]
- Aronica, G.; Freni, G.; Oliveri, E. Uncertainty analysis of the influence of rainfall time resolution in the modelling of urban drainage systems. Hydrol. Process. 2005, 19, 1055–1071. [Google Scholar] [CrossRef]
- Aronica, G.; Cannarozzo, M. Studying the hydrological response of urban catchments using a semi-distributed linear non-linear model. J. Hydrol. 2000, 238, 35–43. [Google Scholar] [CrossRef]
- Meselhe, E.A.; Habib, E.H.; Oche, O.C.; Gautam, S. Sensitivity of conceptual and physically based hydrologic models to temporal and spatial rainfall sampling. J. Hydrol. Eng. 2009, 14, 711–720. [Google Scholar] [CrossRef]
- Gires, A.; Giangola-Murzyn, A.; Abbes, J.; Tchiguirinskaia, I.; Schertzer, D.; Lovejoy, S. Impacts of small scale rainfall variability in urban areas: A case study with 1D and 1D/2D hydrological models in a multifractal framework. Urban Water J. 2014, 12, 607–617. [Google Scholar] [CrossRef]
- Gires, A.; Onof, C.; Maksimovic, C.; Schertzer, D.; Tchiguirinskaia, I.; Simoes, N. Quantifying the impact of small scale unmeasured rainfall variability on urban runoff through multifractal downscaling: A case study. J. Hydrol. 2012, 442–443, 117–128. [Google Scholar] [CrossRef]
- Qiao, K.; Zhu, W.; Hu, D.; Hao, M.; Chen, S.; Cao, S. Examining the distribution and dynamics of impervious surface in different function zones in Beijing. J. Geogr. Sci. 2018, 28, 669–684. [Google Scholar] [CrossRef]
- Pan, A.; Hou, A.; Tian, F.; Ni, G.; Hu, H. Hydrologically enhanced distributed urban drainage model and its application in Beijing city. J. Hydrol. Eng. 2012, 17, 667–678. [Google Scholar] [CrossRef]
- Li, D.; Wang, X.; Xie, Y.; Chen, J.; Tian, Y.; Chen, W.; Cai, X. A multi-level and modular model for simulating the urban flooding and its application to Tianjin City. Nat. Hazards 2016, 82, 1947–1965. [Google Scholar] [CrossRef]
- Jenson, S.K.; Domingue, J.O. Extracting topographic structure from digital elevation data for geographic information-system analysis. Photogramm. Eng. Remote Sens. 1988, 54, 1593–1600. [Google Scholar]
- Krebs, G.; Kokkonen, T.; Valtanen, M.; Koivusalo, H.; Setala, H. A high resolution application of a stormwater management model (SWMM) using genetic parameter optimization. Urban Water J. 2013, 10, 394–410. [Google Scholar] [CrossRef]
- Rossman, L.A. Storm Water Management Model User’s Manual, 5.1 ed.; U.S. Environmental Protection Agency: Cincinnati, OH, USA, 2015; pp. 178–184. [Google Scholar]
- Schueler, T.R.; Fraley-McNeal, L.; Cappiella, K. Is impervious cover still important? Review of recent research. J. Hydrol. Eng. 2009, 14, 309–315. [Google Scholar] [CrossRef]
Figure 1.
Underlying and drainage conditions of the study area, signed with the locations of measurement points and main river junctions. The arrows in (e) show the main flow directions.
Figure 1.
Underlying and drainage conditions of the study area, signed with the locations of measurement points and main river junctions. The arrows in (e) show the main flow directions.

Figure 2.
Comparison of rainfall data observed by the disdrometer and the rain gauge, with a 1:1 line drawn as reference.
Figure 2.
Comparison of rainfall data observed by the disdrometer and the rain gauge, with a 1:1 line drawn as reference.

Figure 3.
Framework of the routing-enhanced detailed urban stormwater (REDUS) model.

Figure 4.
Model validation for river discharge and surface ponding depth.

Figure 5.
Variation of the rainfall accuracy index (RAI) with the temporal resolution of rainfall (TRR). The dots and vertical bars show the mean and variation of results from the 30 events.
Figure 5.
Variation of the rainfall accuracy index (RAI) with the temporal resolution of rainfall (TRR). The dots and vertical bars show the mean and variation of results from the 30 events.

Figure 6.
Urban rainfall–runoff relationship at grid scale considering the impervious degree. (a) shows rainfall depth to runoff depth, and (b) shows rainfall peak to runoff peak. The average runoff results of each group are used for every event, with a 1:1 line drawn as reference.
Figure 6.
Urban rainfall–runoff relationship at grid scale considering the impervious degree. (a) shows rainfall depth to runoff depth, and (b) shows rainfall peak to runoff peak. The average runoff results of each group are used for every event, with a 1:1 line drawn as reference.

Figure 7.
Effect of TRR at grid scale considering the impervious degree. (a) shows the effect of runoff depth, and (b) shows the effect of runoff peak. Note that the boxplots’ whiskers mean 5–95% of all the 30 events’ results, and points beyond the range are marked as outliers.
Figure 7.
Effect of TRR at grid scale considering the impervious degree. (a) shows the effect of runoff depth, and (b) shows the effect of runoff peak. Note that the boxplots’ whiskers mean 5–95% of all the 30 events’ results, and points beyond the range are marked as outliers.

Figure 8.
Effect of TRR at subcatchment scale considering the drainage area, for all the 30 events. (a) shows the average effect, and (b) shows the largest effect.
Figure 8.
Effect of TRR at subcatchment scale considering the drainage area, for all the 30 events. (a) shows the average effect, and (b) shows the largest effect.

Figure 9.
Relationship between the effect of TRR and the characteristics of rainfall and underlying surfaces. (a–e) show the relationship for Subcatchment 1 to Subcatchment 5, respectively, and (f) shows all subcatchments’ fitted curves.
Figure 9.
Relationship between the effect of TRR and the characteristics of rainfall and underlying surfaces. (a–e) show the relationship for Subcatchment 1 to Subcatchment 5, respectively, and (f) shows all subcatchments’ fitted curves.


Table 1.
Rainfall characteristics of five events used for model calibration or validation and those of all the 30 events.
Table 1.
Rainfall characteristics of five events used for model calibration or validation and those of all the 30 events.
| Event (yyyymmdd) | Rainfall Depth (mm) | Peak Intensity (mm·min−1) | Duration Time (min) | Measurement Items | For Model Calibration or Validation |
|---|---|---|---|---|---|
| 20170720 | 29.3 | 1.36 | 755 | River Discharge | Calibration |
| 20170802 | 10.5 | 0.55 | 541 | River Discharge | Validation |
| 20170808 | 5.5 | 0.58 | 127 | Ponding Depth | Validation |
| 20170811 | 35.0 | 1.16 | 1917 | River Discharge, Ponding Depth | Validation |
| 20170827 | 21.7 | 0.14 | 1283 | River Discharge | Validation |
| All the 30 events | 5.5–196.3 | 0.10–4.08 | 100–4613 |
Table 2.
Results of parameter calibration.
| Parameters | Results (Average Value) |
|---|---|
| Percent of impervious area (%) | 0–100 (52) |
| Slope (%) | 0.022–3.456 (0.511) |
| Manning’s roughness for impervious area | 0.011–0.016 (0.013) |
| Manning’s roughness for pervious area | 0.153–0.300 (0.264) |
| Depression storage on impervious area (mm) | 1.00–2.09 (1.53) |
| Depression storage on pervious area (mm) | 2.00–8.02 (6.94) |
| Suction head (mm) | 210 |
| Conductivity (mm·h−1) | 1 |
| Soil moisture deficit (frac.) | 0.15 |
| Roughness of road | 0.011 |
| Roughness of pipe | 0.012 |
| Roughness of river | 0.013 |
Table 3.
Underlying surface characteristics of the typical areas (grids and subcatchments) selected for analysis.
Table 3.
Underlying surface characteristics of the typical areas (grids and subcatchments) selected for analysis.
| Areas for Analysis | Impervious Degree (%) | Drainage Area (km2) |
|---|---|---|
| Group 1 of grids | 0 | 0.0025 |
| Group 2 of grids | 50 | 0.0025 |
| Group 3 of grids | 100 | 0.0025 |
| Subcatchment 1 (upstream of S1) | 46.2 | 0.49 |
| Subcatchment 2 (upstream of S2) | 52.9 | 1.02 |
| Subcatchment 3 (upstream of S3) | 53.2 | 1.34 |
| Subcatchment 4 (upstream of S4) | 52.8 | 1.68 |
| Subcatchment 5 (upstream of S5) | 52.9 | 2.38 |
© 2018 by the authors. Licensee MDPI, Basel, Switzerland. This article is an open access article distributed under the terms and conditions of the Creative Commons Attribution (CC BY) license (http://creativecommons.org/licenses/by/4.0/).
Share and Cite
MDPI and ACS Style
Lyu, H.; Ni, G.; Cao, X.; Ma, Y.; Tian, F. Effect of Temporal Resolution of Rainfall on Simulation of Urban Flood Processes. Water 2018, 10, 880. https://doi.org/10.3390/w10070880
AMA Style
Lyu H, Ni G, Cao X, Ma Y, Tian F. Effect of Temporal Resolution of Rainfall on Simulation of Urban Flood Processes. Water. 2018; 10(7):880. https://doi.org/10.3390/w10070880
Chicago/Turabian StyleLyu, Heng, Guangheng Ni, Xuejian Cao, Yu Ma, and Fuqiang Tian. 2018. "Effect of Temporal Resolution of Rainfall on Simulation of Urban Flood Processes" Water 10, no. 7: 880. https://doi.org/10.3390/w10070880
Note that from the first issue of 2016, this journal uses article numbers instead of page numbers. See further details here.