Article

Adsorption Behaviors and Removal Efficiencies of Inorganic, Polymeric and Organic Phosphates from Aqueous Solution on Biochar Derived from Sewage Sludge of Chemically Enhanced Primary Treatment Process

National Engineering Laboratory for Sustainable Sludge Management & Resourcelization Technology, Harbin Institute of Technology, P.O. Box 2602, Harbin 150090, China
*
Author to whom correspondence should be addressed.
Water 2018, 10(7), 869; https://doi.org/10.3390/w10070869
Submission received: 8 April 2018 / Revised: 12 June 2018 / Accepted: 22 June 2018 / Published: 29 June 2018
(This article belongs to the Section Wastewater Treatment and Reuse)

Abstract

:
Adsorption behaviors and removal efficiencies of different phosphorus species on sewage sludge-based biochar (SBB) were investigated, with powder activated carbon (PAC) as a comparison. The adsorption efficiencies of potassium dihydrogen phosphate, sodium tripolyphosphate and sodium glycerol-phosphate on SBB are 81.91%–92.86%, 66.02%–90.66% and 25.48%–38.94%, when the initial pH values of phosphate solutions are 3–10, 4–10 and 3–10, respectively. The maximal adsorption capacities of phosphates on SBB are 2.1–5.3 times those of PAC. X-ray photoelectron spectroscopy analysis indicates that ligand-exchange mechanism and Lewis acid-base interactions occur between hydrolysates of surface-Fe2+/surface-Fe3+ and phosphates, and the precipitates of phosphates accumulate on the surface of SBB and separate from the aqueous solution. These results demonstrate that SBB is an effective adsorbent for phosphorus removal and recovery in wastewater, and it also has the potential to reduce phosphorus leaching loss in the soil when applied in soil amendment.

1. Introduction

Phosphorus is a limiting nutrient leading to eutrophication, and meanwhile, it is a scarce nutrient, as easily mineable deposits of phosphate rock are limited [1]. Sewage-effluent phosphorus is the main point-source of excess phosphorus discharged to waters, and phosphorus in runoff from agricultural land is a major component of nonpoint-source pollution [2,3]. Hence, enhancing phosphorus removal and recovery from sewage and reducing phosphorus leaching loss in soil have significant meaning to address eutrophication and phosphorus crisis.
Phosphorus in sewage, fertilizers, and soil is present in the forms of organic phosphate, inorganic phosphate (orthophosphate) and polyphosphate, and organic phosphorus is more mobile than recalcitrant forms, comprising 22%–46% of total phosphorus. However, organic phosphate is often overlooked in phosphorus removal and recovery [4]. The most common approaches of phosphorus-removal and recovery technologies are metal precipitation, ion exchange, struvite crystallization, and biological uptake from sewage, with the final product as phosphate salts or sludge [5,6].
Sludge-based biochar (SBB) as the product of sludge pyrolysis process, which is a porous material with sufficient surface functional groups, has emerged as a significant sewage sludge utilization method. SBB can be used as an adsorbent and is widely used in wastewater treatment to remove heavy metals, dye, phenol and phenolic compounds, etc. [7,8,9]. In recent years, there have been some studies on the bio-carbon prepared by loading of ferric salts with sludge as raw material [10,11,12]. In addition, SBB has been identified as a beneficial soil amendment, which can improve soil physical and chemical properties, soil fertility and enhance plant growth [13,14].
In this study, adsorption behaviors and interactions of different phosphorus species (inorganic, polymeric and organic phosphates) on sewage sludge-based biochar (SBB) were investigated to evaluate phosphorus adsorption and recovery potential, and reveal the adsorption mechanism, in which interactions between sludge-based biochar and phosphorus in soil solutions could also be revealed. Adsorption interactions of the three phosphorus species on the surface of SBB were conducted by X-ray photoelectron spectroscopy (XPS) analyses.

2. Materials and Methods

2.1. Sludge-Based Biochar

The raw material used for biochar preparation was sludge from the chemically enhanced primary treatment process in municipal wastewater treatment with ferric sulfate as a coagulant. The sludge was dried at room temperature (25 °C) to reduce water to less than 5% before making biochar.
The raw sludge was mixed with distilled water for 12 h. Then the sample was pyrolyzed in a muffle furnace with the inert atmosphere by increasing the temperature to 650 °C at a rate of 30 °C·min−1. So the sample was pyrolyzed in an anoxic environment. The final temperature was maintained for 30 min. Finally, the product was ground to powder (d < 0.1 mm). Powder activated carbon (PAC, 200 mesh, Wenchang, Hainan, China) made from coconut shell was chosen as a comparative adsorbent.
The point of zero charge (pHpzc) and surface charge were measured by potentiometric acid-base titration of the adsorbent suspensions [9,15]. Sample porosity was characterized by N2 adsorption measurements at 77 K (ASAP2020, Micromeritics, Norcross, GA, USA). Sample microstructure was observed with scanning electron microscope (SEM S-570, Hitachi, Tokyo, Japan).

2.2. Batch Adsorption Assays

To get an essential understanding of the removal of different phosphates, potassium dihydrogen phosphate (KH2PO4, KDP), sodium tripolyphosphate (Na5P3O10, STPP) and sodium glycerol-phosphate (C3H5(OH)2PO4Na2·5.5H2O, SGP) were chosen to represent inorganic, polymeric and organic phosphates, respectively.
Bath adsorption assays were conducted to study the effect of contact time, shaking rate, adsorbent dosage, initial pH and initial concentration of the phosphate solution. First, 0.05 g SBB or PAC was mixed with 0.5 mL H2SO4 (pH = 3.5) and was shaken vigorously for 30 min, and the purpose of this step is to activate the adsorbent material to achieve better adsorption effect. Then the mixture was added to 50 mL of 20 mg·L−1 phosphate solution in closed flasks to avoid evaporation. The solution-containing flasks were shaken at 150 r.p.m at 25 ± 2 °C in a water-bath for 10–360 min for contact time test. The pH values of 20 mg·L−1 KDP, STPP and SGP solutions without pH adjusting are 5.3, 9.4 and 7.8, respectively. Shaking rate study was conducted at 30–200 r.p.m. by the same procedure of contact time test, but for an equilibrium time. Adsorbent dosage study was tested with 0.2–4.0 g·L−1 adsorbent. Initial pH study was conducted by using HCl or NaOH to adjust initial pH values of phosphate solution from 2 to 10. The initial phosphate concentrations are 5–80 mg·L−1 in initial concentration study. The soluble phosphate and total phosphorus were determined using stannous chloride method by the standard methods [16]. The formula for the removal efficiency w of phosphate is as follows, where C0 is the initial liquid phase concentrations of solution, and Ce is the equilibrium liquid phase concentrations of solution (mg·mL−1).
w   =   C 0     C e C 0   ×   100 %

2.3. XPS Analysis

XPS was employed to determine elemental composition and the surface chemical properties of SBB, PAC, phosphate-adsorbed SBB and phosphate-adsorbed PAC. The analysis was done using a PHI 5700 ESCA system (Physical Electronics, Chanhassen, MN, USA) with Al Kα X-ray source (1486.6 eV of photons).

2.4. Adsorption Kinetic Model

Langmuir and Freundlich isotherm models in the present study have been tested:

2.4.1. Langmuir Isotherm

The Langmuir isotherm theory assumes monolayer coverage of adsorbate over a homogenous adsorbent surface. At equilibrium a saturation point is reached where no further adsorption or desorption can occur. The Langmuir equation is expressed as:
q e   =   q m KC e 1 + KC e
C e q e   =   1 q m K   +   1 q m C e
where Ce is the equilibrium liquid phase concentrations of solution (mg·L−1), qe is equilibrium concentration on adsorbent (mg·g−1), K is a direct measure of the intensity of the adsorption process, and qm is a constant related to the area occupied by a monolayer of adsorbate, reflecting the adsorption capacity. From a plot of Ce/qe versus Ce, qm and K can be determined from its slope and intercept.

2.4.2. Freundlich Isotherm

The Freundlich expression is an empirical exponential equation and therefore, assumes that as the adsorbate concentration increases so too does the concentration of adsorbate on the adsorbent surface. Theoretically, using this expression, an infinite amount of adsorption can occur.
q e   =   K f   C e 1 / n
In this equation, Kf and n are the Freundlich constants. This expression is characterized by the heterogeneity factor n, and the Freundlich isotherm may be used to describe heterogeneous systems. To determine the constants Kf and n, the linear form of the equation is to produce a graph of lnqe against lnCe.
nq e =   lnK f   +   1 n   lnC e
Kf is related to the bonding energy and can be defined as the adsorption or distribution coefficient and represents the quantity of phosphate adsorbed onto adsorbent for a unit equilibrium concentration. The slope 1 n , ranging between 0 and 1, is a measure of adsorption intensity or surface heterogeneity, becoming more heterogeneous as its value gets closer to zero.

3. Results and Discussion

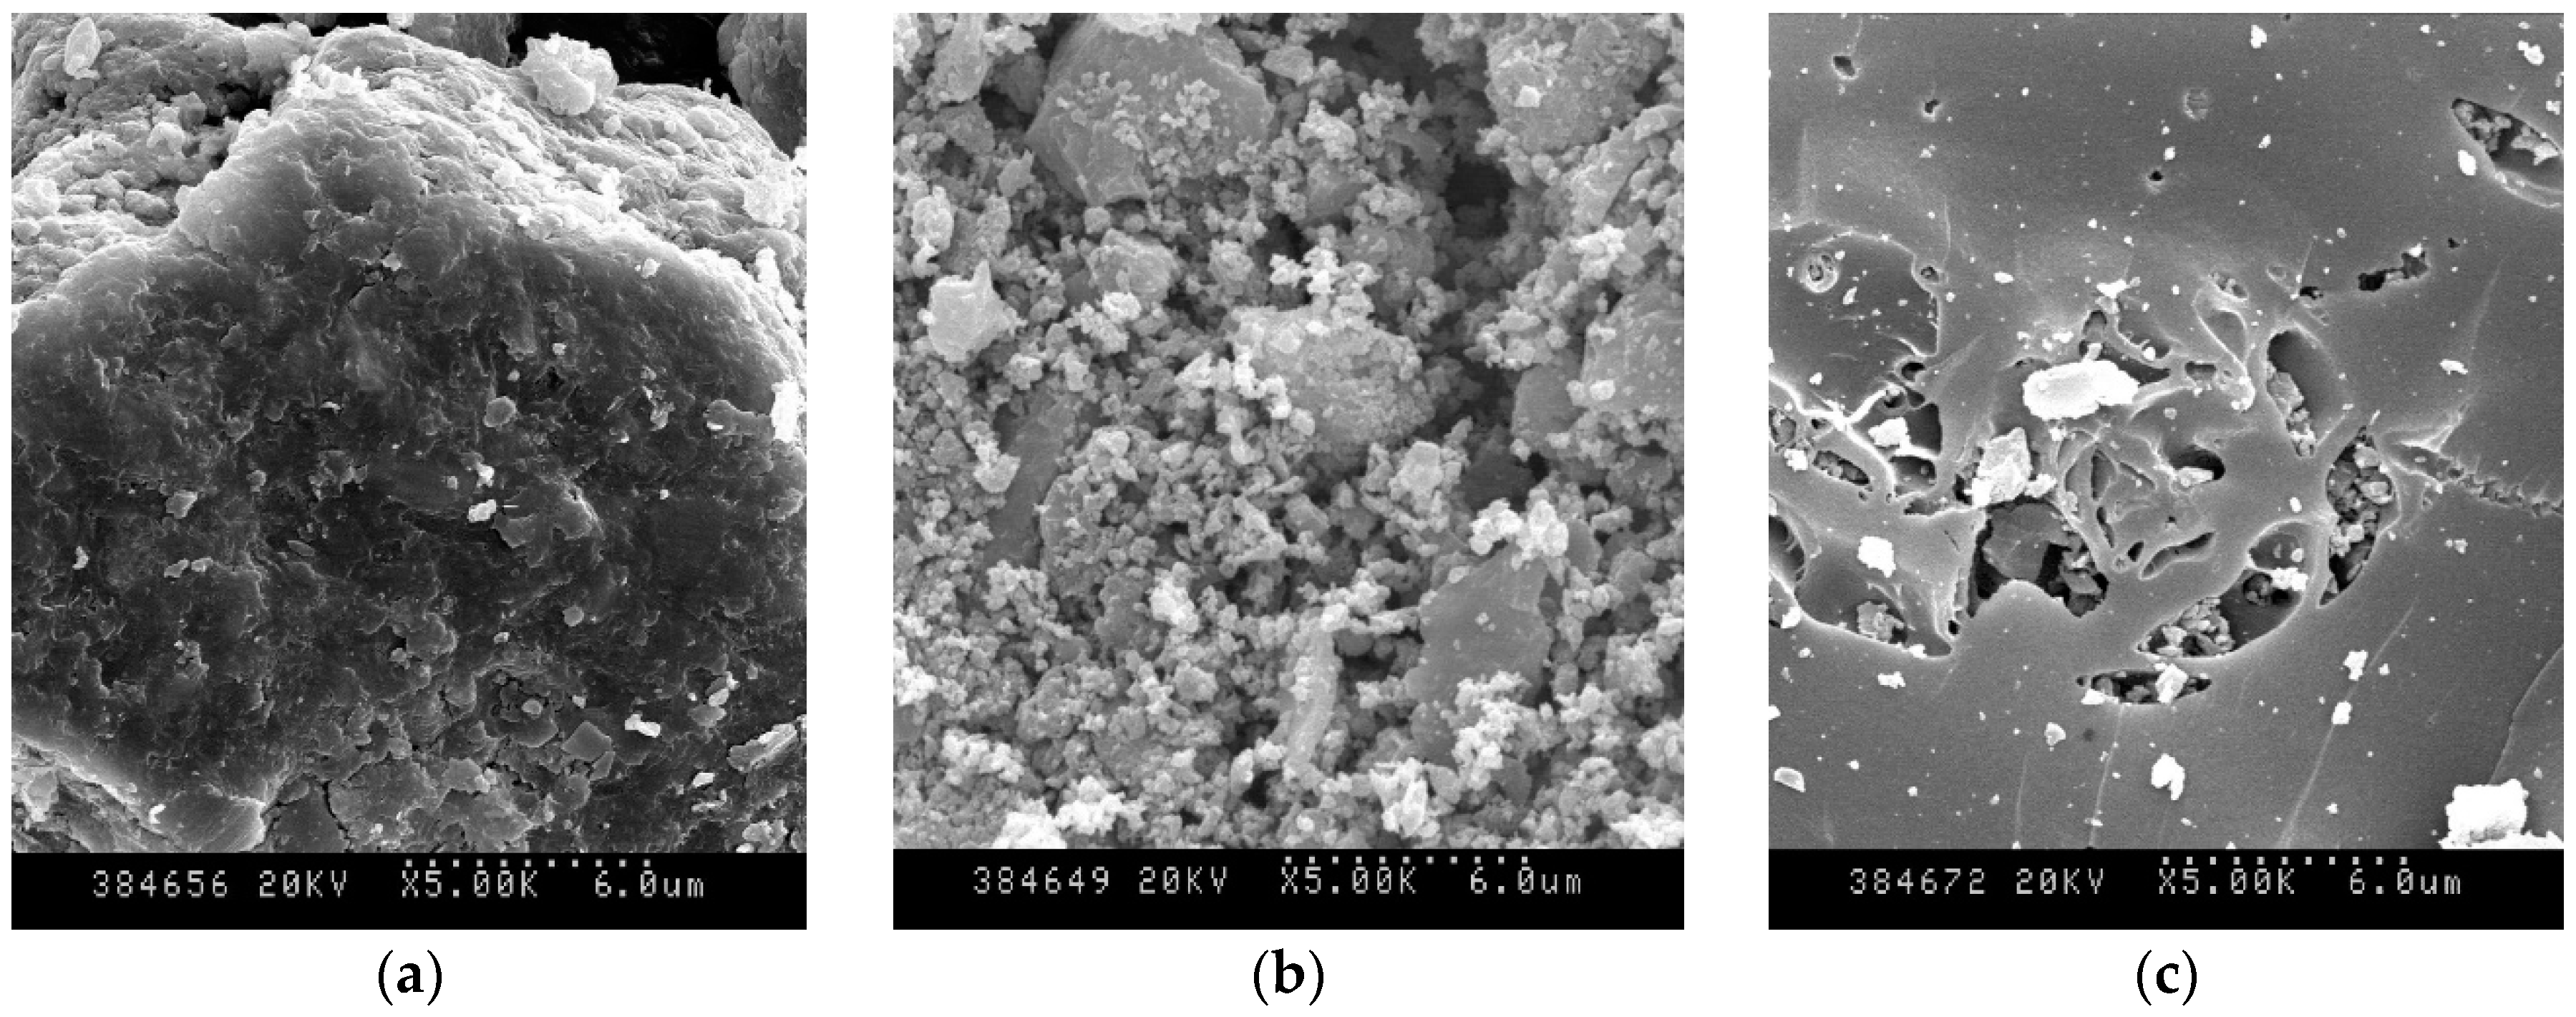
3.1. Properties of SBB and PAC

SEM images of dried raw sludge, SBB and PAC are shown in Figure 1. The figures show that the pore walls of SBB are rougher than PAC; there are many small particles on the surface of SBB. Tests show that pHpzc values of SBB and PAC are 3.27 and 6.62, respectively. Compared with PAC, SBB has lower pHpzc. BET surface area (m2·g−1), total pore volume (cm3·g−1) and micropore volume (cm3·g−1) of SBB are 149.47, 0.21 and 0.00, respectively, and of PAC are 1178.39, 0.67 and 0.33, respectively. The pore characteristics indicate that the surface area and micropores in SBB are far less than PAC.
We analyzed the composition of elements using XPS, a method of surface semi-quantitative element analysis. Elemental compositions (Atomic %) and oxygen to carbon atomic ratios of SBB and PAC before and after the phosphate adsorptions are shown in Table 1. It can be seen that there are C, O, N, Si, S, P, Ca and Fe on the surface of SBB. The contents of these elements have the following order: C > O > N > Fe > S > P > Si > Ca. There are only C and O on the surface of PAC. The O/C ratios of SBB and PAC are 0.42 and 0.06, respectively. The O/C ratio indirectly represents the total content of oxygen-containing surface groups. It means that the total content of oxygen-containing surface groups on SBB is much higher than that on PAC. Fe elements are distributed at various depths of the SBB, not just on the surface. In the adsorption process, the internal iron element dissolves into the solution, then binds with the phosphate ion to deposit to the surface. We consider this to be the cause of the increase of iron element on the surface of the SBB after adsorption.

3.2. Effect of Initial pH on KDP, STPP and SGP Adsorptions

Figure 2 shows the effect of initial pH on the removal efficiencies of KDP, STPP and SGP with an initial concentration of 20 mg·L−1 and adsorbent dosage of 3 g·L−1 for all the three phosphates. The other experimental conditions in initial pH studies for KDP, STPP and SGP adsorptions were ascertained in the contact time and shaking rate tests. The contact times for KDP, STPP and SGP adsorptions were 2 h, 1 h and 0.5 h, respectively. In our pre-experiment, we found the adsorption of different phosphate types on SBB had different equilibrium times, and all the contact times used in this research were longer than the equilibrium time. The shaking rates were 120 r.p.m. for all the three phosphates. We explored the relationship between different shaking rates and phosphorus adsorption, and finally determined the shaking rate with the best r.p.m. of 120. The removal efficiencies of KDP, STPP, and SGP on SBB are 81.91%–92.86%, 66.02%–90.66% and 25.48%–38.94%, when the initial pH values of phosphate solutions are 3–10, 4–10 and 3–10, respectively. However, at pH 2, removal efficiencies of all the three phosphates on SBB are much lower than those at other pH values. Our previous study [9] found that leaching of ferric ions from SBB occurred at wide pH range; lower pH leads to higher dissolved ferric ion concentration. So it can be presumed that the partially dissolved ferric ion from SBB could hydrolyze in the phosphate solution and accelerate the phosphate removal. However, at pH 2, too much dissolved ferric ion from SBB surface caused partial damage of pore structure and low phosphates adsorption on SBB. It means that the acidic pH increases the dissolution of adsorbed sedimentary phosphate. Another reason is that phosphate adsorption is likely to be inhibited at low pH due to the high proportion of uncharged phosphate species [17].
The maximal removal efficiencies of KDP, STPP, and SGP on PAC are 22.41%, 67.05% and 25.96%, which are obtained at initial pH values of 5, 3 and 6, respectively. When the initial pH values of KDP, STPP, and SGP solutions are higher than 5, 3 and 6, the removal efficiencies of phosphates gradually decrease. Tests show that pHpzc values of SBB and PAC are 3.27 and 6.62, respectively. The possible cause is that the adsorbent surface carries more negative charges which serves to increase the repulsion of the negatively charged phosphate species in solution when the phosphate solution has a higher pH, and consequently results in lower phosphate adsorption capacity [18,19]. KDP, STPP and SGP adsorption on SBB were different; KDP and STPP are inorganic strong acid salts, and SGP is an organic weak acid salt; second, phosphate ions with negative charges are more easily adsorbed by SBB active sites with positive charges. Glycerophosphoric acid is a weak organic acid (pKa, about 5.5), which causes more free glycerol phosphate ions to release in higher pH SGP aqueous solution. In contrast, phosphoric acid (pKa1 = 2.12) and tripolyphosphate (pKa1 = 1.0) are relatively strong acids; pH has little effect on the dissolution of phosphate ions.
The pH values of phosphate solutions before and after adsorptions on SBB and PAC are shown in Table 2. It can be seen that for SBB the final pH values are equal to the initial values when the initial pH values are 2 and 3; the final pH values are all around 4 when the initial pH values are 4–10. For PAC the final pH values are similar to the initial pH values. Considering the pHpzc of activated carbon and SBB, the final pH value has little to do with the initial pH value, which ensures the adsorption of negatively charged phosphate ions to some extent.

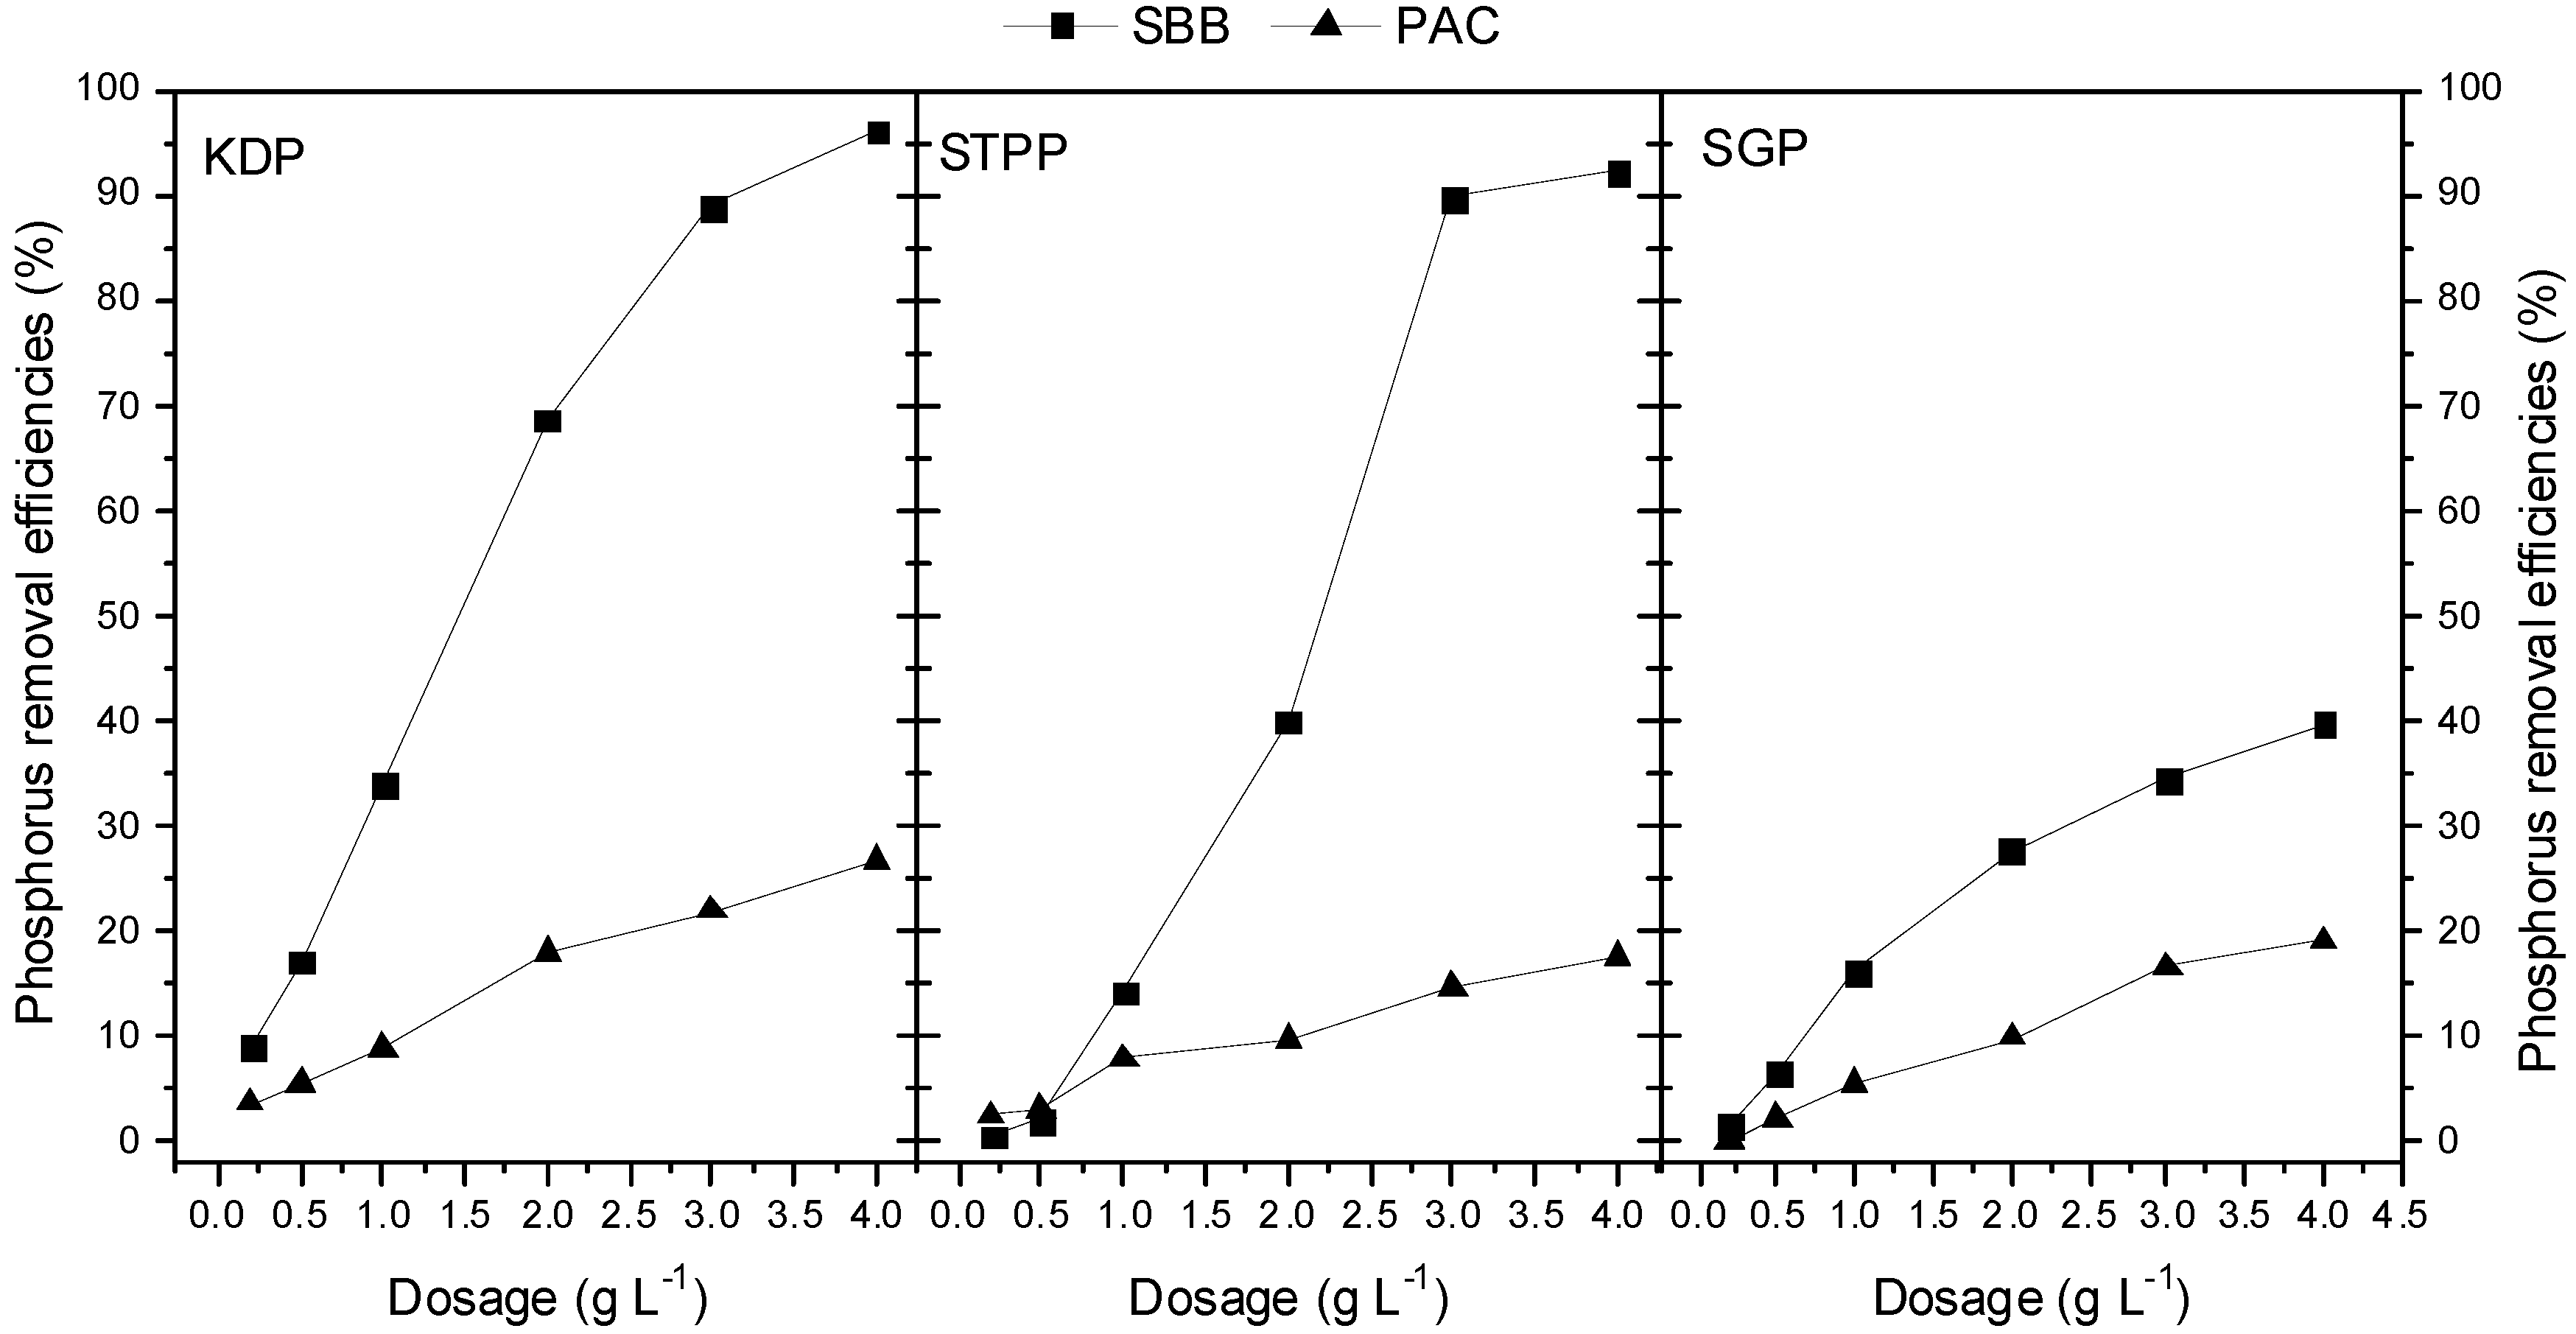
3.3. Effect of Adsorbent Dosage on KDP, STPP and SGP Adsorptions

Figure 3 shows the effect of adsorbent dosage on KDP, STPP and SGP adsorptions. The experimental conditions in the adsorbent dosage test were the same as in the initial pH study, but without pH adjusting. It can be seen that all the adsorptions increase as the adsorbent dosages increase from 0.2 to 4.0 g·L−1. When the dosage is 4.0 g·L−1, the removal efficiencies of KDP, STPP, and SGP on SBB are 96.14%, 92.19%, and 39.72%, respectively; and on PAC are 26.70%, 17.56%, and 18.99%, respectively. So the adsorption capacities of KDP, STPP, and SGP on SBB are 3.6, 5.3 and 2.1 times those of PAC. It means that the removal efficiencies of phosphates on SBB are much higher than those on PAC. The BET results indicate that the surface area and micropores in SBB are far less than those in PAC. This suggests that the surface area and micropores are not the major dominating factors for the adsorption of phosphates on SBB.
The Freundlich and Langmuir isotherms [20] are used to model KDP, STPP and SGP adsorptions on SBB and PAC, and the isotherm constants are shown in Table 3. It is apparent from the results of the isotherm constants that the adsorption of KDP, STPP and SGP on SBB or PAC fit well in both two models.

3.4. Phosphate Adsorption Characteristics on SBB and PAC

There are C, O, N, Si, S, P, Ca and Fe elements on the surface of SBB (Table 1). It is reported that Fe3+ reacted rapidly not only with phosphate, but also with hydroxyl ions, and Fe2.5PO4(OH)4.5 had been found as solids precipitate [21]. Fe(III) can adsorb large quantities of phosphate by forming Fe(OOH)-PO4 complexes or precipitates such as {Fe(PO4)x(OH)3−x} [22]. It is reported that Ca and Si elements can react with phosphates and promote the removal efficiencies of phosphates [23], which shows that the functions of Ca and Si elements are similar to that of Fe. It is presumed that the high removal efficiencies of phosphates on SBB (Figure 2 and Figure 3) are promoted by elements on the surface of SBB. This is one of the crucial reasons for what SBB have better removal efficiencies of phosphates than PAC.
To further investigate the adsorption properties between phosphates and SBB, XPS analyses of C and Fe elements on SBB surface are discussed as follows.

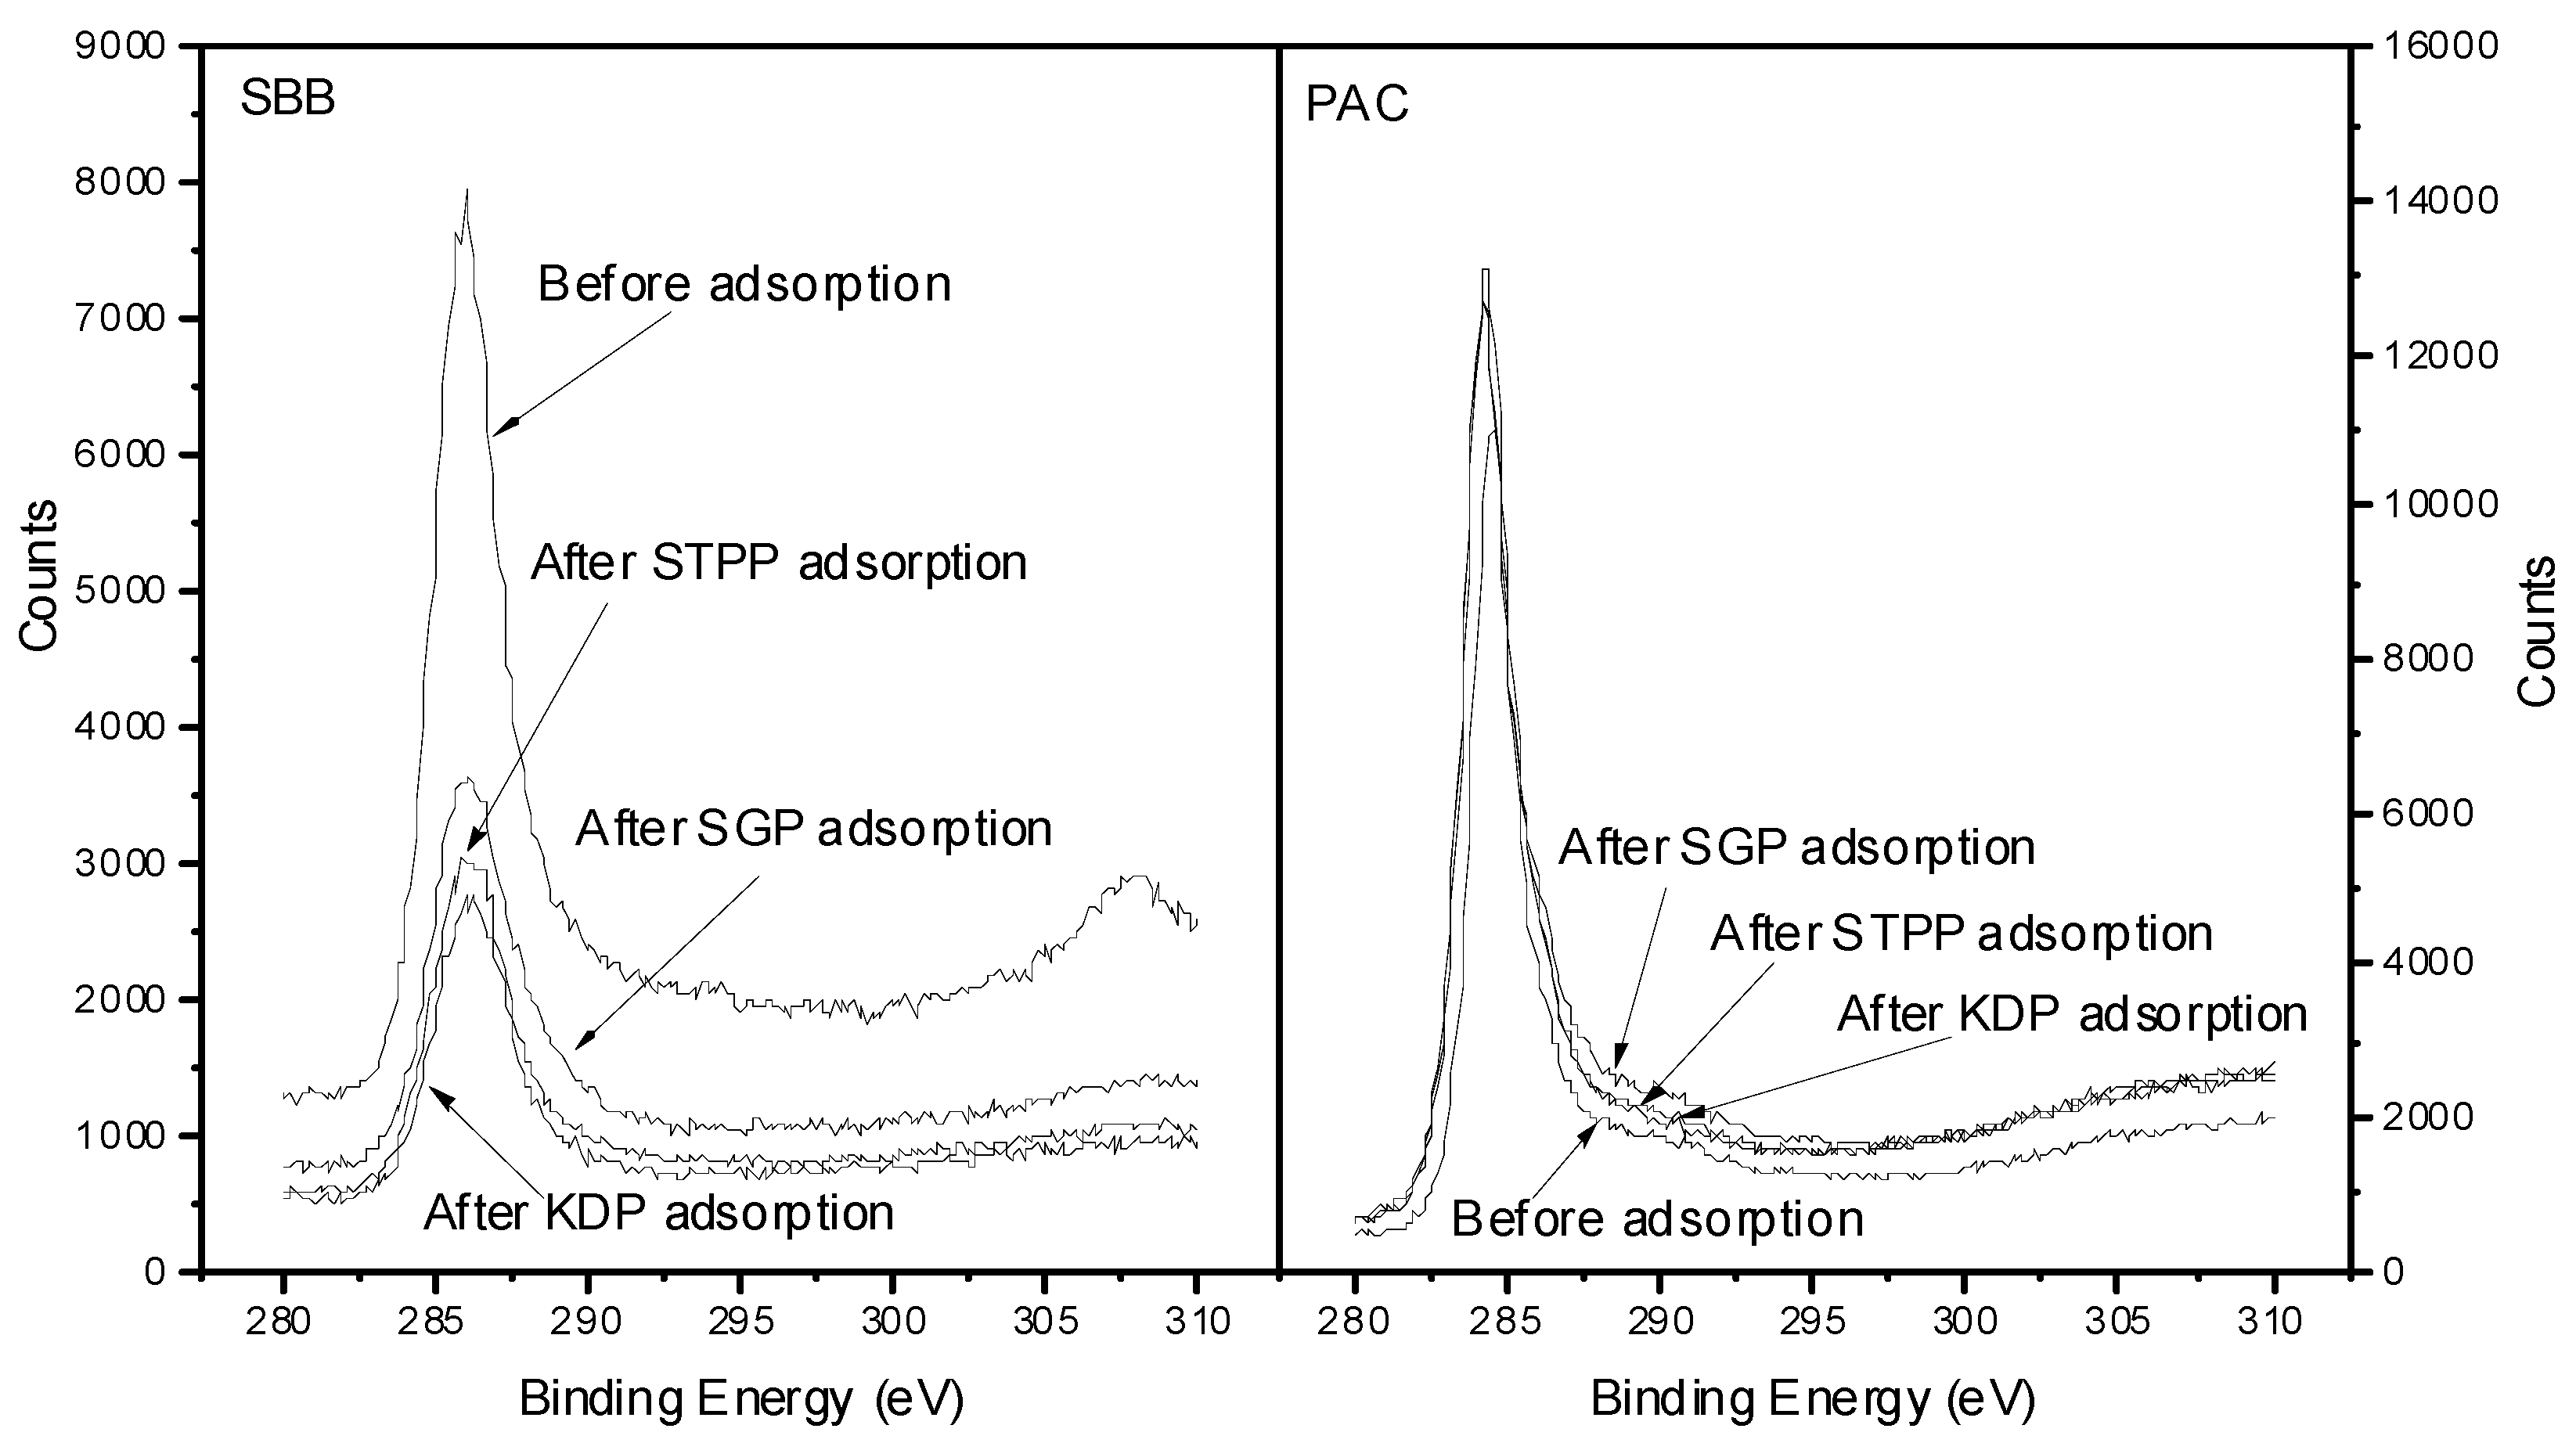
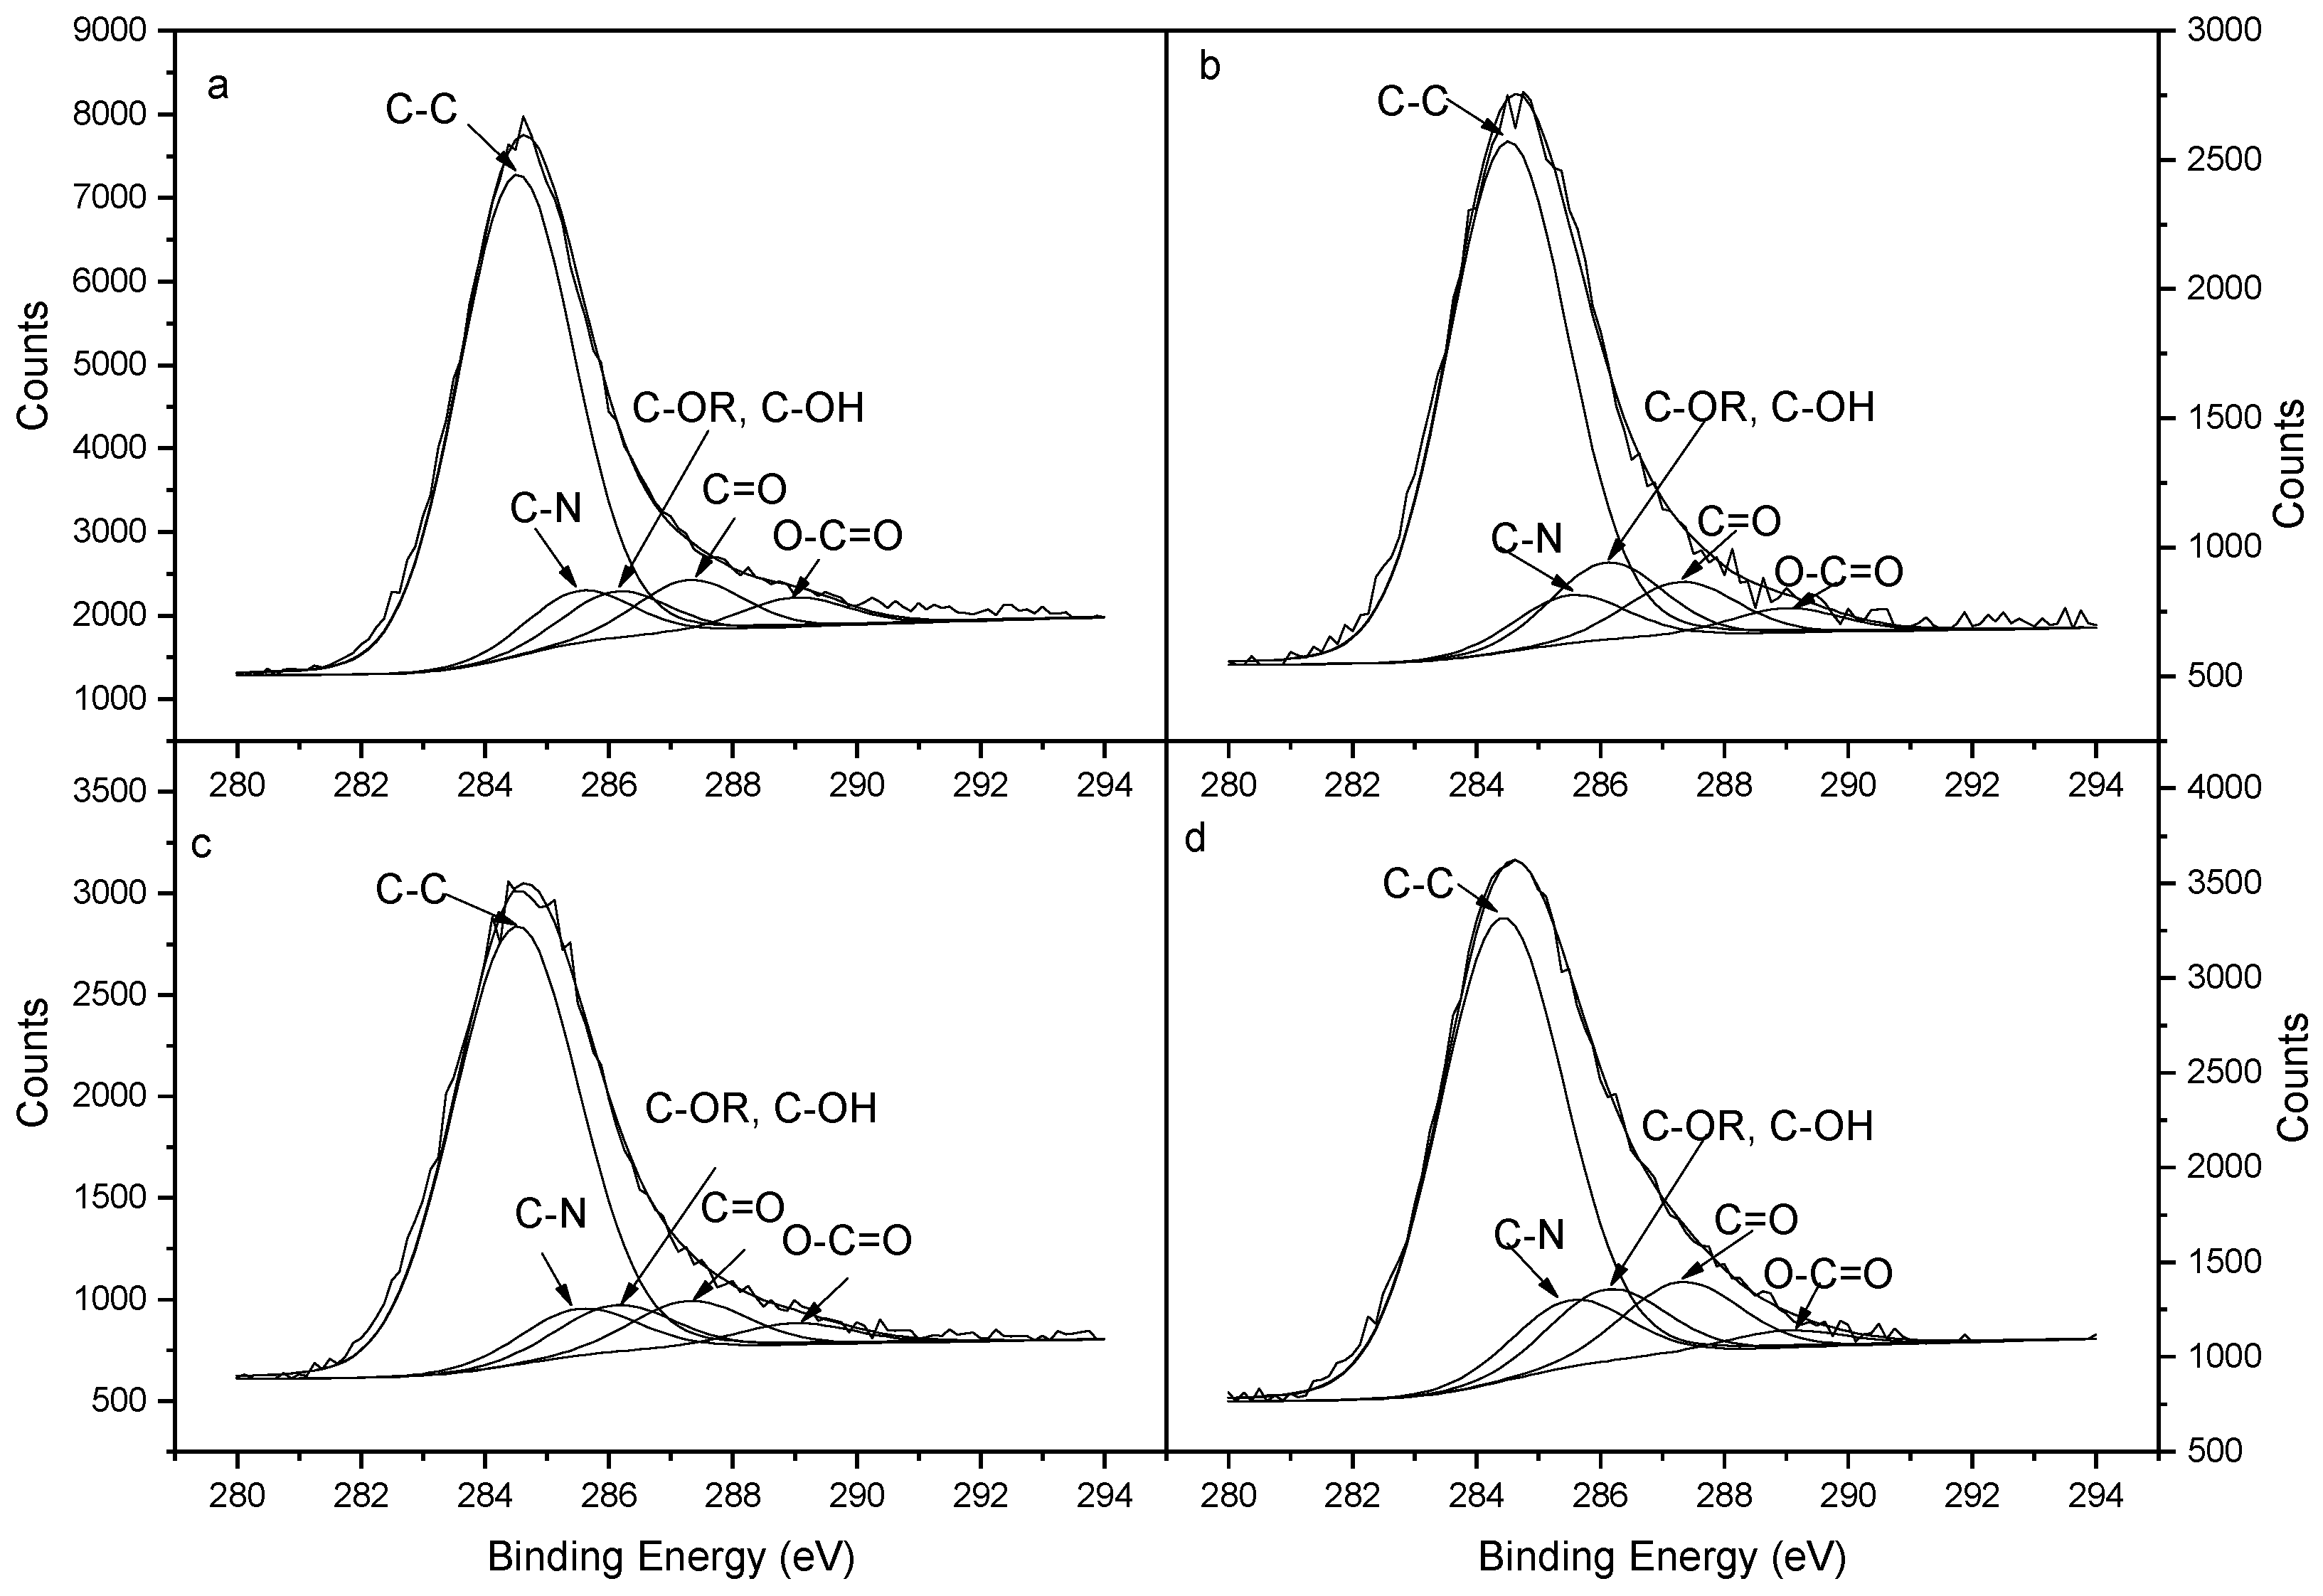
3.4.1. Adsorption Properties of Phosphates on SBB Characterized by XPS Analysis of C Element

The C1s XPS spectrums of SBB and PAC before and after phosphate adsorptions are shown in Figure 4. It can be seen that the peak intensity and peak shape of SBB change after phosphate adsorptions, while the peak intensity and peak shape of PAC are similar before and after phosphate adsorptions. The surface elements on PAC are still C and O after phosphate adsorptions, no P is detected; surface O/C ratios of PAC all raise from 0.06 to 0.07 after adsorptions of the three phosphates (Table 1). The low removal efficiencies of phosphates on PAC (Figure 3) are the essential reasons for similar C1s XPS results of PAC before and after phosphate adsorptions. So the fitting curves of C1s XPS spectrums for PAC are not shown. C1s XPS fitting curves of SBB before and after phosphate adsorptions are shown in Figure 5. The binding energies of C-C, C-N, C-OR/C-OH, C=O and O-C=O in Figure 5 are 284.5, 285.5, 286.1, 287.3 and 289.0 eV, respectively [24,25]. Relative contents of surface functional groups (Atomic %) determined by fitting C1s XPS spectra are shown in Table 4. It can be seen that there is C-NH2 surface function group on SBB. When pH < pHpzc (3.27), surface C-NH2 changes its form into C-NH3+ upon protonation. C-NH3+ can adsorb the phosphate species such as H3PO4 and H2PO4 by electrostatic forces [26]. These analyses are opposite to the results (Figure 2) that the removal efficiencies of phosphates on SBB become larger when the initial pH is higher than 3.27. So C-NH2 surface function group on SBB is not a significant factor controlling the adsorption of phosphate on SBB.

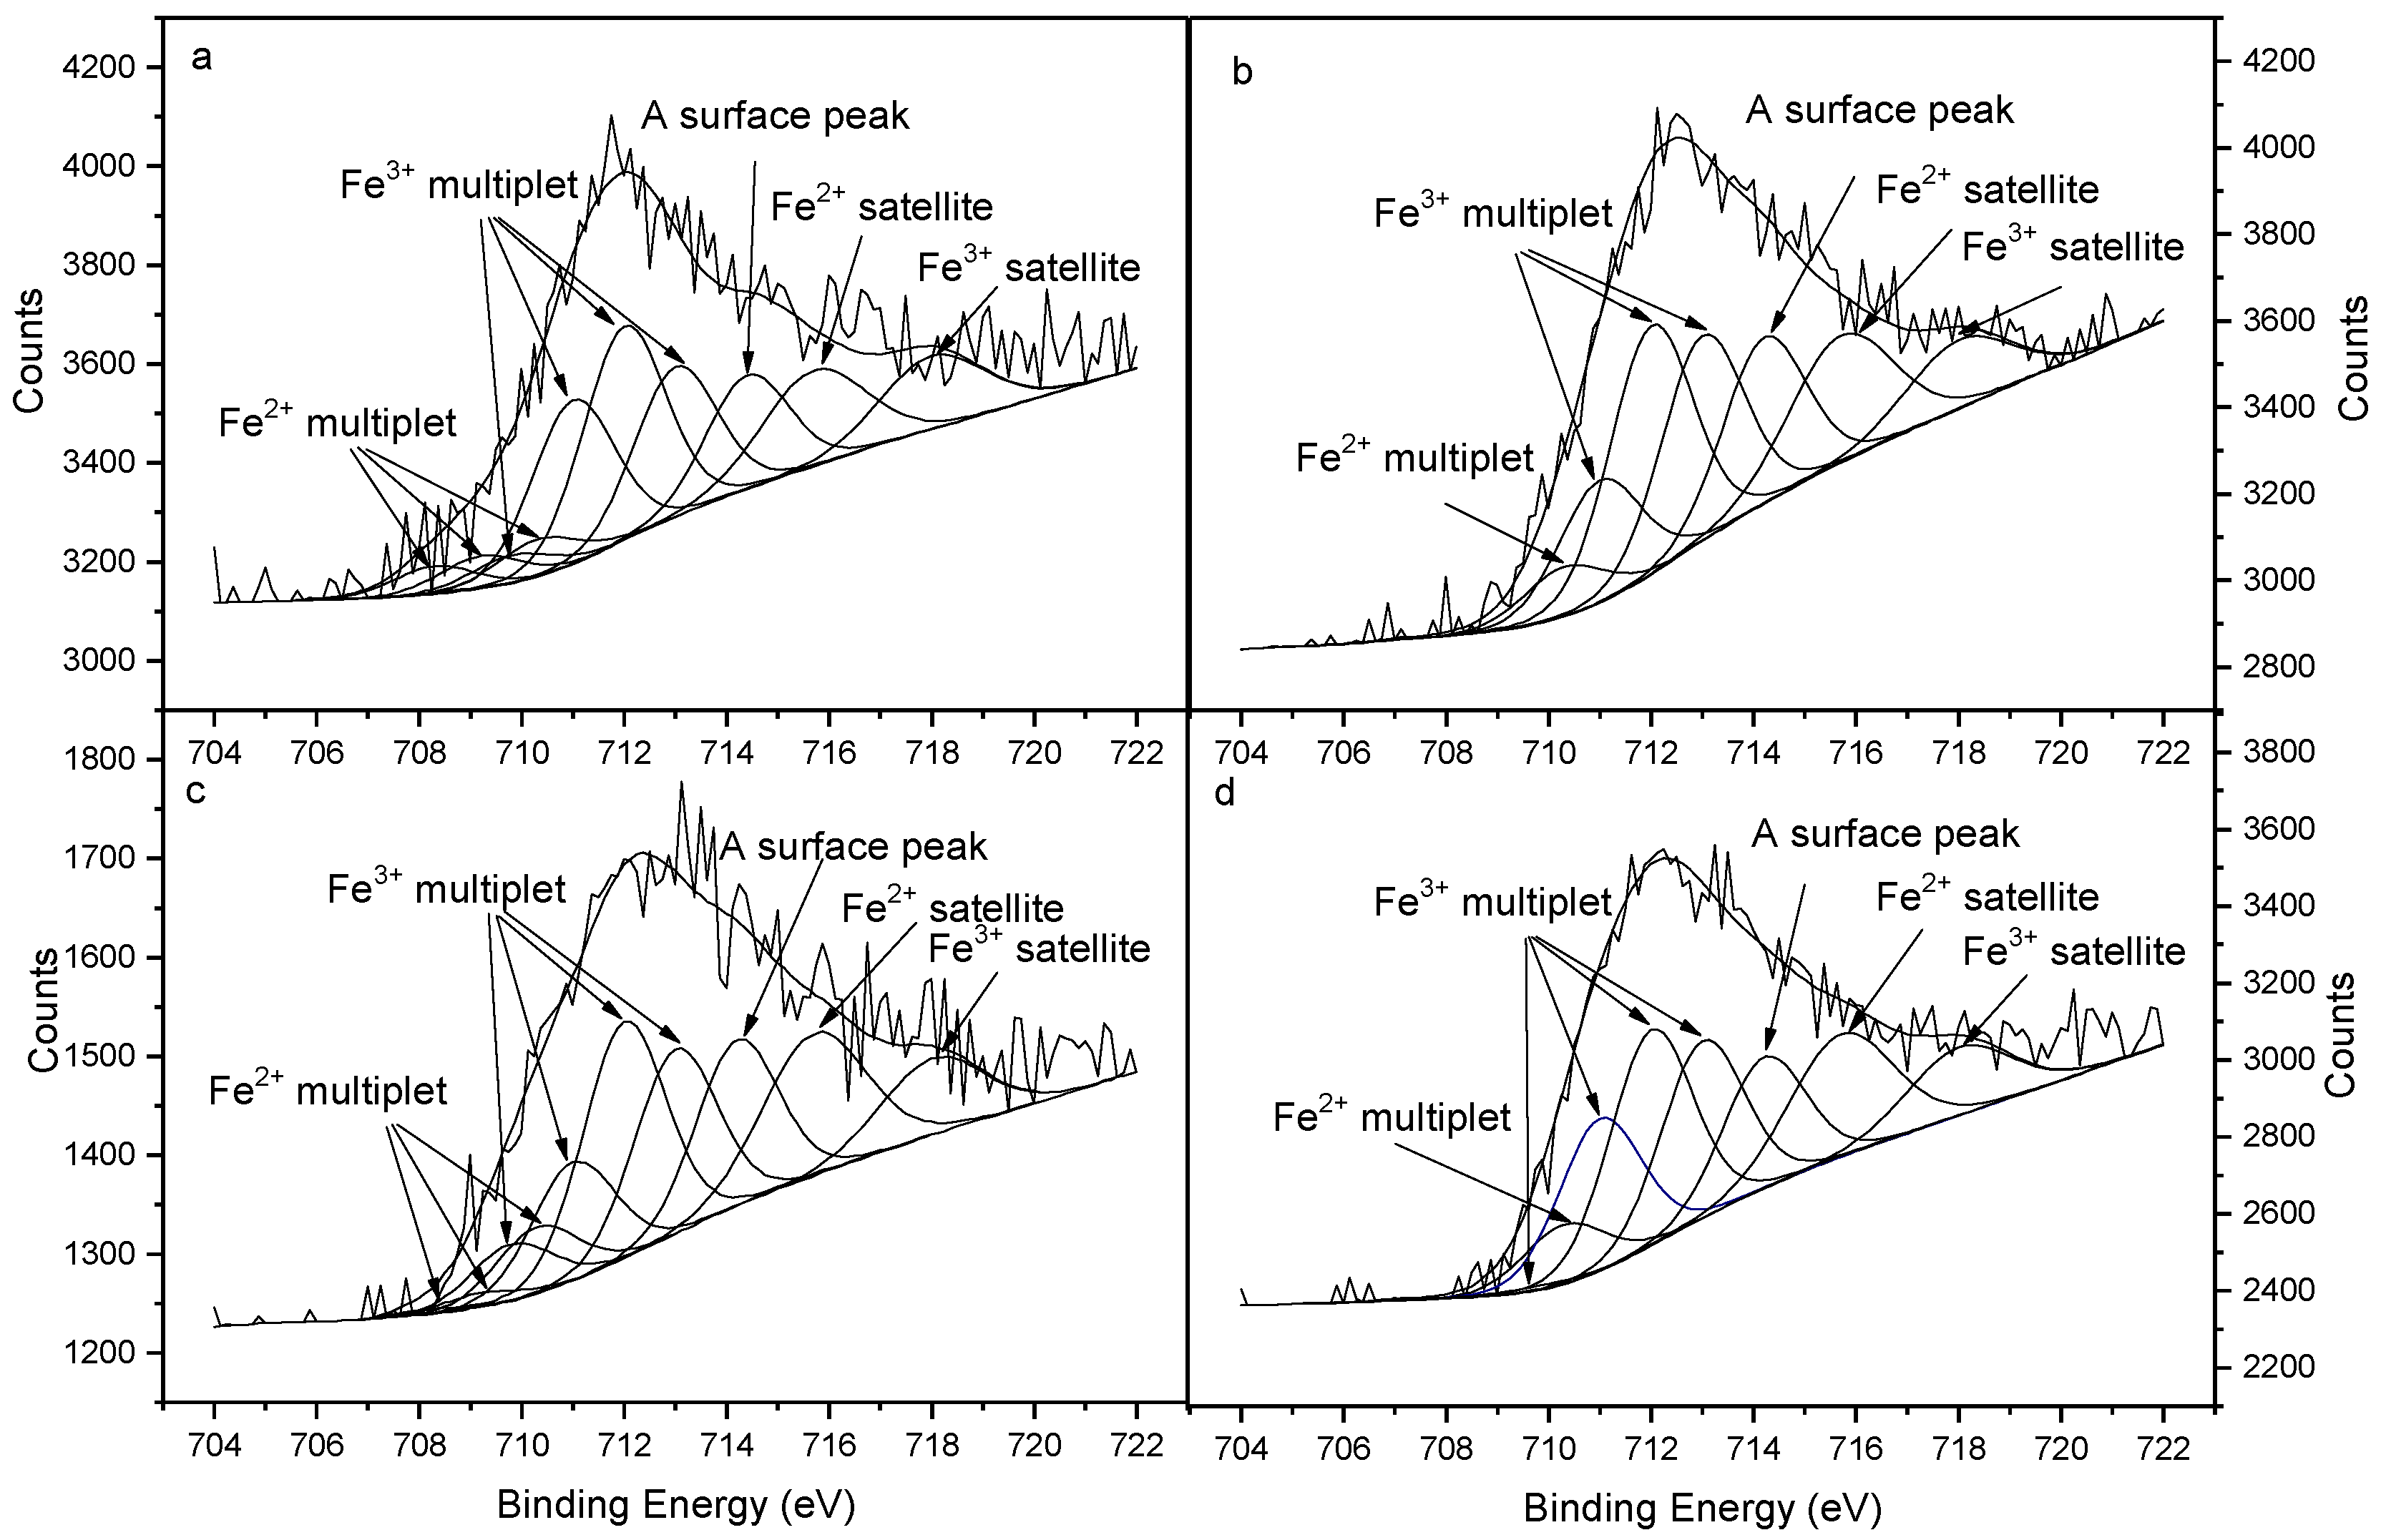
3.4.2. Adsorption Properties of Phosphates on SBB Characterized by XPS Analysis of Fe Element

Tests were conducted to further understand the adsorption reaction of phosphates with the main content Fe on SBB surface. Fe (2p3/2) XPS fitting curves of SBB before and after phosphate adsorptions are shown in Figure 6. Fe (2p3/2) spectra peak was fitted using three and four multiplet peaks for Fe(II) and Fe(III) species respectively [27]. The multiple peaks of the major Fe(II) peak are at 708.3, 709.2 and 710.3 eV; and the peaks of Fe(III) are at 709.8, 711.0, 712.0, 713.0 eV. In addition, Fe2+ and Fe3+ satellite peaks are at about 715.0 and 718.0 eV. To fill the rest of the envelope, a peak reporting to surface structure with higher binding energy than the multiple peaks is added [27]. Relative contents of Fe(II) and Fe(III) multiple peaks in Fe (2p3/2) XPS fitting curves (Percent of total peak area, %) and Fe(III)/Fe(total) ratios are shown in Table 5.
Table 5 shows that the KDP-adsorbed SBB and SGP-adsorbed SBB have higher Fe(III)/Fe(total) ratios than SBB. It means that Fe(II) on SBB surface decreased during the phosphate adsorption. KDP and SGP will promote the following reaction between surface-Fe2+ of SBB and dissolved oxygen in the phosphate solutions:
Surface-4Fe2+ + 2H2O + O2 → Surface-4FeOH2+
The surface Fe species can hydrolyze into surface-FeOH2+, surface-Fe(OH)2+, surface-Fe(OH)3, surface-Fe2(OH)22+ and surface-FeOH+ [15]. Surface-Fe2+ and surface-Fe3+ could probably react with phosphate ions such as H2PO4, HPO42− or PO43−, forming Fe2.5PO4(OH)4.5 or {Fe(PO4)x(OH)3−x} [21,22].
Phosphate is adsorbed explicitly on inorganic materials by a ligand-exchange mechanism with a reactive surface hydroxyl ion [28]. There are probably three possible phosphate surface complexes resulting from the ligand exchange reaction: binuclear ( Water 10 00869 i001), bidentate ( Water 10 00869 i002), and monodentate complexes ( Water 10 00869 i003). As it has been described, H2PO4 forms monodentate inner-sphere complex by coulombic and Lewis acid-base interaction; HPO42− forms bidentate inner-sphere complex by Lewis acid-base interaction [29].
Hydrolysate of the dissolved ferric ion could probably interact with phosphate and form surface precipitates accumulation on SBB surface and result in the phosphate removal.

4. Conclusions

The adsorption efficiencies of KDP, STPP, and SGP on SBB are 81.91%–92.86%, 66.02%–90.66% and 25.48%–38.94%, when the initial pH values of phosphate solutions are 3–10, 4–10 and 3–10, respectively. But the removal efficiencies of all the three phosphates on SBB at pH 2 are much lower than those at other pH values due to the dissolution of adsorbed sedimentary phosphate and the high proportion of uncharged phosphate species. The maximal adsorption capacities of phosphate on SBB are 2.1–5.3 times those of PAC in adsorbent dosage test, though the BET results indicate that the surface area and micropores in SBB are far less than PAC. It is apparent from the results of isotherm constants that the adsorptions on SBB fit well with both Langmuir model and Freundlich model. Surface elements on SBB are C, O, N, Si, S, P, Ca and Fe; on PAC are only C and O. Hydrolysates of surface-Fe2+, surface-Fe3+ can promote the phosphate adsorptions on SBB. The ligand-exchange mechanism, coulombic interaction, Lewis acid-base interaction and surface precipitate accumulations are the major reactions for the removal of phosphates on SBB. These results demonstrate that SBB is an effective adsorbent for phosphorus removal and recovery in wastewater, and it also has the potential to reduce phosphorus leaching loss in the soil when applied in soil amendment.

Author Contributions

The experiments were jointly designed and written by all authors.

Funding

The authors gratefully acknowledge financial support from the Key Program of the National Natural Science Foundation of China (51038003), and the National High Technology Research and Development Program of China (2011AA060906 and 2012AA063508).

Conflicts of Interest

The authors declare no conflict of interest.

References

  1. Elser, J.; Bennett, E. Phosphorus cycle: A broken biogeochemical cycle. Nature 2011, 478, 29–31. [Google Scholar] [CrossRef] [PubMed]
  2. Daniel, T.C.; Sharpley, A.N.; Lemunyon, J.L. Agricultural phosphorus and eutrophication: A symposium overview. J. Environ. Qual. 1998, 27, 251–257. [Google Scholar] [CrossRef]
  3. Jarvie, H.P.; Neal, C.; Withers, P.J.A. Sewage-effluent phosphorus: A greater risk to river eutrophication than agricultural phosphorus? Sci. Total Environ. 2006, 360, 246–253. [Google Scholar] [CrossRef] [PubMed]
  4. Darch, T.; Blackwell, M.S.A.; Hawkins, J.M.B.; Haygarth, P.M.; Chadwick, D. A meta-analysis of organic and inorganic phosphorus in organic fertilizers, soils, and water: Implications for water quality. Crit. Rev. Environ. Sci. Technol. 2014, 44, 2172–2202. [Google Scholar] [CrossRef]
  5. Desmidt, E.; Ghyselbrecht, K.; Zhang, Y.; Pinoy, L.; Van der Bruggen, B.; Verstraete, W.; Rabaey, K.; Meesschaert, B. Global Phosphorus scarcity and full-scale p-recovery techniques: A review. Crit. Rev. Environ. Sci. Technol. 2014, 45, 336–384. [Google Scholar] [CrossRef]
  6. Rittmann, B.E.; Mayer, B.; Westerhoff, P.; Edwards, M. Capturing the lost phosphorus. Chemosphere 2011, 84, 846–853. [Google Scholar] [CrossRef] [PubMed]
  7. Xu, G.; Yang, X.; Spinosa, L. Development of sludge-based adsorbents: Preparation, characterization, utilization and its feasibility assessment. J. Environ. Manag. 2015, 151, 221–232. [Google Scholar] [CrossRef] [PubMed]
  8. Smith, K.M.; Fowler, G.D.; Pullket, S.; Graham, N.J.D. Sewage sludge-based adsorbents: A review of their production, properties and use in water treatment applications. Water Res. 2009, 43, 2569–2594. [Google Scholar] [CrossRef] [PubMed]
  9. Xu, G.R.; Zhang, W.T.; Li, G.B. Adsorbent obtained from CEPT sludge in wastewater chemically enhanced treatment. Water Res. 2005, 39, 5175–5185. [Google Scholar] [CrossRef] [PubMed]
  10. Lee, M.E.; Jeon, P.; Kim, J.G.; Baek, K. Adsorption characteristics of arsenic and phosphate onto iron impregnated biochar derived from anaerobic granular sludge. Korean J. Chem. Eng. 2018, 1–5. [Google Scholar] [CrossRef]
  11. Yang, Q.; Wang, X.; Luo, W.; Sun, J.; Xu, Q.; Chen, F.; Zhao, J.; Wang, S.; Yao, F.; Wang, D.; Li, X.; Zeng, G. Effectiveness and mechanisms of phosphate adsorption on iron-modified biochars derived from waste activated sludge. Bioresour. Technol. 2018, 247, 537–544. [Google Scholar] [CrossRef] [PubMed]
  12. Jørgensen, C.A.; Jensen, H.S.; Egemose, S. Phosphate adsorption to iron sludge from waterworks, ochre precipitation basins and commercial ferrihydrite at ambient freshwater phosphate concentrations. Environ. Technol. 2017, 38, 2185–2188. [Google Scholar] [CrossRef] [PubMed]
  13. Liu, T.; Liu, B.; Zhang, W. Nutrients and Heavy Metals in Biochar Produced by Sewage Sludge Pyrolysis: Its Application in Soil Amendment. Pol. J. Environ. Stud. 2014, 23, 271–275. [Google Scholar]
  14. Paz-Ferreiro, J.; Gascó, G.; Gutiérrez, B.; Méndez, A. Soil biochemical activities and the geometric mean of enzyme activities after application of sewage sludge and sewage sludge biochar to soil. Biol. Fertil. Soils 2012, 48, 511–517. [Google Scholar] [CrossRef]
  15. Stumm, W.; Morgan, J.J. Aquatic Chemistry: Chemical Equilibria and Rates in Natural Waters; John Wiley & Sons: Hoboken, NJ, USA, 1996. [Google Scholar]
  16. American, P.H.A. Water Environment Federation (1998) Standard Methods for the Examination of Water and Wastewater; American Public Health Association: Washington, DC, USA, 1994. [Google Scholar]
  17. Pratt, C.; Shilton, A.; Pratt, S.; Haverkamp, R.G.; Elmetri, I. Effects of Redox Potential and pH Changes on Phosphorus Retention by Melter Slag Filters Treating Wastewater. Environ. Sci. Technol. 2007, 41, 6585–6590. [Google Scholar] [CrossRef] [PubMed]
  18. Huang, W.; Wang, S.; Zhu, Z.; Li, L.; Yao, X.; Rudolph, V.; Haghseresht, F. Phosphate removal from wastewater using red mud. J. Hazard. Mater. 2008, 158, 35–42. [Google Scholar] [CrossRef] [PubMed]
  19. Pradhan, J.; Das, J.; Das, S.; Thakur, R.S. Adsorption of Phosphate from Aqueous Solution Using Activated Red Mud. J. Colloid Interface Sci. 1998, 204, 169–172. [Google Scholar] [CrossRef] [PubMed]
  20. Alkan, M.; Demirbaş, Ö.; Doğan, M.; Arslan, O. Surface properties of bovine serum albumin—Adsorbed oxides: Adsorption, adsorption kinetics and electrokinetic properties. Microporous Mesoporous Mater. 2006, 96, 331–340. [Google Scholar] [CrossRef]
  21. Fytianos, K.; Voudrias, E.; Raikos, N. Modelling of phosphorus removal from aqueous and wastewater samples using ferric iron. Environ. Pollut. 1998, 101, 123–130. [Google Scholar] [CrossRef]
  22. Zak, D.; Gelbrecht, J. Phosphorus retention at the redox interface of peatlands adjacent to surface waters. Wasser Boden 2002, 54, 71–76. [Google Scholar]
  23. Drizo, A.; Cummings, J.; Weber, D.; Twohig, E.; Druschel, G.; Bourke, B. New evidence for rejuvenation of phosphorus retention capacity in EAF steel slag. Environ. Sci. Technol. 2008, 42, 6191–6197. [Google Scholar] [CrossRef] [PubMed]
  24. Derylo-Marczewska, A.; Swiatkowski, A.; Buczek, B.; Biniak, S. Adsorption equilibria in the systems: Aqueous solutions of organics—Oxidized activated carbon samples obtained from different parts of granules. Fuel 2006, 85, 410–417. [Google Scholar] [CrossRef]
  25. Rozada, F.; Otero, M.; Parra, J.B.; Morán, A.; García, A.I. Producing adsorbents from sewage sludge and discarded tyres. Chem. Eng. J. 2005, 114, 161–169. [Google Scholar] [CrossRef]
  26. Hamoudi, S.; Saad, R.; Belkacemi, K. Adsorptive Removal of Phosphate and Nitrate Anions from Aqueous Solutions Using Ammonium-Functionalized Mesoporous Silica. Ind. Eng. Chem. Res. 2007, 46, 8806–8812. [Google Scholar] [CrossRef]
  27. Mullet, M.; Khare, V.; Ruby, C. XPS study of Fe(II)Fe(III) (oxy)hydroxycarbonate green rust compounds. Surf. Interface Anal. 2008, 40, 323–328. [Google Scholar] [CrossRef]
  28. Shin, E.W.; Han, J.S.; Jang, M.; Min, S.; Park, J.K.; Rowell, R.M. Phosphate Adsorption on Aluminum-Impregnated Mesoporous Silicates: Surface Structure and Behavior of Adsorbents. Environ. Sci. Technol. 2004, 38, 912–917. [Google Scholar] [CrossRef] [PubMed] [Green Version]
  29. Blaney, L.; Cinar, S.; Sengupta, A. Hybrid anion exchanger for trace phosphate removal from water and wastewater. Water Res. 2007, 41, 1603–1613. [Google Scholar] [CrossRef] [PubMed]
Figure 1. SEM image of (a) dried raw sludge, (b) SBB and (c) PAC.
Water 10 00869 g001
Figure 2. Effect of initial pH on the removal of phosphates on SBB and PAC (Phosphate concentration: 20 mg·L−1; adsorbent dosage: 3 g·L−1; contact time: 2 h (KDP), 1 h (STPP), 0.5 h (SGP); shaking rate: 120 r.p.m.).
Water 10 00869 g002
Figure 3. Effect of adsorbent dosage on the removal of phosphates on SBB and PAC (Phosphate concentration: 20 mg·L−1; contact time: 2 h (KDP), 1 h (STPP), 0.5 h (SGP); shaking rate: 120 r.p.m.).
Water 10 00869 g003
Figure 4. C1s XPS spectrums of SBB and PAC before and after phosphate adsorptions.
Water 10 00869 g004
Figure 5. C1s XPS fitting curves of SBB before and after phosphate adsorptions. (a) C1s XPS fitting curves of SBB; (b) C1s XPS fitting curves of KDP-adsorbed SBB; (c) C1s XPS fitting curves of STPP-adsorbed SBB; (d) C1s XPS fitting curves of SGP-adsorbed SBB.
Water 10 00869 g005
Figure 6. Fe (2p3/2) XPS fitting curves of SBB before and after phosphate adsorptions. (a) Fe (2p3/2) XPS fitting curves of SBB; (b) Fe (2p3/2) XPS fitting curves of KDP-adsorbed SBB; (c) Fe (2p3/2) XPS fitting curves of STPP-adsorbed SBB; (d) Fe (2p3/2) XPS fitting curves of SGP-adsorbed SBB.
Water 10 00869 g006
Table 1. Elemental compositions (Atomic %) and oxygen to carbon atomic ratios of sludge-based biochar(SBB) and powder activated carbon (PAC) before and after the phosphate adsorptions estimated by X-ray photoelectron spectroscopy (XPS).
SampleCONSiSPCaFeO/C
SBB60.3525.116.650.592.411.020.523.350.42
KDP-adsorbed SBB56.7429.033.890.41.433.305.210.51
STPP-adsorbed SBB56.5729.134.5201.483.7904.510.51
SGP-adsorbed SBB51.7132.245.100.391.832.690.185.860.62
PAC94.445.56------0.06
KDP-adsorbed PAC93.306.70 -----0.07
STPP-adsorbed PAC93.296.71 -----0.07
SGP-adsorbed PAC93.506.50 -----0.07
Table 2. Final pH of the phosphate solutions after adsorption.
PhosphateAdsorbentInitial pH of the Phosphate Solutions
2.03.04.05.06.07.08.09.010.0
KDPSBB2.33.23.53.53.43.63.93.94.0
PAC2.13.56.36.56.67.27.97.98.5
STPPSBB2.13.43.93.93.94.04.04.14.1
PAC2.03.56.36.77.07.57.88.39.2
SGPSBB2.13.23.83.94.24.34.34.34.4
PAC2.03.46.06.36.67.17.67.88.3
Table 3. Constants in the Langmuir and Freundlich isotherms for the adsorption of KDP, STPP and SGP on SBB or PAC.
SolutionAdsorbentLangmuir ConstantsFreundlich Constants
R2Qmax
(mg·g−1)
K
(L·mg−1)
R2Kf
(mg·g−1)/(mg·L−1)n
1/n
KDPSBB0.97815.150.02990.9660.790.628
PAC0.9313.600.04720.9680.550.373
STPPSBB0.9644.760.43390.9721.100.447
PAC0.9961.360.45020.9720.360.381
SGPSBB0.9827.630.03120.9820.470.580
PAC0.9122.660.06760.9820.580.318
Table 4. Relative contents of surface functional groups (Atomic %) estimated by fitting C1s XPS spectra.
SampleO-C=OC=OC-OR, C-OHC-NC-C
SBB4.167.356.557.3574.60
KDP-adsorbed SBB3.247.0810.146.3173.23
STPP-adsorbed SBB3.367.337.337.3374.65
SGP-adsorbed SBB2.409.809.809.0768.93
Table 5. Relative contents of Fe(II) and Fe(III) multiple peaks in Fe (2p3/2) XPS fitting curves (Percent of total peak area, %) and Fe(III) to Fe total surface ratio.
SampleFePeak 1Peak 2Peak 3Peak 4Fe(III)/Fe(Total)
SBBFe2+2.853.333.78-0.85
Fe3+2.8516.6821.7715.31
KDP-adsorbed SBBFe2+004.75-0.92
Fe3+011.7623.8819.69
STPP-adsorbed SBBFe2+0.461.285.95-0.87
Fe3+5.0610.5521.0116.41
SGP-adsorbed SBB Fe2+006.09-0.91
Fe3+0.4615.5021.9018.06
Note: The Fe(II) and Fe(III) satellite peaks and the single surface structure peak are not shown, so the total peak area of each sample in this table is not equal to 100.

