Water Quality in Representative Tuojiang River Network in Southwest China

1
State Key Laboratory on Environmental Aquatic Chemistry, Research Center for Eco-Environmental Science, Chinese Academy of Science, P.O. Box 2871, Beijing 100085, China
2
University of Chinese Academy of Science, Beijing 100049, China
3
Zhongke Tongde (Beijing) Ecology Technology Co., Ltd., Beijing 100124, China
*
Author to whom correspondence should be addressed.
Water 2018, 10(7), 864; https://doi.org/10.3390/w10070864
Submission received: 25 February 2018
/
Revised: 29 March 2018
/
Accepted: 5 April 2018
/
Published: 29 June 2018
(This article belongs to the Section Water Quality and Contamination)
Abstract
:To control pollutants in rivers, we need to have an understanding of the spatial and temporal variations on water quality in complex river networks. In this study, 153 sampling sties were located in Chengdu segment of Tuojiang River in 2017, 23 monitoring stations in Tuojiang River in the Chengdu segment from 2011 to 2016 were also collected. According to the data from the monitoring station, the concentrations of total nitrogen (TN), total phosphorus (TP), ammonia nitrogen (NH4+), and chemical oxygen demand (CODcr) concentrations were exceeded the water quality targets at 22, 14, 10, and 3 of the 23 monitoring stations, respectively. The regression analysis showed the NH3, TN and TP was increased from 2011 to 2016 (R2NH4+ = 0.30, p < 0.05; R2TN = 0.88, p < 0.05; R2TP = 0.30, p < 0.05), which indicated water quality was deteriorated from 2011 to 2016. In the 153 sample sites, the NH4+, CODcr, TP and TN concentrations exceeded the class III water quality threshold at 23%, 23%, 26%, and 99% of the total sampling sites, respectively. Correlation analysis showed that the main sources of NH4+, CODcr, TN, and TP (R2NH4+-CODcr = 0.572; R2NH4+-TN = 0.543; R2NH4+-TP = 0.537, p < 0.01) were municipal domestic sewage. The main pollutants in Tuojiang river network were TN and TP, high P and N concentrations probably contribute to the deterioration of surface water quality at some sampling sites (R2TPs-TP = 0.183 and R2TNs-NH4+ = 0.472, p < 0.01). TP, TN, TP in the sediments (TPs), and TN in the sediments (TNs) have accumulated in the river system because the river morphology has been changed by, for example, the damage of riparian zones and the construction of water conservation structures. The results from this study will support initiatives to improve the overall water quality and function of the river ecosystem.
1. Introduction
The Yangtze River, the largest river in China, is considered to be one of the mother rivers in China. It has played a vital role in China’s economic and social development, which is home to approximately 39% of China’s population and accounts for nearly 45% of its gross domestic product. The Yangtze River also has an important role in the Belt and Road development strategy [1,2]. The Yangtze River comprises numerous tributaries, such as the Hanjiang, Minjiang, Jialingjiang, and Wujiang Rivers [3]. Most of cities are situated along either the main channel or its tributaries of the Yangtze. While the population has increased and cities have expanded, municipal water treatment facilities have not improved so large volumes of untreated wastewater discharge directly into the Yangtze’s main channel and its tributaries. Also, the river’s continuity has been destroyed by numerous of dams and hydropower stations, which are built to generate electricity and provide irrigation [4]. The combination of ongoing discharges of pollutant-rich water and the slow current have contributed to pollution of the water environment, deterioration of aquatic ecosystems [5,6], rapid shrinkage of lake areas, severe degradation of wetlands, and decreases in biodiversity [7,8]. The water ecological environment has deteriorated to such a degree that aquatic organisms, such as the white-flag dolphin and cowfish, have either decreased significantly or gone extinct [9,10].
The water quality in the tributaries of a river poses various influences and affects the water quality of the main channel, especially where there are reservoirs and meanders upstream. Deterioration or destruction of river morphology will affect the self-purification capacity of the river. Healthy riverbanks should be comprised of vegetated buffer strips [11], but most urban rivers have banks that are simply vertical concrete embankments, which were constructed to leave more space for roads or buildings. Urban rivers generally have many dams that regulate water resources and provide flood control [12,13,14], but they upset the rivers’ continuity and natural rhythm. Large quantities of pollutants, such as phosphorus, accumulate rapidly behind dams [15,16]. While the urban populations have grown and industrial development has intensified, municipal service facilities, such as sewage treatment plants and pipe networks, have been excluded from the development. The large quantities of sewage that flow directly into the rivers have caused very severe eutrophication and toxicity, such that the water in many urban systems is black and odorous [17,18,19,20]. We urgently need to find ways to deal with this black and odorous water as it causes algal blooms, oxygen depletion, fish deaths, and deterioration of the aquatic ecosystem, and raises the cost of treatment for human use [21,22,23].
The Tuojiang River, an important river in the Sichuan Basin, is a first order tributary of the Yangtze River. The Tuojiang is a source of high quality water for the inhabitants of Sichuan Province. It has historical significance as, along with the Jinjiang River, the Tuojiang provided the water to support Sichuan settlers and irrigate the “Land of Abundance” [24]. Large cities in the Tuojiang Watershed include Chengdu, Luzhou, and Deyang. The Tuojiang River rises in the Chengdu area, and the water quality in its upper reaches will affect the water quality downstream and also that of the Yangtze River into which it flows. Unfortunately, the water quality and morphology of the river have been influenced by the dramatic socioeconomic development in the area over recent decades. The aim of this study therefore was to study spatial and temporal variations in water quality in the upper reaches of the Tuojiang River in the Chengdu region. This study investigates basic information about the water quality in the river system and will provide support for river management in the Yangtze River.
2. Materials and Methods
2.1. Site Description and Sample Collection
2.1.1. The River Network of the Tuojiang River in the Chengdu Area
The Qingbaijiang River and the Pihe River are the two main tributaries of the Chengdu segment of Tuojiang River. There are also many canals, including the Xijianghe River, Changliuhe River, and Jinshuihe River, in this part of the river, which form a dense river network. All the tributaries and canals feed into the Tuojiang River, which then flows into the Yangtze River.
2.1.2. Monitoring Stations and Sampling Sites
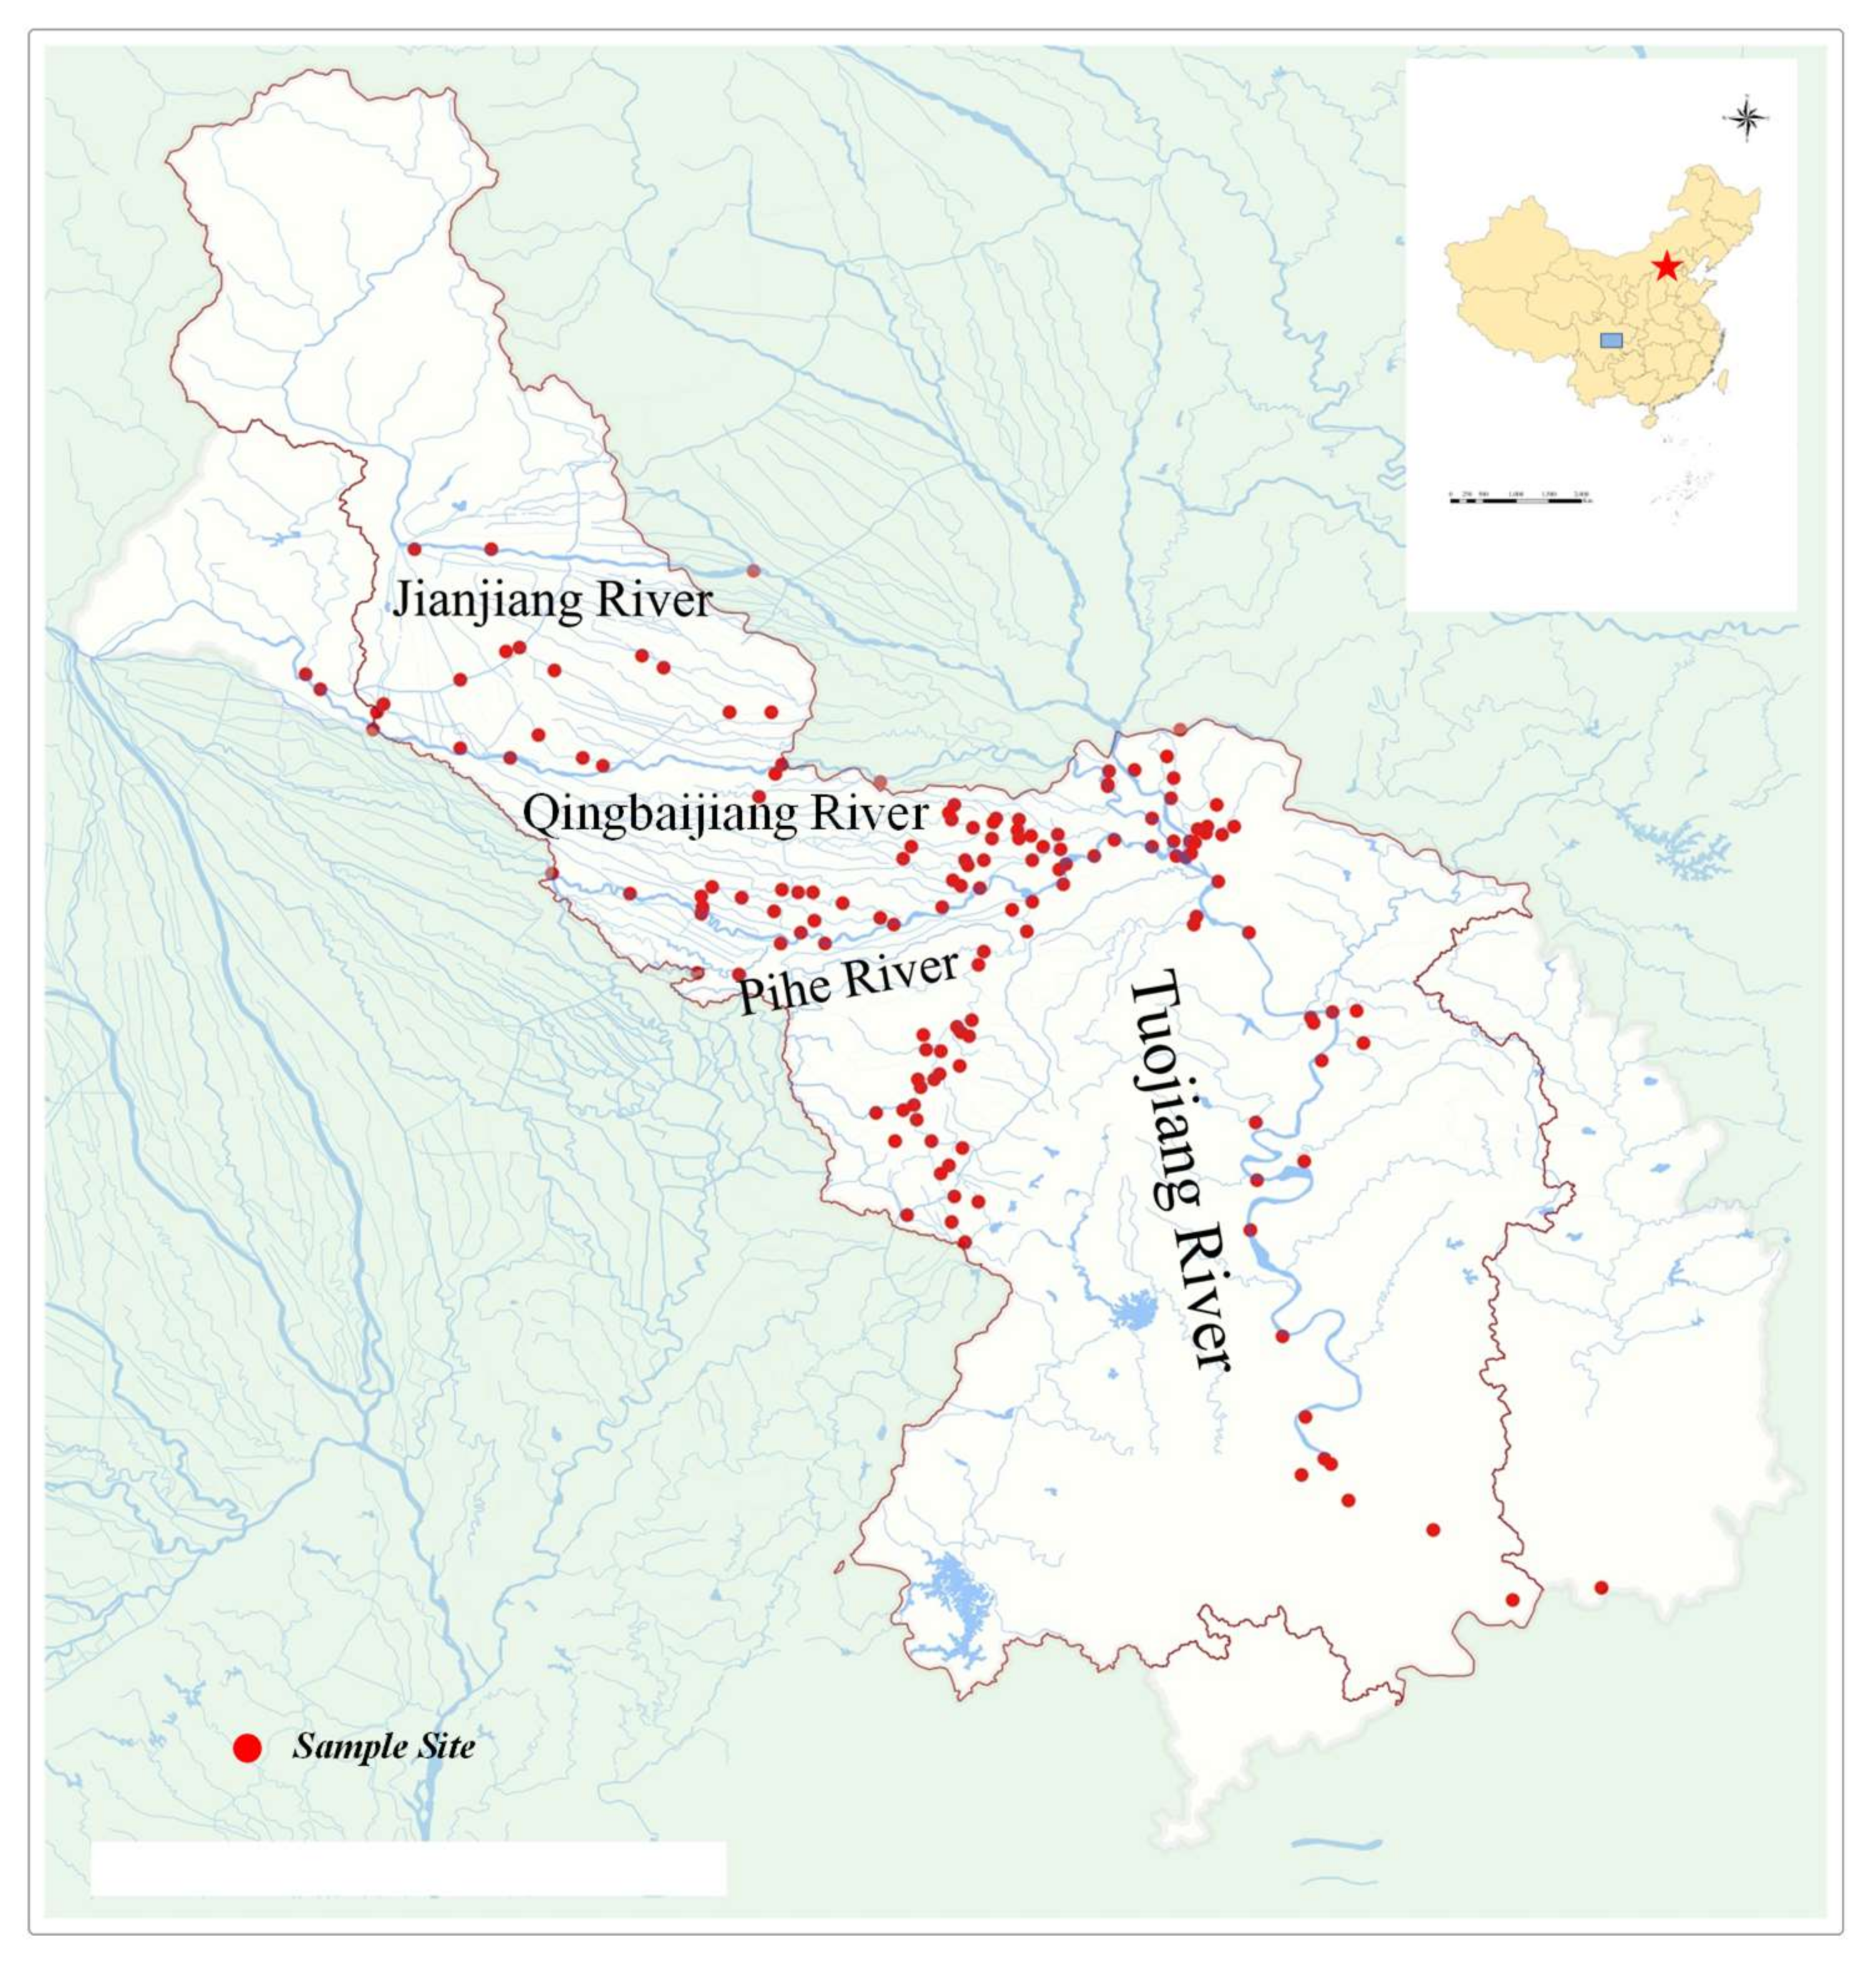
There are numerous monitoring stations in this part of the Tuojiang River (Support Information Figure S1). Monitoring stations are located in the Puyanghe River at Guankoutieqiao (GKTQ) and Luowanchangxia (LWCX) in the Jianjiang River and at Hongjia (HJ), Zhihedianzhan (ZHDZ), Wushuichulichang (WSCLC), Qingjiangdaqiao (QJDQ), and Sanyidaqiao (SYDQ) in the Qingbaijiang River, Xinpidaqiao (XPDQ), Majiatiguanzhan (MJTGZ), Youyiqiao (YYQ), Lanheyan (LHY), Shanquanboyang (SQBY), Xihetianping (XHTP), Guchengqiao (GCQ), Piheerqiao (PHEQ), and Piheyiqiao (PHYQ) in the Pihe River. Monitoring stations on the main channel of the Tuojiang River include those at 201 Yiyuan (201YY), Sanhuangmiao (SHM), Wufengmingyang (WFMY), Hongyuan (HY), Aiminqiao (AMQ), Xinshi (XS) and Linjiangsi (LJS). The data was from 23 monitoring stations during 2011–2016 provided by Chengdu Environmental Protection Agency.
2.2. Sample Collecting and Analysis
A total of 153 sampling sites were set along the main channel, tributaries and secondary canals in the urban area (Figure 1). A total of 153 water samples were collected at August 2017. Overlying water samples (200 mL) were collected from the middle of the river channel at each sampling site with an organic glass sampler (WB-PM, Beijing Splitter Instrument Co., Ltd, Beijing, China). The samples were stored at 4 °C in a portable refrigerator and were immediately transported to the laboratory, where they were analyzed within two days following the standard methods for water and wastewater (Water and Wastewater Monitoring Methods (4th Edition) 2002). Concentrations of total phosphorus (TP) were determined with the molybdate colorimetry method. Total nitrogen (TN) concentrations were determined with the potassium persulfate colorimetric method. Water samples were filtered through a 0.45 µm synthetic fabric filter membrane and then concentrations of soluble ammonium nitrogen (NH4+) were determined with the spectrophotometric blue method. Chemical oxygen demand (CODcr) was determined by the colorimetry method (HACH DR2800) after digestion by COD chromate reagent (HACH DRB200, catalog number 21258-25).
A total of 49 sampling sites were chosen from 153 sample sites to collected sediment samples with a Peterson grab sampler. Three samples were collected at each site with a distance of not less than 500 m between each sub-sampling point. The three samples at the same site were pooled and homogenized to obtain a representative sample. The sediment samples were stored at 4 °C in a portable refrigerator and were immediately transported to the laboratory for freeze-dried at −50 °C (FD-1 freeze-dryer). Once dried, samples were ground, sieved, and passed through a 100-mesh sieve. Samples were quartered to obtain representative samples, and then were stored in sealed plastic bags and stored at room temperature until analysis. Organic matter (OM) in sediments was determined by loss on ignition after heating at 550 °C for 4 h [25]. Total nitrogen in the sediment (TNs) was determined with an element analyzer (Elementar, German, Vario EL III). Total phosphorus in the sediment (TPs) was determined by inductively coupled plasma optical emission spectroscopy (ICP-OES; OPTIMA 8300, Perkin Elmer, Waltham, MA, USA).
2.3. Statistical Analysis
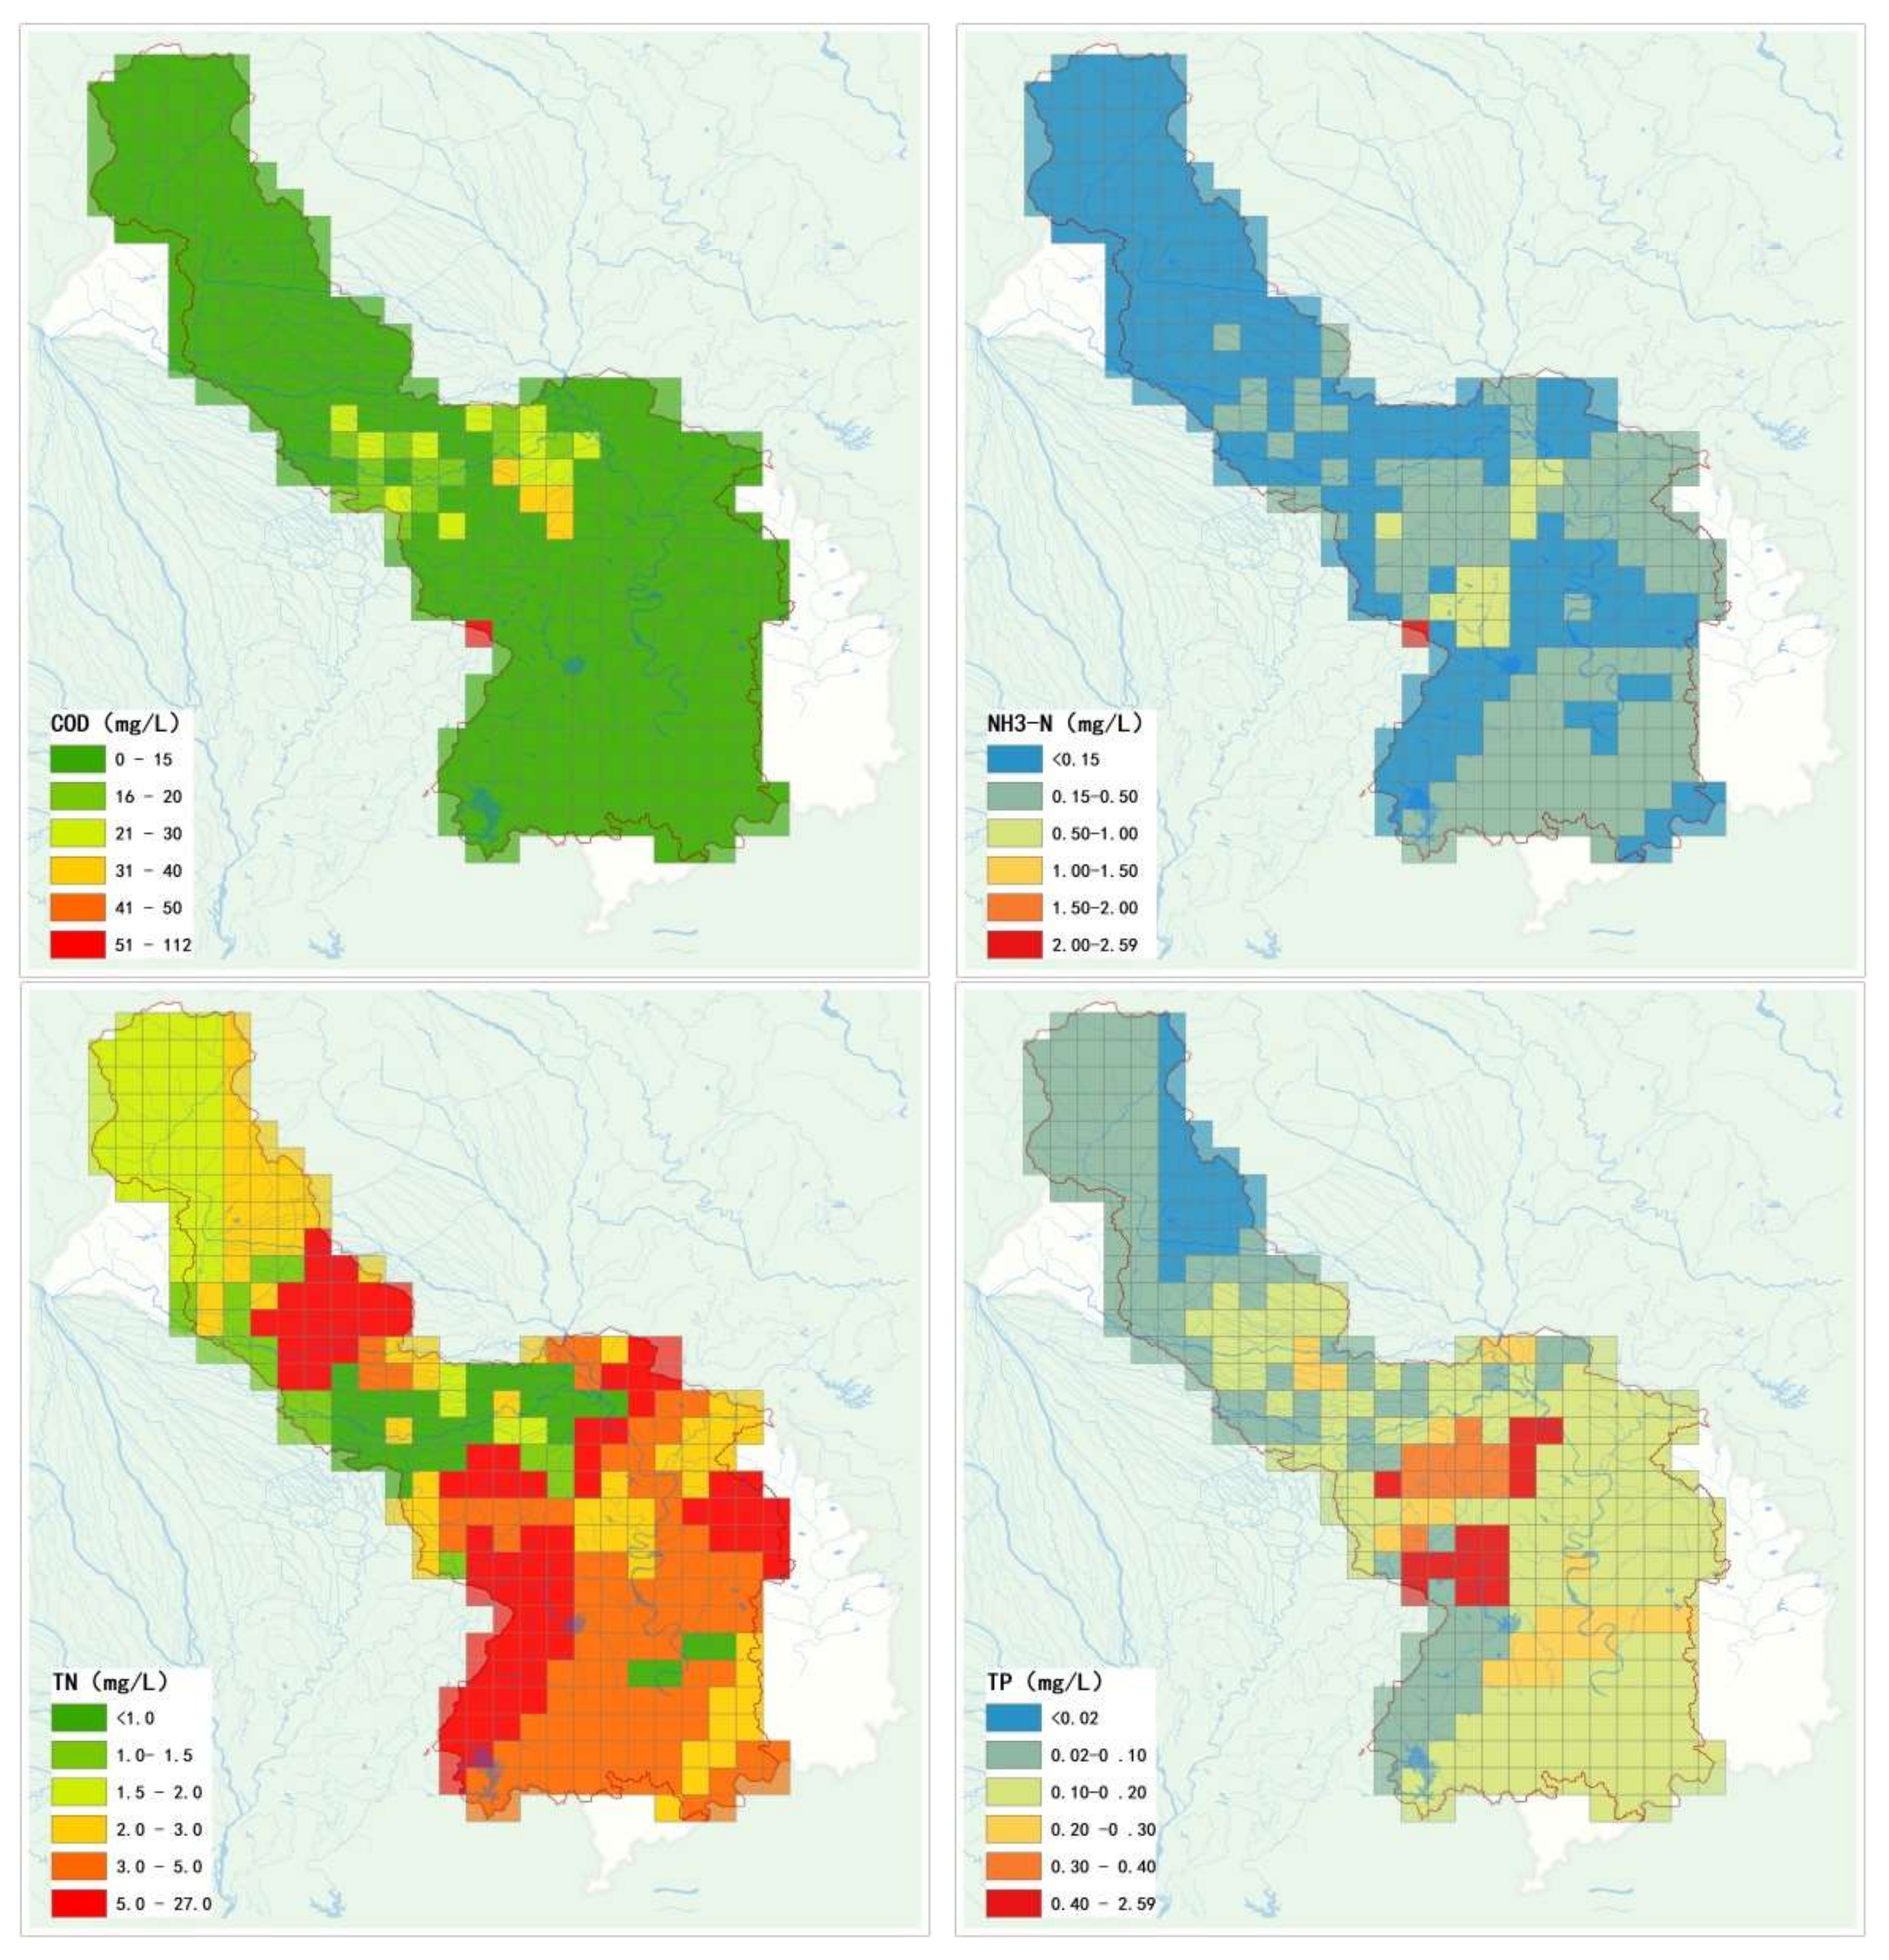
The data were analyzed with SPSS 19.0 for Windows and OriginPro 8.5. Regression analysis correlation analysis was made in this manuscript. All analysis was performed using standard procedure in Microsoft Excel. We used ArcGIS 10.0 to develop spatial variation of COD, NH4+, TN and TP. We tested the data for normality and found that they were normally distributed.
3. Results
3.1. Analysis of Recent Data at Monitoring Stations
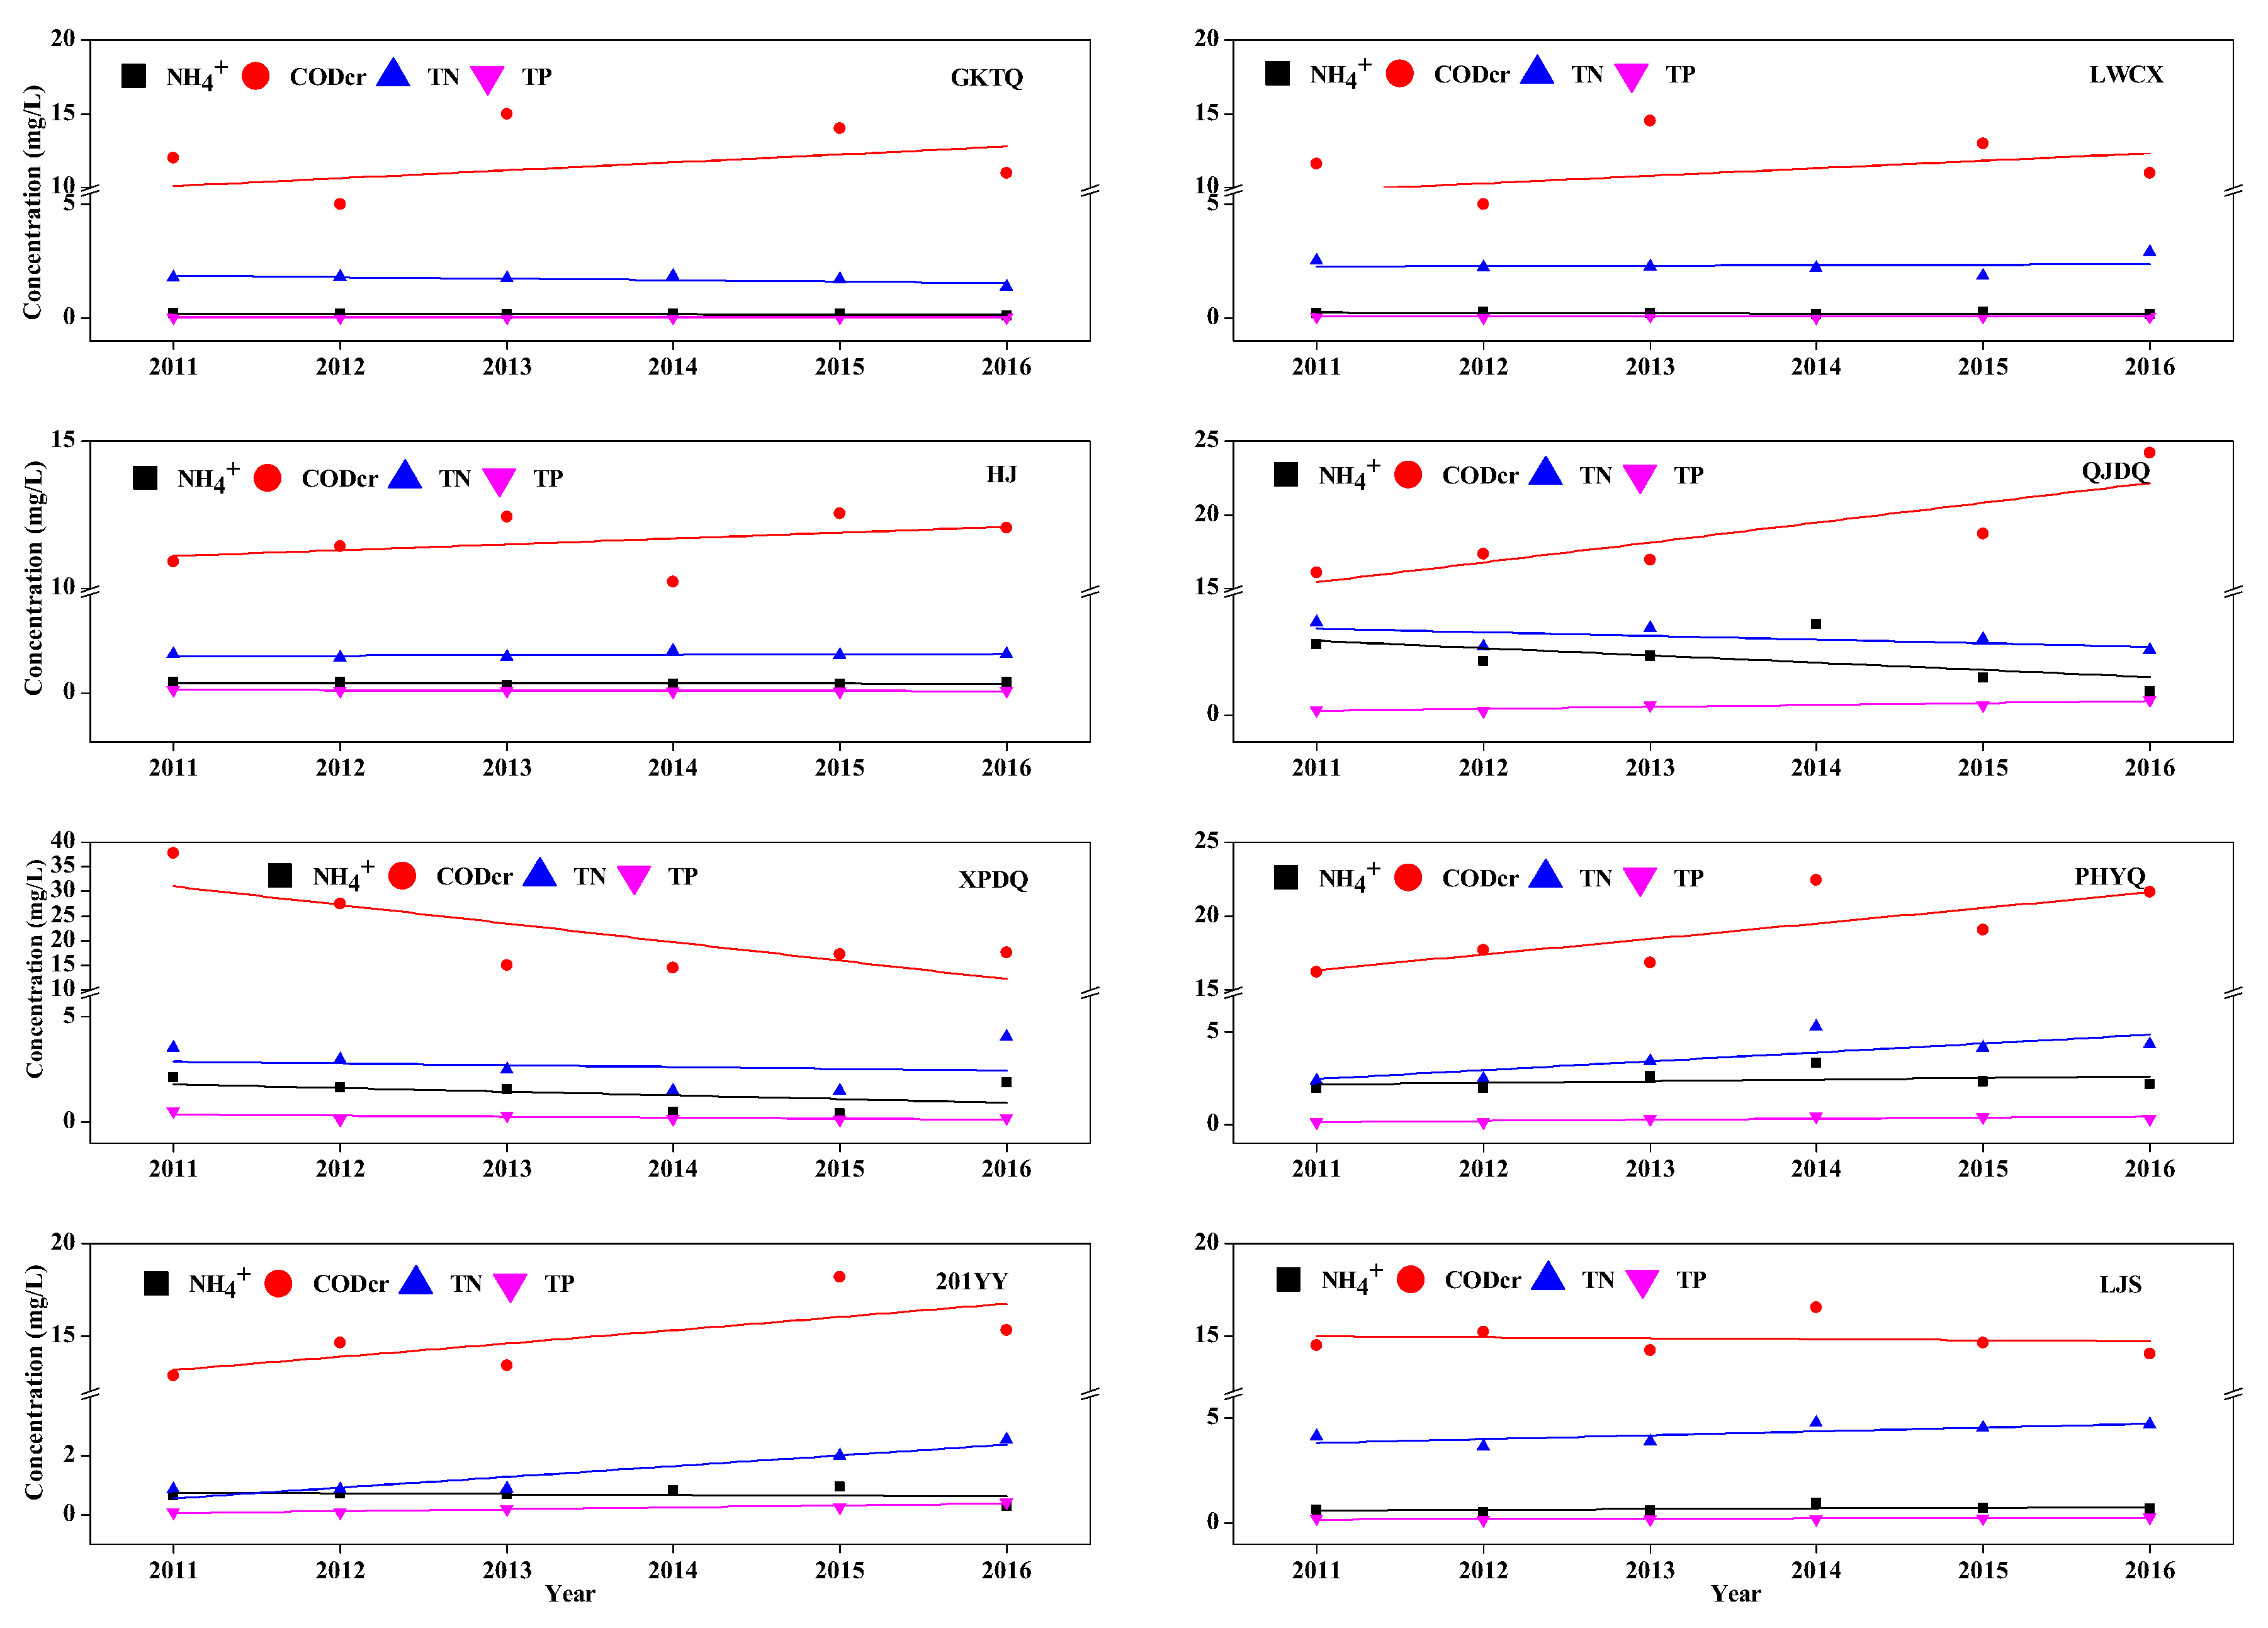
We collected TN, TP, NH4+ and CODcr concentration data for 23 monitoring stations from the river water quality monitoring department (Table 1 and Support Information Figure S2). Analysis of the data showed that concentrations of TN and NH4+ decreased from 2011 to 2016 at the GKTQ, LWCX, QJDQ, and HY monitoring stations, while TP concentrations increased over the same period at the 201YY, SHM, WFMY, HY, AMQ, XS, and LJS monitoring stations. There was no clear pattern in CODcr concentrations from 2011 to 2016. The TN concentrations exceeded the water quality target at all 23 monitoring sites apart from JH, and the TP concentrations exceeded the water quality target at 14 monitoring sites, which are XPDQ, 201YY, QJDQ, YYQ, LHY, XHTP, GCQ, PHEQ, PHYQ, SHM, WFMY, HY, XS, and LJS. The NH4+ concentrations exceeded the water quality target at 10 monitoring stations. The water quality target for CODcr was exceeded at 3 of the 23 monitoring stations, which are XPDQ, YYQ, and XHTP. The regression analysis indicated the NH4+, TN and TP was increased from 2011 to 2016 (R2NH4+ = 0.30, p < 0.05; R2TN = 0.88, p < 0.05; R2TP = 0.30, p < 0.05). The variation tendency of CODcr concentration showed increased at firstly and then decreased during 2011 to 2016 (Support Information Figure S3). Eight typical monitoring stations were chosen for analyzing the variation trend of CODcr, NH4+, TN, and TP. The GKTQ, HJ, XPDQ, 201YY and LWCX, QJDQ, PHYQ, LJS were the representative of the mainly trunk stream (Tuojiang River) and tributary (Jianjiang River, Qingbaijiang River and Pihe River) originate and terminus monitoring stations respectively. The CODcr, NH4+, TN, TP concentration showed the tendency of decreased or remained steady at most of originate monitoring station, except for the CODcr, TN, TP in 201YY monitoring station, which was increased from 2011 to 2016. The CODcr, NH4+, TN, TP concentrations showed the tendency of increased at most of terminus monitoring stations (Figure 2).
3.2. Data from the River Network System
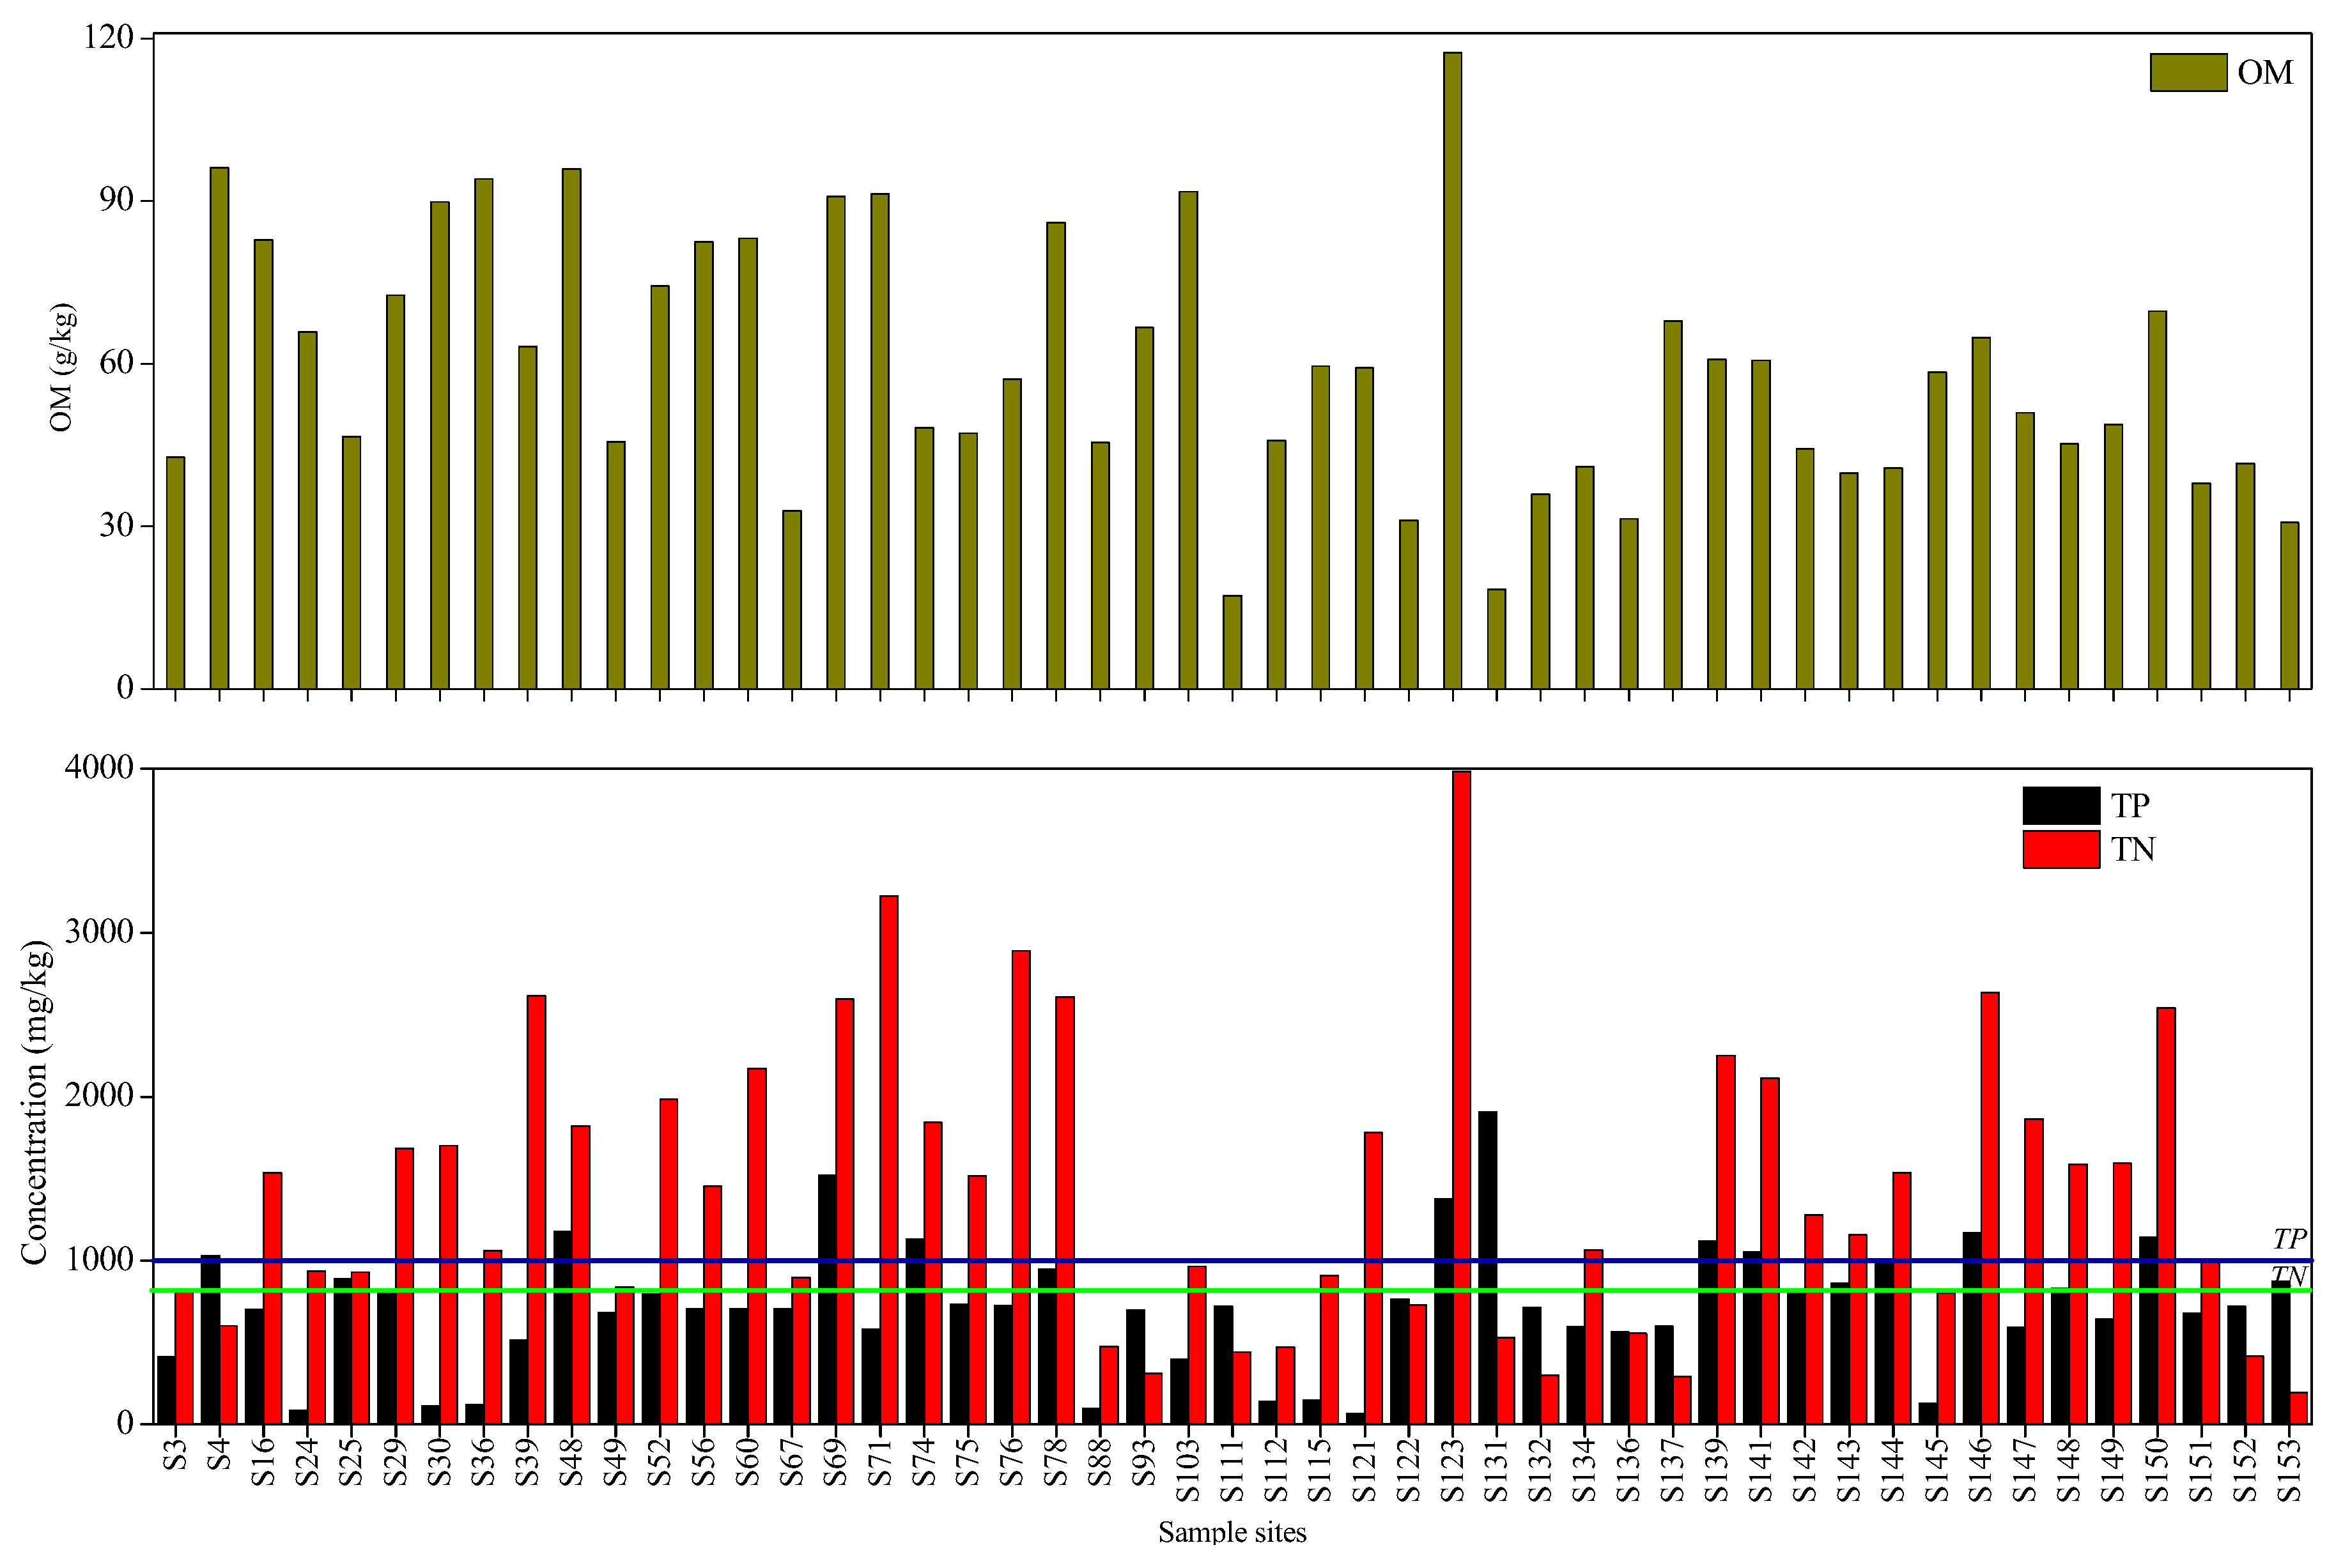
Concentrations of NH4+, TN, TP, and CODcr followed different patterns in the Chengdu segment of the Tuojiang River (Figure 3). The NH4+ concentration ranged from 0.009 to 7.135 mg/L (mean value 0.851 mg/L) and exceeded the class III water quality standard (1 mg/L: National Standard of the People’s Republic of China, Environmental Quality Standards for surface water, GB3838-2002) at 23% of the sampling sites (Table 2). Concentrations of CODcr ranged from 0 to 112 mg/L (mean value 11 mg/L) and exceeded the class III water quality standard of 20 mg/L at 23% of the sampling sites. The TP concentrations ranged from 0.001 to 3.887 mg/L (mean value 0.220 mg/L). Twenty-six percent of the samples exceeded the class III water quality standard for TP at 0.2 mg/L. The TN concentrations ranged from 0.28 to 27.15 mg/L (mean value 4.25 mg/L). The TN concentrations exceeded the class III standard at 1 mg/L in 99% of the sampling sites. The TPs concentrations ranged from 68.8 to 1908.1 mg/kg (mean value 723.6 mg/kg). The TNs concentrations ranged from 195.9 to 3985.9 mg/kg (mean value 1418.0 mg/kg). The OM content ranged from 17.2 to 117.4 g/kg (mean value 59.4 g/kg).
4. Discussion
The results indicated that the river system was seriously contaminated by phosphorus and nitrogen, as was also reported for the Beiyunhe River [18]. Unlike toxic pollutants such as heavy metals and organic pollutants, nutrient contamination does not pose direct impact to humans, but they will cause ecological problems, such as eutrophication [18,26]. There were many sources of nitrogen and phosphorus in this catchment; for example, the increasing use of fertilizers for agriculture will increase the nutrient inputs. Most of the nutrient inputs originate from non-point source pollution. The CODcr, TN and TP input from the non-point pollution were 52.56 × 10⁴, 4.10 × 10⁴ and 0.55 × 10⁴ t, respectively, which were from fertilizers, livestock breeding and domestic garbage [27,28]. Large amounts of nitrogen and phosphorus flow into the river system from the scattered dwellings and through old-fashioned drainage patterns. Correlation analysis indicated that the NH4+, CODcr, TN, and TP were from similar sources (R2NH4+-CODcr = 0.572, p < 0.01; R2NH4+-TN = 0.543, p < 0.01; R2NH4+-TP = 0.537, p < 0.01) (Table 3), which, as verified according to the monitoring data, seemed to be from the canals. Most of the canals in this part of the Tuojiang River were black and odorous [29]. We calculated that 2.43 × 10⁸ t of wastewater were discharged into the rivers, which included 7.79 × 10⁴ t CODcr, 0.94 × 10⁴ t NH4+ and 0.12 × 10⁴ t TP in 2016 on the annual basis (Unpublished data). Municipal domestic sewage accounted for between 48% and 59% of the pollution load. Direct discharges of sewage from urban residential sources therefore need to be controlled to reduce the pollution (Figure 4).
Sediment has an important role as a sink or source of pollutants in freshwater ecosystems [30,31]. The average concentration of TPs was 723.6 mg/kg, which was higher than the background concentration in soil from Chengdu (365 mg/kg). The concentration of TPs surpassed 1000 mg/kg (Figure 4), considered the TPs threshold value by Wang et al. [32]. The average concentration of TNs was 1418.8 mg/kg, which was higher than the average concentration over the entire region of Chengdu (886 mg/kg). The average concentration of OM was 59.4 g/kg, which was even higher than the OM concentrations in Gonghu Lake, Wulihu Lake, Meiliangwan (Tiahu Lake), Poyanghu Lake, Hongzehu Lake, and Dongtinghu Lake [33,34]. Correlation analysis indicated that OM, TNs, and TPs had similar sources (R2OM-TPs = 0.768, p < 0.01; R2OM-TNs = 0.872, p < 0.01) (Table 3 and Figure 5). Correlation analysis of sediment concentrations with dissolved nutrient concentrations also indicated that there was a reasonably high risk that TPs and TNs would be released into the surface water and would influence the surface water quality (R2TPs-TP = 0.183, p < 0.01; R2TNs-NH4+ = 0.472, p < 0.01). The sediment samples were mostly collected from the canals, which look like small branches of a big tree. The river water in these canals move slowly through the denly populated areas and therefore provide the ideal conditions for pollutant accumulation and release at the sediment-water interface [35].
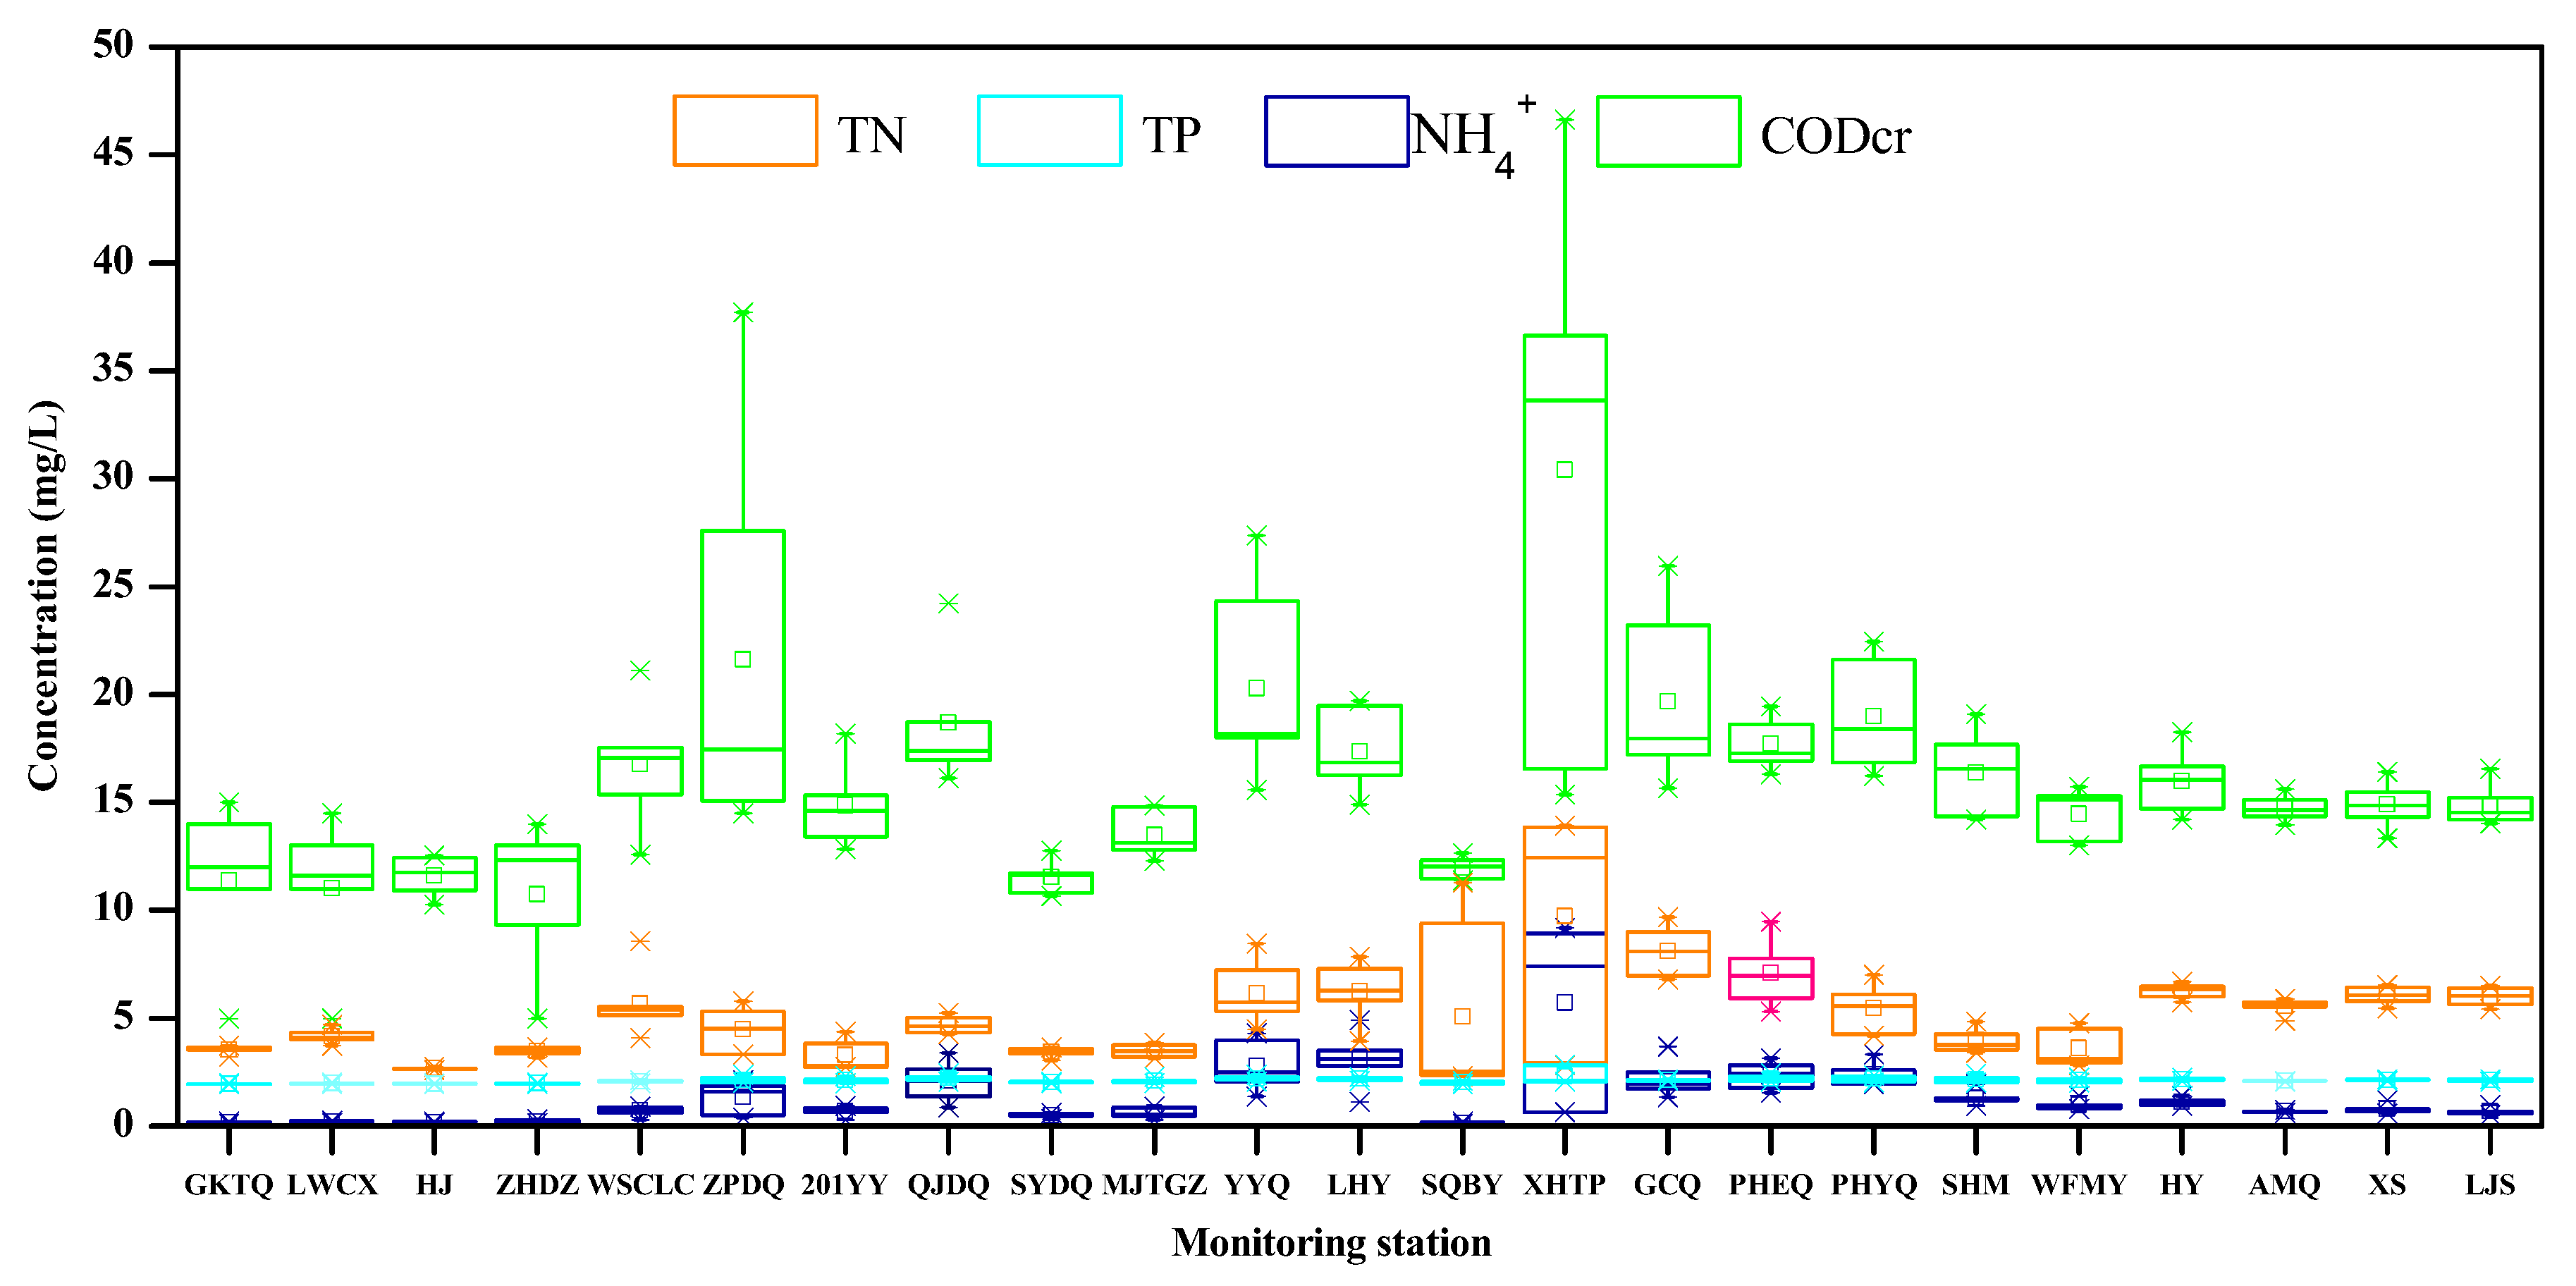
Same as pollutant discharges and internal release, changes to the river morphology have also contributed to the deterioration of the water quality and river ecosystem. Of all the river components, the riparian zone has been damaged dramatically. In natural systems, riparian zones are generally buffer strips with high biodiversity that trap non-point pollutants from the adjacent land, thereby preventing their entry into freshwater systems. While we know that healthy river systems should have vegetated buffer strips [19], in many urban areas, the natural riparian zones have disappeared and have been replaced by vertical concrete embankments, nutrient-rich runoff can flow directly into the river without being intercepted. Dams and other water conservation structures, constructed for irrigation or drinking water, can break the continuity of the river [20]. Water conservation structures can facilitate the accumulation of large amounts of nutrients, such as phosphorus and organic carbon [16,36]. River damming and phosphorus enrichment are related, as phosphorus is trapped by dams, resulting in reduced conveyance along the river continuum [37,38,39,40]. Taylor et al. showed that 18 and 42 G mol/year of reactive phosphorus (RP) and TP were retained by dams globally in 2000, and they predicted that these values would increase to 29 and 61 G mol/year of RP and TPs by 2030 [16]. The effects of urban development are obvious in this part of the Tuojiang River Watershed. The data from the river water quality monitoring department indicated that rivers was more seriously contaminated in Xindu City, Qingbaijiang City, Jintang City, and Longquanyi City than in the other areas. The high TP, TN, NH4+, and CODcr concentrations at the SQBY, XHTP, PHEQ, and PHYQ monitoring stations (Figure 3) highlight the urgent need in effective management of canals and rivers in the urban area.
Our analysis suggests that the factors that responsible for the deterioration of water quality in densely populated river systems are complicated. While many policies and strategies have been developed, the river water quality and ecosystems still need to be managed and improved. As a source of the Yangtze River, the poor water quality and the high nutrient concentrations in the Tuojiang River will enhance the risk of deterioration of the water quality and ecosystems in the main channel of the Yangtze River. In this study, the poor water quality mainly results from the pollutant discharges and the modifications to the river banks. This information can be used to support the development of scientifically robust river governance and management policies for river systems.
5. Conclusions
We obtained data for 6 years for 23 monitoring sites, and collected and analyzed water and sediment samples from 153 and 49 sites in the Chengdu section of the Tuojiang River. The concentrations of the water quality variables showed different patterns. The water quality targets for TN, TP, NH4+, and CODcr were exceeded at 22, 14, 10, and 3 of the 23 monitoring stations, respectively. The river water quality deteriorated at most of the monitoring stations during 2011 to 2016. The data indicated that the main pollutants were TN and TP. Correlation analysis indicated that the NH4+, CODcr, TN, and TP (R2NH4+-CODcr = 0.572, p < 0.01; R2NH4+-TN = 0.543, p < 0.01; R2NH4+-TP = 0.537, p < 0.01) were mainly from municipal domestic sewage. Large amounts of phosphorus and nitrogen accumulated at some sampling sites, which greatly deteriorate the water quality. The impaired river morphology, such as the destruction of the riparian zone and the construction of water conservation structures, contributed to the accumulation of TP, TN, TPs and TNs. The information from this study will support the development of strategies to improve river water quality and river ecosystem function.
Supplementary Materials
The following are available online at https://www.mdpi.com/2073-4441/10/7/864/s1, Figure S1: The concept map of the river system and the monitoring stations, Figure S2: The NH4+, TN, TP and CODcr temporal spatial variation in monitoring station, Figure S3: The NH4+, TN, TP and CODcr temporal spatial variation in monitoring station.
Acknowledgments
This work was supported by the National Natural Science Foundation of China (Grant No. 21507146) and The Youth Innovation Promotion Association CAS (Wenqiang Zhang, 2018058). We thank Deborah Ballantine, from Liwen Bianji, Edanz Editing China (www.liwenbianji.cn/ac), for editing the English text of a draft of this manuscript. We also thank Xin Meng, Zhenhan Li, and Zhixin Song for collecting the samples and data analyzed.
Author Contributions
Wenqiang Zhang, Xin Jin, and Baoqing Shan conceived and designed the experiments; Wenqiang Zhang performed the experiments, analyzed the data and wrote the paper. Xin Jin contributed materials and analysis tools. Huiming Cao and Yu Zhao contributed the manuscript revise. All authors read and approved the final manuscript.
Conflicts of Interest
The authors declare no conflict of interest.
References
- Yu, X.G.; Jiang, J.H.; Jia, S.F. Preliminary discussion on the platform of the research on the Yangtze basin water evolution and the starting points of the research. Resour. Environ. Yangtze Basin 2001, 10, 485–490. [Google Scholar]
- Yao, R.H.; Wang, D.; Sun, H.L.; Sun, Y.H.; Zhao, Y. The basic situation of the Yangtze River water problem and the strategy of prevention and control. Environ. Prot. 2017, 19, 46–48. [Google Scholar]
- Dong, Y.H.; Wang, X.L. Preliminary research on watershed division and stream order classification of the Yangtze River. J. Yangtze River Sci. Res. Inst. 2013, 30, 1–5. [Google Scholar]
- Environmental Evaluation Department of Chinese Academy of Sciences and Changjiang Water Resources Protection Institute. Report on Environmental Impacts of the Three Gorges Hydro-Project at the Yangtze River; Science Press: Beijing, China, 1991. (In Chinese) [Google Scholar]
- Dai, Z.J.; Du, J.Z.; Zhang, X.L.; Su, N.; Li, J.F. Variation of riverine material loads and environmental consequences on the Changjiang (Yangtze) estuary in recent decades (1955–2008). Environ. Sci. Technol. 2011, 45, 223–227. [Google Scholar] [CrossRef] [PubMed]
- Chen, Y.S.; Guo, C.B.; Ye, S.W.; Cheng, F.; Zhang, H.; Wang, L.Z.; Hughes, R.M. Construction: Limit China’s sand mining. Nature 2017, 550, 457. [Google Scholar] [CrossRef] [PubMed]
- Tao, X.L.; Bai, Y.P. The spatial-temporal change pattern of wetland in the middle-lower Yangtze River: A case study of Wuhu, Anhui. Appl. Mech. Mater. 2014, 513, 3228–3232. [Google Scholar] [CrossRef]
- Xie, C.; Huang, X.; Mu, H.Q.; Yin, W. Impacts of land-use changes on the lakes across the Yangtze floodplain in China. Environ. Sci. Technol. 2017, 51, 3669–3677. [Google Scholar] [CrossRef] [PubMed]
- Wang, H.Y.; Yao, T.; Wang, C.S.; Yu, X.B. Treat and pressure for the bio-diversity conservation in the area along the middle reaches of Changjiang River with suggestions on the countermeasure. Resour. Environ. Yangtze Basin 2004, 13, 429–433. [Google Scholar]
- Xie, P. Biodiversity crisis in the Yangtze River: The culprit was dams, followed by overfishing. J. Lake Sci. 2017, 29, 1279–1299. [Google Scholar]
- Stutter, M.I.; Langan, S.J.; Lumsdon, D.G. Vegetated buffer strips can lead to increased release of phosphorus to water: A biogeochemical assessment of the mechanisms. Environ. Sci. Technol. 2009, 43, 1858–1863. [Google Scholar] [CrossRef] [PubMed]
- Aear, D.A.; Mewson, M.D. Environmental changes in river channel: A neglected element. Towards geomorphological typologies, standards and monitoring. Sci. Total Environ. 2003, 310, 17–23. [Google Scholar]
- Yuan, W.; Yang, K.; Xu, Q.X. Effect of urbanization on growth of Shanghai river function and stream structure. Resour. Environ. Yangtze Basin 2005, 14, 133–138. [Google Scholar]
- Yuan, W.; Yang, K.; Tang, M.; Xu, Q.X. Stream structure characteristics and their impact on storage and flood control capacity in the urbanized plain river network. Geogr. Res. 2005, 24, 717–724. [Google Scholar]
- Grill, G.; Lehmer, B.; Lumsdon, A.E.; MacDonald, G.K.; Zarfl, C.; Liermann, C.R. An index-based framework for assessing patterns and trends in river fragmentation and flow regulation by global dams at multiple scales. Environ. Res. Lett. 2015, 10, 15001. [Google Scholar] [CrossRef] [Green Version]
- Taylor, M.; Christopher, T.P.; Christine, R.; Severin, S.; Hans, H.D.; Helen, R.P.; Philippe, V.C. Global phosphorus retention by river damming. Proc. Natl. Acad. Sci. USA 2015, 112, 15603–15608. [Google Scholar]
- Li, W.Z.; Li, X.Y.; Wang, H.L.; Su, J.J. Spatial distribution of the main contamination in aquatic environment in Fuyang River. J. Environ. Sci. 2012, 2, 2814–2819. [Google Scholar]
- Pernet-Coudrier, B.; Qi, W.X.; Liu, H.J.; Müller, B.; Berg, M. Sources and pathways of nutrients in the semi-arid region of Beijing-Tianjin, China. Environ. Sci. Technol. 2012, 46, 5294–5301. [Google Scholar] [CrossRef] [PubMed]
- Shan, B.Q.; Jian, Y.X.; Tang, W.Z.; Zhang, H. Temporal and spatial variation of nitrogen and phosphorus and eutrophication assessment in downstream river network area of North Canal River Watershed. Environ. Sci. 2012, 3, 352–358. [Google Scholar]
- Hobbies, S.E.; Finlay, J.C.; Janke, B.D.; Nidzgorski, D.A.; Millet, D.B.; Baker, L.A. Contrasting nitrogen and phosphorus budgets in urban watersheds and implications for managing urban water pollution. Proc. Natl. Acad. Sci. USA 2017, 114, 4177–4182. [Google Scholar] [CrossRef] [PubMed] [Green Version]
- Smith, V.H.; Schindler, D.W. Eutrophication science: Where do we go from here? Trends Ecol. Evol. 2008, 24, 201–207. [Google Scholar] [CrossRef] [PubMed]
- Nyenje, P.M.; Foppen, J.W.; Uhlenbrook, S.; Kulabako, R.; Muwanga, A. Eutrophication and nutrient release in urban areas of sub-Saharan Africa-A review. Sci. Total Environ. 2010, 408, 447–455. [Google Scholar] [CrossRef] [PubMed]
- Vörösmarty, C.J.; McIntyre, P.B.; Gessner, M.O.; Dudgeon, D.; Prusevich, A.; Green, P.; Glidden, S.; Bunn, S.E.; Sullivan, C.A.; Liermann, C.R.; et al. Global threats to human water security and river biodiversity. Nature 2010, 467, 555–561. [Google Scholar] [CrossRef] [PubMed] [Green Version]
- Luo, K.Y. On the relationship between Dujiangyan irrigation system and the “Land of Abundance”—Special study 2 about the ancient “Land of Abundance”. J. Chengdu Univ. Soc. Sci. 2011, 6, 53–64. [Google Scholar]
- Jensen, H.S.; Kristensen, P.; Jeppesen, E.; Skytthe, A. Iron/Phosphorus ratio in surface sediment as an indicator of phosphate release from aerobic sediments in shallow lakes. Hydrobiologia 1992, 235, 731–743. [Google Scholar] [CrossRef]
- Correll, D.L. The role of phosphorus in the eutrophication of receiving waters: A review. J. Environ. Qual. 1998, 27, 261–266. [Google Scholar] [CrossRef]
- Hu, Y.Y.; Wang, Y.D.; Li, T.X.; Zheng, Z.C.; Pu, Y. Characteristics analysis of agricultural nonpoint source pollution on Tuojiang River Basin. Sci. Agric. Sin. 2015, 48, 3654–3665. [Google Scholar]
- Qi, H.; Wu, J.; Tian, X.G.; Yang, G.; Tang, L.J. Non-point pollution status and control measures in Ziyang section of Tuojiang watershed. J. Anhui Agric. Sci. 2011, 39, 1679–1682. [Google Scholar]
- Ministry of Housing and Urban-Rural Development of the People’s Republic of China. Guidelines for Remediation of Black and Odorous Water Bodies in Cities; Ministry of Housing and Urban-Rural Development of the People’s Republic of China: Beijing, China, 2015.
- Huo, S.L.; Zhang, J.T.; Yeager, K.M.; Xi, B.D.; Wang, J.; He, Z.S.; Wu, F.C. High-resolution profiles of dissolved reactive phosphorus in overlying water and porewater of Lake Taihu, China. Environ. Sci. Pollut. Res. 2014, 21, 12989–12999. [Google Scholar] [CrossRef] [PubMed]
- Zhang, W.Q.; Zhu, X.L.; Jin, X.; Meng, X.; Tang, W.Z.; Shan, B.Q. Evidence for organic phosphorus activation and transformation at the sediment-water interface during plant debris decomposition. Sci. Total Environ. 2017, 583, 458–465. [Google Scholar] [CrossRef] [PubMed]
- Wang, J.; Zhang, J.T.; Zan, F.Y.; Xi, B.D.; Huo, S.L. Study on sediment TN and TP criteria in Eastern Shallow Lakes, China. Ecol. Environ. Sci. 2014, 23, 992–999. [Google Scholar]
- Meng, F.D.; Jiang, X.; Jin, X.C. Physcial-Chemical characteristics of the sediments in lakes from the middle and lower reaches of the Yangtze River. Res. Environ. Sci. 2004, 17, 24–29. [Google Scholar]
- Zhang, W.J.; Wu, J.S.; Xiao, H.A.; Dong, C.L. Profile distribution characteristics and accumulation of organic carbon in typical wetlands in SANJIANG plain. Adv. Earth Sci. 2004, 19, 558–562. [Google Scholar]
- Yi, W.L.; Wang, S.R.; Jin, X.C.; Wang, G.D. Distribution of total organic matter and the forms on the sediments from shallow lakes in the Middle and Lower Reaches of the Yangtze River. J. Northwest A F Univ. 2008, 36, 141–147. [Google Scholar]
- Wu, Z.H.; Wang, S.R. Release mechanism and kinetic exchange for phosphorus (P) in lake sediment characterized by diffusive gradients in thin film (DGT). J. Hazard. Mater. 2017, 331, 36–44. [Google Scholar] [CrossRef] [PubMed]
- Tayor, M.; Ronny, L.; Pierre, R.; Philippe, V.C. Global perturbation of organic carbon cycling by river damming. Nat. Commun. 2017, 8, 15347. [Google Scholar] [CrossRef] [Green Version]
- Friedl, G.; Wüest, A. Disrupting biogeochemical cycles—Consequences of damming. Aquat. Sci. 2002, 64, 55–65. [Google Scholar] [CrossRef]
- Teodoru, C.; Wehrli, B. Retention of sediments and nutrients in the Iron Gate I Reservoir on the Danube River. Biogeochemistry 2005, 76, 539–565. [Google Scholar] [CrossRef]
- Harrison, J.A.; Bouwman, A.F.; Mayorga, E.; Seitzinger, S. Magnitudes and sources of dissolved inorganic phosphorus inputs to surface fresh waters and the coastal zone: A new global model. Glob. Biogeochem. Cycles 2010, 24, 355–365. [Google Scholar] [CrossRef]
Figure 1.
The map of river systems and sample sites.

Figure 2.
Temporal variations of NH4+, TN, TP and CODcr in the typical monitoring station.

Figure 3.
The spatial variation of COD, NH4+, TN and TP in Chengdu segment of Tuojiang River watershed.
Figure 3.
The spatial variation of COD, NH4+, TN and TP in Chengdu segment of Tuojiang River watershed.

Figure 4.
The variation of TN, TP, NH4+ and CODcr in monitoring station.

Figure 5.
The distribution of TNs, TPs and OM in the surface sediment.


Table 1.
The pollutant condition in the monitoring stations.
| MS | WQT | NH4+ | TN | TP | CODcr | ||||
|---|---|---|---|---|---|---|---|---|---|
| C | TUS * | C | TUS | C | TUS | C | TUS | ||
| GKTQ | III | 0.17 | 1.64 | 0.64 | 0.04 | 12.79 | |||
| LWCZ | III | 0.19 | 2.35 | 1.35 | 0.06 | 9.08 | |||
| HJ | III | 0.19 | 0.76 | 0.05 | 11.43 | ||||
| ZHDZ | III | 0.24 | 1.63 | 0.63 | 0.05 | 10.02 | |||
| WSCLC | III | 0.69 | 3.54 | 2.54 | 0.15 | 16.54 | |||
| XPDQ | III | 1.35 | 0.35 | 2.65 | 1.65 | 0.23 | 0.16 | 21.60 | 0.08 |
| 201YY | III | 0.68 | 1.43 | 0.43 | 0.21 | 0.05 | 14.80 | ||
| QJDQ | III | 2.09 | 1.09 | 2.89 | 1.89 | 0.33 | 0.67 | 18.60 | |
| SYDQ | III | 0.51 | 1.56 | 0.56 | 0.12 | 11.50 | |||
| MJTGZ | III | 0.60 | 1.63 | 0.63 | 0.17 | 13.50 | |||
| YYQ | III | 2.79 | 1.79 | 4.41 | 3.41 | 0.30 | 0.50 | 20.20 | 0.01 |
| LHY | III | 3.09 | 2.09 | 4.50 | 3.50 | 0.29 | 0.47 | 17.30 | |
| SQBY | III | 0.15 | 3.31 | 2.31 | 0.10 | 12.13 | |||
| XHTP | III | 5.55 | 4.55 | 8.27 | 7.27 | 0.41 | 1.07 | 32.01 | 0.60 |
| GCQ | III | 2.19 | 1.19 | 6.44 | 5.44 | 0.21 | 0.03 | 19.60 | |
| PHEQ | III | 2.36 | 1.36 | 5.37 | 4.37 | 0.30 | 0.49 | 17.70 | |
| PHYQ | III | 2.39 | 1.39 | 3.67 | 2.67 | 0.29 | 0.47 | 18.90 | |
| SHM | III | 1.31 | 0.31 | 2.12 | 1.12 | 0.26 | 0.30 | 16.30 | |
| WFMY | III | 0.97 | 1.77 | 0.77 | 0.20 | 0.02 | 14.40 | ||
| HY | III | 1.02 | 0.02 | 4.29 | 3.29 | 0.28 | 0.40 | 15.35 | |
| AMQ | III | 0.71 | 4.04 | 3.04 | 0.17 | 14.64 | |||
| XS | IV | 0.70 | 4.20 | 3.20 | 0.21 | 0.05 | 14.49 | ||
| LJS | III | 0.78 | 4.29 | 3.29 | 0.23 | 0.17 | 14.22 | ||
C, Concentration; TUS, Times of Ultra Standard; MS, Monitoring Station; WQT, Water Quality Target. *, TUS = The measured data-Surface water quality standard of III (GB3838-2002, Table 2)/Surface water quality standard of III.
Table 2.
The surface water quality (mg/L) *.
| WQI # | I | II | III | IV | V |
|---|---|---|---|---|---|
| NH4+ | 0.15 | 0.5 | 1.0 | 1.5 | 2.0 |
| TN | 0.2 | 0.5 | 1.0 | 1.5 | 2.0 |
| TP | 0.02 | 0.1 | 0.2 | 0.3 | 0.4 |
| CODcr | 15 | 15 | 20 | 30 | 40 |
* Environmental quality standards for surface water (GB3838-2002); # WQI: Water Quality Index.
Table 3.
Pearson correlation coefficients for TN, TP, CODcr, NH4+ in surface water and TN, TP, OM in the surface sediment.
Table 3.
Pearson correlation coefficients for TN, TP, CODcr, NH4+ in surface water and TN, TP, OM in the surface sediment.
| TN | NH4+ | TP | CODcr | OM | TPs | TNs | |
|---|---|---|---|---|---|---|---|
| TN | 1 | 0.168 * | 0.574 ** | 0.192 * | 0.056 | −0.019 | 0.062 |
| NH4+ | 1 | 0.503 ** | 0.654 ** | 0.333 ** | 0.442 ** | 0.472 ** | |
| TP | 1 | 0.573 ** | 0.243 ** | 0.183 * | 0.244 ** | ||
| CODcr | 1 | 0.175 * | 0.275 ** | 0.270 ** | |||
| OM | 1 | 0.768 ** | 0.872 ** | ||||
| TPs | 1 | 0.784 ** | |||||
| TNs | 1 |
* Correlation is significant at the 0.05 level (2-tailed). ** Correlation is significant at the 0.01 level (2-tailed).
© 2018 by the authors. Licensee MDPI, Basel, Switzerland. This article is an open access article distributed under the terms and conditions of the Creative Commons Attribution (CC BY) license (http://creativecommons.org/licenses/by/4.0/).
Share and Cite
MDPI and ACS Style
Zhang, W.; Jin, X.; Cao, H.; Zhao, Y.; Shan, B. Water Quality in Representative Tuojiang River Network in Southwest China. Water 2018, 10, 864. https://doi.org/10.3390/w10070864
AMA Style
Zhang W, Jin X, Cao H, Zhao Y, Shan B. Water Quality in Representative Tuojiang River Network in Southwest China. Water. 2018; 10(7):864. https://doi.org/10.3390/w10070864
Chicago/Turabian StyleZhang, Wenqiang, Xin Jin, Huiming Cao, Yu Zhao, and Baoqing Shan. 2018. "Water Quality in Representative Tuojiang River Network in Southwest China" Water 10, no. 7: 864. https://doi.org/10.3390/w10070864
Note that from the first issue of 2016, this journal uses article numbers instead of page numbers. See further details here.