Membrane Fouling for Produced Water Treatment: A Review Study From a Process Control Perspective


Department of Energy Technology, Aalborg University, DK-6700 Esbjerg, Denmark
*
Author to whom correspondence should be addressed.
Water 2018, 10(7), 847; https://doi.org/10.3390/w10070847
Submission received: 9 May 2018
/
Revised: 7 June 2018
/
Accepted: 19 June 2018
/
Published: 26 June 2018
(This article belongs to the Special Issue Recent Advances in Water and Wastewater Treatment with Emphasis in Membrane Treatment Operations)
Abstract
:The offshore oil and gas industry is experiencing increasing water cuts as the reservoirs mature. The increase in produced water stresses the currently deployed deoiling technologies, resulting in more oil in the discharged water. Deploying membrane filtration to reduce the hydrocarbon concentration inherits additional complications related to fouling of the membranes: A process where the accumulation of material within and on the membrane surface adds additional flow resistance. This paper reviews and analyses the fouling detection, removal, prevention, dynamical and static modeling, with emphasis on how the membrane process can be manipulated from a process control perspective. The majority of the models rely on static descriptions or are limited to a narrow range of operating conditions which limits the usability of the models. This paper concludes that although the membrane filtration has been successfully applied and matured in many other industrial areas, challenges regarding cost-effective mitigation of fouling in the offshore deoiling applications, still exist. Fouling-based modeling combined with online parameter identification could potentially expand the operating range of the models and facilitate advanced control design to address transient performance and scheduling of fouling removal methods, resulting in cost-effective operation of membrane filtration systems. With the benefits of membrane filtration, it is predicted that membrane technology will be incorporated in produced water treatment, if the zero-discharge policies are enforced globally.
1. Introduction
In offshore oil and gas production, an increasing environmental concern is the enormous amounts of produced water (PW) discharged into the oceans. Matured oil fields in the Danish North Sea produce three barrels of water for every barrel of oil [1]. The extraordinary amount of PW is considered the largest stream of contaminated water in the exploration and production of oil and gas [2]. The PW can be discharged to the sea if treated to comply with governmental regulations. The governmental regulations for discharge into the North Sea is a concentration of 30 mg/L oil-in-water (OiW) and a maximum of 202 tonnes of oil discharged in 2017 and 2018 [3]. In 2015 the Danish Environmental Protection Agency reported a total of 193 tonnes of dispersed oil discharged, which is remarkably close to the allowed amount [4], hence fundamental change is required to guarantee compliance with future governmental regulations.
The currently used technologies in the oil and gas sector, for water purification and oil removal, are mainly: Gas flotation, hydrocyclone, and gravity-based separator [5]. While these technologies provide sufficient oil and water separation to comply with the current regulation, a growing environmental concern may force regulation to become stricter. Common operational performance of the hydrocyclone reduces the OiW concentration to 20–80 mg/L [6], and the separation efficiency is highly depending on droplet size [7]. In general, larger oil droplets are easily separated compared to smaller droplets, especially for gravity-based methods [8,9].
Previous studies have investigated the characteristics and the available technologies for produced water treatment (PWT) and found membrane filtration to be a promising candidate for improving separation efficiency [10,11,12,13,14] examples of membrane filtration deployment is summarized in [11]. Membrane filtration is the process of using a semi-permeable material with very small pores to filter substances based on droplet and particle size. Especially ceramic membranes and their advantages, such as chemical, mechanical, and thermal stability and narrow pore size distribution, are well suited for PWT [10,15,16]. The pressure-driven membranes are commonly divided into four categories based on pore size; microfiltration (MF), ultrafiltration (UF), nanofiltration (NF) and reverse osmosis (RO), where UF where found to be superior for reducing OIW concentration [10,12,13,14,17,18]. NF and RO have also been deployed when silica, dissolved organic matter, and salt are to be removed from the produced water [11].
Studies in PWT using membrane filtration showed that fouling is a considerable problem [19,20,21,22,23]. Fouling, i.e., accumulation of contaminants inside the membrane and on the membrane surface, reduces the permeability, and thereby cost-effectiveness of the membrane. In short, fouling can be either reversible or irreversible, and appears as; scaling, silt, biofouling, and organic fouling [24]. The reduction in flux caused by fouling can be as high as 80%, even when antifouling measures such as backwash and crossflow (CF) are deployed [15].
The unavoidable fouling necessitates additional installation footprint (the space needed for the installation) to compensate for the reduced permeability caused by the fouling. In offshore cases, this leads to undesirable weight and space demands, which are crucial factors for cost-effective offshore installations [6,10,25].
Several recent review studies have been carried out for membrane filtration of produced water, see [10,15,26,27,28,29,30,31]. The studies address the complexity and composition of PW [15,26,27,28,30], chemical pretreatment [10,28,31], physical pretreatment [10], membrane materials and modification [27,30], membrane pore size and its effect on PWT [26,27,28,31], and steady state operating conditions and its effect on the filtration system [27]. However, none of the reviews address the membrane filtration system from a process control perspective, which is the main focus of this review. The compelling room for improvement in process control is confirmed in [32], regarding the following areas:
- Scheduling of fouling removal measures.
- Scheduling of fouling prevention measures.
- Process optimization, to minimize operational and maintenance costs, where cost is a balance of fouling removal, process uptime, installation footprint, and process throughput.
It is these items that will be addressed in this study, whereas membrane material and chemicals can significantly improve membrane filtration performance [11,33,34], but the focus of this review remains control oriented. A series of models will be described and their potential application in process control design will be discussed. Fundamental hydrodynamic effects, interactions on a molecular level, and chemical effects are not considered in this work, as such effects would result in an unnecessary high model complexity which is not beneficial for control design. Figure 1 shows an overview of a CF membrane filtration system and the common terms associated with it.
2. Filtration of Produced Water
A detailed description of PW is covered in [26,30], but in general PW is an OiW emulsion, where oil is dissolved in water. The emulsion is stabilized by the naturally occurring surfactants from the reservoir. The properties and composition of the PW change according to the oil field, well, field maturity, and artificially added chemicals, such as corrosion inhibitors and biocides. In particular the immense variation between wells ensures that a standardized filtration solution is near impossible design, and therefore filtration systems are often designed for a specific well or oil field [35,36].
The essential part, from a control perspective, is that the PW properties are changing and with the large variance between different wells an unified control solution for the filtration unit must adapt to those conditions. Typical industrial applications of the membrane technology are food industry, pharmaceutical, biotechnological, and chemical sectors, all of which are very well designed controlled processes where the flow, pressure, and feed properties are predictable throughout the lifetime of the membranes. On the contrary, PWT conditions can significantly change with time, especially feed properties and flow rate can change with the maturity of the oil field.
The majority of the studies on membrane filtration deal with separation of liquid and non-deformable material. For the studies addressing OiW separation, the deformability of oil is often not considered, examples hereof [37,38,39,40]. For membrane filtration of PW, it is necessary to consider the ramifications that deformation of the oil droplets can have on the defined methods and models. Depending on the driving pressure and interfacial tension forces, oil droplets can be forced to deform and be pushed through the pores that are narrower than the droplet’s diameter. In comparison, rigid solid particles either permeate or become rejected independently of pressure but determined by pore size [41], the deformation of an oil droplet is illustrated in Figure 2. To determine if an oil droplet permeates or is rejected by the membrane, a set of general parameters are defined in Equation (1), and a droplet is forced through the constricted channel if
is satisfied [42].
A model describing the TMP required for a droplet to deform and permeate the membrane (critical pressure) was proposed in [43], later corrected in [44] (Equation (2)), and validated in [41]. The critical pressure required is described as:
Figure 3 is generated to show examples of as function of droplet size, where and are defined in [41] to be and 14 dyn/cm respectively. It should be noted that and depend on oil composition and added chemical agents, which for PW are known to be varying over time [45].
The general trend of Figure 3 indicates that once above some droplet diameter, in this case, 0.5 m, the only increases asymptotically to a constant value, whereas the is much more reliant on membrane pore size. This indicates that once above some droplet size, the oil droplets and solid particles act similarly regarding being fully blocked, similar conclusions were made in [41,45].
A comprehensive investigation into the deformation of droplets for CF MF of an OiW mixture (OiWM) has been made in [46]. According to simulations of CF filtration, at TMPs less than 1 bar and a pore size of 0.2 m, droplets above 0.9 m are rejected [41]. At higher CF velocity (CFV) the contact angle changes and higher pressures are required for oil droplets to permeate the membrane, thus increasing separation efficiency. However, oil droplet breakup occurs at too high CFV, reducing separation efficiency. Results, which have been replicated using computational fluid dynamics technique [47].
Analytic [18,41,48] and experimental [49,50,51] studies, summarized in Table 1, shows critical pressures found based on different experiments and models. Critical pressures for experimental studies are determined based on steady state removal efficiency and TMP, if the removal efficiency suddenly drops as pressure increases, it is assumed to be the critical pressure. In the experimental studies on oil removal using MF, the removal efficiency was observed to decrease once the TMP increases above 1.5 bar [50,51]. This verifies the results in [41,43], where the critical pressure was found to be within [1–2] bars. The analytic and experimental results, in Table 1, are within acceptable tolerance given the difference in pore and droplet size and model assumptions.
The examined critical pressure models do not directly consider how fouling behavior of oil differs from solid particles, but still, some conclusions can be made:
- At steady state, an oil droplet larger than the pore size may permeate the membrane if the TMP is large enough.
- It is generally not considered how dynamic changes in TMP affect the oil droplets’ ability to permeate the membrane.
- Ideally maintaining the TMP below the critical pressure causes an unrealistic low TMP given the droplet distribution.
The deformability of oil is not necessarily an entirely undesired effect, as applying high reverse pressure causes stuck oil droplets in the pores to deform and exit the membrane. Applying heat with the cleaning media lowers the viscosity and allows stuck oil droplets to easier deform and exit the membrane pores, a similar technique is exploited when extracting bitumen from the reservoir by injecting steam [11]. Furthermore, because oil droplets can deform, transient performance of especially the TMP is important, if the permeate quality is to be maintained.
3. Critical Flux Concept
The critical flux is a well defined and observed concept that is widely used within the field of membrane filtration. This section shortly introduces the critical flux concept, and highlights some studies where critical flux is observed. The critical flux hypothesis is defined as: There exists a critical flux, , such that yields , or alternatively, while the flux is less than the critical flux, no or little fouling occurs [52,53,54,55]. The critical flux is frequently used as a measure of membrane performance and is dependent on solute density, particle diameter, particle form factor, porosity, hydrodynamics, and temperature [55]. The critical flux behavior is clearly observed inside and outside the laboratory environment [56,57], and its behavior for an OiWM was recently investigated in [58,59].
Operating membrane filtration at sub-critical flux leads to less fouling and resistance, hence reducing energy consumption. For offshore deployment, installation footprint is the critical factor to consider, especially as membrane filtration technology requires around 3 times larger footprint compared to the hydrocyclone technology [6]. To minimize the required footprint, it is essential to operate the membranes at supercritical flux (above the critical flux) with a manageable degree of fouling.
In some cases, fouling is observed even when the operational flux is below the estimated critical flux [60,61,62]. It can conceivably be caused by either an unnoticeable low fouling rate inside the membrane pores or that each droplet size has a specific critical flux resulting in a distribution of critical fluxes whereas the critical flux identified is often not the lowest critical flux [63]. The low fouling rate can cause flux to locally exceed the critical flux (illustrated in Figure 4), causing the fouling to suddenly accelerate [53,62]. From a control perspective, the problem could possibly be avoided by ensuring that the local flux remains below the critical flux. To do so, the control strategy must be able to control the local flux. As local flux is not a direct measurement it must be estimated based on available sensors, e.g., pressure and flow measurements.
3.1. Critical Flux Identification
A widely used method for identifying the critical flux is flux-stepping. Flux-stepping is where the flux is increased in steps, and fouling accumulation is evaluated for each step [56,64,65,66]. At the flux where fouling begins to accumulate, the previous flux step is assumed to be the critical flux [52]. Alternative versions of flux-stepping exist, where relaxation (zero or nearly zero flux) of the membrane is applied between each increment in flux as illustrated in Figure 5. The CF in the relaxation phase removes some reversible fouling and provides an opportunity to estimate at which flux irreversible fouling occurs [53]. A slightly different procedure is proposed and investigated in [67,68].
A gray-box-model has be used as an alternative to experimentally identify the critical flux under different conditions, as seen in Equation (3) [69].
The model was validated with satisfactory results based on CF filtration of an OiWM. Coefficients such as concentration at the membrane wall are difficult to identify and both a view cell and camera were used to visually identify model parameters [58]. Because of the instrumentation required for the identification process, it is neither practical nor cheap to implement on large-scale systems, especially as the variation between oil fields would require reidentification.
3.2. Fouling Detection
For identifying the critical flux, fouling detection is a necessity, a commonly used method for fouling detection is based on TMP and flux measurement to estimate the internal resistance of the membrane. The estimated changing rate of the internal resistance is then used for fouling detection. Under constant flux operation the fouling detection criteria, can be simplified to threshold detection of , as shown in Equation (4) [53].
Two alternative methods for fouling detection are proposed in [52,56]. The first alternative is to use concentration-based measurement in a closed loop system, and as the concentration is reduced, fouling is concluded to have settled. The second alternative is to use non-invasive microscopic-based observation method (DOTM), where each particle could be observed while settling on the membrane. Both methods require an additional and expensive instrument to be installed, and the concentration method requires a closed loop system, both factors are problematic for an industrial PWT plant.
3.3. Critical Flux Discussion
Even though fouling can occur below the critical flux, critical flux still provides a method to judge membrane performances across different operating conditions. However, the critical flux identification and the fouling detection procedure must be standardized to ensure comparability between studies. Of the three methods for fouling detection the (DOTM) and concentration-based methods result in far lower values, than the TMP-gradient-based method, conceivable because particles are depositing in blind membrane pores where permeability is not affected, as a result, the TMP-gradient-based describes the membrane’s performance more accurately.
4. Fouling Prevention and Removal
Multiple methods for reducing fouling have been investigated. The methods can be branched into categories: Prefilters, surface shearing, chemical agents, operational conditions, and control thereof. This review will be limited to: Prefilters, surface shearing, and operational conditions and how the operating conditions of those methods affect both membrane and fouling prevention performance. Fouling removal techniques are extensively deployed to remove any reversible fouling, examples hereof are: Chemical cleaning, backwashing, and ultrasonic cleaning [70,71,72,73], whereas this review addresses backwashing and ultrasonic cleaning.
4.1. Pretreatment
Less expensive prefilters are often installed as pretreatment and protection for the relatively costly membranes [74]. Prefilters have a larger pore size which remove particles in the feed, undesirable to the membranes. Like membranes, prefilters suffers from fouling, and cleaning actions must be taken to maintain filter porosity [75], and thus less care is taken with respect to cleaning as they can be replaced for a low cost [76]. For produced water, the gravity-based separators and hydrocyclones are often deployed as pretreatment, as they are more efficient than prefilters for oil removal. Typically the OiW concentration is reduced by the gravity-based separator to 2000–5000 mg/L [77], and the hydrocyclones are capable of reducing the concentration further to 20 mg/L [78]. The hydrocyclones have several advantages compared to prefilters, as they inexpensive, requires less maintains, and are more compact. However, they are very sensitive to changes in flow rate, and control must be carefully designed [79].
4.2. Surface Shearing
Surface shearing is extensively used to prevent fouling accumulation. The methods deployed to generate shearing on the surface are: CF [49,80,81], vibrating/rotating filters [23,82,83,84], and membrane channel modifications [85,86]. The review covers only the surface shearing introduced by the often deployed CF technique.
CF filtration adds shearing to the membrane surface and reduces the probability of particles accumulating as fouling. CF UF of an OiWM, compared to dead-end filtration, can in some cases increase flux by over 100% depending on CFV [80]. However CFV can negatively affect the permeate quality for MF of an OiWM. In [49,87] it was observed that CFV decreases total organic content (TOC) removal efficiency, in the range of 0.75 m/s to 4 m/s. This observation is described with the model developed for an OIWM in [41], where higher CFV (shear rates) would cause droplet break-up and reduced removal efficiency. Furthermore, the model predicted that an optimal shear rate exists, where above and below removal efficiencies are reduced, an effect which has not been experimentally observed.
Different conclusions are drawn with respect to the effect of CFV on steady state flux. Some studies show increased CFV reduces the permeate flow, subject to constant TMP control [81,88,89], while in other studies (on OiWM) the opposite response is observed [18,49,90]. In [89] particle in the range of 2.7 m to 27.5 m where tested with different CFV. It is observed that CFV does cause higher specific cake resistance and less cake thickness, and it is the ratio between those two that can cause CFV to reduce the overall flux [81]. As for the cases with an OiWM, the tendency is consistent across the literature, that increased CFV results in higher permeate flow rates [49,90].
In [88] a filtration system was constructed, where the cross-section of the membrane could be monitored while under operation. It was observed that constant TMP and low CFV would cause particles to settle in a less packed pattern, compared to high CFV where a more structured packing was observed. Even though the thickness of the cake was reduced by a factor of 2.5, the resulting permeate flux was reduced by a factor of 2, hence CFV affects the cake porosity. The relationship between CFV and porosity can explain results where CFV reduces permeate flux, as in [89]. For an OiWM the effect is not observed, because the packing behavior of oil differs significantly from solids.
4.3. Operating Conditions
Operating conditions, such as CFV, temperature, TMP, and flux can be adjusted to reduce fouling and thereby effectively prevent fouling, this has been extensively studied in [91], where an OIWM was treated. Optimizing these operating conditions to reduce both fouling and running cost of membrane filtration systems subject to fulfill the filtration requirement, has been extensively investigated. Firstly, operating conditions for an OiWM filtration system was optimized by deploying the full factorial design methodology, where the different operating conditions was analyzed with respect to permeate flux, fouling resistance, and TOC rejection [92]. Secondly, optimal operating conditions for MF and UF systems treating an OiWM where found in [93]. The Taguchi method was deployed to find the optimal conditions among temperature, TMP, CFV, and back pulse time. However, only three different levels for each parameter was investigated, whereas the optimal point was found to be the highest level in temperature, TMP, and CFV, indicating that the considered levels poorly selected and higher flux could be achieved by extending the considered range. Other studies have shown that significant savings are also achieved by setpoint optimation in [94,95,96,97].
Commonly, a membrane filtration system is operated in one of two modes; (i) constant TMP, or (ii) constant permeate flux. Constant flux is often necessary to meet demands from the up- or down-stream processes [20]. Unfortunately, there are different claims to which mode is preferred and favorable with respect to fouling minimization [32,98]. Results in [98] showed that constant flux operation developed less fouling during filtration of a fixed permeate volume. On the contrary, for surface water treatment it was observed that in certain temperature ranges constant TMP operation resulted in less fouling [32]. Which control method is best suit for an OIWM have not been considered in the literature, but two factors must be accounted for; fouling and process requirements. For PWT the feed flow can be very irregular which must be accounted for by the controller, as such, either constant flow nor pressure are suitable, and it can be necessary to allow large oscillations to be directed to the reject.
The preferred controlled variable for membrane filtration is widely discussed in [32,98,99,100], while transient behavior and control structure of the system are often not addressed. Given the critical flux hypothesis, it is crucial to ensure the system is kept at the defined operating point even though process disturbances are present, which are likely for PWT [101]. Greater emphasis on the control structure and the design, in order to address transient system behavior and reference tracking, could improve membrane filtration effectiveness and efficiency. In [102] it is claimed that the MPC technique can improve the transient response, but the direct effect on fouling compared to the traditional deployed PID controller is not presented. The critical flux concept indicates that increasing permeate flow rate can cause increased resistance that is not reduced together with permeate flow rate, a fact that is not considered together with process disturbances and transient system behavior. Documenting how fouling is affected by process disturbances in permeate flow rate would highlight if filtration improvement could be made by deploying disturbance rejection control.
4.4. Backwashing
A common approach to fouling removal is backwashing; a process where the permeate flow direction is reversed. The reverse flow cause most of the fouling to be released back into the CF channel [49,73,103]. From the CF channel, the released fouling is commonly directed to a discharge, where it can be either stored or directed to a previous separation step for reprocessing [104].
For backwashing, the duration, frequency, pressure, temperature, and backwash media can be adjusted to achieve improved recovery. Throughout literature, different backwashing conditions have been tested, Table 2 summarises the conditions applied. The table shows that even in the field of OiWM filtration, there is a significant difference between chosen duration and frequency. The variance indicates that either the optimal configuration is not found in each case, or more likely, the optimal configuration is case specific.
The choice of backwash frequency (time between backwash), duration (the time backwashing is applied), and pressure/flow is not explained in [18,49,108], and potentially higher permeate production could be achieved by finding the optimal interval and duration. This is confirmed in [109] which recently studied backwash optimization with respect to permeate production, where the interval, duration, and pressure is chosen based on experiment data, where 10 coefficients are identified based on 24 experiments at a duration of 6 h. The method requires time-consuming experiments at less then optimal operation, especially if the process is to be repeated as significant process change occurs. To extend this method to PW, the parameters should not be found based on a single set of experiments, but rather an online adaptive method where the system behavior is continuously monitored and backwash parameters are adjusted to compensate for the changes that occur in the PW properties and as irreversible fouling occurs.
An experimental study on an OiWM claims that up to around 95% of the original flux can be recovered and the average flux can be increased by 100% when deploying backwash [49]. The continuous recovery of 95% of the original flux indicates that no further irreversible fouling occurs which is unlikely and in direct conflict with the results in [18,107] where irreversible fouling continuously occurs. The definition of original flux used in [49] is likely to be interpreted as the flux recovered from previous backwash iteration, and this definition of original flux should be avoided, as it can be confused with the initial clean membrane flux.
A limitation of backwashing is that while the TMP is reversed no permeate is produced. If a typical backwash sequence, with 20 min backwash and 4 h normal operation is considered, the total downtime from backwashing is 7.7%. The significant downtime from applying backwashing gives considerable room for optimizing the backwash sequence. Additionally, the backwashing media commonly used is permeate produced from the membrane system itself, and therefore the overall average flux must be considered, as suggested in [110]. The overall average flux can be calculated as shown in Equation (5).
For an OiWM, it was observed that for short-term operation backwashing provided a higher ratio between flux recovery and required downtime, compared to chemical cleaning [111]. Nonetheless, backwashing is only suited for short-term flux recovery, and chemical cleaning is necessary for long-term operation [49]. The chemical cleaning process requires considerable downtime and chemical agents [72,74,112]. Thus, alternative techniques where no or less downtime is required would be advantageous.
4.5. Ultrasonic
Ultrasonic cavitation can be used for both removal and prevention, ultrasonic cleaning is a technique where electrical energy is utilized to create ultrasonic cavitation. The method is attractive, as it can be used while the membranes are in operation and thus requiring no downtime [70,71]. Multiple parameters, such as frequency and intensity, can be adjusted to obtain the optimal energy efficiency.
Multiple frequencies and intensity have been investigated, and the studies are summarized in Table 3. The observation from these studies is that lower frequency and higher intensity result in the highest permeate flux. It is theorized that lower frequencies provide better efficiency as larger air droplets are created [113], which correlates well with the studies in Table 3. Based on results in [114], the effectiveness (flux gained per W/cm spent) does decrease with intensity, which implies that a balanced point does exist. However, the results are somewhat questionable, as the presented figures in [114] indicate an operational flux that is significantly higher than the clean water flux. This is probably caused by incorrect unit conversion, as the general tendency seems reasonable.
For an OiWM, ultrasonic cleaning is rarely deployed, in [115] a single frequency of 38 kHz at an unknown intensity was applied. The ultrasonic cavitation reduced the permeate flow resistance by 19%. and the study concluded that the reduction in flow resistance would naturally lead to a reduced energy usage. However, the energy usage of the ultrasonic transducers is not addressed and compared to applying higher TMP or CFV. Without any comparison, it is difficult to postulate that applying ultrasonic cleaning is more efficient.
Comparing ultrasonic results in the literature can be problematic, as the methods for determining the intensity are rarely debated nor explained. In [116] two methods are independently used: Intensity estimation based on changes in temperature of the liquid and measured with a pulse receiver. The two methods measure different intensities, the temperature-based method estimates the power dissipated as heat whereas the pulse receiver measures the ultrasonic power reaching the receiver. Either way, deploying different methods for measuring ultrasonic power results in incomparability across the literature.
4.6. Fouling Prevention and Removal Discussion
For backwashing, ultrasonic, and membrane operating conditions, there are several parameters that can be adjusted to improve the effectiveness. From a control perspective, these parameters should be carefully adjusted to either increase flux or the overall energy efficiency, depending on the requirements. Some studies have already investigated flux recovery and net permeate production optimization of the cleaning methods [18,95,109]. However, none have addressed the specific problem for PW, where feed properties and irreversible fouling state change with time. One way to account for this is to let the scheduling algorithm estimate system behavior online and adapt backwash intensity, duration, and forward filtration time to maintain the desired optimal, whether it is a balance between energy efficiency and permeate production or just permeate production.
In general, ultrasonic cleaning is an effective cleaning solution, without any necessity for downtime nor chemicals. However, significantly more energy is demanded by ultrasonic cleaning, compared to backwashing. Below are two comparable examples of energy consumption by usage of either ultrasonic cleaning or backwashing, respectively:
- Ultrasonic cleaning: With an intensity of 1 W/cm to a filtration area of 1 m nets 10 kW of power usage.
Even though many studies investigate ultrasonic cleaning for fouling removal and find the method to be effective, the huge power requirement is rarely addressed [116,119]. It is not uncommon to conclude ultrasonic to be more effective then backwashing, purely based on an observed increase in flux, but clearly, an increase in flux does not necessarily lead to higher energy efficiency [115]. The unaddressed efficiency of ultrasonic cleaning, compared to backwashing, complicates the selection of the energy efficiency method. Additional studies to address energy efficiency of the two methods would benefit the field.
The ultrasonic cleaning method scales unfavorably with installation size compared to backwashing, as the ultrasonic transmitters must be placed with each membrane unit, whereas backwashing pressure can be supplied from a single unit. Especially, as the system scales to meet the huge amount of PW, where membrane area is measured in thousands of square meters, the required amount of installed ultrasonic transmitters is enormous.
5. Fouling Models
The models covered in this section are investigated for two purposes. Firstly, the models can be used for optimizing the fouling removal and prevention methods, such as backwash scheduling. Secondly, to enhance process understanding and interaction between different membrane filtration phenomena.
For typical linear time-invariant model-based control development, a sufficient model must fulfill a set of requirements; the model must be linear or be linearisable and ODE-based and have identifiable parameters. For advanced control design and optimization methods, such as MPC, the model is required to have relatively low computational load to facilitate online optimization calculation [120,121]. To ensure low computational load the chosen model must capture the essential dynamics and ignore insignificant details.
5.1. Blocking Laws
Early fouling models are developed in [122] and later extended in [123]. The models are based on constant TMP dead-end filtration and are divided into four types of blockage (illustrated in Figure 6) namely;
Complete assumes that every particle that reaches the membrane surface will cause sealing of a new pore.
Intermediate considers that every particle that reaches the membrane surface will be included in the fouling. This model includes the probability for the particles to settle on an already sealed pore.
Standard is derived based on the assumption that decreased pore volume is proportional to the permeate volume.
Cake assumes that not all fouling will occur inside the membrane, but rather on the surface of the membrane where a cake layer will accumulate.
The blockage laws developed in [123] is summarized in Table 4, and can be simplified to into Equation (6).
where n is the type of fouling (n = 0 cake filtration, n = 1 intermediate blockage, n = standard blockage, n = 2, for complete blockage). While it is unconventional to have the volume derivative of time, is an expression of the resistance. The equation can be rewritten into resistance and time-based derivative. In general the flow resistance through the membrane can be defined as Equation (7) [123].
The second order derivative can be written as:
Assuming constant TMP filtration, as assumed in the blocking law, and multiplying with on both sides results in Equation (9). Please note that given those assumptions the development of resistance over time, can be expressed exclusively with or j.
The models described in Table 4 do provide a common framework that is extensively deployed within membrane filtration [33,55,124,125,126,127,128,129]. The models were originally intended for dead-end filtration and did not consider flux recovery methods. Studies have been carried out to investigate the feasibility of applying the models to CF filtration, which is especially important for PW filtration systems as dead-end filtration is rarely deployed [87,130,131]. A limitation of Hermia’s models is the assumption; that some process parameters remain constant throughout filtration operation, such as bulk concentration, TMP, and temperature. While it is possible to maintain certain parameters constant by deploying feedback control, the bulk concentration is for any offshore oil and water separation process uncontrollable. One approach for applying Hermia’s models for CF filtration is to estimate the fouling coefficients for a specific operating condition. The resulting coefficients are only valid for a single CFV and model accuracy is significantly reduced if the system is operated away from the defined operating point [126].
Hermia’s blocking laws have been widely deployed to model fouling behavior of an OiWM [37,38,132,133,134]. Reasonable model accuracy was achieved on by identifying model coefficients for each operating point and then using those coefficients for model prediction, indicating that the model structure can accurately describe the fouling behavior of an OiWM at a given operating point [132,133]. The cake blockage model provided the best fit to data, indicating that cake build-up is the main contributor to fouling when treating an OiWM [133]. In both [132,133] a relatively high TMP (above critical pressure) was applied without any significant reduction in model accuracy, hence droplets deformation require no model modification.
5.1.1. Critical Flux Extension
A critical flux-based model extension was proposed in [127]. The suggested extension introduces the shear rate created by CFV into Hermia’s models. The modification, with respect to complete blocking, is written in Equation (10) [127].
Applying the shear rate to Hermia’s blockage laws, results in Table 5.
The standard blockage law is unmodified as it occurs inside the membrane pores and is therefore assumed to be unaffected by CFV [127]. The proposed critical flux extension is validated in [127] using dextran T-70 as the solute and a reasonable prediction accuracy was achieved. A disagreement between the models proposed in [127,129] exists. The standard blockage model does not include critical flux since CF does not affect the fouling occurring in the pores [127], while it is included in [129].
Critical flux was introduced to adapt the blocking laws model from dead-end filtration to CF filtration, and as the standard blockage occurs inside the pores, this type of blockage is out of reach of CF, and CF should have no effect. However, the validity of this assumption is unconfirmed, and the CF introduced turbulence can affect the standard blockage to some degree.
The identification of critical flux is often based on flux stepping, a method that allows the critical flux to be approximated by visually inspecting the data [56,65,66], the method is good if the objective is to determine the critical flux for membrane performance evaluation, but for model parameter identification other methods should be investigated. Given the model structure and operating the system above the critical flux, system identification techniques can be deployed to identify both the fouling rate and the critical flux. If online identification is not used the critical flux must be identified across a range of operating conditions, and such experiments would be a time-consuming process.
5.1.2. Concentration Extension
The concentration of the feed does affect the fouling of the membrane [135], therefore the commonly used Hermia’s models have been modified to incorporate the effect of the concentration directly [129]. This extension assumes that the probability of particles accumulating in or on the membrane is linearly proportional to the concentration. Experimental results obtained in [135] provided validation of the model structure, even across multiple concentration levels model accuracy remained good, but as polystyrene microspheres where used, it does not validate that the model assumptions are valid for a coalescing mixture, where size distribution and concentration is correlated.
The models proposed in [129] share a similar model structure to the models in [135], but is extended with the critical flux concept. The models for complete, standard, and cake blockage can be simplified as shown in Table 6.
The assumption that fouling is linearly proportional to the concentration still needs to be validated for an OiWM before any conclusion can be made with respect to the model accuracy. Even though models have been explicitly developed to describe fouling for CF filtration, and to incorporate concentration into the models, recent studies for PWT continuously insist to use the original models developed for dead-end filtration [37,136]. If the extended models could be validated for PW, it would improve the accuracy of the models across different concentration levels, and thereby reduce the need to re-estimate the model for different concentration levels.
5.2. Resistance-Based Models
Another model approach for UF and MF is presented in [39], where the fouling is considered to be resistances in the series. The permeate flux is described with Darcy’s law:
The total membrane resistance is described as:
where is the flow resistance through the membrane, defined as the clean membrane resistance combined with the resistances caused by pore blockage, as in Equation (13).
The cake layer resistance is described in terms of specific resistance and cake hight:
where the specific resistance and cake height is expressed as Equations (15) and (16):
where the term is the transport of cake materials to the membrane wall, which is directly affected by the permeate flux. Theoretically, this effect should increase with concentration and decrease with larger particle size and CFV. The term is describing the back-transport (removal of cake materials) and should increase with CFV. The resistance of the membrane, partly blocked by pore blockage, can be expressed as in Equation (17).
The model is detailed and the relationship of the investigated parts are nicely described, but the models leave a few areas unexplained. Firstly, the development of the cake height is described to a degree where the exact correlation between CF, concentration, and cake development is unknown. Secondly, a complete description of how the pore blockage resistance develops over time is lacking, more precisely how and develops. Lastly, the model structure is not validated against experimental data, although an extended version is validated in [40].
From a control perspective, the model complexity is significantly increased compared to the blocking models described in Table 4, Table 5 and Table 6. The increased complexity is described in terms of 8 parameters that must be identified before the model can be used for control design purposes. The relatively high number of parameters that must be identified is a disadvantage, especially if the parameters are to be identified online.
5.2.1. Wiesner-Model Extension
An extension to the model, described in [39] (Equations (11)–(17)), is developed in [40]. The extension addresses some of the unexplained areas, such as cake transport and pore blockage resistance. The cake transport equations are modified to describe fouling in membrane bioreactors. The effective radius of the membrane pores is formulated as:
The fraction of open pore area is described similarly:
The concentration at the membrane wall is less than the bulk concentration, as the passage through the cake layer causes some particles to settle in the cake layer itself:
The model for cake height is modified to a degree where concentration and air scouring is included with:
The model described in this section is validated and describes the fouling behavior of the membrane bioreactor with air scouring accurately. To apply the model for CF filtration, the back-transport term of Equation (21) must be modified to incorporate CFV instead of air scouring.
The suggested non-linear model structure requires nine parameters to be identified, which can be challenging. The advantage is that the identified parameters should remain constant even if the operating conditions, whereas the parameters of Hermia’s models change with operating conditions. However, that is only if the model structure is able to completely capture the fouling behavior, in the likely case where the model structure cannot capture the fouling behavior across different conditions, the model parameters would require re-estimation.
5.2.2. Exponential Extension
The model proposed and developed in [39] and extended in [40] is further extended in [137]. An exponential term is added to the expressions for and to better explain behavior observed in the study. The extended equations are shown in Equations (22) and (23).
There is a slight difference between the model of the cake described in [39,40,137]. In [39] the cake layer density is mentioned as a possible extension to the model. In [40] the cake layer density is accounted for, as described in Equation (21). Lastly, in [137] the cake layer density is used in both the cake layer growth rate (Equation (24)) and to describe the cake resistance (Equation (22)). The cake layer density in Equation (22) is added to account for the compressibility of the cake, but how the density changes as a function of e.g., TMP and CF is not described, as such it is likely assumed constant in the validation experiments.
The dynamic exponential extensions (Equations (22) and (23)) are significantly slower than the valve, pump, and remaining fouling dynamics, and only improve the model accuracy when operating over several days [137]. Although the exponential extensions add dominating features, the short-term accuracy gain is insignificant, and the long-term accuracy gain can be addressed as process disturbances. Compared to the model suggested in [40], the exponential extended model also modifies the cake layer transport. The claimed improved accuracy is based on a comparison of the model with and without the exponential extension and naturally the additional degree of freedom improves model accuracy. The cake layer modification seems illogical, as both terms is dependent on both flux and concentration, compared to Equations (21) and (16) where only a single terms is dependent on the flux. As few details and no references are provided in the work, questions rise as to the logic behind it.
5.2.3. Length and Backwash Dependency
The model proposed in [138] is an extension of the work in [139]. The model deploys the methodology of resistances in series to described the fouling and is explicitly developed for process control. The resistances that are included are; membrane resistance (), complete blocking resistance (), cake layer resistance (), and biofilm resistance (). The resistance caused by concentration polarization and scaling are concluded to be negligible after some initial study.
The resistance is considered over the entire length (z) of the membrane. The variation in resistance over the length of the membrane is mainly caused by uneven permeate flow throughout the length of the membrane. The total resistance for the proposed model is defined as:
To model the fouling, the feed concentration is divided into two parts: Firstly, the part that is small enough to enter the membrane pores (). Secondly, the remaining part that mainly consist of larger sizes, which often tend to settle as cake (). The divided concentration is defined as:
The change in the combined porosity of both the membrane and pore blockage is described as:
The relationship between resistance and porosity is described using the Kozeny-Carman equation, similar to how cake resistance is calculated in [39].
The cake resistance is found almost identical to Equations (14) and (21) using the Kozeny-Carman equation, except that the cake growth rate is modified to:
Removal of fouling inside the membrane pores during backwashing is described with Equation (30).
While is negative the fouling is reversed, and the fouling removal persists while the porosity is below , where is defined as Equation (31).
The increased porosity caused by backwashing will only effect the complete blocking resistance. A second expression is introduced in [139], to model the removal of cake thickness caused by backwashing:
where is the observed backwashing time constant at flux, is the backwashing time constant at the current applied flux. This assumed that the fouling removal time constant scales linear with the applied backwashing flux. The model shares similarities with the previously described resistance-based models (Equations (11)–(24)) and considerably extends the models in multiple areas such as concentration polarization, non-linear TMP gradient, and backwashing.
The model emphasizes that several resistances are described as a function of the axial length coordinate. No experimental results are presented to validate the axial length and backwashing extensions developed by [138], as such, the significance of the extension is indecisive. The axial length extensions may provide insight into the fouling behavior, but for control purpose the extensions is of little use.
The general model structure without the axial length extension, and where backwashing only affects the cake layer was originally developed in [139], where it was validated. This validation shows good accuracy at the flux where the coefficient was identified. Shifting the operating flux affects model accuracy to a relatively low degree, indicating that the model structure is unable to fully capture the fouling behavior within a large operating range. The models described with the resistance in series methodology do in some cases consider submerged membrane filtration, which deploys alternatives to CF such as air scouring. None of the resistance-based covered in this work have been validated for an OiWM, but the resistance-based model methodology has been used to model oil fouling with good success [140].
5.3. Model Discussion
All the models investigated in this work are summarized in Table 7. The complexities of the different models are quite diverse, from simple models [123,127,129] to more advanced models [137,138]. All the models described throughout this study have the potential for supporting control design. Model complexity is often considered an advantage in terms of accuracy, but high complexity can cause problems when trying to identify the model parameters. Some models, such as the model proposed in [138], have a high complexity and a large set of parameters that must be identified before the model can be deployed for control design. The complexity combined with the number of parameters will complicate the parameter identification process and may not benefit the control design.
A challenge with applying fouling models for filtration of PW is that the system is rarly in steady state, as such perssure, flow rates and feed properties changes the fouling behavior and model parameters. In [30] it was suggested to enhance understanding of the fouling and fouling models, and thereby avoid the need for a pilot plant for experimental pre-investigation, but achieving such a deep understanding of the filtration processes across different application is not an easy task. Furthermore, for PWT it would require not only a fouling model but a reservoir model to predict how the reservoir changes affect the fouling.
An alternative to increased model complexity, and a probably more feasible approach, is to apply online automatic estimation to adapt to the varying conditions. Estimating the model online would provide a model that is continuously updated as conditions, such as feed properties, change. Additional benefits of online identification are that model parameters, such as fouling rate parameter can be observed, while changing system conditions, and that the functional range of the model is extended. However, online model identification can be difficult, especially if the model has a high degree of complexity.
6. Conclusions
This study has investigated membrane filtration of an OiWM from an oil and gas process control point of view. The effectiveness of membrane filtration is greatly reduced by fouling, and thus fouling remains a major complication for deploying membrane filtration in PWT [49,108,141]. This is especially true of offshore installations, where the problem is intensified by the immense cost of expanding current platforms to incorporate membrane filtration.
Studies on membrane filtration performance for OIW removal, shows that fouling is sensitive to steady state operating conditions [49,51], but how the transient performance in operating conditions affect the fouling rate of the membrane is unclear at this moment. Most industrial filtration systems are operated in steady state, but for PWT the feed flow, pressure, and feed properties, to some degree are governed by the specific well and vary with respect to time. Since steady state operation is rare with respect to PWT it is necessary to consider how dynamic variations affect the fouling rate, a topic which has not received much attention in the literature. If the dynamic variations significantly affect the fouling rate, advanced control could improve the robustness to disturbance, ensuring the operational conditions remains constant and thereby maintains a relatively low fouling degree. Such advanced control solutions, which address the transient performance, would require pump, valve, and possibly hydrodynamics to be considered in the model. Improving the currently deployed process control and thereby increase the capacity and reduce cost, would increase the attractiveness of membrane filtration for PWT.
The described features, advantages, and limitations of the fouling models are summarized in Table 7. In general, several models that describe fouling behavior are inspired by Hermia, and the models have extensively and successfully been used to model membrane fouling of an OiWM [37,132,133,134]. The resistance-based membrane fouling models described in this paper are not explicitly developed or validated for an OiWM and further studies are required to confirm that the model structure is suited for PW. It is observed that the resistance-based membrane fouling model methodology can capture the fouling behavior of an OiWM [140]. The variety of models and deviations between cases of filtration demands a unified model structure, that can automatically adapt to each individual filtration case.
Online identification of model coefficients, can be a natural progression to adapt control and scheduling of backwash to system changes. Hermia’s models or modifications thereof (Table 4, Table 5 and Table 6) are suitable candidates, as the models have been proven to be sufficiently accurate for an OiWM. Furthermore, the limited consideration for changes in the operating conditions could be compensated for with online identification.
Financial incentives for deploying membrane filtration for PWT are negligible as improved separation has no financial impact if regulations are complied with. It is predicted that the successful implementation of membrane technology into the offshore PWT processes are dependent on future regulations, as the existing technologies in the vast majority of cases sufficiently comply with current regulations. As future regulations and industrial tendencies for the North Sea move towards a zero discharge policy, that could lead to the possibility of the membrane filtration technology to become an integral part of PWT [142].
Author Contributions
K.L.J. carried out the literature study, model comparison, and wrote the paper. M.V.B. assisted with the investigation of the fluid dynamics. M.V.B., S.P., and Z.Y. provided a forum for technical and valuable discussions. M.V.B., S.P., and Z.Y. reviewed and correct some parts of the paper.
Funding
This research was funded by Danish Hydrocarbon Research and Technology Centre (DHRTC) and AAU joint project—Smart Water Management Systems (AAU Pr-no:870051).
Acknowledgments
The authors thanks the support from the DTU-DHRTC and AAU joint project—Smart Water Management Systems (AAU Pr-no: 870051). Thanks go to DTU colleagues: E. Bek-Pedersen, T. M. Jørgensen and M. Lind. Thanks go to AAU colleagues: P. Durdevic, L. Hansen, D. Hansen, S. Jepsersen for many valuable discussions and technical support.
Conflicts of Interest
The authors declare no conflict of interest.
Nomenclature
| Fouling rate | |
| Open pore reduction rate | |
| Interface contact angle | |
| Transmembrane pressure | |
| Porosity | |
| Highest recoverable porosity thought backwashing | |
| Fraction of stuck and leaving particles | |
| Interfacial tension | |
| Specific resistance | |
| Shear rate | |
| Dynamic viscosity of the permeate flow | |
| Density | |
| Density of the removed fouling | |
| Backwashing time constant, given flux | |
| Backwashing time constant, given flux | |
| A | Total membrane area |
| C | Bluk concentration |
| c | Oil-water interface mean curvature |
| Bulk concentration retained by the cake layer | |
| Concentration below the cake layer | |
| d | Particle and droplet diameter |
| F | Pressure gradient threshold |
| Fraction of open pore area | |
| G | Ratio of particles that permeate the cake |
| Cake layer height | |
| Effective membrane pore length | |
| Flux at which is found | |
| k | Generalized fouling coefficient |
| Cake transport coefficient | |
| Back transport coefficient | |
| Cake layer filtration coefficient | |
| Cake removal rate | |
| Air scouring exponent coefficient | |
| Air scouring coefficient | |
| Membrane specific constant | |
| Backwashing constant | |
| L | Membrane length |
| N | Exponential coefficient |
| n | Type of fouling, |
| P | Pressure |
| Q | Flow rate |
| R | Resistance |
| Effective pore radius | |
| Resistance from biofilm | |
| t | Time |
| V | Total processed volume of water |
| Air scouring velocity | |
| z | Longitude position on the membrane |
| Subscripts | |
| 0 | Initial |
| Average | |
| b | Complete blockage |
| c | Cake blockage |
| d | Downstream |
| f | Forward filtration operation |
| i | Intermediate blockage |
| Irreversible | |
| m | Membrane |
| Clean membrane | |
| r | Backward filtration operation |
| s | Standard blockage |
| t | Total |
| u | Upstream |
| Membrane given complete blockage | |
| Membrane given pore blockage | |
| Superscripts | |
| * | Critical |
References
- Danish Energy Agency. Available online: http://www.webcitation.org/70Qv4kLDk (accessed on 22 June 2018).
- Tellez, G.T.; Nirmalakhandan, N.; Gardea-Torresdey, J.L. Evaluation of biokinetic coefficients in degradation of oilfield produced water under varying salt concentrations. Water Res. 1995, 29, 1711–1718. [Google Scholar] [CrossRef]
- Danish Environmental Protection Agency. Available online: http://www.webcitation.org/70QvEretB (accessed on 22 June 2018).
- Danish Environmental Protection Agency. Available online: http://www.webcitation.org/70QvOYGju (accessed on 22 June 2018).
- Coca-Prados, J.; Gutiérrez-Cervelló, G. Water Purification and Management; Springer: Dordrecht, The Netherlands, 2010; ISBN 978-90-481-9775-0. [Google Scholar]
- Judd, S.; Qiblawey, H.; Al-marri, M.; Clarkin, C.; Watson, S.; Ahmed, A.; Bach, S. The size and performance of offshore produced water oil-removal technologies for reinjection. Sep. Purif. Technol. 2014, 134, 241–246. [Google Scholar] [CrossRef]
- Amini, S.; Mowla, D.; Golkar, M.; Esmaeilzadeh, F. Mathematical modelling of a hydrocyclone for the down-hole oil-water separation (DOWS). Chem. Eng. Res. Des. 2012, 90, 2186–2195. [Google Scholar] [CrossRef]
- Wolbert, D.; Ma, B.F.; Aurelle, Y.; Seureau, J. Efficiency estimation of liquid-liquid Hydrocyclones using trajectory analysis. AIChE J. 1995, 41, 1395–1402. [Google Scholar] [CrossRef]
- Cengel, Y.A.; Cimbala, J.M.; Turner, R.H. Fundamentals of Thermal-Fluid Sciences, 3rd ed.; Mcgraw-Hill Education: New York, NY, USA, 2008; ISBN 978-007-126631-4. [Google Scholar]
- Fakhru’l-Razi, A.; Pendashteh, A.; Abdullah, L.C.; Biak, D.R.A.; Madaeni, S.S.; Abidin, Z.Z. Review of technologies for oil and gas produced water treatment. J. Hazard. Mater. 2009, 170, 530–551. [Google Scholar] [CrossRef] [PubMed]
- Sadrzadeh, M.; Hajinasiri, J.; Bhattacharjee, S.; Pernitsky, D. Nanofiltration of oil sands boiler feed water: Effect of pH on water flux and organic and dissolved solid rejection. Sep. Purif. Technol. 2015, 141, 339–353. [Google Scholar] [CrossRef]
- Yi, H.; Zhu-Wu, J. Technology review: Treating oilfield wastewater. Filtr. Sep. 2008, 45, 14–16. [Google Scholar]
- Cheryan, M.; Rajagopalan, N. Membrane processing of oil streams. Wastewater treatment and waste reduction. J. Membr. Sci. 1998, 151, 13–28. [Google Scholar] [CrossRef]
- Santos, S.M.; Weisner, M.R.; Wiesner, M.R. Ultrafiltration of water generated in oil and gas production. Water Environ. Res. 1997, 69, 1120–1127. [Google Scholar] [CrossRef]
- Ashaghi, K.S.; Ebrahimi, M.; Czermak, P. Ceramic ultra-and nanofiltration membranes for oilfield produced water treatment: A mini review. Open Environ. Sci. 2007, 1, 1–8. [Google Scholar] [CrossRef]
- Igunnu, E.T.; Chen, G.Z. Produced water treatment technologies. Int. J. Low-Carbon Technol. 2014, 9, 157–177. [Google Scholar] [CrossRef]
- Chen, A.; Flynn, J.; Cook, R.; Casaday, A. Removal of oil, grease, and suspended solids from produced water with ceramic crossflow microfiltration. Soc. Pet. Eng. 1991, 6, 131–136. [Google Scholar] [CrossRef]
- Srijaroonrat, P.; Julien, E.; Aurelle, Y. Unstable secondary oil/water emulsion treatment using ultrafiltration: Fouling control by backflushing. J. Membr. Sci. 1999, 159, 11–20. [Google Scholar] [CrossRef]
- Shi, X.; Tal, G.; Hankins, N.P.; Gitis, V. Fouling and cleaning of ultrafiltration membranes: A review. J. Water Process Eng. 2014, 1, 121–138. [Google Scholar] [CrossRef]
- Guo, W.; Ngo, H.H.; Li, J. A mini-review on membrane fouling. Bioresour. Technol. 2012, 122, 27–34. [Google Scholar] [CrossRef] [PubMed]
- Ng, A.N.L.; Kim, A.S. A mini-review of modeling studies on membrane bioreactor (MBR) treatment for municipal wastewaters. Desalination 2007, 212, 261–281. [Google Scholar] [CrossRef]
- Kim, J.; DiGiano, F.A. Fouling models for low-pressure membrane systems. Sep. Purif. Technol. 2009, 68, 293–304. [Google Scholar] [CrossRef]
- Jaffrin, M.Y. Dynamic shear-enhanced membrane filtration: A review of rotating disks, rotating membranes and vibrating systems. J. Membr. Sci. 2008, 324, 7–25. [Google Scholar] [CrossRef]
- Baker, R.W. Membrane Technology and Applications, 3rd ed.; John Wiley & Sons, Ltd.: Chichester, UK, 2012; ISBN 978-0-470-74372-0. [Google Scholar]
- Bilstad, T.; Espedal, E. Membrane separation of produced water. Water Sci. Technol. 1996, 34, 239–246. [Google Scholar] [CrossRef]
- Alzahrani, S.; Mohammad, A.W. Challenges and trends in membrane technology implementation for produced water treatment: A review. J. Water Process Eng. 2014, 4, 107–133. [Google Scholar] [CrossRef]
- Padaki, M.; Murali, R.S.; Abdullah, M.S.; Misdan, N.; Moslehyani, A.; Kassim, M.A.; Hilal, N.; Ismail, A.F. Membrane technology enhancement in oil–water separation. A review. Desalination 2015, 357, 197–207. [Google Scholar] [CrossRef]
- Munirasu, S.; Haija, M.A.; Banat, F. Use of membrane technology for oil field and refinery produced water treatment—A review. Process Saf. Environ. Prot. 2016, 100, 183–202. [Google Scholar] [CrossRef]
- Yu, L.; Han, M.; He, F. A review of treating oily wastewater. Arab. J. Chem. 2017, 10, S1913–S1922. [Google Scholar] [CrossRef]
- Dickhout, J.M.; Moreno, J.; Biesheuvel, P.M.; Boels, L.; Lammertink, R.G.; de Vos, W.M. Produced water treatment by membranes: A review from a colloidal perspective. J. Colloid Interface Sci. 2017, 487, 523–534. [Google Scholar] [CrossRef] [PubMed]
- Nazirah Wan Ikhsan, S.; Yusof, N.; Aziz, F.; Misdan, N. Malaysian Journal of Analytical Sciences a Review of Oilfield Wastewater Treatment Using Membrane Filtration over Conventional Technology. Malays. J. Anal. Sci. 2017, 21, 643–658. [Google Scholar] [CrossRef]
- Guo, X.; Zhang, Z.; Fang, L.; Su, L. Study on ultrafiltration for surface water by a polyvinylchloride hollow fiber membrane. Desalination 2009, 238, 183–191. [Google Scholar] [CrossRef]
- Maiti, A.; Sadrezadeh, M.; Guha Thakurta, S.; Pernitsky, D.J.; Bhattacharjee, S. Characterization of boiler blowdown water from steam-assisted gravity drainage and silica-organic coprecipitation during acidification and ultrafiltration. Energy Fuels 2012, 26, 5604–5612. [Google Scholar] [CrossRef]
- Hayatbakhsh, M.; Sadrzadeh, M.; Pernitsky, D.; Bhattacharjee, S.; Hajinasiri, J. Treatment of an in situ oil sands produced water by polymeric membranes. Desalin. Water Treat. 2016, 57, 14869–14887. [Google Scholar] [CrossRef]
- Le, N.L.; Nunes, S.P. Materials and membrane technologies for water and energy sustainability. Sustain. Mater. Technol. 2016, 7, 1–28. [Google Scholar] [CrossRef]
- Coday, B.D.; Xu, P.; Beaudry, E.G.; Herron, J.; Lampi, K.; Hancock, N.T.; Cath, T.Y. The sweet spot of forward osmosis: Treatment of produced water, drilling wastewater, and other complex and difficult liquid streams. Desalination 2014, 333, 23–35. [Google Scholar] [CrossRef]
- Abbasi, M.; Mohammad, R.S.; Salahi, A.; Mirza, B. Modeling of membrane fouling and flux decline in microfiltration of oily wastewater using ceramic membranes. Chem. Eng. Commun. 2012, 199, 78–93. [Google Scholar] [CrossRef]
- Vasanth, D.; Pugazhenthi, G.; Uppaluri, R. Cross-flow microfiltration of oil-in-water emulsions using low cost ceramic membranes. Desalination 2013, 320, 86–95. [Google Scholar] [CrossRef]
- Mallevialle, J.; Odendaal, P.E.; Wiesner, M.R. Wiesner Water Treatment Membrane Processes, 1st ed; McGraw-Hil: New York, NY, USA, 1996; ISBN 0-07-0011559-7. [Google Scholar]
- Giraldo, E.; Systems, N.; Water, L.A.; Giraldo, E. Dynamic Mathematical Modeling of Membrane Fouling in Submerged Membrane Bioreactors. Proc. Water Environ. Fed. 2006, 2006, 4895–4913. [Google Scholar] [CrossRef]
- Darvishzadeh, T.; Priezjev, N.V. Effects of crossflow velocity and transmembrane pressure on microfiltration of oil-in-water emulsions. J. Membr. Sci. 2012, 423–424, 468–476. [Google Scholar] [CrossRef]
- Bavière, M. Basic Concepts in Enhanced Oil Recovery Processes; Elsevier Applied Science: Essex, UK, 1991; Volume 33, ISBN 1-85166-617-6. [Google Scholar]
- Nazzal, F.F.; Wiesner, M.R. Microfiltration of oil-in-water emulsions. Water Environ. Res. 1996, 68, 1187–1191. [Google Scholar] [CrossRef]
- Cumming, I.W.; Holdich, R.G.; Smith, I.D. The rejection of oil by microfiltration of a stabilised kerosene/water emulsion. J. Membr. Sci. 2000, 169, 147–155. [Google Scholar] [CrossRef]
- Guo, J.; Cao, J.; Li, M.; Xia, H. Influences of water treatment agents on oil-water interfacial properties of oilfield produced water. Pet. Sci. 2013, 10, 415–420. [Google Scholar] [CrossRef]
- Darvishzadeh, T.; Tarabara, V.V.; Priezjev, N.V. Oil droplet behavior at a pore entrance in the presence of crossflow: Implications for microfiltration of oil-water dispersions. J. Membr. Sci. 2013, 447, 442–451. [Google Scholar] [CrossRef]
- Monfared, M.A.; Kasiri, N.; Mohammadi, T. Microscopic modeling of critical pressure of permeation in oily waste water treatment via membrane filtration. RSC Adv. 2016, 6, 71744–71756. [Google Scholar] [CrossRef]
- Tummons, E.N.; Tarabara, V.V.; Chew, J.W.; Fane, A.G. Behavior of oil droplets at the membrane surface during crossflow microfiltration of oil-water emulsions. J. Membr. Sci. 2016, 500, 211–224. [Google Scholar] [CrossRef]
- Abadi, S.R.H.; Sebzari, M.R.; Hemati, M.; Rekabdar, F.; Mohammadi, T. Ceramic membrane performance in microfiltration of oily wastewater. Desalination 2011, 265, 222–228. [Google Scholar] [CrossRef]
- Zhong, J.; Sun, X.; Wang, C. Treatment of oily wastewater produced from refinery processes using flocculation and ceramic membrane filtration. Sep. Purif. Technol. 2003, 32, 93–98. [Google Scholar] [CrossRef]
- Hua, F.L.; Tsang, Y.F.; Wang, Y.J.; Chan, S.Y.; Chua, H.; Sin, S.N. Performance study of ceramic microfiltration membrane for oily wastewater treatment. Chem. Eng. J. 2007, 128, 169–175. [Google Scholar] [CrossRef]
- Kwon, D.Y.; Vigneswaran, S.; Fane, A.G.; Aim, R.B. Experimental determination of critical flux in cross-flow microfiltration. Sep. Purif. Technol. 2000, 19, 169–181. [Google Scholar] [CrossRef]
- Van der Marel, P.; Zwijnenburg, A.; Kemperman, A.; Wessling, M.; Temmink, H.; van der Meer, W. An improved flux-step method to determine the critical flux and the critical flux for irreversibility in a membrane bioreactor. J. Membr. Sci. 2009, 332, 24–29. [Google Scholar] [CrossRef]
- Bacchin, P.; Aimar, P.; Field, R.W. Critical and sustainable fluxes: Theory, experiments and applications. J. Membr. Sci. 2006, 281, 42–69. [Google Scholar] [CrossRef] [Green Version]
- Field, R.W.; Wu, D.; Howell, J.A.; Gupta, B.B. Critical flux concept for microfiltration fouling. J. Membr. Sci. 1995, 100, 259–272. [Google Scholar] [CrossRef]
- Wicaksana, F.; Fane, A.G.; Pongpairoj, P.; Field, R. Microfiltration of algae (Chlorella sorokiniana): Critical flux, fouling and transmission. J. Membr. Sci. 2012, 387–388, 83–92. [Google Scholar] [CrossRef]
- Gander, M.; Jefferson, B.; Judd, S. Aerobic MBRs for domestic wastewater treatment: A review with cost considerations. Sep. Purif. Technol. 2000, 18, 119–130. [Google Scholar] [CrossRef]
- Tanudjaja, H.J.; Tarabara, V.V.; Fane, A.G.; Wei, J.; Chew, J.W. Effect of cross-flow velocity , oil concentration and salinity on the critical flux of an oil-in-water emulsion in micro filtration. J. Membr. Sci. 2017, 530, 11–19. [Google Scholar] [CrossRef]
- Yi, X.; Wang, Y.; Jin, L.; Shi, W. Critical flux investigation in treating o/w emulsion by TiO2/Al2O3-PVDF UF membrane. Water Sci. Technol. 2017, 76, 2785–2792. [Google Scholar] [CrossRef] [PubMed]
- Howell, J.A. Sub-critical flux operation of microfiltration. J. Membr. Sci. 1995, 107, 165–171. [Google Scholar] [CrossRef]
- Guglielmi, G.; Chiarani, D.; Judd, S.J.; Andreottola, G. Flux criticality and sustainability in a hollow fibre submerged membrane bioreactor for municipal wastewater treatment. J. Membr. Sci. 2007, 289, 241–248. [Google Scholar] [CrossRef]
- Ognier, S.; Wisniewski, C.; Grasmick, A. Membrane bioreactor fouling in sub-critical filtration conditions: A local critical flux concept. J. Membr. Sci. 2004, 229, 171–177. [Google Scholar] [CrossRef]
- Bacchin, P.; Espinasse, B.; Aimar, P. Distributions of critical flux: Modelling, experimental analysis and consequences for cross-flow membrane filtration. J. Membr. Sci. 2005, 250, 223–234. [Google Scholar] [CrossRef] [Green Version]
- Metsämuuronen, S.; Howell, J.; Nyström, M. Critical flux in ultrafiltration of myoglobin and baker’s yeast. J. Membr. Sci. 2002, 196, 13–25. [Google Scholar] [CrossRef]
- Ye, Y.; Clech, P.L.; Chen, V.; Fane, A.G. Evolution of fouling during crossflow filtration of model EPS solutions. J. Membr. Sci. 2005, 264, 190–199. [Google Scholar] [CrossRef]
- Chan, R.; Chen, V. The effects of electrolyte concentration and pH on protein aggregation and deposition: Critical flux and constant flux membrane filtration. J. Membr. Sci. 2001, 185, 177–192. [Google Scholar] [CrossRef]
- Espinasse, B.; Bacchin, P.; Aimar, P. On an experimental method to measure critical flux in ultrafiltration. Desalination 2002, 146, 91–96. [Google Scholar] [CrossRef]
- Espinasse, B.; Bacchin, P.; Aimar, P. Filtration method characterizing the reversibility of colloidal fouling layers at a membrane surface: Analysis through critical flux and osmotic pressure. J. Colloid Interface Sci. 2008, 320, 483–490. [Google Scholar] [CrossRef] [PubMed] [Green Version]
- Li, H.; Fane, A.G.; Coster, H.G.L.; Vigneswaran, S. An assessment of depolarisation models of crossflow microfiltration by direct observation through the membrane. J. Membr. Sci. 2007, 172, 135–147. [Google Scholar] [CrossRef]
- Sui, P.; Wen, X.; Huang, X. Membrane fouling control by ultrasound in an anaerobic membrane bioreactor. Front. Environ. Sci. Eng. China 2007, 1, 362–367. [Google Scholar] [CrossRef]
- Aliasghari Aghdam, M.; Mirsaeedghazi, H.; Aboonajmi, M.; Kianmehr, M.H. Effect of ultrasound on different mechanisms of fouling during membrane clarification of pomegranate juice. Innov. Food Sci. Emerg. Technol. 2015, 30, 127–131. [Google Scholar] [CrossRef]
- Li, Q.; Elimelech, M. Organic fouling and chemical cleaning of nanofiltration membranes: Measurements and mechanisms. Environ. Sci. Technol. 2004, 38, 4683–4693. [Google Scholar] [CrossRef] [PubMed]
- James, P.; Vigneswaran, S.; Hao, H.; Ben-aim, R.; Nguyen, H. A new approach to backwash initiation in membrane systems. J. Membr. Sci. 2007, 278, 381–389. [Google Scholar] [CrossRef]
- Gao, W.; Liang, H.; Ma, J.; Han, M.; Chen, Z.L.; Han, Z.S.; Li, G.B. Membrane fouling control in ultrafiltration technology for drinking water production: A review. Desalination 2011, 272, 1–8. [Google Scholar] [CrossRef]
- Zhao, Y.J.; Wu, K.F.; Wang, Z.J.; Zhao, L.; Li, S.S. Fouling and Cleaning of Membrane—A Literature Review. J. Environ. Sci. 2000, 12, 241–251. [Google Scholar]
- Gopal, R.; Kaur, S.; Feng, C.Y.; Chan, C.; Ramakrishna, S.; Tabe, S.; Matsuura, T. Electrospun nanofibrous polysulfone membranes as pre-filters: Particulate removal. J. Membr. Sci. 2007, 289, 210–219. [Google Scholar] [CrossRef]
- Kharoua, N.; Khezzar, L.; Nemouchi, Z. Hydrocyclones for de-oiling applications-a review. Pet. Sci. Technol. 2010, 28, 738–755. [Google Scholar] [CrossRef]
- Durdevic, P.; Pedersen, S.; Yang, Z. Evaluation of OiW Measurement Technologies for Deoiling Hydrocyclone Efficiency Estimation and Control. In Proceedings of the OCEANS’16 MTS/IEEE, Shanghai, China, 10–13 April 2016. [Google Scholar]
- Durdevic, P. Real-Time Monitoring and Robust Control of Offshore De-Oiling Processes. Ph.D. Thesis, Aalborg University, Aalborg, Denmark, 2017. [Google Scholar]
- Arnot, T.C.; Field, R.W.; Koltuniewicz, A.B. Cross-flow and dead-end microfiltration of oily-water emulsions. Part II. Mechanisms and modelling of flux decline. J. Membr. Sci. 2000, 169, 1–15. [Google Scholar] [CrossRef]
- Foley, G.; Malone, D.M.; Macloughlin, F. Modelling the effects of particle polydispersity in crossflow filtration. Membr. Sci. 1995, 99, 77–88. [Google Scholar] [CrossRef]
- Beier, S.P.; Guerra, M.; Garde, A.; Jonsson, G. Dynamic microfiltration with a vibrating hollow fiber membrane module: Filtration of yeast suspensions. J. Membr. Sci. 2006, 281, 281–287. [Google Scholar] [CrossRef]
- Belfort, G.; Pimbley, J.M.; Greiner, A.; Chun, K.Y. Diagnosis of membrane Cell culture media fouling using a rotating annular 1. Cell culture media. J. Membr. Sci. 1993, 77, 1–22. [Google Scholar] [CrossRef]
- Zsirai, T.; Qiblawey, H.; A-Marri, M.J.; Judd, S. The impact of mechanical shear on membrane flux and energy demand. J. Membr. Sci. 2016, 516, 56–63. [Google Scholar] [CrossRef]
- Finnigan, S.M.; Howell, J.A. The effect of pulsed flow on ultrafiltration fluxes in a baffled tubular membrane system. Desalination 1990, 79, 181–202. [Google Scholar] [CrossRef]
- Gupta, B.B.; Howell, J.A.; Wu, D.; Field, R.W. A helical baffle for cross-flow microfiltration. J. Membr. Sci. 1995, 102, 31–42. [Google Scholar] [CrossRef]
- Chakrabarty, B.; Ghoshal, A.K.; Purkait, M.K. Cross-flow ultrafiltration of stable oil-in-water emulsion using polysulfone membranes. Chem. Eng. J. 2010, 165, 447–456. [Google Scholar] [CrossRef]
- Mackley, M.R.; Sherman, N.E. Cross-flow cake filtration mechanisms and kinetics. Chem. Eng. Sci. 1992, 47, 3067–3084. [Google Scholar] [CrossRef]
- Wakeman, R.; Tarleton, E. Colloidal Fouling of Microfiltration Membranes during the Treatment of Aqueous Feed Streams. Desalination 1991, 83, 35–52. [Google Scholar] [CrossRef] [Green Version]
- Abbasi, M.; Salahi, A.; Mirfendereski, M.; Mohammadi, T.; Pak, A. Dimensional analysis of permeation flux for microfiltration of oily wastewaters using mullite ceramic membranes. Desalination 2010, 252, 113–119. [Google Scholar] [CrossRef]
- Koĺtuniewicz, A.B.; Field, R.W. Process factors during removal of oil-in-water emulsions with cross-flow microfiltration. Desalination 1996, 105, 79–89. [Google Scholar] [CrossRef]
- Seyed Shahabadi, S.M.; Reyhani, A. Optimization of operating conditions in ultrafiltration process for produced water treatment via the full factorial design methodology. Sep. Purif. Technol. 2014, 132, 50–61. [Google Scholar] [CrossRef]
- Reyhani, A.; Mashhadi Meighani, H. Optimal operating conditions of micro- and ultra-filtration systems for produced-water purification: Taguchi method and economic investigation. Desalin. Water Treat. 2016, 57, 19642–19654. [Google Scholar] [CrossRef]
- James, P.; Vigneswaran, S.; Hao, H.; Ben-aim, R.; Nguyen, H. Design of a generic control system for optimising back flush durations in a submerged membrane hybrid reactor. J. Membr. Sci. 2005, 255, 99–106. [Google Scholar] [CrossRef]
- Busch, J.; Marquardt, W. Run-to-run control of membrane filtration in wastewater treatment—An experimental study. IFAC Proc. Vol. 2007, 40, 195–200. [Google Scholar] [CrossRef]
- Bartman, A.R.; Zhu, A.; Christofides, P.D.; Cohen, Y. Minimizing energy consumption in reverse osmosis membrane desalination using optimization-based control. J. Process Control 2010, 20, 1261–1269. [Google Scholar] [CrossRef]
- Ferrero, G.; Monclús, H.; Buttiglieri, G.; Comas, J.; Rodriguez-Roda, I. Automatic control system for energy optimization in membrane bioreactors. Desalination 2011, 268, 276–280. [Google Scholar] [CrossRef]
- Lee, E.K.; Chen, V.; Fane, A.G. Natural organic matter (NOM) fouling in low pressure membrane filtration—Effect of membranes and operation modes. Desalination 2008, 218, 257–270. [Google Scholar] [CrossRef]
- Miller, D.J.; Kasemset, S.; Paul, D.R.; Freeman, B.D. Comparison of membrane fouling at constant flux and constant transmembrane pressure conditions. J. Membr. Sci. 2014, 454, 505–515. [Google Scholar] [CrossRef]
- Defrance, L.; Jaffrin, M.Y. Comparison between filtrations at fixed transmembrane pressure and fixed permeate flux: Application to a membrane bioreactor used for wastewater treatment. J. Membr. Sci. 1999, 152, 203–210. [Google Scholar] [CrossRef]
- Pedersen, S. Plant-Wide Anti-Slug Control for Offshore Oil and Gas Processes. Doctoral dissertation, Ph. D. Thesis, Aalborg University, Aalborg, Denmark, 2016. [Google Scholar] [CrossRef]
- Abbas, A. Model predictive control of a reverse osmosis desalination unit. Desalination 2006, 194, 268–280. [Google Scholar] [CrossRef]
- Weschenfelder, S.E.; Louvisse, A.M.T.; Borges, C.P.; Meabe, E.; Izquierdo, J.; Campos, J.C. Evaluation of ceramic membranes for oilfield produced water treatment aiming reinjection in offshore units. J. Pet. Sci. Eng. 2015, 131, 51–57. [Google Scholar] [CrossRef]
- Katsoufidou, K.; Yiantsios, S.; Karabelas, A. A study of ultrafiltration membrane fouling by humic acids and flux recovery by backwashing: Experiments and modeling. J. Membr. Sci. 2005, 266, 40–50. [Google Scholar] [CrossRef]
- Hofs, B.; Ogier, J.; Vries, D.; Beerendonk, E.F.; Cornelissen, E.R. Comparison of ceramic and polymeric membrane permeability and fouling using surface water. Sep. Purif. Technol. 2011, 79, 365–374. [Google Scholar] [CrossRef]
- Liang, H.; Gong, W.; Chen, J.; Li, G. Cleaning of fouled ultrafiltration (UF) membrane by algae during reservoir water treatment. Desalination 2008, 220, 267–272. [Google Scholar] [CrossRef]
- Weschenfelder, S.E.; Borges, C.P.; Campos, J.C. Oilfield produced water treatment by ceramic membranes: Bench and pilot scale evaluation. J. Membr. Sci. 2015, 495, 242–251. [Google Scholar] [CrossRef]
- Weschenfelder, S.E.; Louvisse, A.M.T.; Borges, C.P.; Campos, J.C. Preliminary Studies on the Application of Ceramic Membranes for Oilfield Produced Water Management. In Proceedings of the Offshore Technology Conference, OTC Brasil, Rio de Janeiro, Brazil, 29–31 October 2013; pp. 1–10. [Google Scholar]
- Slimane, F.Z.; Ellouze, F.; Ben miled, G.; Ben Amar, N. Physical backwash optimization in membrane filtration processes: Seawater Ultrafiltration case. J. Membr. Process. Res. 2018, 4, 63–68. [Google Scholar] [CrossRef]
- Cakl, J.; Bauer, I.; Dole, P.; Mikul, P. Effects of backflushing conditions on permeate flux in membrane crossflow microfiltration of oil emulsion. Desalination 2000, 127, 189–198. [Google Scholar] [CrossRef]
- Ebrahimi, M.; Willershausen, D.; Ashaghi, K.S.; Engel, L.; Placido, L.; Mund, P.; Bolduan, P.; Czermak, P. Investigations on the use of different ceramic membranes for efficient oil-field produced water treatment. Desalination 2010, 250, 991–996. [Google Scholar] [CrossRef] [Green Version]
- Mi, B.; Elimelech, M. Organic fouling of forward osmosis membranes: Fouling reversibility and cleaning without chemical reagents. J. Membr. Sci. 2010, 348, 337–345. [Google Scholar] [CrossRef]
- Lamminen, M.O.; Walker, H.W.; Weavers, L.K. Mechanisms and factors influencing the ultrasonic cleaning of particle-fouled ceramic membranes. J. Membr. Sci. 2004, 237, 213–223. [Google Scholar] [CrossRef]
- Yutaka, M.; Tan, M.; Shin-ichi, N.; Shoji, K. Improvement of membrane permeation performance by ultrasonic microfiltration. J. Chem. Eng. Jpn. 1996, 29, 561–567. [Google Scholar]
- Thiam Teik Wan, W.L.L. Experimental Study of the Separation of Oil in Water Emulsions by Tangential Flow Microfiltration Process. Part 2: The Use of Ultrasound for In-Situ Controlling of the Membrane Fouling. J. Membr. Sci. Technol. 2014, 5, 1–6. [Google Scholar] [CrossRef]
- Kobayashi, T.T.; Kobayashi, T.T.; Hosaka, Y.; Fujii, N. Ultrasound-enhanced membrane-cleaning processes applied water treatments: Influence of sonic frequency on filtration treatments. Ultrasonics 2003, 41, 185–190. [Google Scholar] [CrossRef]
- Zhu, C.; Liu, G. Modeling of ultrasonic enhancement on membrane distillation. J. Membr. Sci. 2000, 176, 31–41. [Google Scholar] [CrossRef]
- Grundfos. Available online: https://product-selection.grundfos.com/product-detail.product-detail.html?custid=GMA&productnumber=98390030&qcid=393096734 (accessed on 22 June 2018).
- Borea, L.; Naddeo, V.; Shalaby, M.S.; Zarra, T.; Belgiorno, V.; Abdalla, H.; Shaban, A.M. Wastewater treatment by membrane ultrafiltration enhanced with ultrasound: Effect of membrane flux and ultrasonic frequency. Ultrasonics 2018, 83, 42–47. [Google Scholar] [CrossRef] [PubMed]
- Amir, M.; Givargis, T. Hybrid State Machine Model for Fast Model Predictive Control: Application to Path Tracking. In Proceedings of the 2017 IEEE/ACM International Conference on Computer-Aided Design (ICCAD), Irvine, CA, USA, 12–16 November 2017; pp. 185–192. [Google Scholar]
- Seborg, D.E.; Mellichamp, D.A.; Edgar, T.F.; Doyle, F.J., III. Process Dynamics and Control, 3rd ed.; John Wiley & Sons: Hoboken, NJ, USA, 2010; ISBN 978-0-470-12867-1. [Google Scholar]
- Hermans, P.H.; Bredée, H.L. Zur Kenntnis der Filtrationsgesetze. Recueil des Travaux Chimiques des Pays-Bas 1935, 54, 680–700. [Google Scholar] [CrossRef]
- Hermia, J. Constant pressure blocking filtration law: Application to power law non-Newtonian fluids. Trans. Inst. Chem. Eng. 1982, 60, 183–187. [Google Scholar]
- Sampath, M.; Shukla, A.; Rathore, A. Modeling of Filtration Processes—Microfiltration and Depth Filtration for Harvest of a Therapeutic Protein Expressed in Pichia pastoris at Constant Pressure. Bioengineering 2014, 1, 260–277. [Google Scholar] [CrossRef] [PubMed] [Green Version]
- Bowen, W.R.; Calvo, J.I.; Hernández, A. Steps of membrane blocking in flux decline during protein microfiltration. J. Membr. Sci. 1995, 101, 153–165. [Google Scholar] [CrossRef]
- Vincent Vela, M.C.; Álvarez Blanco, S.; Lora García, J.; Bergantiños Rodríguez, E. Analysis of membrane pore blocking models adapted to crossflow ultrafiltration in the ultrafiltration of PEG. Chem. Eng. J. 2009, 149, 232–241. [Google Scholar] [CrossRef]
- De Bruijn, J.; Salazar, F.; Bórquez, R. Membrane Blocking In Ultrafiltration. Food Bioprod. Process. 2005, 83, 211–219. [Google Scholar] [CrossRef]
- Bolton, G.; LaCasse, D.; Kuriyel, R. Combined models of membrane fouling: Development and application to microfiltration and ultrafiltration of biological fluids. J. Membr. Sci. 2006, 277, 75–84. [Google Scholar] [CrossRef]
- Kilduff, J.E.; Mattaraj, S.; Sensibaugh, J.; Pieracci, J.P.; Yuan, Y.; Belfort, G. Modeling flux decline during nanofiltration of NOM with poly(arylsulfone) membranes modified using UV-assisted graft polymerization. Environ. Eng. Sci. 2002, 19, 477–495. [Google Scholar] [CrossRef]
- Ebrahimi, M.; Ashaghi, K.S.; Engel, L.; Willershausen, D.; Mund, P.; Bolduan, P.; Czermak, P. Characterization and application of different ceramic membranes for the oil-field produced water treatment. Desalination 2009, 245, 533–540. [Google Scholar] [CrossRef]
- Silalahi, S.H.D.; Leiknes, T. Cleaning strategies in ceramic microfiltration membranes fouled by oil and particulate matter in produced water. Desalination 2009, 236, 160–169. [Google Scholar] [CrossRef]
- Peng, H.; Tremblay, A.Y. Membrane regeneration and filtration modeling in treating oily wastewaters. J. Membr. Sci. 2008, 324, 59–66. [Google Scholar] [CrossRef]
- Salahi, A.; Abbasi, M.; Mohammadi, T. Permeate flux decline during UF of oily wastewater: Experimental and modeling. Desalination 2010, 251, 153–160. [Google Scholar] [CrossRef]
- Mohammadi, T.; Kazemimoghadam, M.; Saadabadi, M. Modeling of membrane fouling and flux decline in reverse osmosis during separation of oil in water emulsions. Desalination 2003, 157, 369–375. [Google Scholar] [CrossRef]
- Duclos-Orsello, C.; Li, W.; Ho, C.C.C. A three mechanism model to describe fouling of microfiltration membranes. J. Membr. Sci. 2006, 280, 856–866. [Google Scholar] [CrossRef]
- Badrnezhad, R.; Beni, A.H. Ultrafiltration membrane process for produced water treatment: Experimental and modeling. J. Water Reuse Desalin. 2013, 3, 249. [Google Scholar] [CrossRef]
- Fazana, M.; Zuthi, R.; Guo, W.; Hao, H.; Long, D.; Hai, F.I.; Xia, S.; Li, J.; Li, J.; Liu, Y. Bioresource Technology New and practical mathematical model of membrane fouling in an aerobic submerged membrane bioreactor. Bioresour. Technol. 2017, 238, 86–94. [Google Scholar] [CrossRef]
- Busch, J.; Cruse, A.; Marquardt, W. Modeling submerged hollow-fiber membrane filtration for wastewater treatment. J. Membr. Sci. 2007, 288, 94–111. [Google Scholar] [CrossRef]
- Broeckmann, A.; Busch, J.; Wintgens, T.; Marquardt, W. Modeling of pore blocking and cake layer formation in membrane filtration for wastewater treatment. Desalination 2006, 189, 97–109. [Google Scholar] [CrossRef]
- Lobo, A.; Benito, M.; Pazos, C. Ultrafiltration of oil-in-water emulsions with ceramic membranes: Influence of pH and crossflow velocity. J. Membr. Sci. 2006, 278, 328–334. [Google Scholar] [CrossRef]
- Pedenaud, P.; Heng, S.; Evans, W.; Bigeonneau, D. Ceramic membrane and core pilot results for produced water management. In Proceedings of the Annual Offshore Technology Conference, Rio de Janeiro, Brazil, 4–6 October 2011; pp. 385–400. [Google Scholar]
- OSPAR. Available online: https://www.ospar.org/documents?d=33828 (accessed on 22 June 2018).
Figure 1.
Membrane filtration overview.

Figure 2.
Oil droplet with sufficient and insufficient driving pressure to overcome interfacial tension. (a) Insufficient driving pressure; (b) Sufficient driving pressure.
Figure 2.
Oil droplet with sufficient and insufficient driving pressure to overcome interfacial tension. (a) Insufficient driving pressure; (b) Sufficient driving pressure.

Figure 3.
Required pressure to force a droplet with specific size through five different pore sizes.
Figure 3.
Required pressure to force a droplet with specific size through five different pore sizes.

Figure 4.
Fouling under sub-critical flux operation. (a) Pre-blockage; (b) Post-blockage.

Figure 5.
Concept illustration of the modified flux-stepping method.

Figure 6.
Four common types of blockage. (a) Complete blockage; (b) Intermediate blockage; (c) Standard blockage; (d) Cake blockage.
Figure 6.
Four common types of blockage. (a) Complete blockage; (b) Intermediate blockage; (c) Standard blockage; (d) Cake blockage.


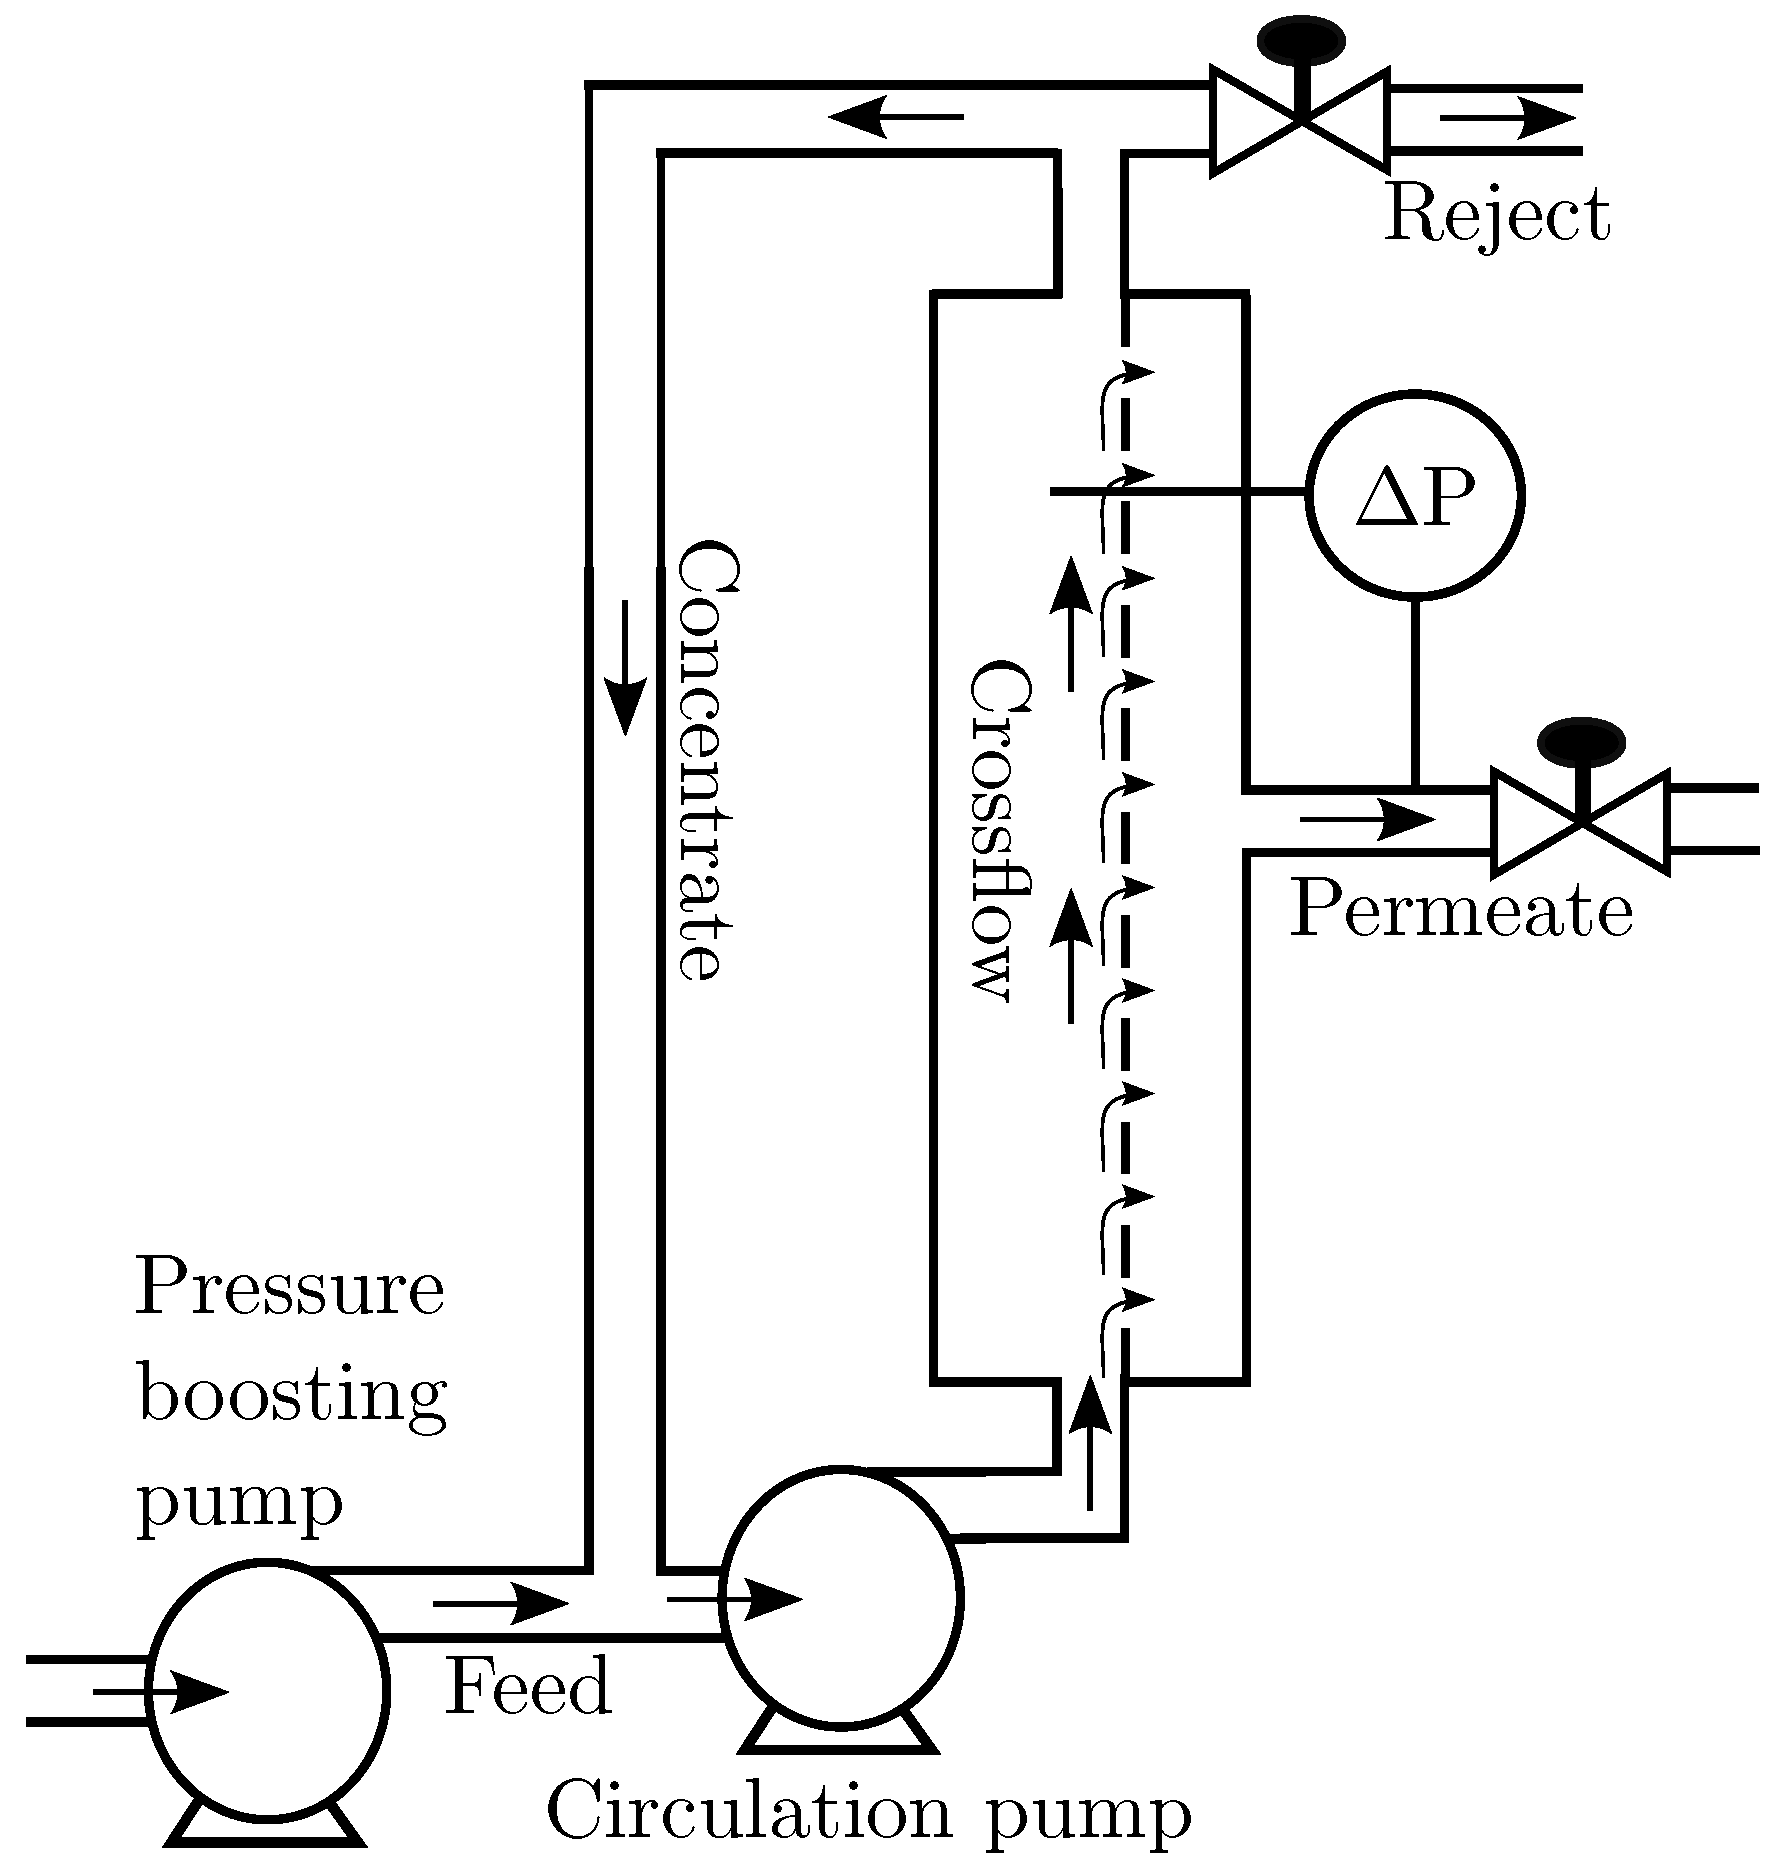
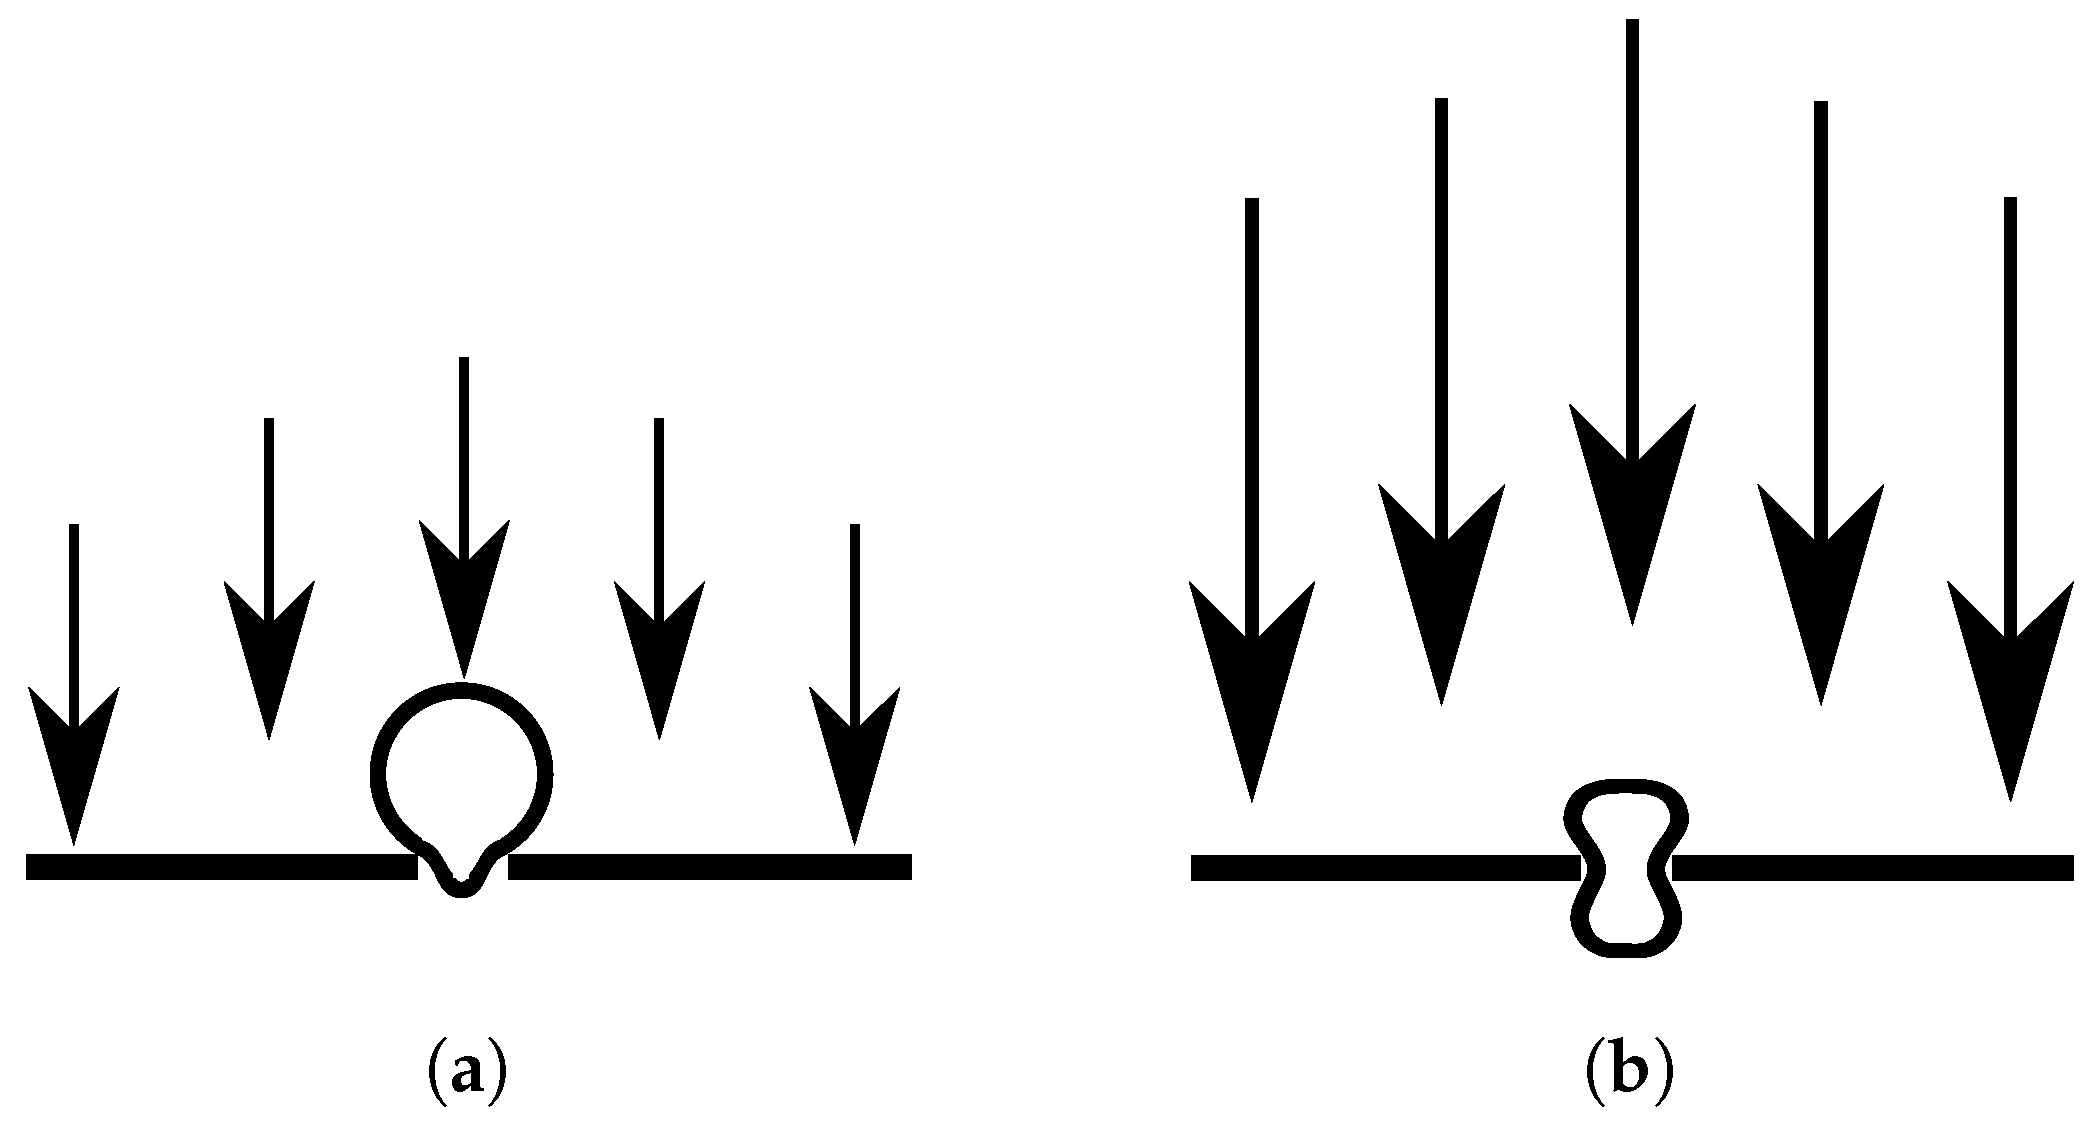
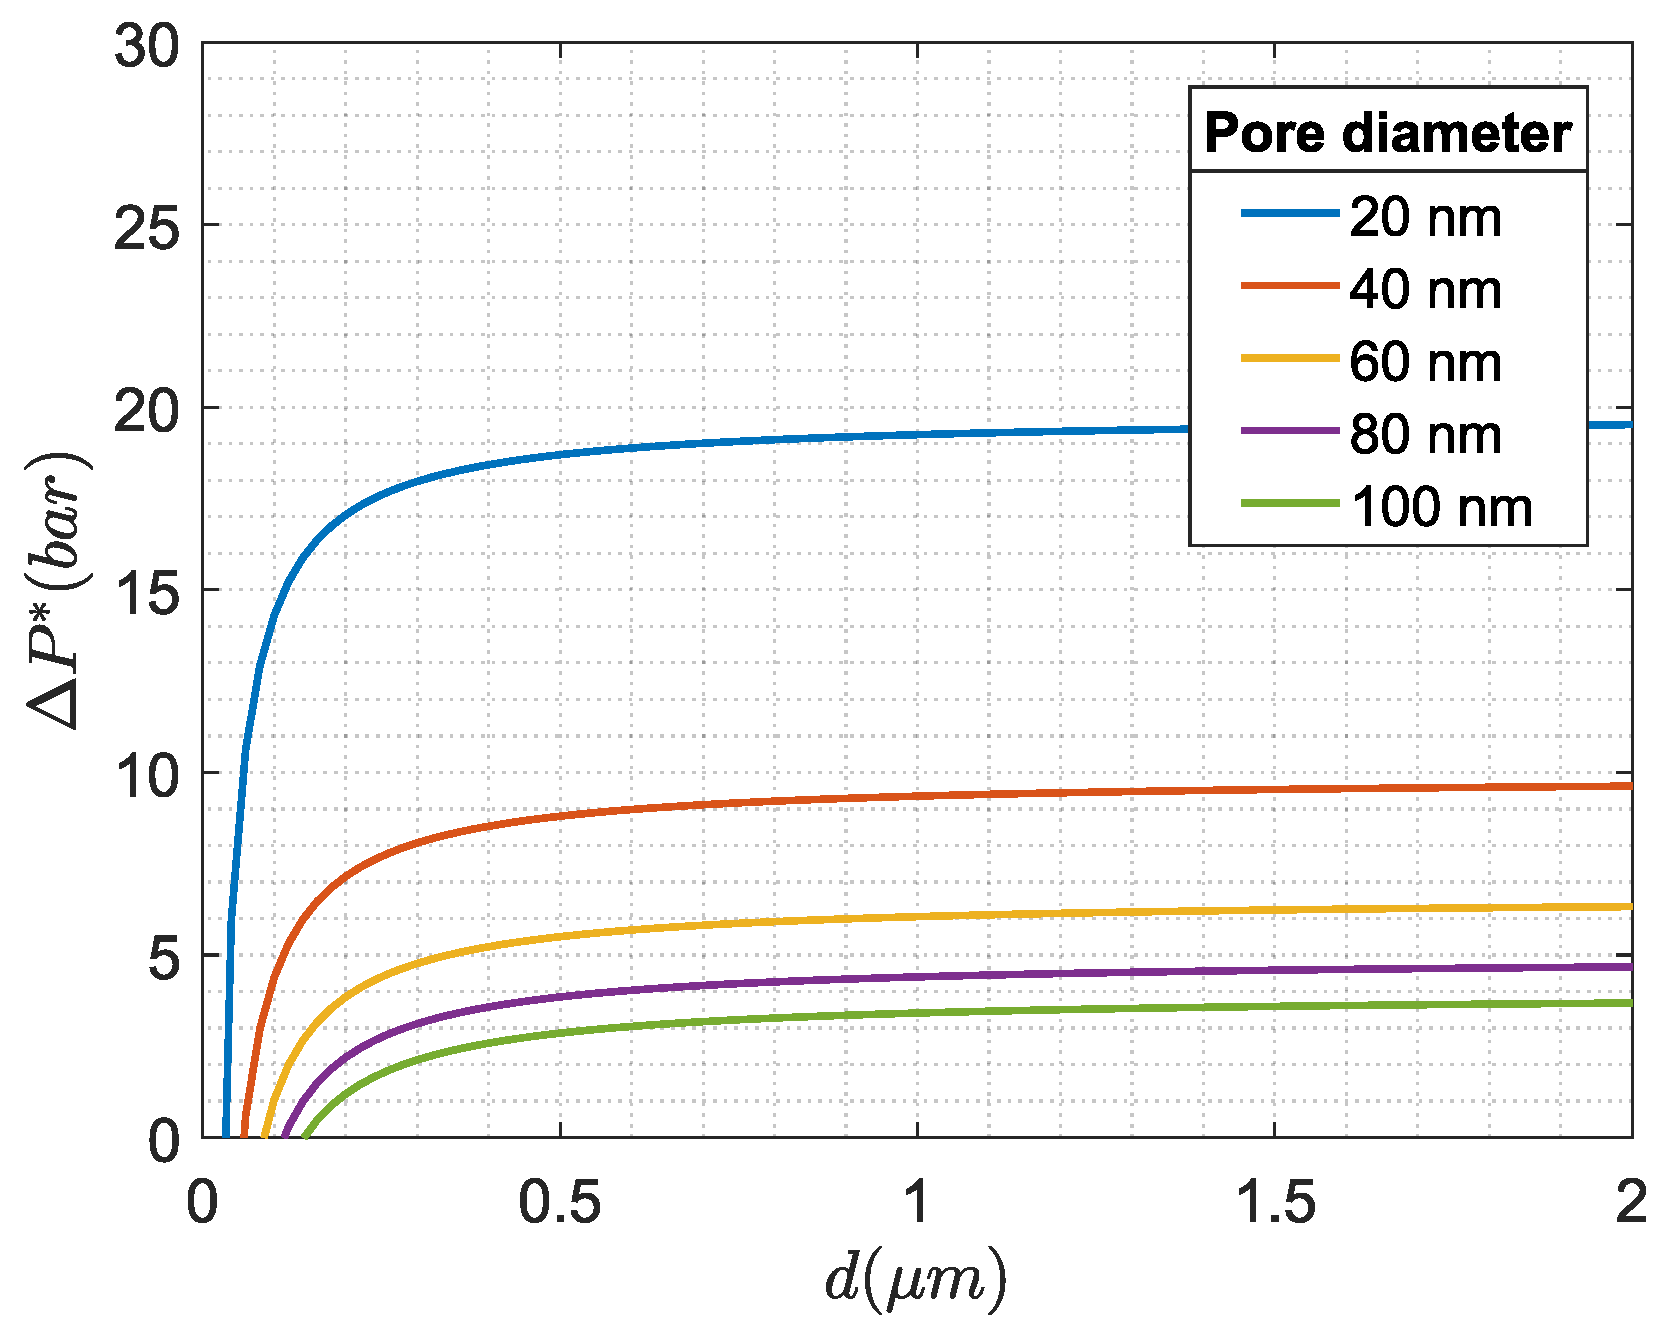
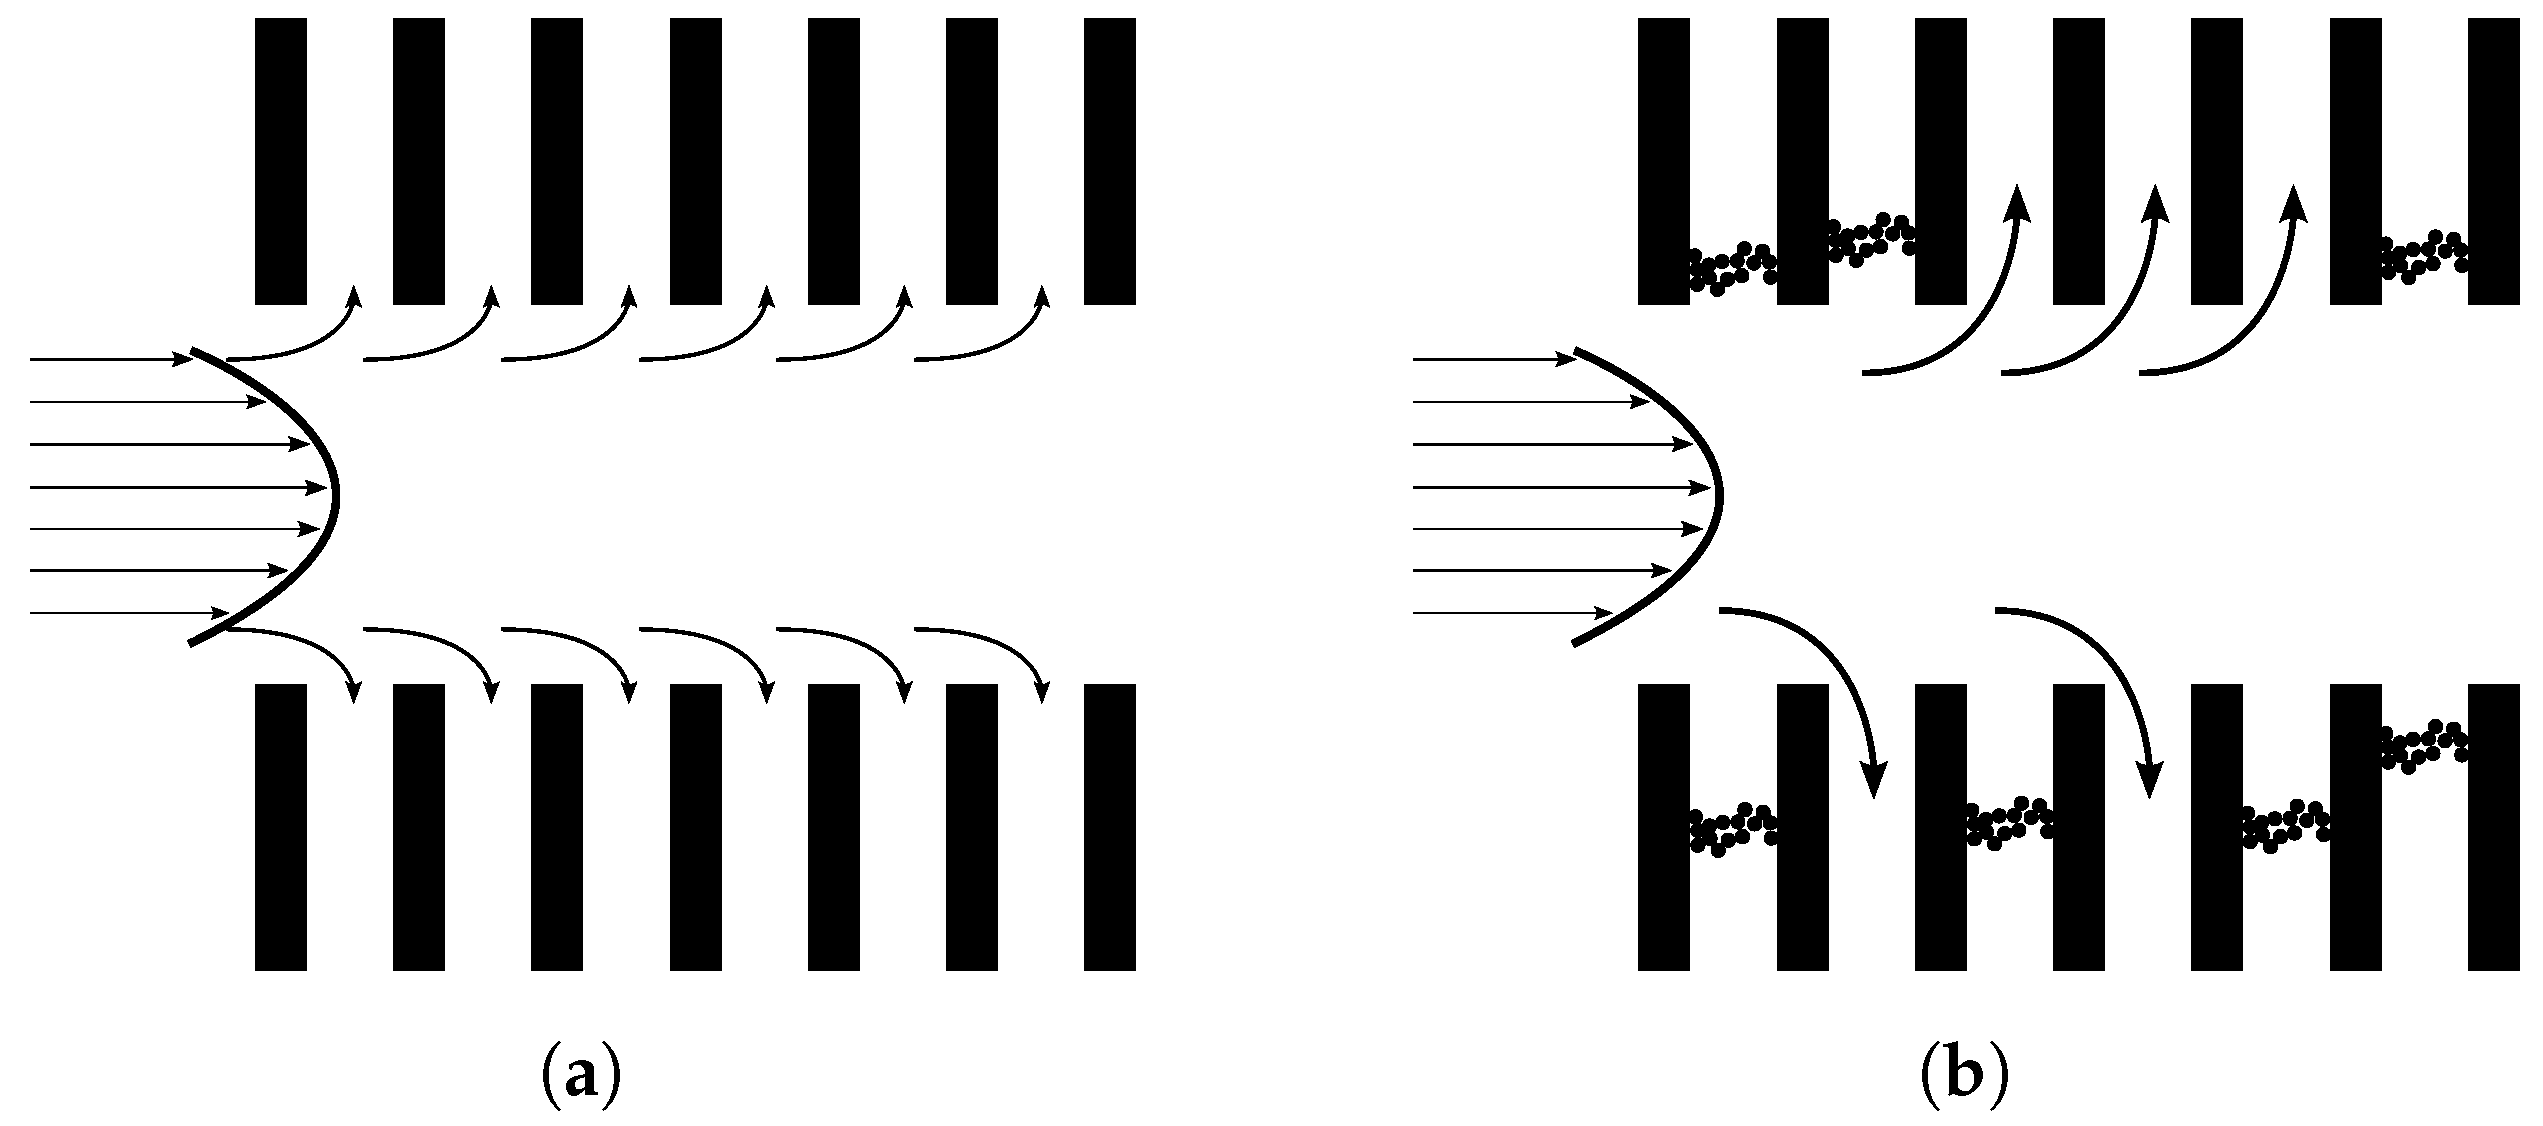
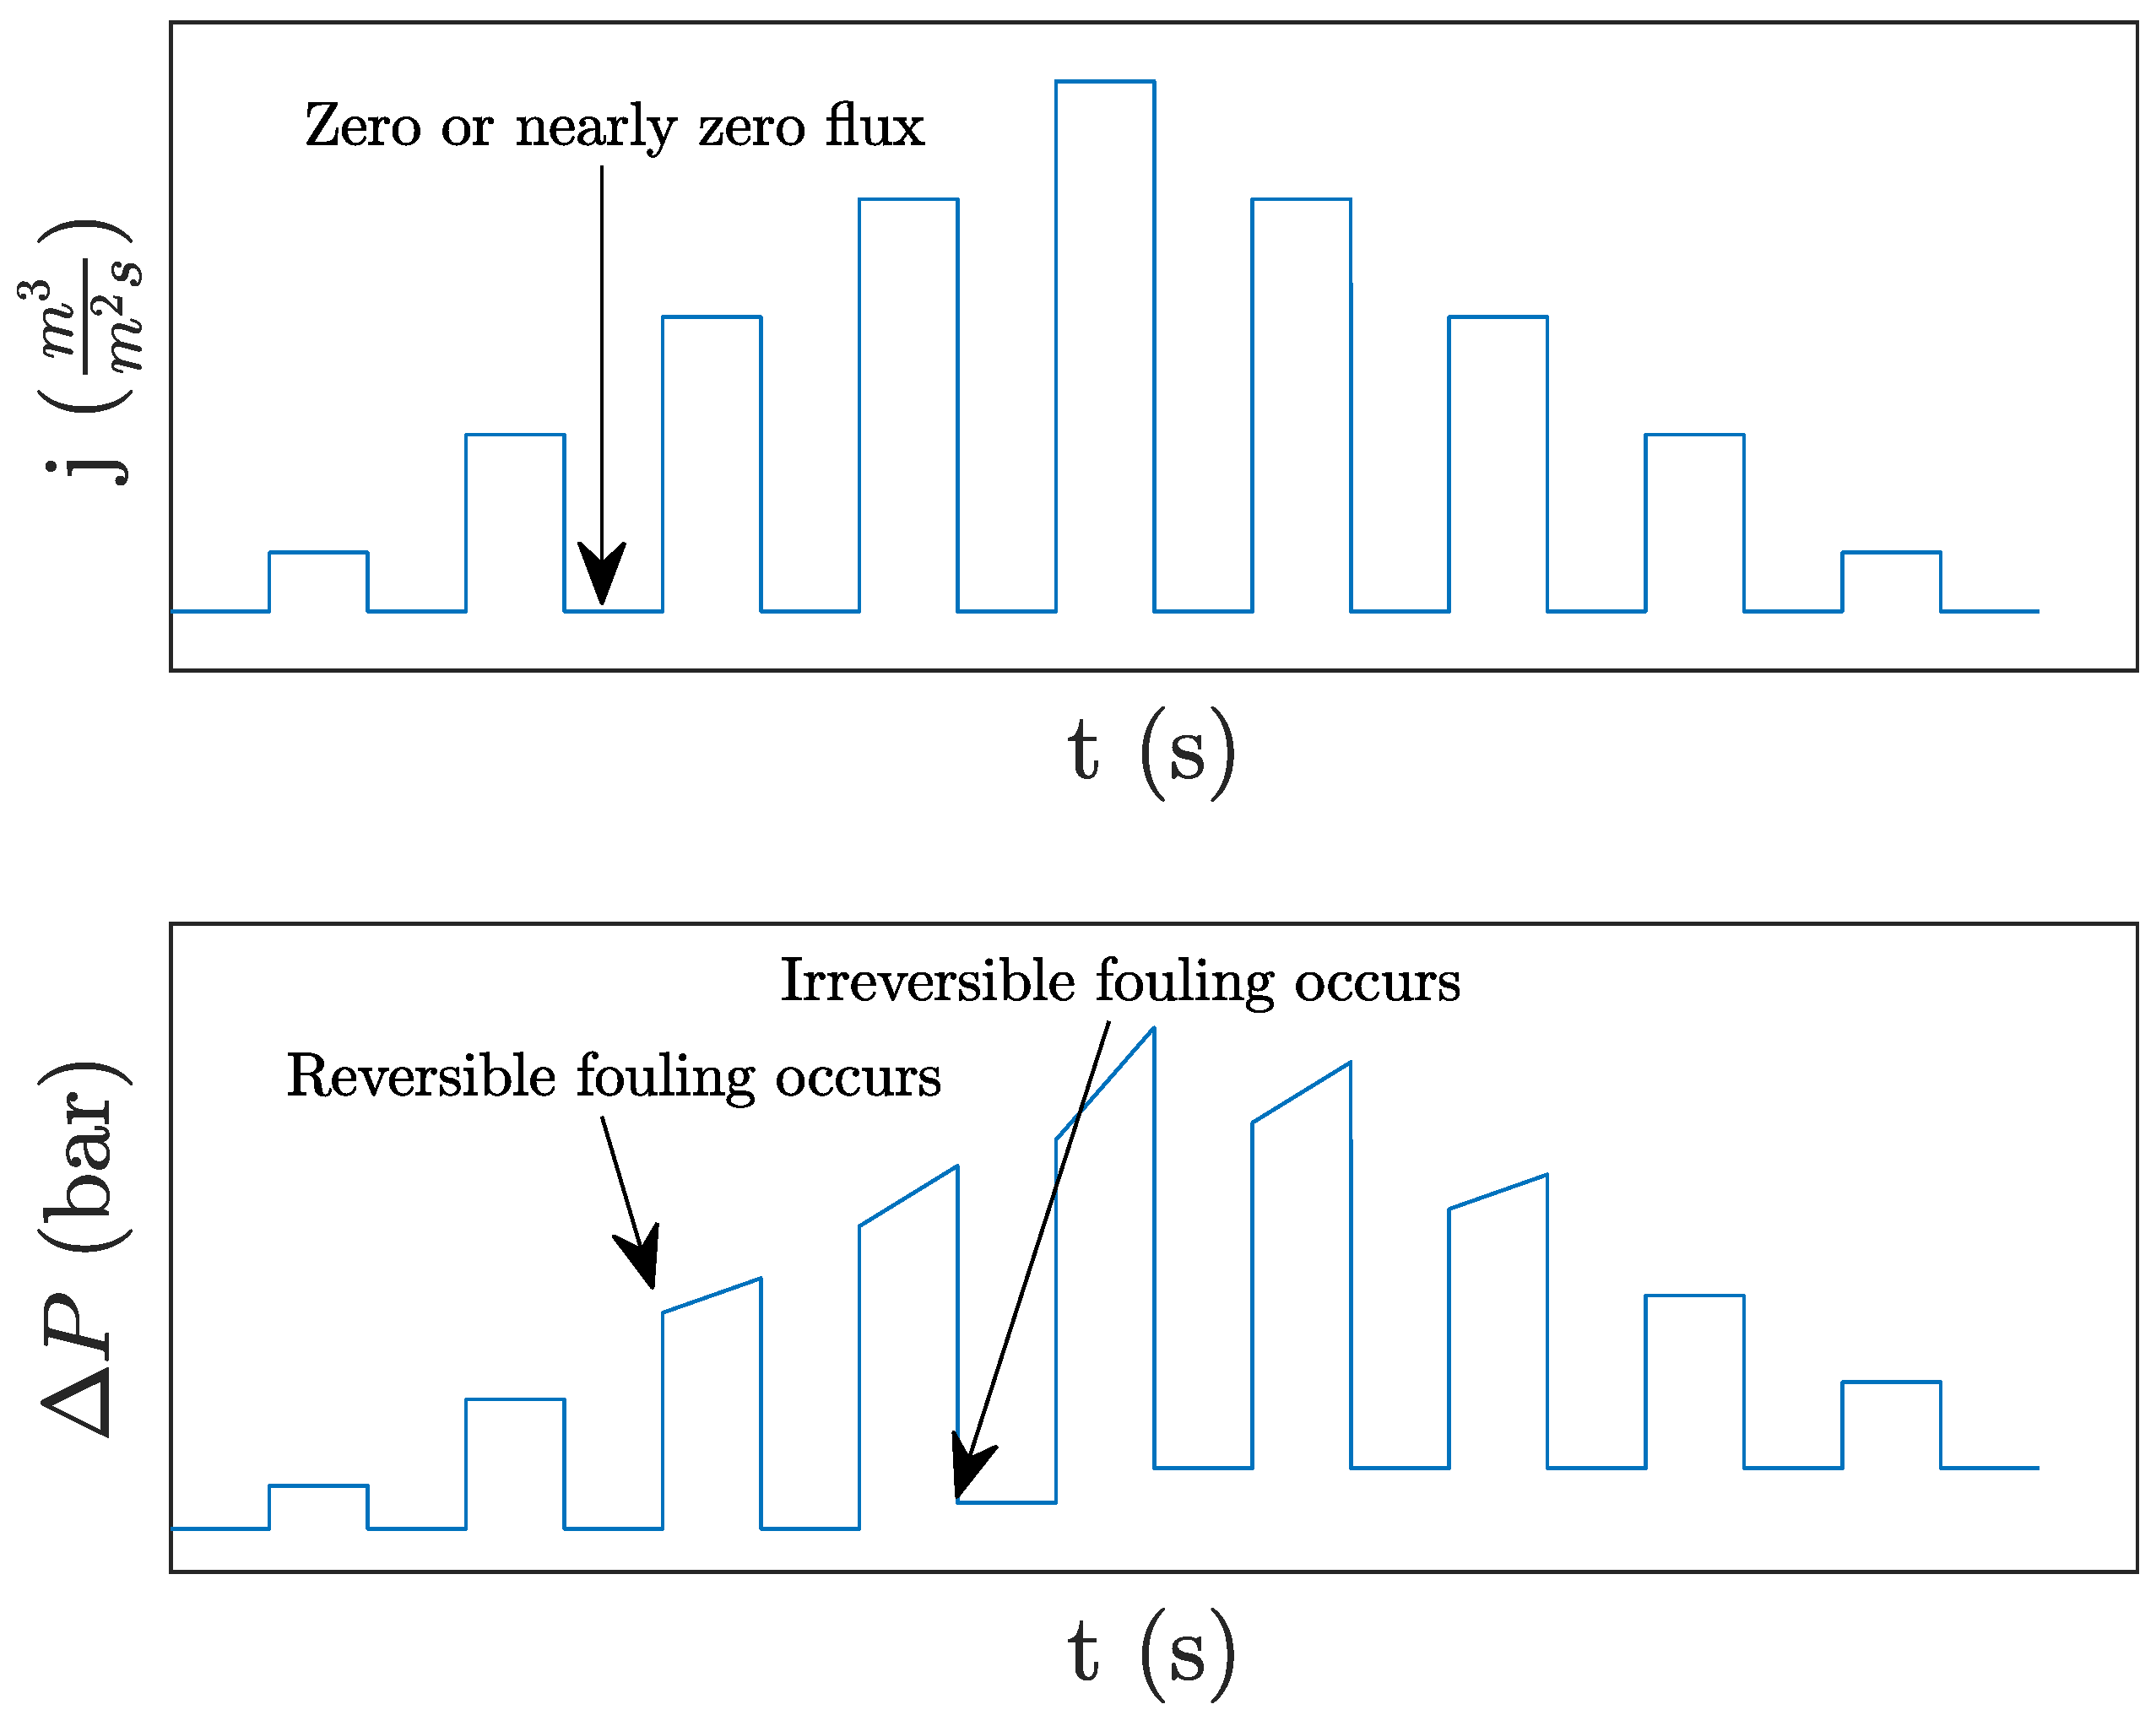
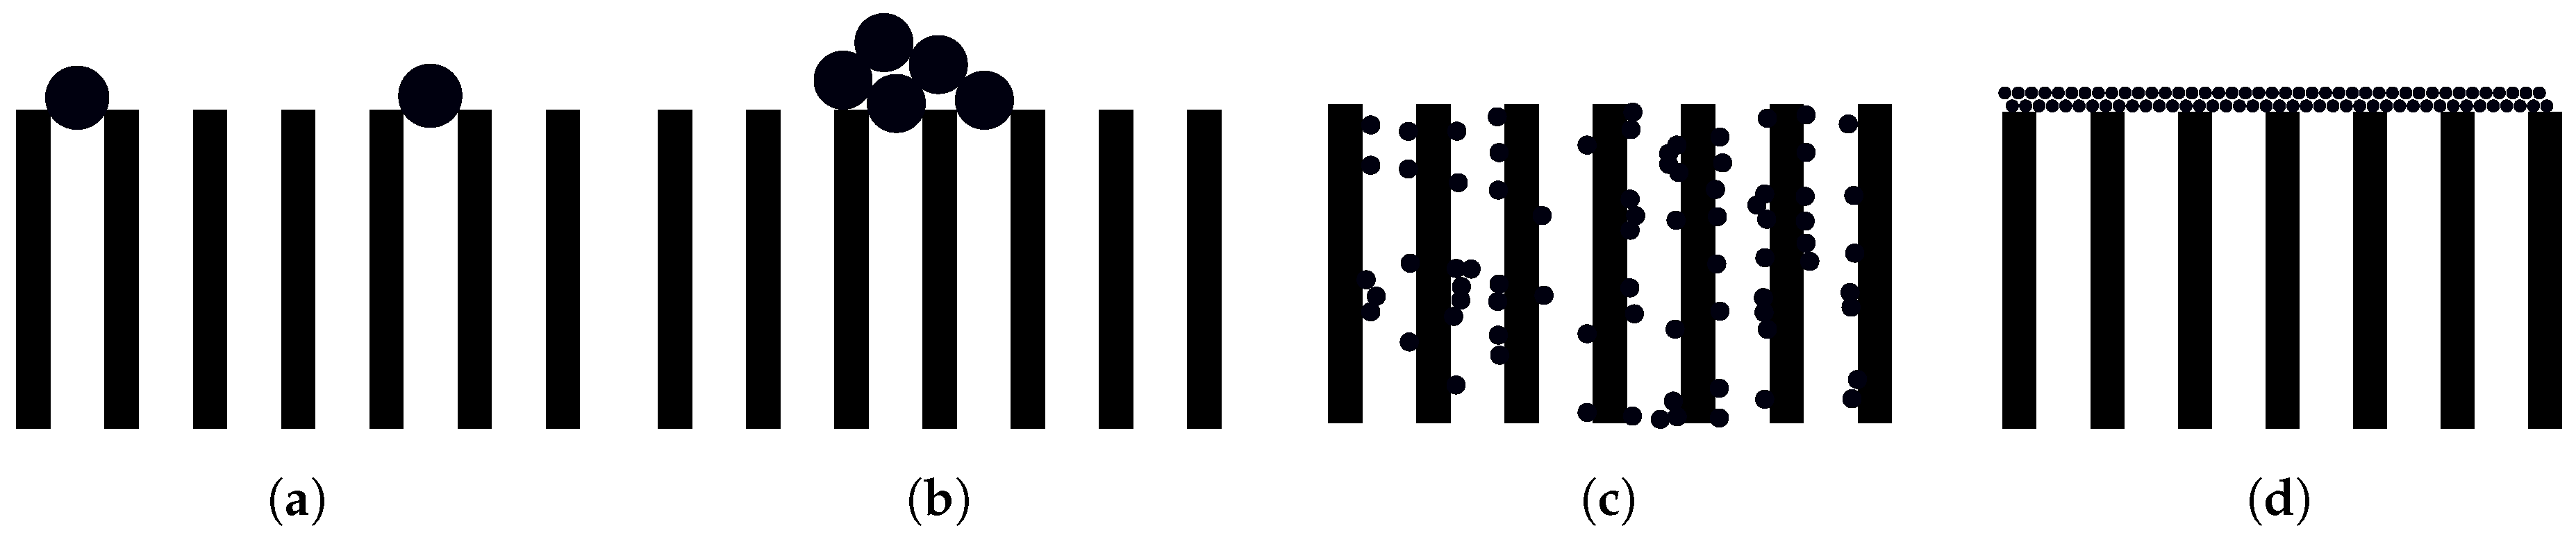
Table 1.
Critical pressure for an OiWM found in different studies.
| Pore Size | Membrane Type | Critical Pressure | Method | Mean Droplet Size | Reference |
|---|---|---|---|---|---|
| 0.15 m | Ceramic | 1 bar | Analytic | 0.9 m | [41] |
| 0.5 m | Ceramic | 2.8 bar | Analytic | 11 m | [18] |
| 0.2 m | Ceramic | 1.25 bar | Experiments | 3 m | [49] |
| 0.2 m | Ceramic | 1.55 bar | Experiments | Not reported | [50] |
| 0.05 m | Ceramic | 2 bar | Experiments | Not reported | [51] |
| 0.2 m | Inorganic Aluminum Oxide | 4 bar | Analytic | 1 m | [48] |
Table 2.
Backwashing configurations for ceramic membranes.
| Filtration Duration | Backwash Duration | TMP | Membrane/Feed-Type | Reference |
|---|---|---|---|---|
| 20 min | 60 s | −3 bar | UF/surface water | [105] |
| 240 min | 20 min | −2.4 bar | UF/reservoir water | [106] |
| 60 s | 0.7 s | −6 bar | UF/OiWM | [18] |
| 280 s | 15 s | −2 bar | MF/OiWM | [49] |
| 30 min | 60 s | −2 bar | UF/OiWM | [107] |
Table 3.
Ultrasonic case studies for membranes filtration.
| Frequencies | Intensity | Application | Results | Reference |
|---|---|---|---|---|
| 28, 45, and 100 kHz | 23 W/cm | Filtration of peptone and milk aqueous solutions | 28 kHz increased permeate flux by 100% | [116] |
| 20 kHz | 5 W/cm | Membrane distillation | Permeate flux increased by 300% | [117] |
| 70–620 kHz | 0–2.2 W/cm | Sulfate polystyrene latex particles | 2.2 W/cm and 70 kHz provide the highest flux recovery | [113] |
| 28 kHz | 0–1.7 W/cm | Filtration of dry baker’s yeast | 1.7 W/cm produced the highest permeate flux | [114] |
| 38 kHz | Non-specified | Filtration of an OiWM | 19% reduction in flow resistance | [115] |
Table 4.
Hermia fouling models [123].
Table 4.
Hermia fouling models [123].
| Structure | Blockage Model |
|---|---|
| Complete blockage | |
| Intermediate blockage | |
| Standard blockage | |
| Cake blockage |
Table 5.
De Bruijn extended fouling models [127].
Table 5.
De Bruijn extended fouling models [127].
| Structure | Blockage Model |
|---|---|
| Complete blockage | |
| Intermediate blockage | |
| Cake blockage |
Table 6.
Kilduff fouling models [129].
Table 6.
Kilduff fouling models [129].
| Structure | Blockage Model |
|---|---|
| Complete blockage | |
| Standard blockage | |
| Cake blockage |
Table 7.
Model comparison overview.
| Models | Model Type | Advantages | Limitations | System Variables | Extends | Year |
|---|---|---|---|---|---|---|
| Hermia [123] | Blocking laws | Simple structure, widely used and validated | Dead-end filtration, constant TMP assumption | TMP, flux | - | 1982 |
| Wiesner [39] | Resistance | Good insight into fouling process, Simple resistance-based structure | No experimental validation, without consideration of CF, concentration and backwash | TMP, flux | - | 1996 |
| Kilduff [129] | Blocking laws | Includes critical flux concept and concentration | No direct link between CF and critical flux | TMP, flux, concentration, critical flux (CF), | Hermia | 2002 |
| De Bruijn [127] | Blocking laws | Includes critical flux concept | No concentration and direct link between CF and critical flux | TMP, flux, critical flux | Hermia | 2005 |
| Busch [138] | Resistance | Includes backwash, resistance as a function of membrane length | High computational complexity, no CF | TMP, flux, concentration, air scouring | - | 2007 |
| Giraldo [40] | Resistance | Includes pore blockage and flux recovery from CFV | No backwash and CF | TMP, flux, concentration, air scouring | Wiesner | 2014 |
| Fazana [137] | Resistance | Good long term model accuracy | No air scouring nor CF, No backwash | TMP, flux, concentration | Wiesner | 2017 |
© 2018 by the authors. Licensee MDPI, Basel, Switzerland. This article is an open access article distributed under the terms and conditions of the Creative Commons Attribution (CC BY) license (http://creativecommons.org/licenses/by/4.0/).
Share and Cite
MDPI and ACS Style
Jepsen, K.L.; Bram, M.V.; Pedersen, S.; Yang, Z. Membrane Fouling for Produced Water Treatment: A Review Study From a Process Control Perspective. Water 2018, 10, 847. https://doi.org/10.3390/w10070847
AMA Style
Jepsen KL, Bram MV, Pedersen S, Yang Z. Membrane Fouling for Produced Water Treatment: A Review Study From a Process Control Perspective. Water. 2018; 10(7):847. https://doi.org/10.3390/w10070847
Chicago/Turabian StyleJepsen, Kasper L., Mads Valentin Bram, Simon Pedersen, and Zhenyu Yang. 2018. "Membrane Fouling for Produced Water Treatment: A Review Study From a Process Control Perspective" Water 10, no. 7: 847. https://doi.org/10.3390/w10070847
Note that from the first issue of 2016, this journal uses article numbers instead of page numbers. See further details here.