Water and Suspended Sediment Budgets in the Lower Mekong from High-Frequency Measurements (2009–2016)


1
School of Maritime Economics and Technology, Ba Ria-Vung Tau University, 84254 Ba Ria-Vung Tau, Vietnam
2
LEGOS, Univ. Toulouse, IRD, CNRS, CNES, 14 av. E.-Belin, 31400 Toulouse, France
3
Department of Water Environment Oceanography, University of Science and Technology of Hanoi (USTH), 18 Hoang Quoc Viet, 100000 Hanoi, Vietnam
4
Cuu Long River Hydrological Center, Southern Regional Hydro-Meteorological Center (SRHMC), 84282 Can Tho, Vietnam
*
Author to whom correspondence should be addressed.
Water 2018, 10(7), 846; https://doi.org/10.3390/w10070846
Submission received: 19 April 2018
/
Revised: 8 June 2018
/
Accepted: 20 June 2018
/
Published: 26 June 2018
(This article belongs to the Special Issue Water-Energy-Food Nexus in Asia, with Focus on the Mekong Region)
Abstract
:Based on a new dataset of high temporal resolution of water discharge (hourly frequency) and suspended sediment concentration (twice daily frequency at ebb and flood tides) at Can Tho and My Thuan stations during the 2009–2016 period, monthly and annual flow and suspended sediment flux of the lower Mekong River were calculated. The present water discharge of the Mekong River to the sea can be estimated to be 400 km3 yr−1, +/− 100 km3 yr−1 depending on El Niño Southern Oscillation (ENSO), and the present sediment supply to the sea can be estimated to be 40 Mt yr−1, +/− 20 Mt yr−1 depending on ENSO. The ENSO influence (proxied by the Southern Oscillation Index—SOI) on Q (water discharge) and Qs (sediment flux) is at maximum at a time lag of 8–9 months. The 2010–2011 La Niña event increased the water supply by almost 30% and the sediment supply by 55% in 2011. The 2015–2016 El Niño event decreased the water supply by 20% and the sediment supply by 50% in 2015–2016. The average net water discharge was 12,550 m3 s−1 in neutral years. The Tien River at My Thuan accounted for ~52%, and the Hau River at Can Tho for ~48% of the total Mekong River discharge, with small variations (of the order 1%) amongst years. In terms of suspended sediment delivery to the sea, the Tien River accounted for a more variable portion of 55% in neutral years, 57.3% in 2015–2016 (El Niño) and 62% in 2011 (La Niña). 80% of water discharge occurred during the flood season (July–December) and 20% occurred in the low flow season (January–June), the proportion being 91% and 9% for the sediment supply. Previous estimates of annual sediment supplies to the sea (145–160 Mt yr−1) had been established before 2003. Possible origins of the recent reduction by ~75% of sediment supply are presented and discussed.
Keywords:
Mekong; river discharge; suspended sediment; dams; Tien River; Hau River; ENSO; El Niño; La Niña1. Introduction
Weathering and mechanical erosion, which constrain the fluxes of sediment and associated elements (e.g., trace elements, nutrients, organic matter) from the continent to the ocean, are attributed to a combination of natural processes related to geomorphology, tectonic activity, and climate influences as well as land cover [1,2,3,4,5,6]. Additionally, human disturbance affects erosion and sediment supply to estuaries, deltas or coastal zones [7,8,9,10]. Recently, there has been increasing concern about the global river sediment balance, particularly with respect to its response to climate change and anthropogenic impacts [6,7,11,12,13,14,15,16]. However, important uncertainties persist, mainly due to the nonstationary nature of sediment fluxes and the use of dated and/or questionable data (short-term sampling, inappropriate sampling frequency and/or data collected before dam/reservoir construction, deforestation or climatic changes [9,17,18,19]).
The rivers draining the Himalaya Mountains into South-East Asia have been recognized as significantly contributing to suspended particulate matter (SPM) delivery to the global ocean [4,5,13,20]. In this key area, recent and rapid changes in population and economic growth have strongly affected the functioning of the river-systems leading to major human pressure on its sustainable development. Therefore, South-East Asian Rivers are good indicators of the strong influence of anthropogenic activities on suspended sediment transport. The sediment supply has declined in many large rivers with the construction of large reservoirs: in the Yellow River [14,21]; in the Changjiang (Yangtze) River [14,22,23,24]; in the Red River [25,26], as previously observed on others large rivers such as in the Nile River [4] and the Mississippi River [21]. Monitoring and predicting the modification of sediment fluxes in South-East Asia represents one of today’s major challenges for environmental sciences, because of the continually shifting anthropogenic and/or climatic impact and the need for continuous updated fluvial data for management purpose.
The Mekong River is the second largest river basin (795 × 103 km2) after the Yangtze River (1.8 × 10⁶ km2) and the third in terms of water discharge (after the Ganges-Brahmaputra and the Yantgze Rivers) in Southeast Asia. The Mekong basin is shared by six riparian countries: China, Myanmar, Laos, Thailand, Cambodia, and Vietnam. In recent years, the basin has faced rapid development related to water resources management, including various hydropower plans and large irrigation schemes [27,28]. Reservoir operation and climate change are among the most influential drivers of future hydrological change in the Mekong, and other drivers include land cover change, new irrigation and water diversion schemes, and urbanization [29,30].
The impact of reservoir operation on the Mekong basin has been studied by different actors, including the Mekong River Commission (MRC), the Asian Development Bank (ADB), the United Nations Education Scientific and Cultural Organization (UNESCO), the National Natural Science Foundation of China (NNSFC), the World Wild Fund (WWF), the US National Science Foundation (NSF) and the Office of Naval Research (ONR) (e.g., [31,32,33,34,35,36,37,38,39,40,41,42,43,44,45,46]), showing that the reservoirs in the upper Mekong basin have trapped most of the sediment from the upper reaches, and the hydrological regime and river direction was profoundly changed due to water regulation, with lower flood peaks and higher dry season flows. However, most analysis were based on “recycled” database (e.g., [18,47] and/or used inadequate sampling frequencies, including monthly to weekly sampling (e.g., [34,38,41]). The serious lack of long-term and accurate sediment data in the Mekong River makes the sediment flux into the estuary impenetrable [18,39,42,48,49].
The Research Project “The erosion process in the Lower Mekong Delta Coastal Zones (LMDCZ) and the measures for protecting Go-Cong and U-Minh from coastal erosion” supported by European Union (EU), Agence Française de Développement (AFD) and Southern Institute of Water Resources Research (SIWRR) aims at understanding the mechanism of the erosion/accretion process by identifying the main causes responsible for this erosion, and then setting up measures in order to protect Go-Cong and U-Minh from coastal erosion. Within this project, a budget of sediment supply by the Mekong River in its delta was requested. The study was based on the most recent extensive dataset of hourly water discharges and twice-daily suspended sediment concentrations (SSC), collected between 2009 and 2016 at 2 strategic sites (Can Tho and My Thuan gauging stations). Before 2009, no regular accurate data on water discharge and sediment concentration was available on the lower Mekong River (including Thailand, Cambodia and Vietnam areas). The present paper summarizes the main information derived from this dataset. Its objectives are to quantify the actual water and sediment flux by the Mekong River to the sea and analyze the spatial-temporal variation of sediment flux to the sea of the Mekong River, at short term with the new dataset (2009–2016), and over a longer perspective using additional data from the literature.
2. Materials and Methods
2.1. Study Area
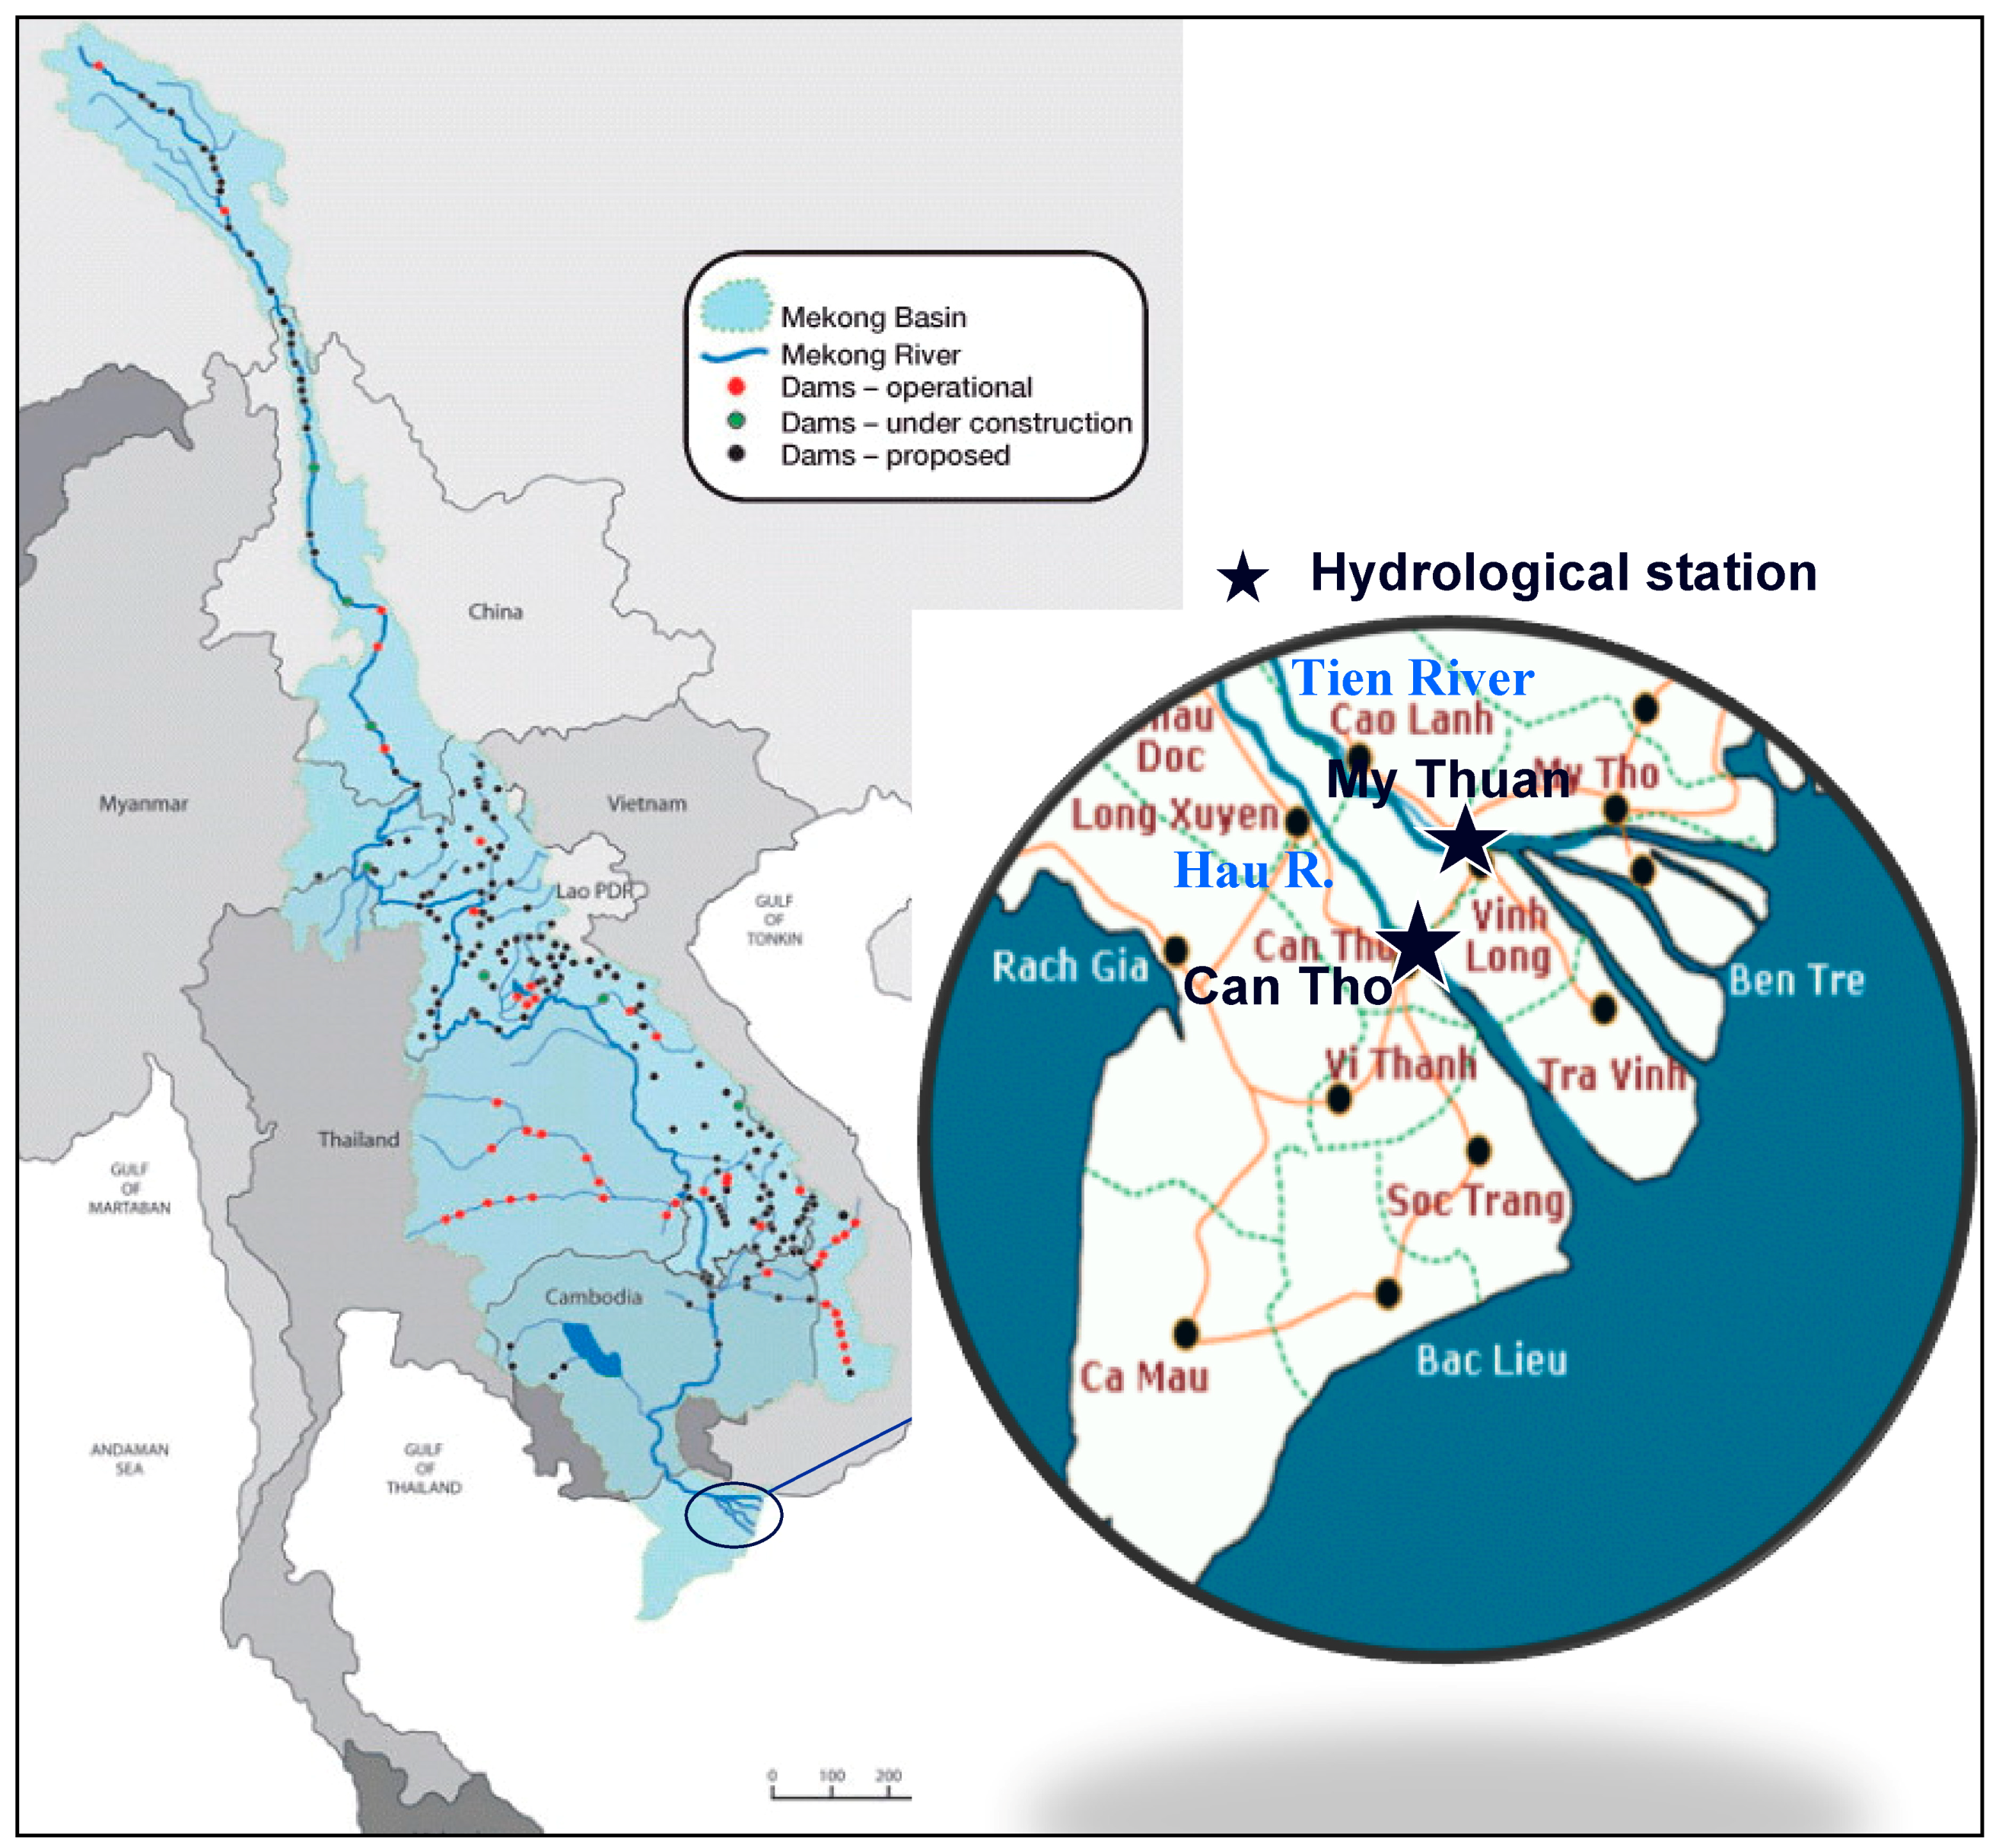
The Mekong River is the 10th longest river in the world with a total length of 4909 km. The Mekong River originates from the Tibetan plateau and flows through a narrow deep gorge along with the Salween and Yangtze Rivers that together are known as the ‘Three Rivers Area’. The Mekong River then flows through Myanmar, Laos, Thailand, and Cambodia before it finally drains into the sea creating a large delta in Viet Nam (Figure 1). The Mekong flows in the delta through two main distributaries: the Tien River (generally referred to as the Mekong River, in the delta) in its eastern part, which accounts for nearly 58% of the total Mekong water discharge, and the Hau River (the “second river” in Vietnamese, also known as Bassac River) in its western part, which accounts for 42% of the Mekong discharge [50]. Downstream to My Thuan, the Tien River separates into other important distributaries: The Co Chien River, the Ham Luong, the Dai and the Tieu Rivers, from Southwest to Northeast.
The river discharge of the Mekong is mostly controlled by the tropical monsoon climate, which has distinct wet and dry seasons [51]. Mean annual rainfall varies from 1000 mm in Thailand to 3200 mm in Laos [52]. In the Mekong River basin, 85% of water discharge occurs during the flood season and 15% occurs in the low flow season [53]. The discharge is the largest from August–September and the smallest in April–May [54]. In contrast to other Asian rivers, the sediment discharge of the Mekong River remained constant on a millennial time scale, at a rate of 144 +/− 34 million tons per year since 3 kyr, which resulted in a constant expansion of the delta front [55]. The long term mean annual sediment load of the Mekong River at its mouth was estimated to be at 145–160 Mt yr−1 [5,56,57], and it seems from remotely sensed measurements of surface SPM concentrations that its flux has recently reduced [58].
Many studies have analyzed the impact of low-frequency climate variability on hydrological conditions in the Mekong River basin and the El Niño Southern Oscillation (ENSO) indices were widely used (e.g., [30,38,39,59,60,61]). They showed that the ENSO phases significantly influence precipitation, runoff and water level in the Mekong River basin. Piton and Delcroix [62], based on data from 43 consecutive years of in situ measurement (1960–2002) and seven years of satellite monitoring (1996–2002), demonstrated that El Niño phases were associated to a decrease in rainfall in the middle and lower Mekong basin and to a reduction of water discharge at the Chroy Chang Var station (located in Cambodia) with a lag of 6 months. The discharge reduction reached 34% during the strong 1997–98 El Niño. On the other hand, higher discharges were observed during La Niña events, with a similar lag.
Hydropower is a key active sector in the Mekong River basin, particularly in China and Laos (Table 1; [63]). Total hydropower potential in the upper Mekong basin is estimated to be 23,000 MW, while total hydropower potential in the lower Mekong basin is 30,000 MW [37]. This includes 13,000 MW of 11 projects on the Mekong’s mainstream, and the remaining on its tributaries. The Manwan Reservoir, built in 1993 in China in the upper reach of the river, was the first large reservoir commissioned on the main stream of the Mekong River. About 11 projects are operating and under construction in China in the upper part. Recently, two large storage dams on the Mekong cascade (the 4200 MW Xiaowan and the 5850 MW Nuozhadu hydropower projects, with 9800 and 12,400 million m3 of active storage) started to be fully operating (Figure 1, Table 2). About 74 projects in the lower part are operating and 22 projects are under construction including Xayaburi (1260 MW) and Don Sahong (260 MW) mainstream projects (Table 1). Although the reservoirs in the upper Mekong basin have trapped most of the sediment from the upper reaches, little information is available on the impact of dams on the sediment load in the lower Mekong basin (especially in the Mekong Delta) and on the sediment flux by the Mekong River to the sea. Walling [18] estimated that if the major dams in the upper Mekong had little impact on the sediment load until 2002 (in a study covering 1960–2002), they likely may decrease the sediment load in a near future.
The sediment supply in the Mekong delta is impacted as well by other anthropogenic activities, such as groundwater pumping, irrigation, dredging, sand mining and land use changes (deforestation, soil conservation measures) [64,65,66,67].
The Mekong Delta of Vietnam is surrounded by: (a) Vietnam-Cambodia border in the North, (b) Pacific Ocean/South China Sea to the East (the so-called East sea), (c) Gulf of Thailand in the West (the so-called West sea), and (d) Vam Co Dong River and Ho Chi Minh City in the North-West. Hydrodynamic conditions in the Mekong Delta are affected directly by the river flow, the tidal regime of the East Sea (South China Sea) and for some parts of the delta by the tidal regime in the Gulf of Thailand (West Sea). The East Sea has a semi-diurnal and irregular sea-tide regime, while the West Sea is diurnal. Ogston et al. [68] show that reversing currents were measured until ~100 km landward in wet season and until ~190 km in dry season (their Figures 2 and 4). This mechanism has also been studied from numerical models (see, e.g., Figures 5 and 10 of Xing et al. [69]).
2.2. Data
In this study, the available dataset compiles hourly water discharge and twice-daily suspended sediment concentration at the Can Tho and My Thuan gauging stations from 2009 to 2016, supplied by the Cuu Long River Hydrological Center. My Thuan and Can Tho stations quantify flow of the Tien and Hau Rivers after flowing through the Plain of Reeds area (POR) and Long Xuyen Quadrant (LXQ), and after distribution of water through main irrigation channels in the POR and LXQ regions. My Thuan and Can Tho stations, which are influenced by sea tide, are located in the estuaries of these two main distributaries of the Mekong: Can Tho at 85 km from the mouth, and My Thuan at 100 km from the mouth. The observed alternation of seaward and landward currents in Can Tho and My Thuan was already described in the literature [50,68,69,70,71,72].
The water level is continuously recorded at the Can Tho and My Thuan gauging stations. Every hour, the flow has also been measured with a LS25 1A current meter at five depths in the main channel in front of these two stations from a metal boat, since 2009. Four times a year (in January, April, July and October), transects of currents are regularly measured by ADCP across the river, and currents are measured as well by a flow meter at 5 depths in the main channel. During these six-day calibration campaigns, about 35 transects are performed during ebb tides, and 35 during flood tides. These measurements enable to check the accordance of current measurements, and to establish rating curves between the flow depth profile from the flow meter in the main channel, the river discharge integrated over the cross-section and the water elevation. The rating curves, established four times a year, are used to infer river discharge from water level at hourly step [73].
All the year long, suspended sediment concentrations in the main channel (Cc) are determined twice a day (one at ebb tide, one at flood tide) from water sampling and weighting [74]. Water is sampled from the surface to the bottom using an integrating isokinematic-filling bottle. Sampling is performed at the time of the maximum velocity in the river. Water is filtered on “blue filters” (Chinese brand) with a 8 μm porosity. During the 70 ADCP transects of the four annual calibration field campaigns, water is also sampled along four profiles across the river to estimate the cross-averaged suspended sediment discharge Qs, and establish a rating curve between Cc and the “representative” suspended sediment concentration (Cav = Qs/Q) enabling to better estimate the sediment discharge. Two linear curves are established (Cav = k Cc + b), one for flood, one for ebb tide. A maximum of 15% of outliers are eliminated, and generally more than 75% of remaining points lie within the envelope +/− 15% of the rating curve. The resulting relationships Cc-Cav (one for ebb tide, one for flood tide) are used during three months to estimate the cross-section average suspended sediment concentration from the measured Cc.
For the analysis of climatic variations, in particular to assess the impact of ENSO on the water and sediment supplies, different indexes were considered, provided by the National Oceanic and Atmospheric Administration (NOAA). The South Oscillation Index (SOI) presented in this paper was downloaded from [75].
To put our results in perspective over a longer time scale, data extracted from the literature were also considered; they are introduced in the discussion. It was hard to gather data at different stations (from upstream to downstream of the Mekong River basin) and for different periods (pre- and post-dams) with the same frequency sampling (e.g., daily measurements). Before 2009, programs for sediment and water discharge monitoring were discontinuous or had very low sampling frequency. Since 2009, the Mekong River basin has been well gauged, and the daily-hourly water discharge and suspended sediment concentration at major stations have been recorded (especially in the lower part). Thus, a more accurate annual sediment flux transported in the Mekong River can be calculated.
2.3. Data Analysis
The sediment flux in ebb tide and flood tide conditions were calculated following:
where Q stands for the water supply during an ebb or flood period, Qs for the suspended sediment supply during this period, Cav for the average suspended sediment concentration, and subscripts e and f stand for ebb and flood, respectively. In the data process, water discharges were calculated every 10 s by linear interpolation between the measurements performed at one-hour interval, so as to discriminate flows seaward and landward and estimate their budgets.
Qs,e = Qe × Cav,e
Qs,f = Qf × Cav,f
The monthly net sediment flux (Qs j, in Mt month−1) of month j was then computed from the contributions of all ebb tides and flood tides of the month:
where n stands for the number of days in month j, and the annual sediment flux (Qsa, in Mt) from:
The identification of breaking points during the period of study, if any, is based on cumulative discharge and sediment supplies [76,77].
The variability of time series (either monthly or yearly values) is assessed by the coefficient of variation (CV), defined by the ratio of the standard deviation to the mean (e.g., [78]).
Monthly values of the Southern Oscillation Index (SOI) were considered to analyze the importance of the ENSO-related climate variability on monthly values of water discharge, sediment yield and sediment delivery to the ocean in the lower Mekong River.
3. Results
3.1. Monthly Averages and Seasonal Variations
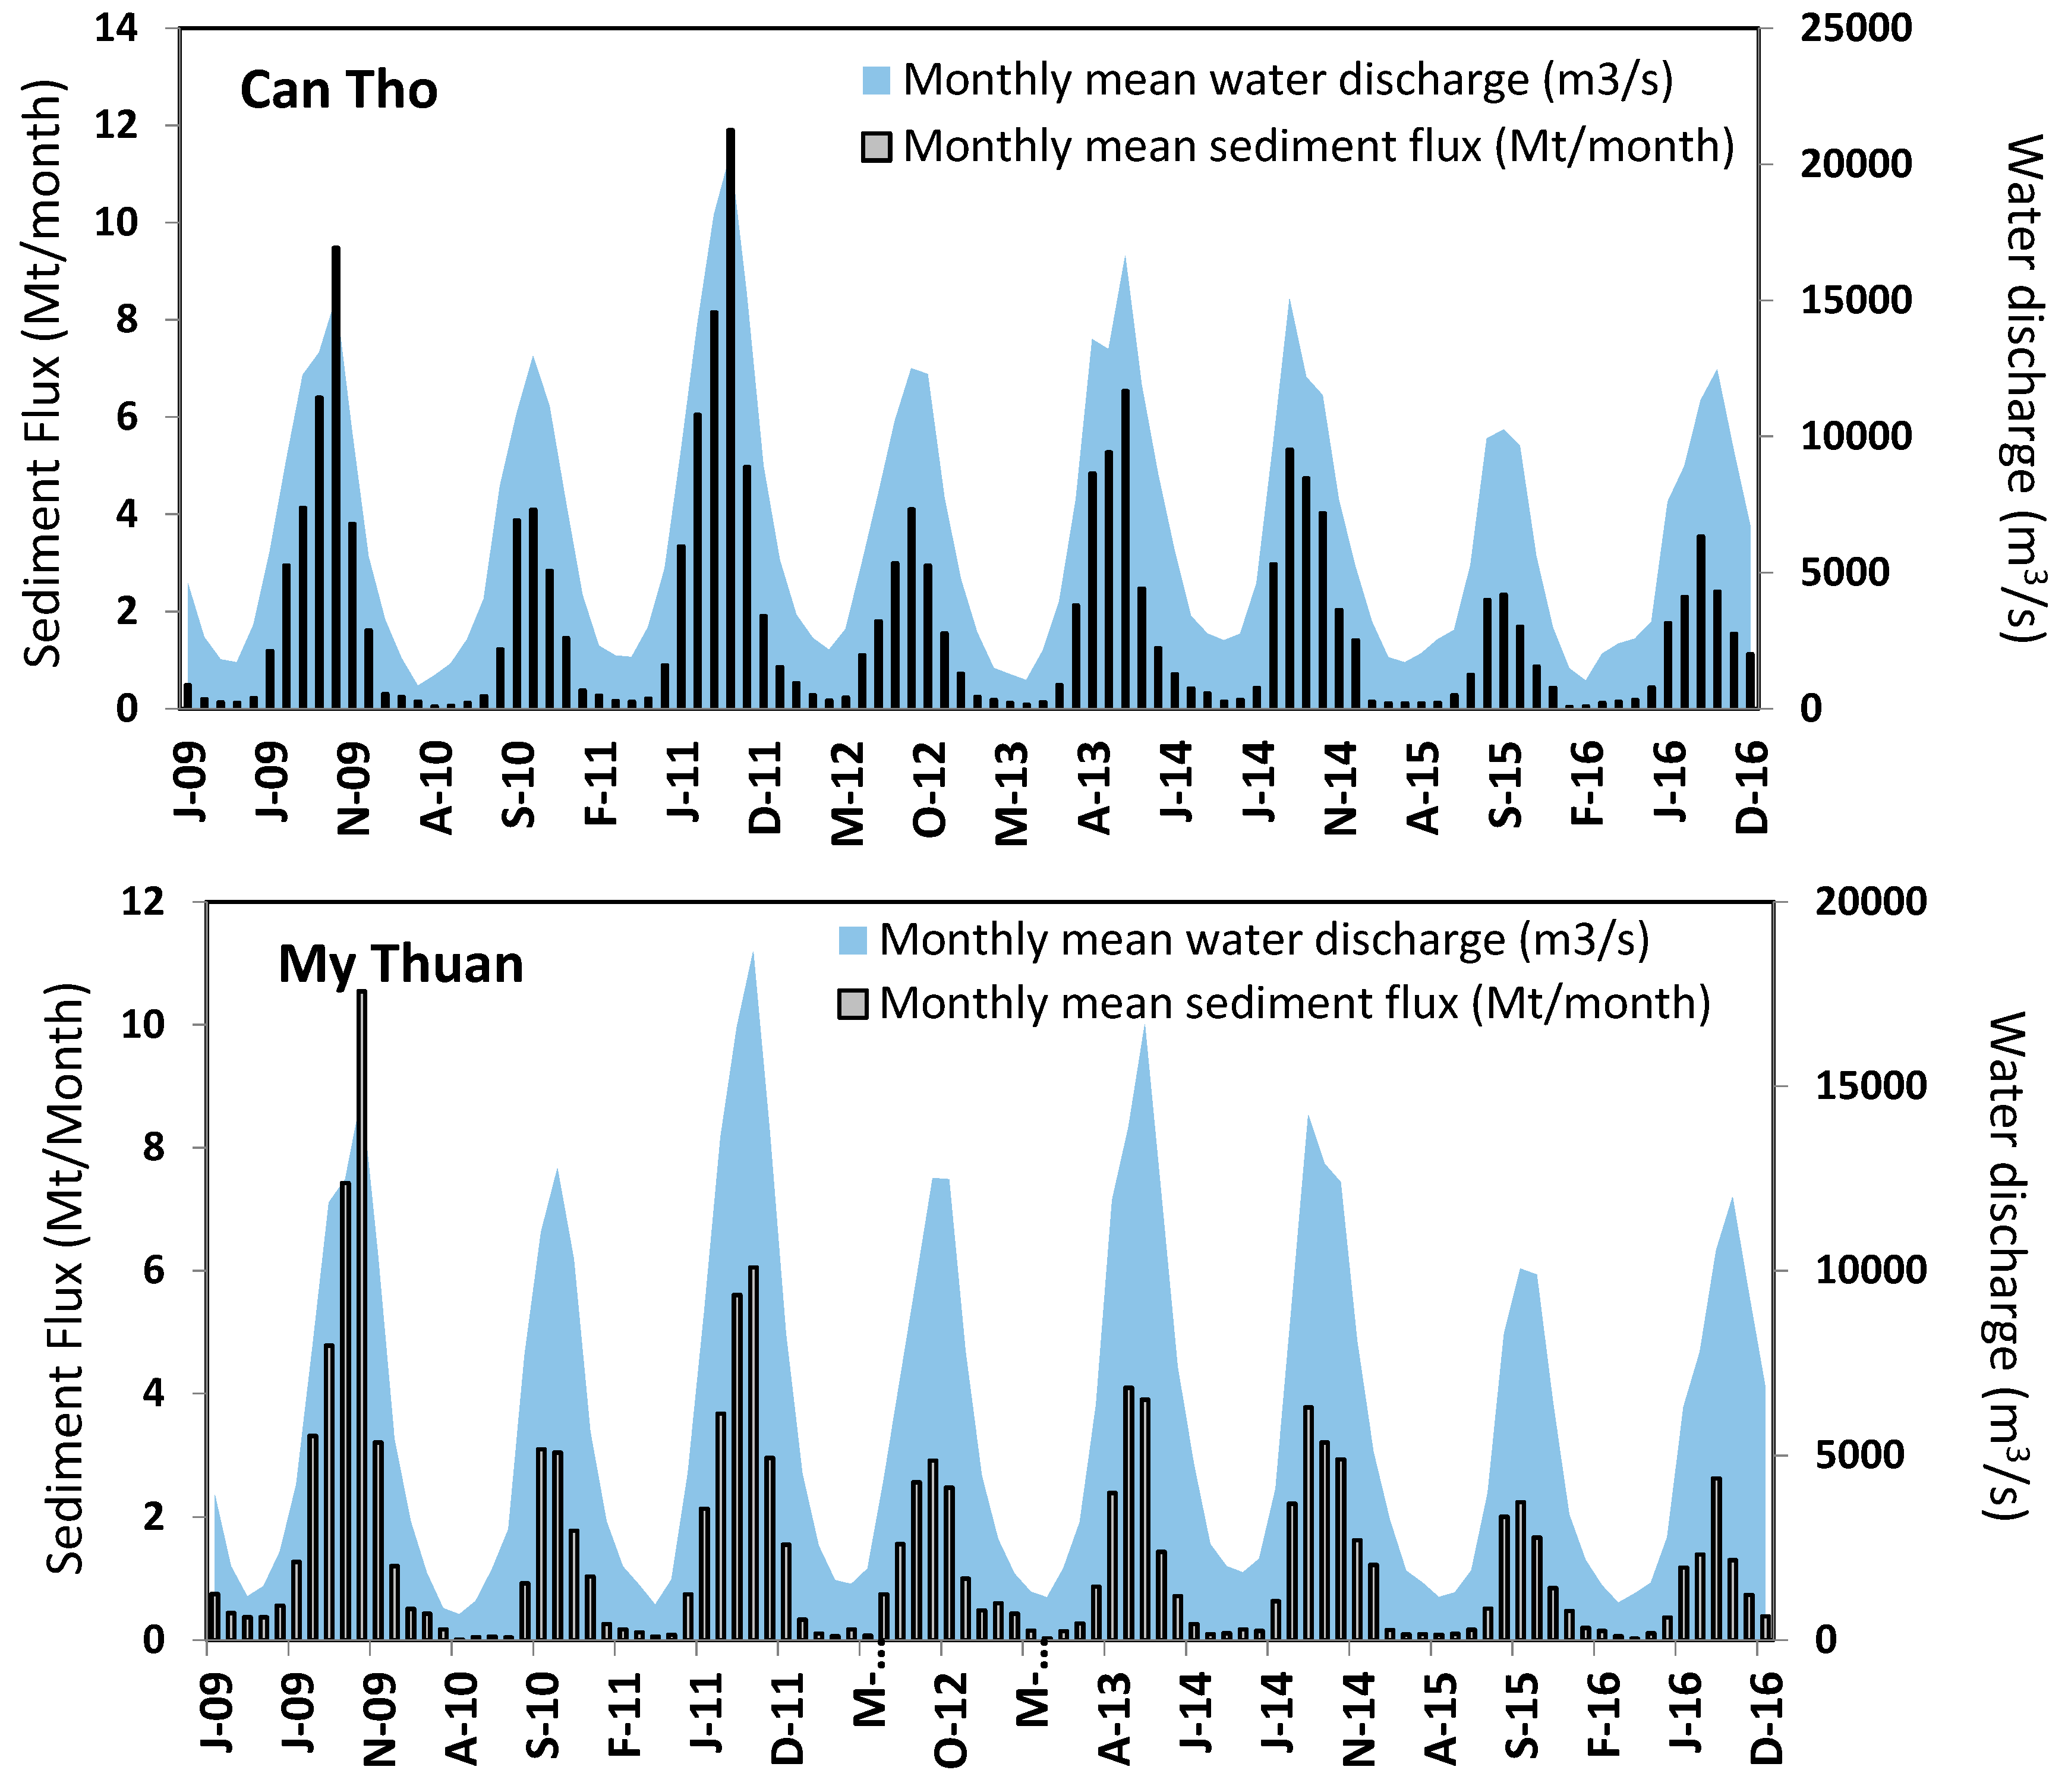
Monthly mean water discharges and suspended sediment fluxes of the Mekong River at Can Tho and My Thuan stations were calculated over the eight-year monitoring period (2009–2016) (Figure 2, Table 3). The hydrological variations at both gauging stations reflect the river’s response to seasonal rainfall and runoff: The dry season (November to April) is followed by a low flow season (January to June), whereas the rainy season (May to October) is characterized by high water discharges (July to November) (Figure 2, Table 3). Monthly mean water discharge in the Mekong River varied between 691 m3 s−1 to 18,647 m3 s−1 (temporal variation factor = 27) at Can Tho station, and between 834 m3 s−1 to 20,370 m3 s−1 (factor = 24) at My Thuan station. In the period 2009–2016, 82% of water discharge occured during the flood season (July–December) and 18% occurs in the low flow season (January–June) at Can Tho, the proportion being 79% and 21% at My Thuan. The discharge was the largest from August to October and the smallest in March–April (Table 3). The sediment supply occurred at 90% during the six-month flood period and 10% during the 6-month low flow period at Can Tho, the proportions being 92% and 8% at My Thuan at the same periods. In average for the lower Mekong, 80% of water discharge occurred during the flood season and 20% occurred in the low flow season, the proportion being 91% and 9% for the sediment supply.
The evolution of monthly mean sediment flux is very similar at both stations of the Mekong River, with high seasonal variations, which are constrained by the variability of water discharge (Figure 2). The monthly mean sediment flux ranged from 0.01 Mt month−1 (in April 2010) to 10.54 Mt month−1 (in October 2009); and from 0.04 Mt month−1 (in January 2016) to 11.9 Mt month−1 (in October 2011) at Can Tho and My Thuan stations, respectively.
3.2. Annual Average and Interannual Variations
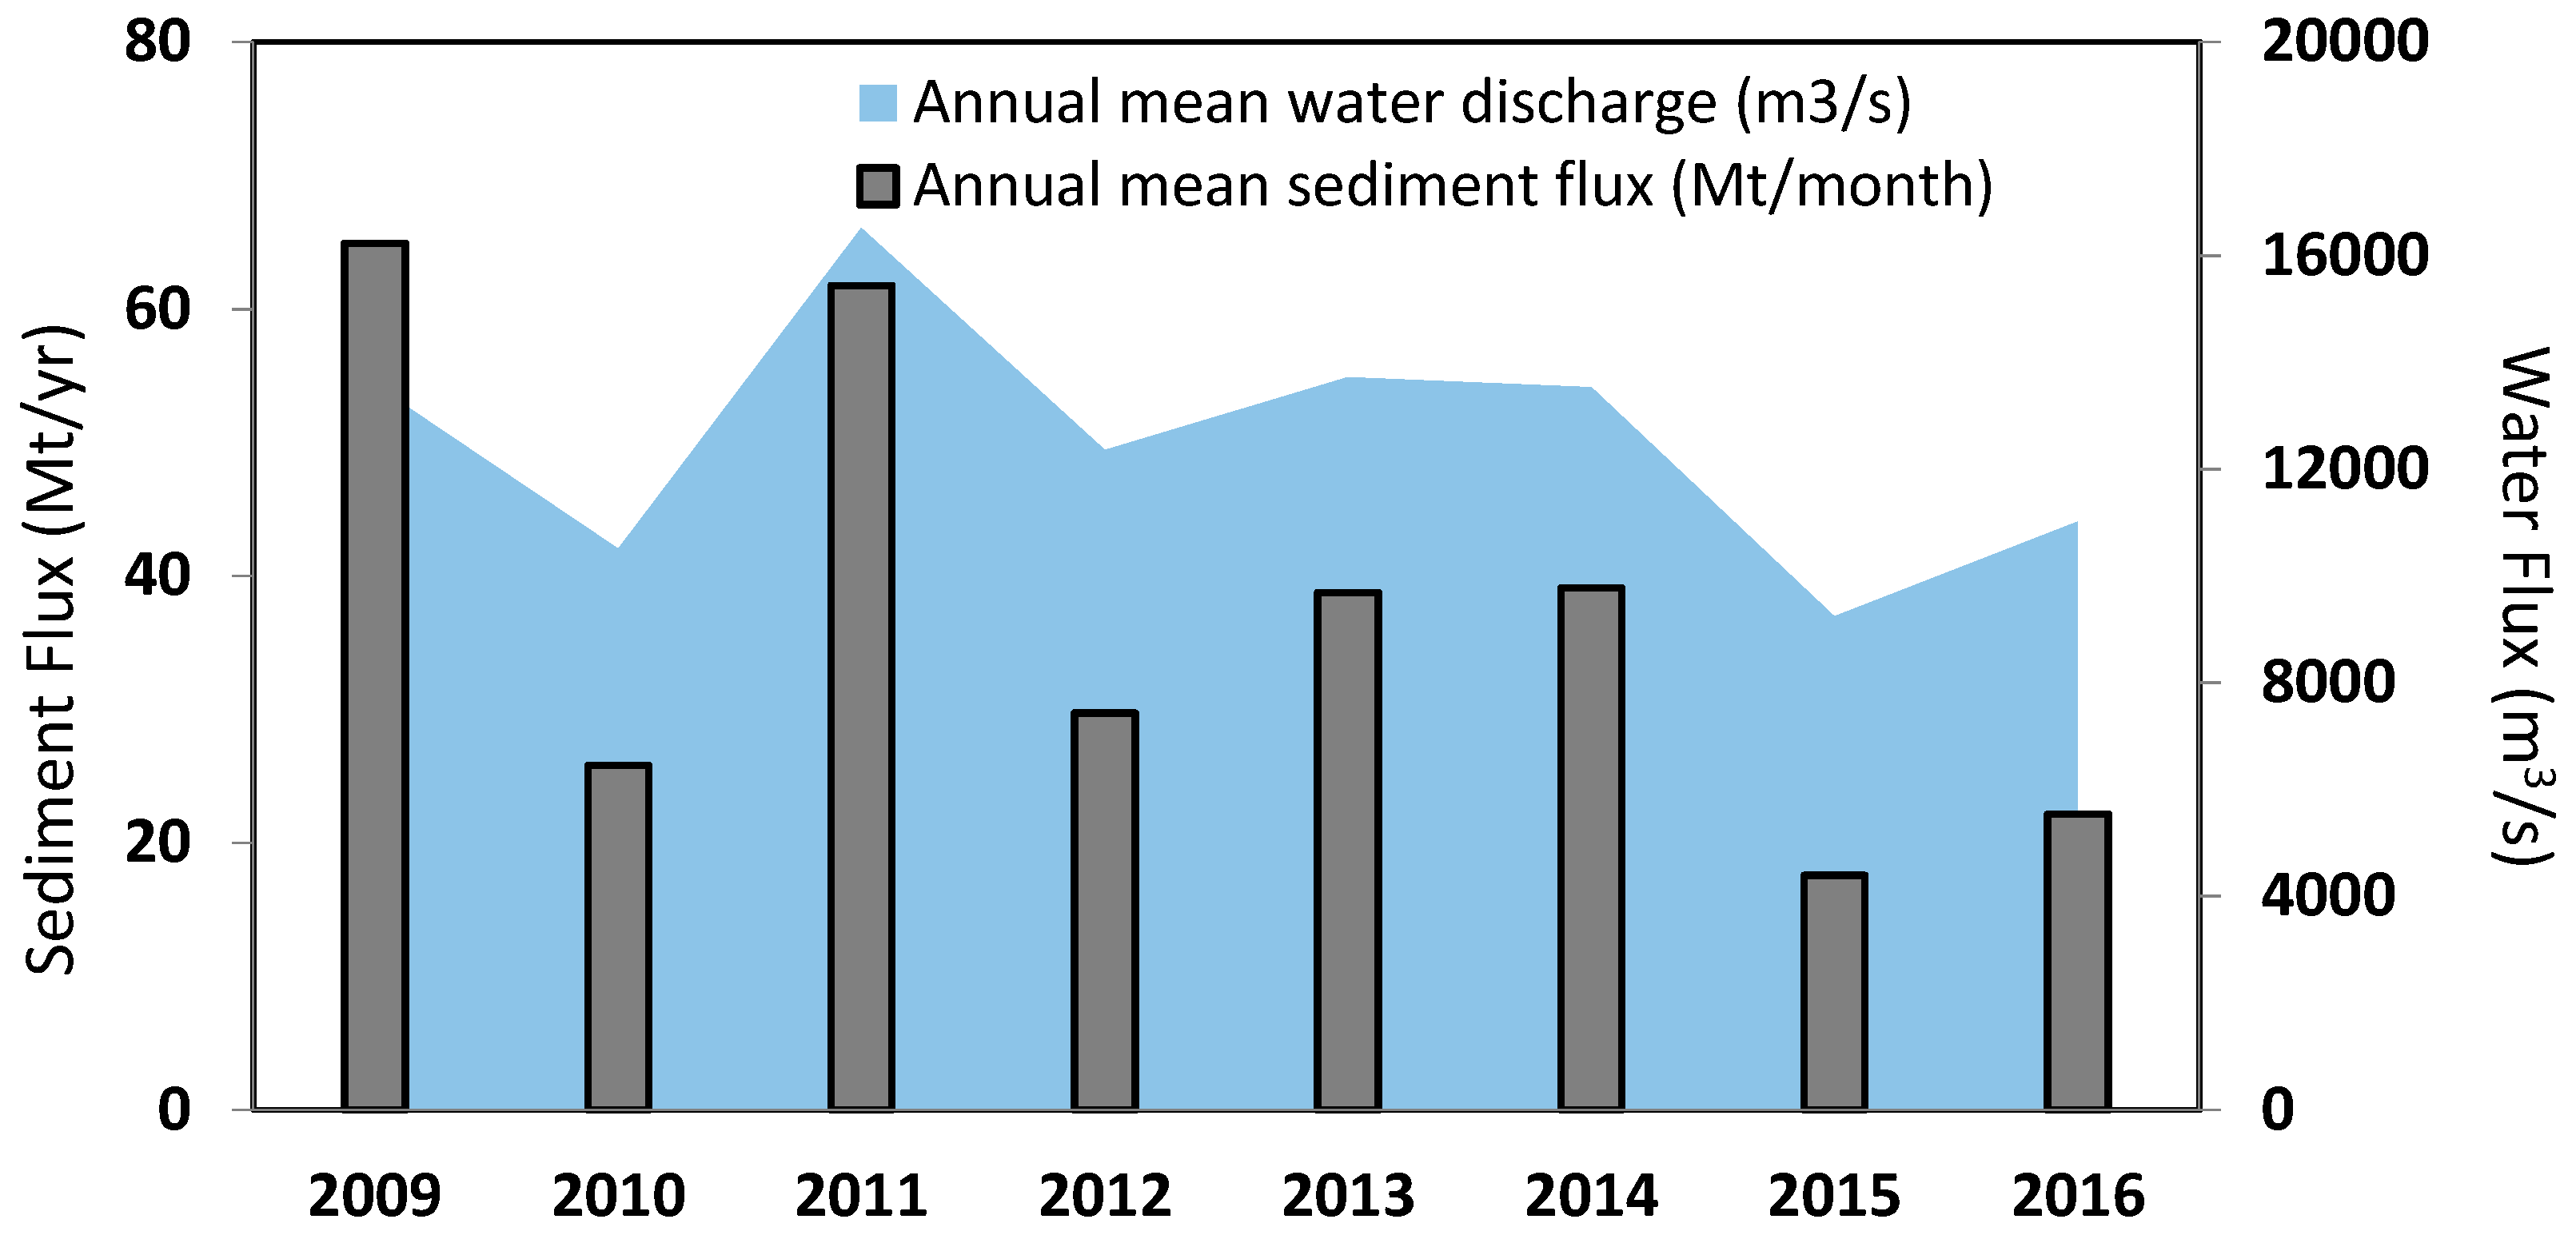
The annual water discharge and sediment flux of the Mekong River at Can Tho and My Thuan stations calculated from the database were compiled in Table 4, and the values for the whole Mekong River, estimated as the summation of the two contributes, are presented in Figure 3.
These results show the high temporal variations of annual sediment fluxes in the two main distributaries of the lower Mekong River (Table 4). The annual sediment fluxes ranged from 8.43 (in 2015) to 34.22 Mt yr−1 (in 2009) around the average value of 16.20 Mt yr−1 at the Can Tho station, with a coefficient of variation of 54%. For the My Thuan station, annual sediment fluxes ranged from 9.15 (in 2015) to 38.32 Mt yr−1 (in 2011) around the average value of 21.26 Mt yr−1, with a coefficient of variation of 42%.
Assuming that the sum of sediment fluxes at both Can Tho and My Thuan stations represents the sediment flux by the Mekong River to the lower delta, we observed that the sediment supply varied strongly between 17.6 and 64.9 Mt yr−1 (Figure 3) with an average value of 37.5 Mt yr−1 (CV = 47%) during the study period. This average sediment supply is slightly lower to these estimated at Chau Doc and Tan Chau stations (about 100 km upstream from Can Tho and My Thuan) of 44.6 Mt yr−1 by the National Centre for Hydro-Meteorology [73] based on daily measurement of water discharge and sediment concentration during the 2008–2016 period. The specific sediment yield of the whole Mekong River watershed was estimated for the same period at 47 t km−2 yr−1.
3.3. Trends in “In and Out” Fluxes in the Estuaries
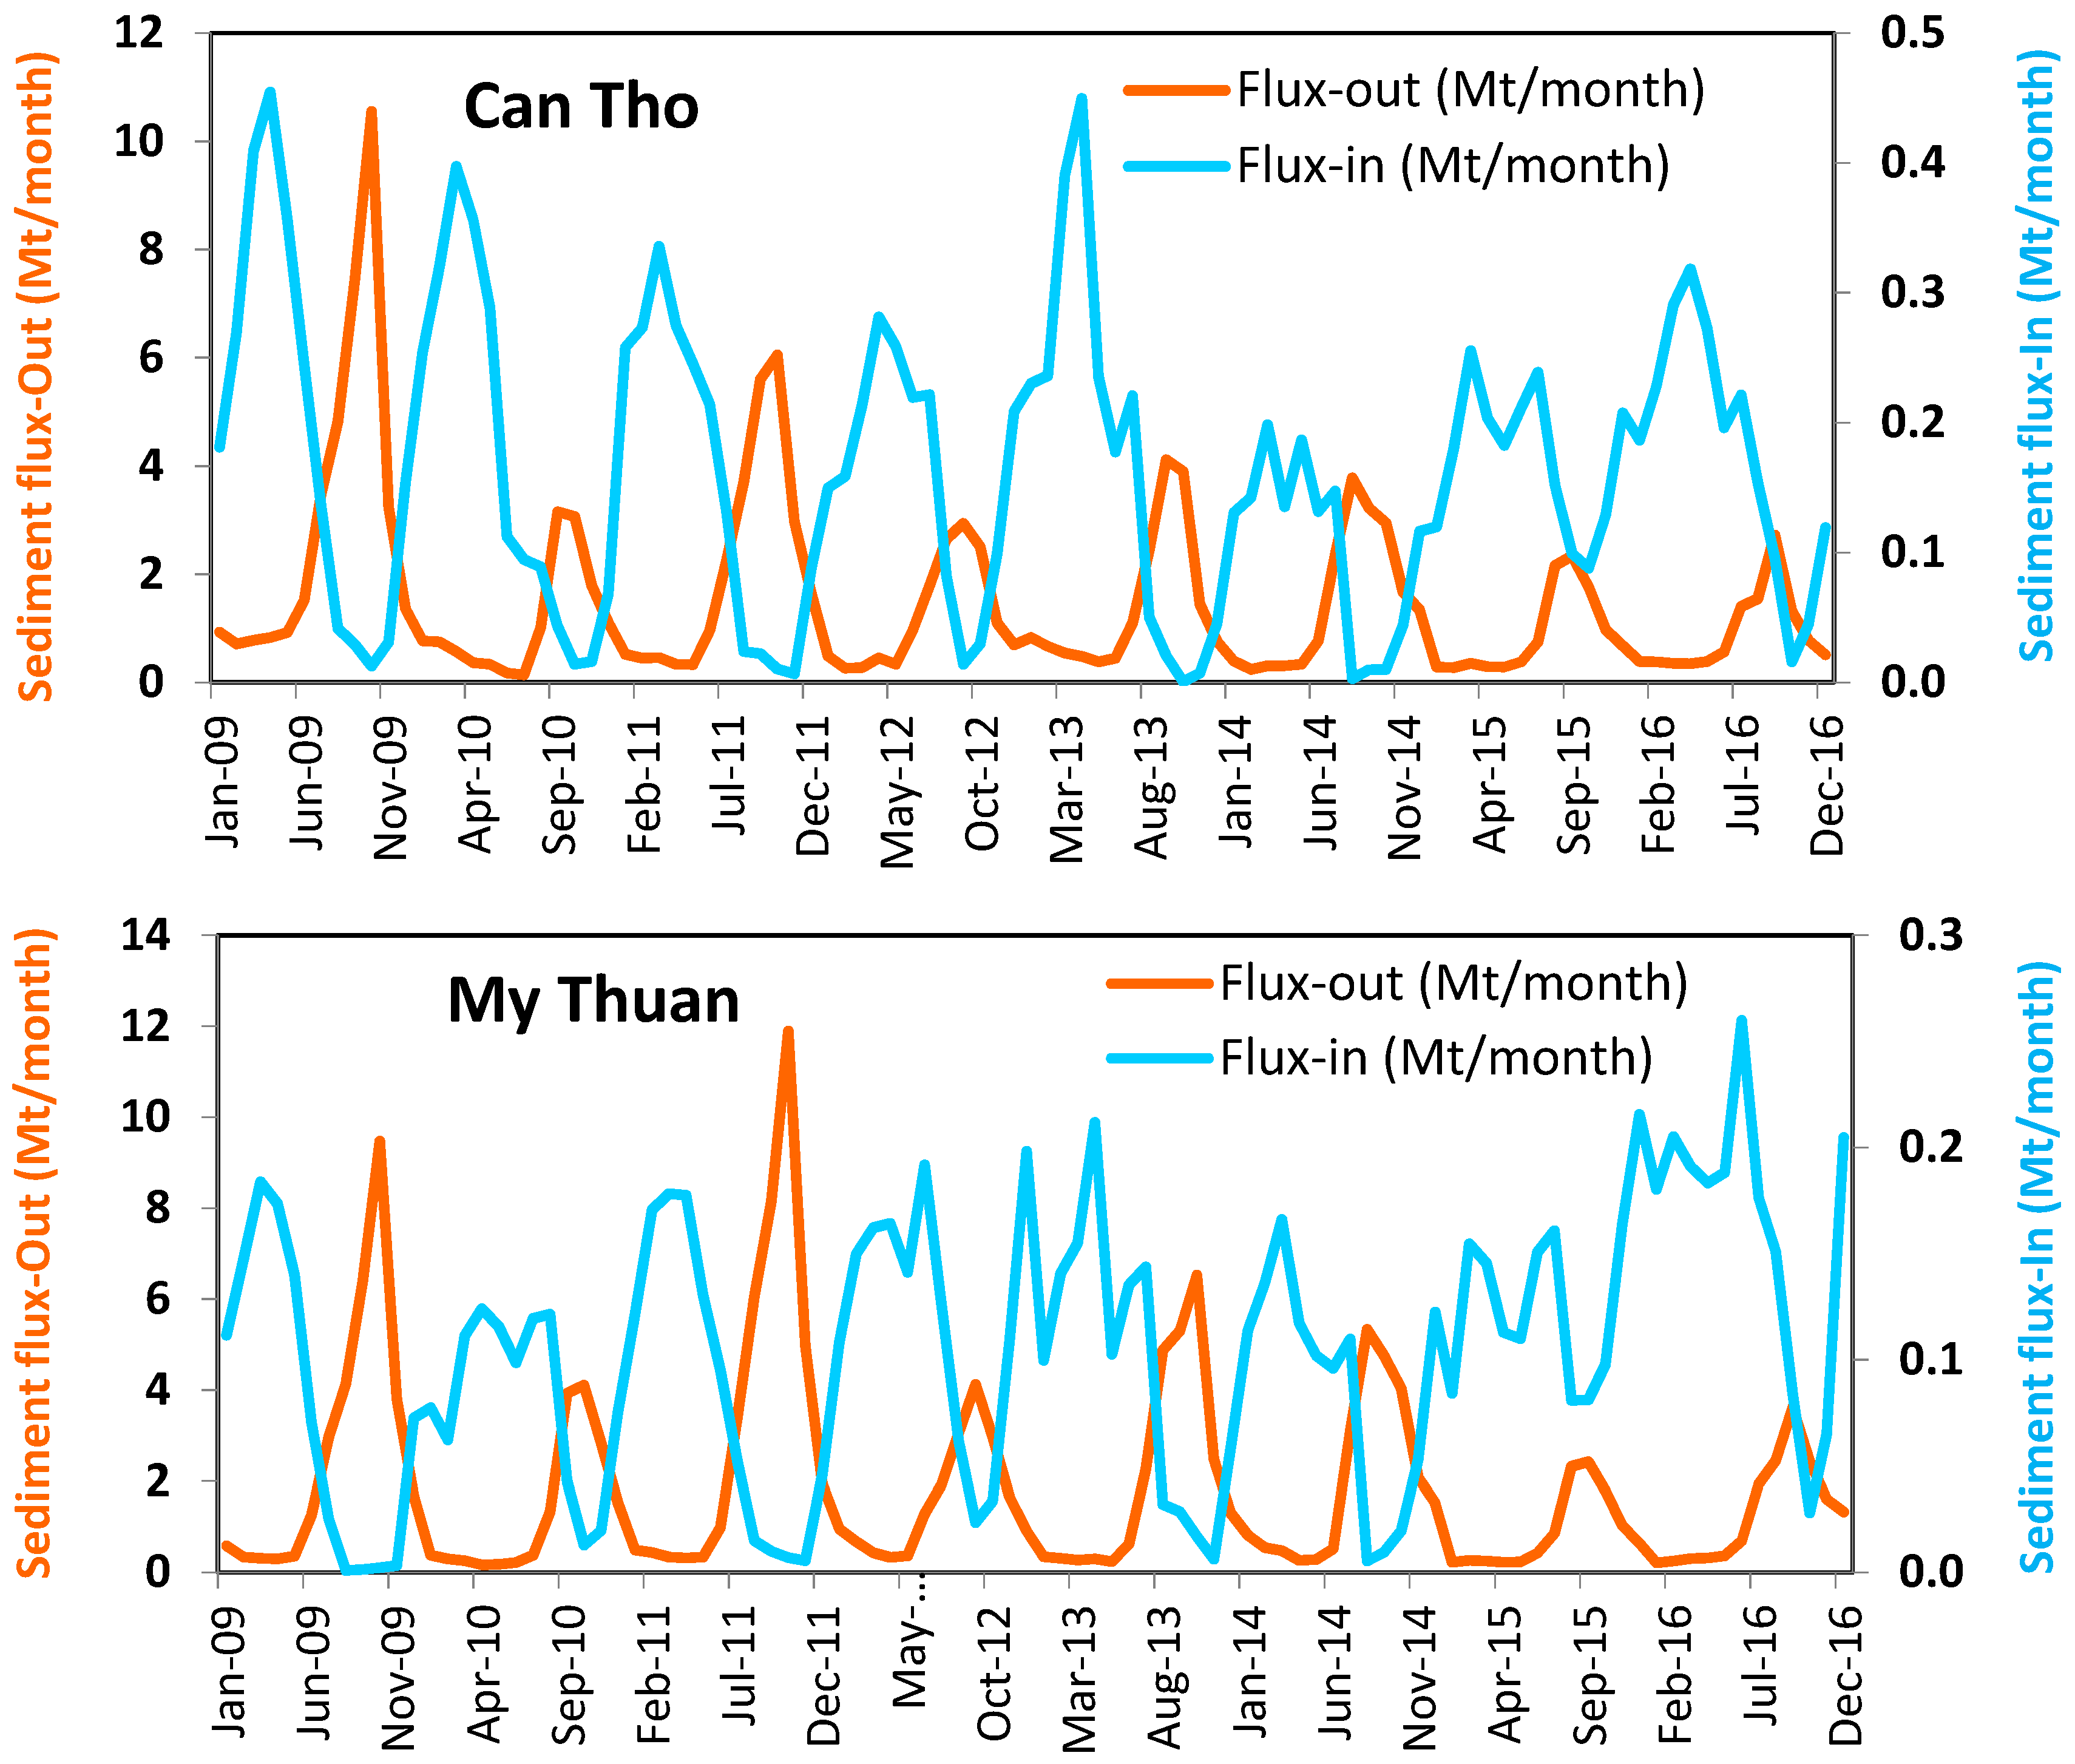
The benefit of regular measurements at each flood and ebb stages from 2009 to 2016 is to provide, for the first time, an estimate of both sediment fluxes flowing seaward and landward in the estuaries. The monthly and yearly values are presented in Figure 4 and Figure 5. We observed that the monthly evolution of sediment flux flowing seaward (flux-out) and landward (flux-in) at both stations experienced strong seasonal variations (Figure 4). At the Can Tho station, the monthly sediment flux-out ranged between 0.14 and 10.5 Mt month−1 (average value of 1.5 Mt month−1) with the highest value observed in rainy season. The highest values of sediment flux-in were observed in dry season with individual values varying from 0.01 to 0.45 Mt month−1 (average value of 0.16 Mt month−1). A similar evolution of sediment flux-in and -out was observed at the My Thuan station (Figure 4).
In addition, we noted that the seaward flux was, in average 18 times the landward flux at My Thuan (22.52 Mt yr−1 vs. 1.26 Mt yr−1) and 9 times the landward flux at Can Tho (18.16 Mt yr−1 vs. 1.96 Mt yr−1). The difference is likely due to the shortest distance between Can Tho and the mouth than from My Thuan to its mouth.
The trend to a decrease in the yearly flux flowing out (Figure 5) should be analyzed with care, since the study period encompassed an excess of discharge at the beginning of the study period with the La Niña event of 2010–2011, and ended with a deficit of discharge associated to the El Niño event of 2015–2016. The flux flowing landward, due to the tidal propagation, seemed to be not affected by the ENSO variation in Can Tho and slightly affected in My Thuan. The trend is almost nil at Can Tho, while a short increase in landward sediment flux was observed at My Thuan station (Figure 5). The difference in the trends between the two stations may be partly explained by other factors than El Niño, such as sand mining activities [66,67].
It may be useful for modeling purposes to provide the variations of average values of Ce and Cf at both stations at the monthly scale (Table 5). They show that SPM concentrations are generally higher at Can Tho than at My Thuan (both during ebb and flood tides) during the dry season, and that the reverse is true in wet season. The variations of Cf (CV = 35% at Can Tho, 51% at My Thuan) are smaller than these of Ce (49% and 65%, respectively). The variations of Ce and Cf are very small during the low flow season, at Can Tho from November to June (CV = 5% for Cf and 24.5% for Ce) and at My Thuan from January to May (CV = 6.7% for Cf and 16.6% for Ce). During the year, the monthly variations are more amplified at My Thuan (CV = 51% for Cf and 67% for Ce) than at Can Tho (CV = 35% and 49%, respectively).
4. Discussion
4.1. Data Collection
As before 2009, no regular accurate data on water discharge and sediment concentration was available on the lower Mekong River, the present results are important to document and improve our knowledge on the variability of hydrodynamics and suspended sediment transport in the Mekong estuary. However, two points may induce a bias or an uncertainty on sediment budget that we are not yet able to quantify: The use of filters of 8-μm porosity to retain the suspended material on the filter, and the use of only one value of suspended sediment concentration per tidal phase at each gauging station. Concerning the first point, filters of 8-μm porosity have been used since 2009 and the information on the kind of filter used before or upstream was not always documented. In the estuary, almost all suspended particles are present in the form of flocs with diameters bigger than 8 μm (see Gratiot et al. [79] on the Mekong River estuary, and Vinh et al. [80] on the Red River estuary—the neighbouring watershed). However, it remains possible that the use of filters of 8-μm porosity underestimates the total concentration of suspended matter; this may be the objective of a future analysis. More generally, we would like to warmly thank the Vietnamese authorities for their considerable effort in collecting these data and encourage them to give additional assessments on the values of sediment fluxes at each station in the future. Future data collection may also be inspired from feedbacks of long-term and continuous estuarine monitoring stations, which are still very scarce at global scale (e.g., [81,82,83,84]).
4.2. Factors Controlling Annual Sediment Transport in the Lower Mekong River
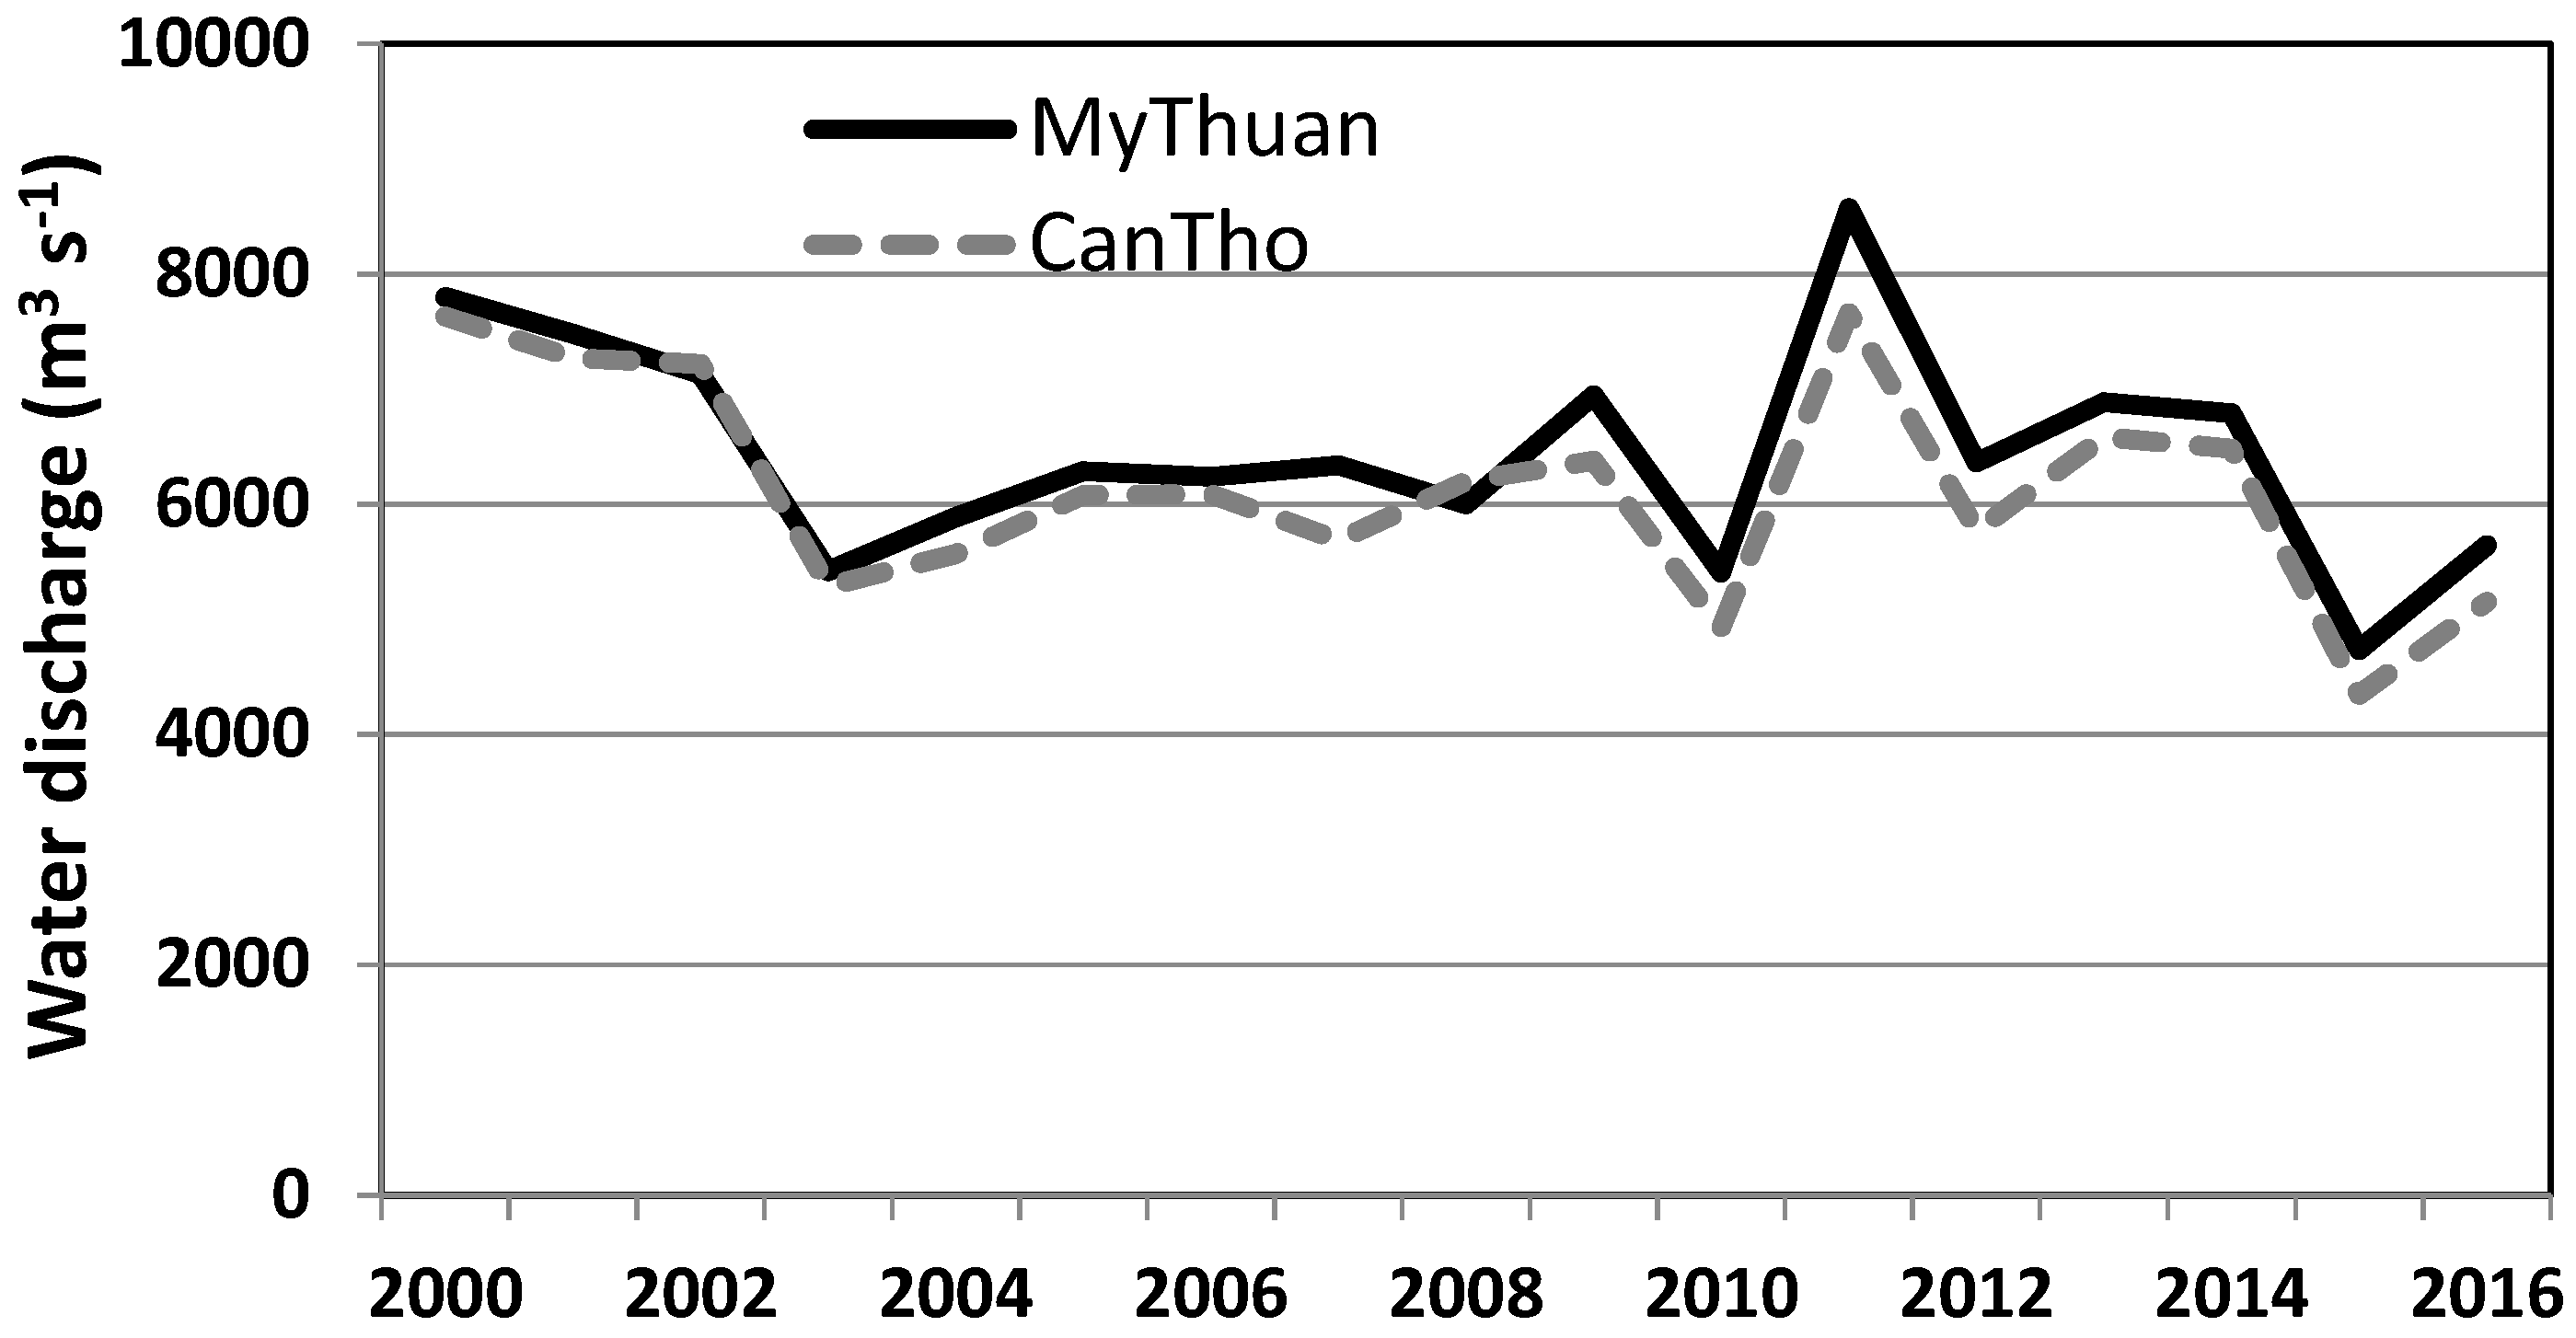
Merging our data set and data from [85] (Figure 6) enabled us to check that the maximum and minimum water discharges over 17 years (2000–2016) were observed in 2011 and 2015. Although eight years of regular observation (2009–2016) in water discharge and suspended sediment concentration are not considered as “long-term survey”, however, the dataset collected during this period covered a large range of forcing and hydrological conditions.
4.2.1. Hydrological Condition
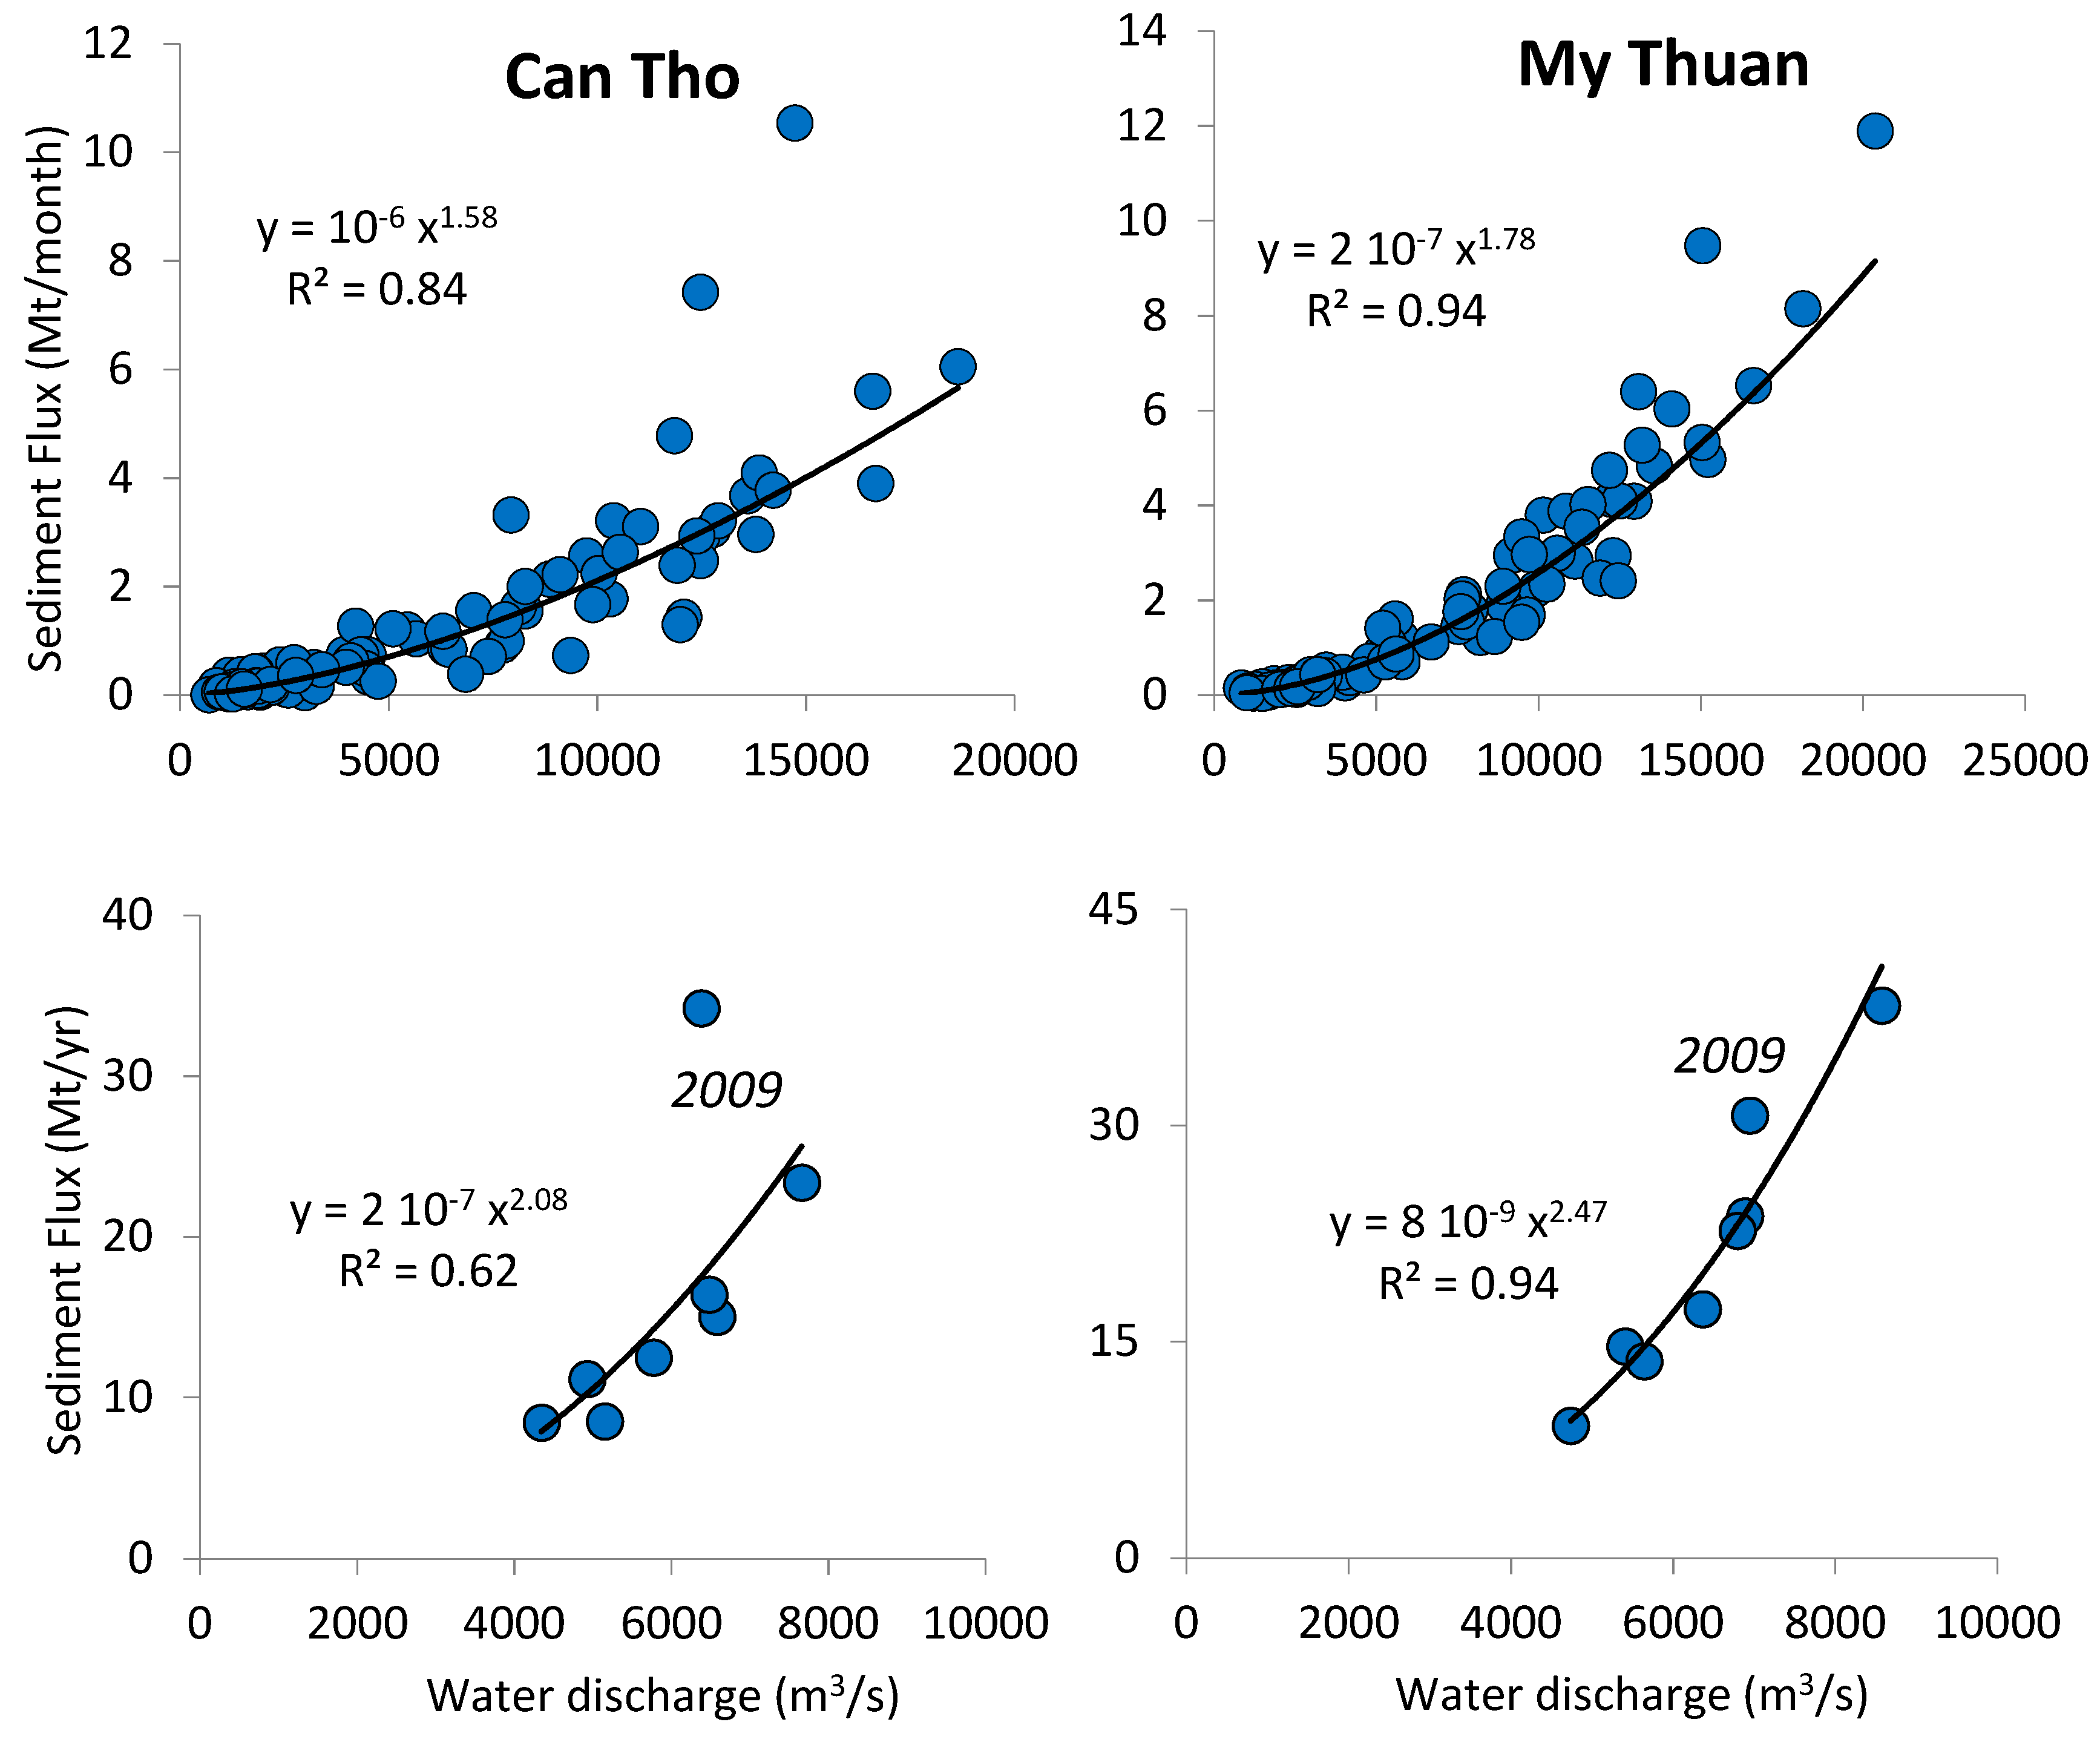
The temporal variability of annual sediment fluxes at both hydrological stations during the 2009–2016 period is strongly related to the hydrological conditions. Extreme values (highest and lowest) of annual sediment fluxes were coincident with extreme values of annual water discharge (except in 2009 at the Can Tho station, Table 4). To analyze more precisely the water-sediment relation, we plotted monthly/annual sediment flux against monthly/annual water discharge at Can Tho and My Thuan during 2009–2016 period (Figure 7). The co-variation of Q and Qs (with R2 ≥ 0.62) suggest that interannual hydrological variation plays an important role in sediment supply to the ocean by the Mekong River.
The year 2009 was marked by a high annual sediment flux at both hydrological stations and this high value may be explained by the remobilization of sediment stored within the river system during the previous years of low water discharge (Figure 6).
4.2.2. General Impact of ENSO on Water and Sediment Discharges
In our study period, one strong El Niño event occurred in 2015–2016 and one La Niña event occurred in 2010–2011. The analysis of correlations between ENSO indices and water and sediment supplies by the Mekong River was performed (Table 6). We considered running averaged values of Q and Qs over 1, 3 and 5 months, and running averaged SOI values over 1 and 3 months, then we calculated the correlation coefficients between series (Q vs. SOI, Qs vs. SOI) with different time lags. Correlation coefficients were systematically higher with SOI averaged over three months than over one month. The time lags providing the best correlations between Q or Qs and SOI were between seven and nine months. Higher lags (10 months or more) gave smaller correlations.
The results obtained suggested that if the interannual signal of water discharge in the lower Mekong River have been regulated by other factor (i.e., dams), water flux of the Mekong River seems to respond to ENSO with a 7–8 month lag (r = +0.337 and +0.343, with 7–8 month lags, respectively, Table 6), and sediment discharge with a 8–9 month lag (r = +0.511 and +0.521, with 8–9 month lags, respectively, Table 6). This result is in agreement with Fok et al. [61] who found a time-lag of six months between water levels and SOI during the El Niño event of 1991–1992 and of nine months during the strong El Niño event of 1997–1998.
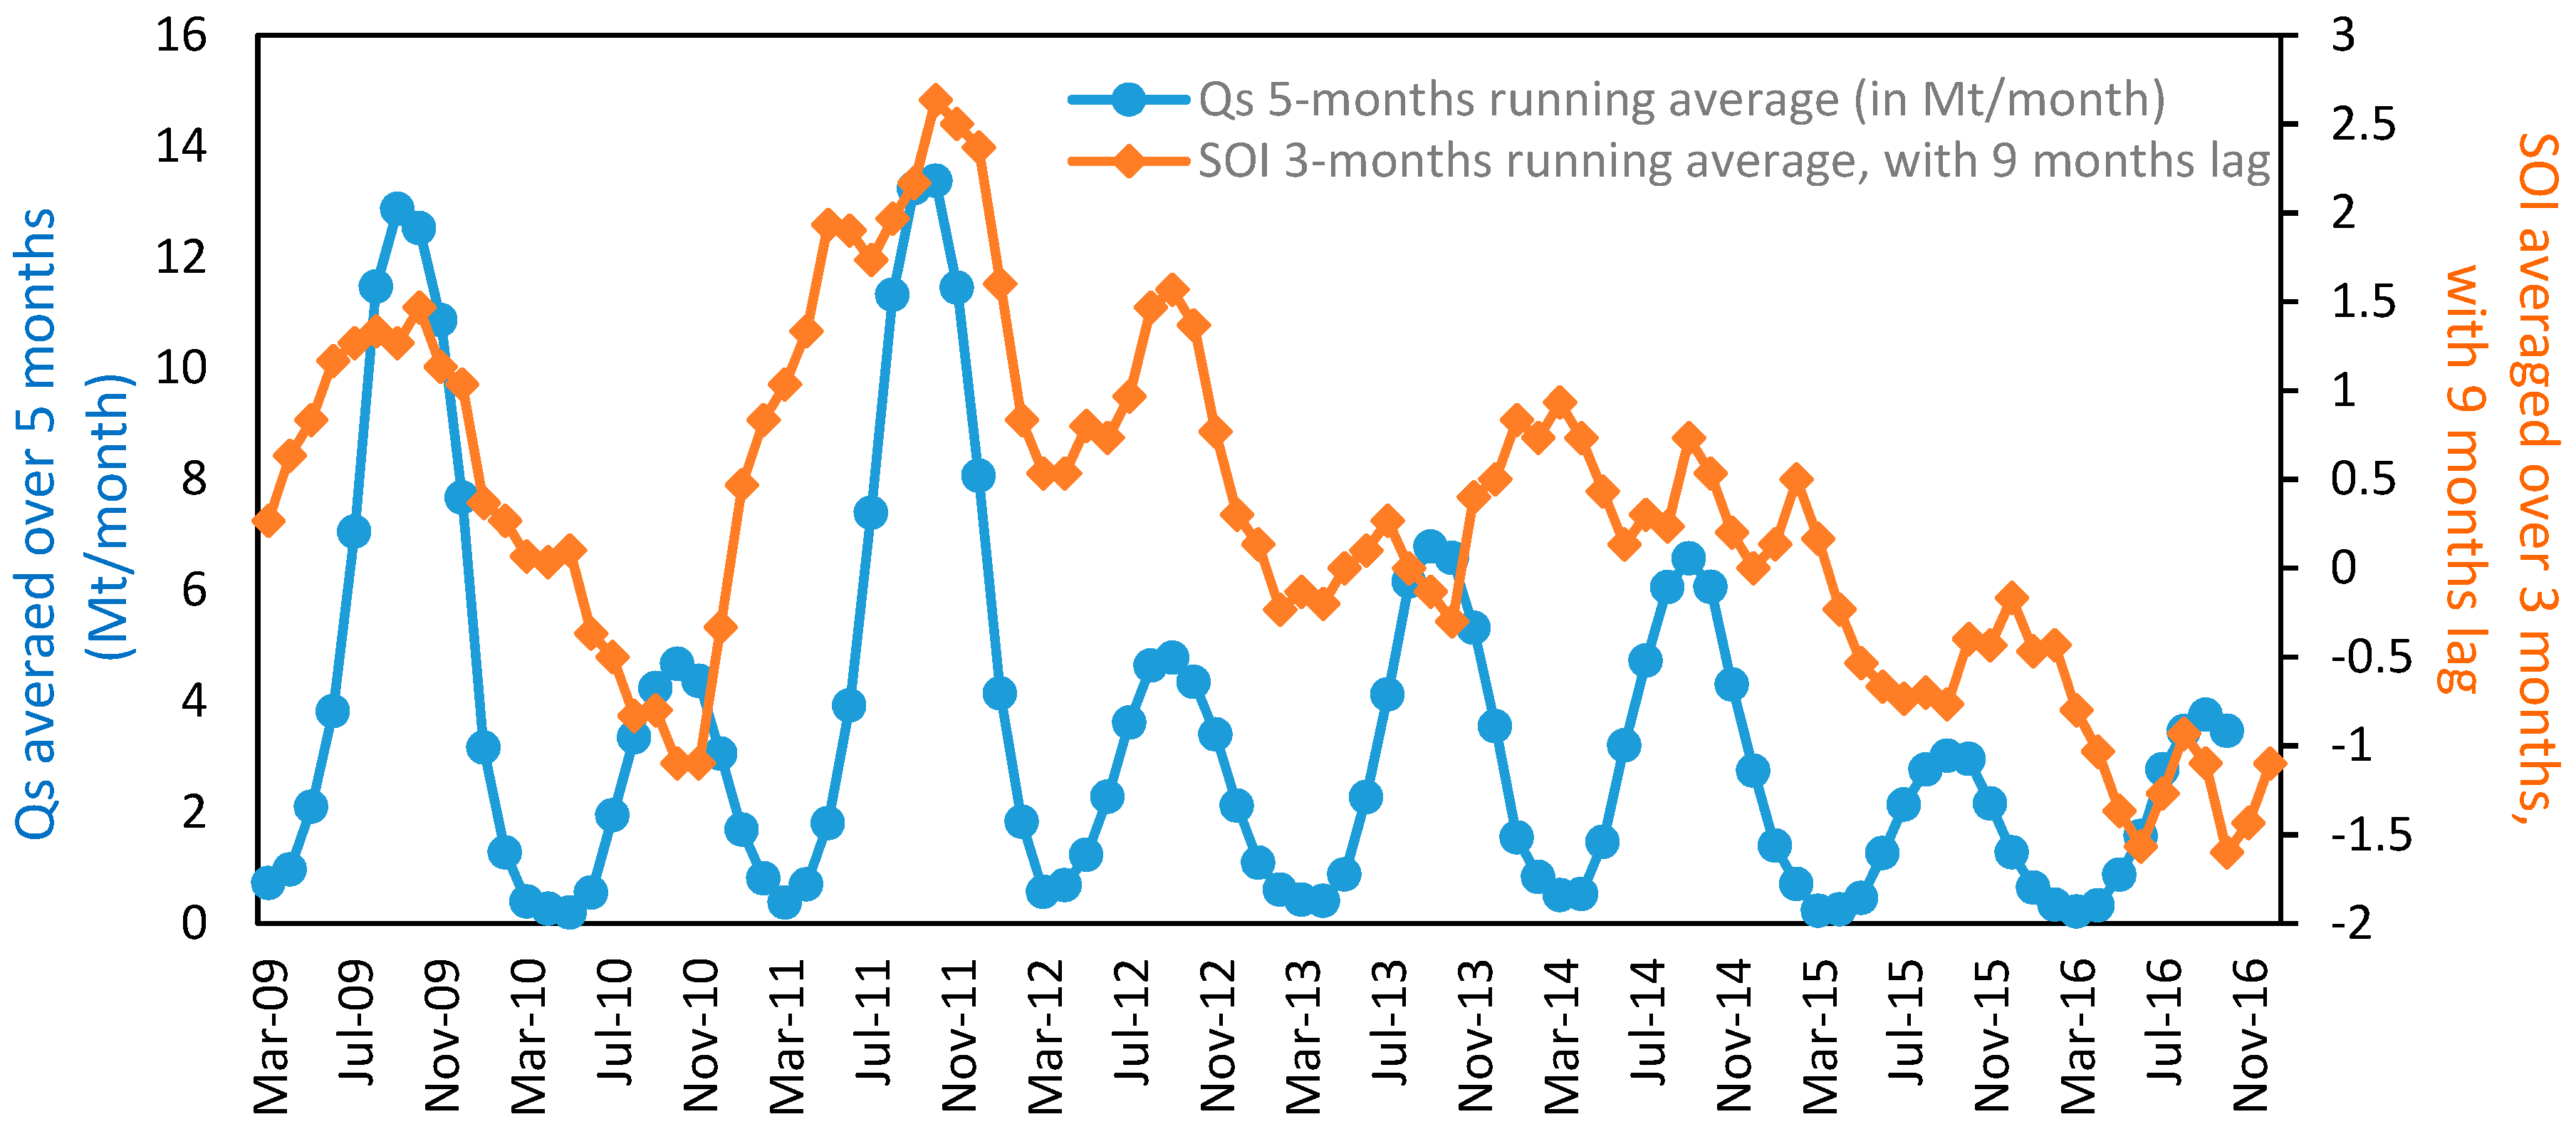
The correlation is positive, indicating that water and sediment supplies are reduced in El Niño phases (SOI < 0) and enhanced in La Niña phases (SOI > 0). The co-variations of Qs averaged over 5 months and SOI averaged over three months with a nine-month lag, is shown in Figure 8. We can check easily that the highest fluxes in 2009 and 2011 are consistent with positive SOI values nine months before (in particular between La Niña event of 2010–2011), and that the smallest fluxes of 2015 and 2016 are consistent with the strong El Niño of 2015–2016 which started to develop late 2014.
The resulting water discharge is now more regulated than before, and this regulation may explain the weakness of the correlation between Q and SOI at yearly scale. However the erosion (and thus the suspended sediment concentration) likely remain varying with the rainfall regime under the ENSO influence. This may explain the highest correlation coefficients obtained between Qs and SOI than between Q and SOI. The SPM concentration variation appeared to be more sensitive to the memory of ENSO than the water discharge, which is regulated by reservoir management.
4.2.3. Influences of ENSO on Seasonal and Annual Sediment Supply
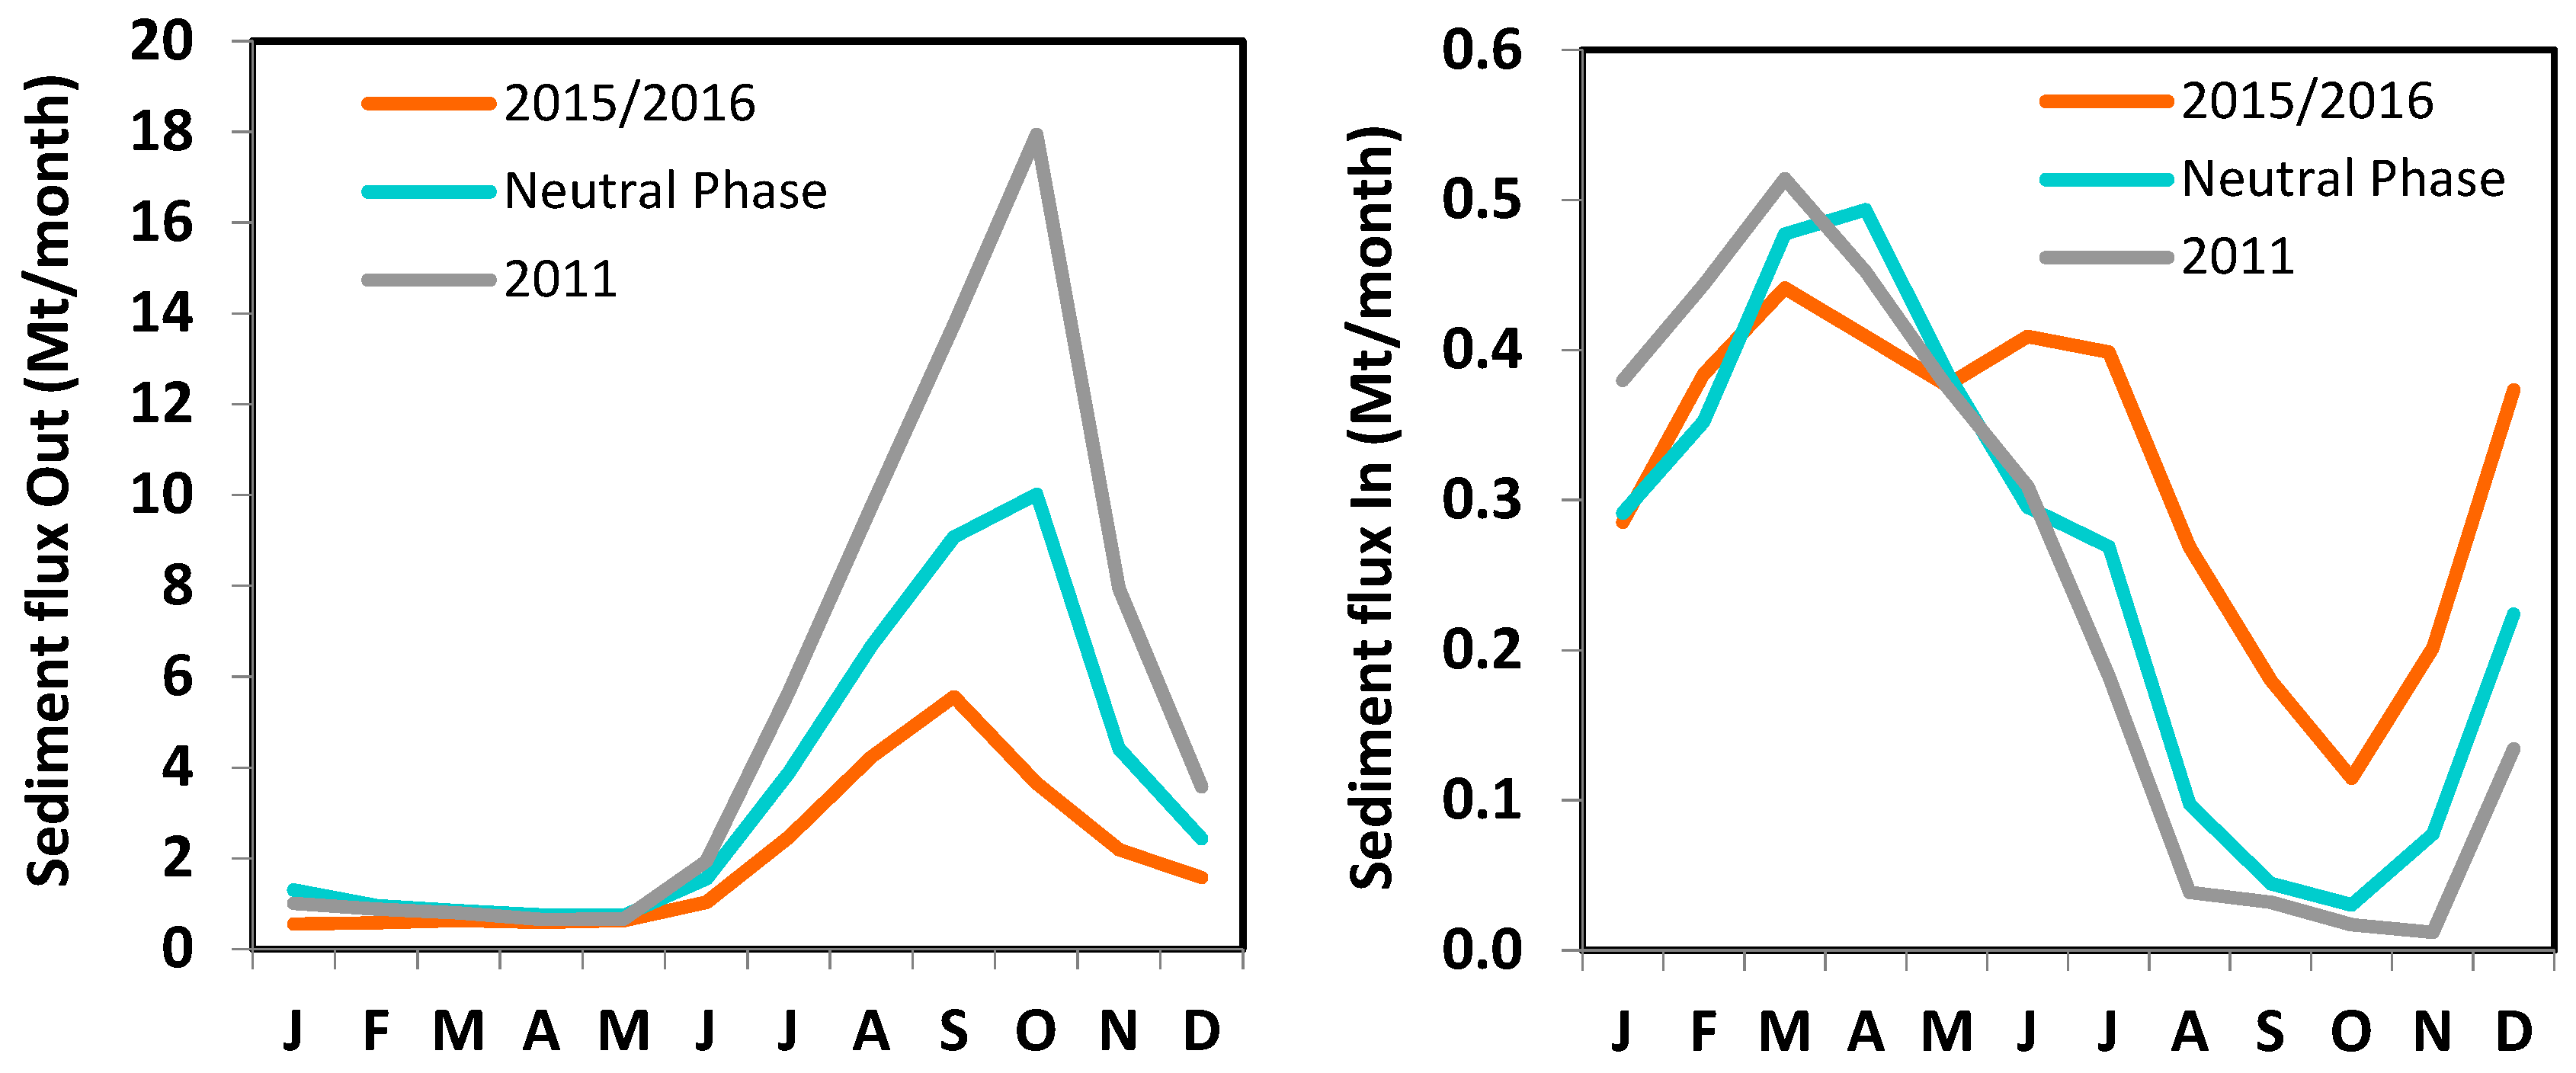
In order to assess the influence of ENSO on suspended sediment fluxes at monthly and annual scales, we compared the monthly and yearly values of 2011 (affected by the 2010 La Niña), 2015–2016 (affected by the strong 2015 El Niño), to the ones averaged over 2009–2010 and 2012–2014. The monthly values are presented in Figure 9, and the yearly averaged values, per period, for Q and Qs, are given in Table 7.
The influence of El Niño and La Niña on the monthly and yearly Q and Qs are very clear:
In 2011 (affected by La Niña of 2010), the flux of water flowing to the sea increased by ~22% and the flux of water entering in the estuaries decreased by more than 10%. Globally, the net seaward flux of water increased by 29.6%. The sediment supply by the river increased by ~51% and the sediment flux inland decreased by 15%, providing a net increase of sediment supply to the sea by 55.6%.
In 2015–2016 (affected by El Niño of 2015), the flux of water flowing to the sea decreased by ~10% and the flux of water entering in the estuaries increased by more than 34%. Globally, the net seaward flux of water decreased by 20.4%. The sediment supply by the river decreased by ~45% and the sediment flux inland increased by 26%, providing a net decrease of sediment supply to the sea by 50%.
The flux back to the estuaries evolves the opposite of the flux seaward. The effect of ENSO on the sediment fluxes (in and out) is mainly sensitive in flood season (Figure 9).
In conclusion, the water flux to the sea was 396 km3 yr−1 and the sediment supply to the sea was 39.65 Mt yr−1 in average over the neutral years. La Niña was seen to increase the water supply by almost 30% and the sediment supply by 55%. El Niño was seen to decrease the water supply by 20% and the sediment supply by 50%. The present water discharge of the Mekong River to the sea can be estimated to be 400 km3 yr−1, +/− 100 km3 yr−1 depending on ENSO, and the present sediment supply to the sea can be estimated to be 40 Mt yr−1, +/− 20 Mt yr −1 depending on ENSO.
The supply of freshwater estimated by Milliman and Meade in 1983 (475 km3 yr −1) [4] was in the range of the present discharges, slightly overestimated as compared to the present discharge in neutral years. The loss of 20% is likely related to the increased water storage capacity (and thus increased evaporation), and to the irrigation needs.
The average net water discharge was 12,550 m3 s−1 in neutral years. The maximum factor between monthly values was a factor of nine (between October during the flood period and the driest month of the February–April season) in neutral years, while it was 13 in La Niña period and seven during El Niño. These values may be compared to the values quoted in the literature of a 20-fold seasonal fluctuation from dry season (November–June) to wet (July–October) [86,87,88].
At least, the new dataset enabled to update the deliveries by each of the main distributaries. From the 2009–2016 measurements, the Tien River accounted for ~52% (51.8% in neutral years, 52.2% during El Niño and 52.8% during La Niña), and the Hau River for ~48% of the total Mekong River discharge, with small variations (of the order 1%) amongst the years. These values may be compared to former estimates: the Tien River accounted for nearly 58% of the total Mekong water discharge following Gugliotta et al. [50]. In terms of suspended sediment delivery to the sea, the Tien River accounted for a more variable portion of 55% in neutral years, 57.3% in 2015–2016 (El Niño) and 62% in 2011 (La Niña).
4.2.4. Looking for Breaking Points
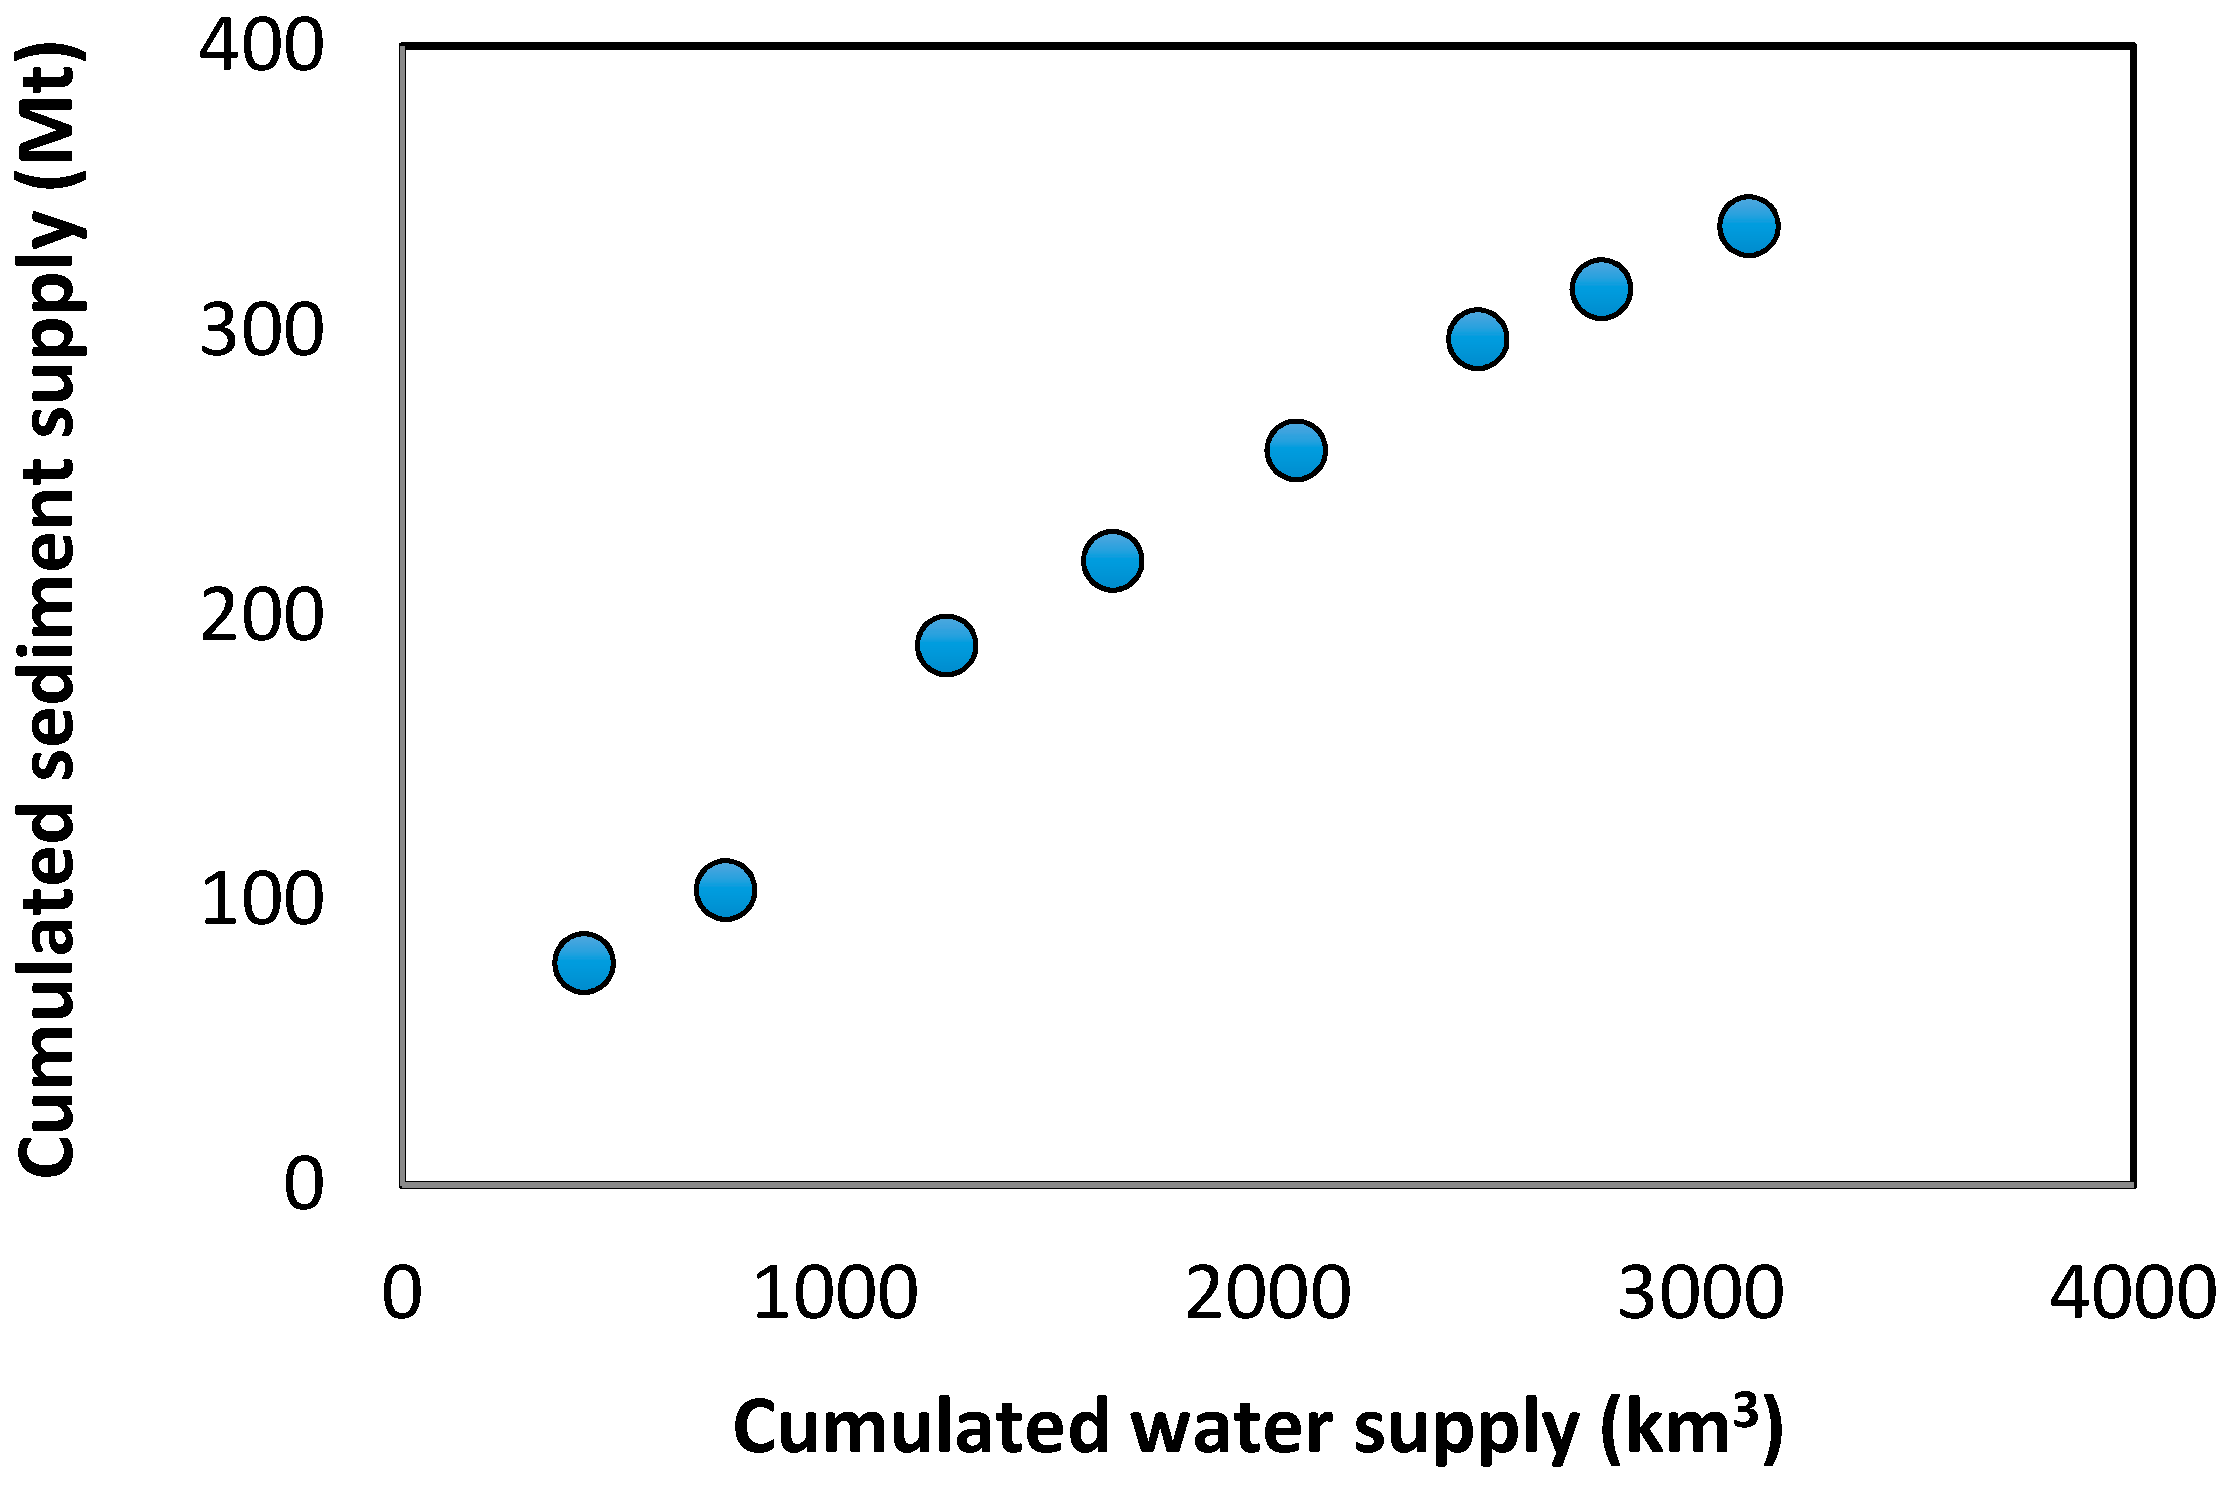
Many researches pointed out that the upstream Mekong developments such as the construction of dams has already led to significant trapping of sediment (up to 90% in the Manwan Dam, e.g., [36,47]). However, little information is available on impact of dams in the sediment flux in the lower Mekong River. The sediment flux loaded by the Mekong River to the ocean is still a big question, due to lack of long-term monitoring (before and after dam construction) and accurate database (e.g., daily/hourly measurement). During the study period, in the upper Mekong River basin, several big hydropower dams have been impounded (e.g., the Xiaowan Dam in 2010, the Jinghong Dam in 2011 and the Nuozhadu Dam in 2015; Table 2). In order to try identifying the impact of recent dams on sediment flux by the Mekong River to the estuary, the double-mass plot of annual sediment flux as a function of annual water volume for the Lower Mekong River during the 2009–2016 period was established (Figure 10). However, no inflection point was clearly observed. This result suggests that the sediment regime was not affected during the study period. However, the available data did not allow to analyze possible changes in the sediment regime before 2009.
Using this methodology, breaking points were analyzed in the upper or middle Mekong River in different studies (e.g., [41,57,64]). Wang et al. [64] demonstrated that the sediment load at station Mukdahan in Laos did not decrease after the completion of the Manwan Reservoir (in 1993), but instead increased by ~50%. Liu et al. [57] based on annual sediment flux at different stations along the Mekong River (from Gajiu to Pakse stations) during the 1965–2003 period showed that the construction of major dams on the headwaters in China appears to have little impact on the sediment load at stations of the Low Mekong River by the early 2000s. They observed an inflection point around 1992–1993 at the Gajiu station (just down the Manwan dam), right after its building. However, no or little impact was still noticed 400 km downstream in the early 2000s.
More recently, Nguyen et al. [41] based on monthly sediment concentration during the 1988–2010 period measured at Chau Doc/Tan Chau and Can Tho/My Thuan stations concluded that after 2002 (when the Dachaoshan reservoir completed), the sediment concentrations of the lower Mekong River slightly increased. The latter study assumed that this increase of sediment concentration may be explained by sand mining activity in the lower Mekong River basin. However, it is very important to underline that these results were based on low temporal resolution dataset (once per month). In order to evaluate precisely sediment trapping of new reservoirs, a long-term observation (>10 years) is needed. Moreover, despite sediment trapping is a logical consequence of water impoundments and a long-term reduction in sediment availability downstream a dam is to be expected, the actual effects on the river system depend on a number of local and global factors taking place at different time scale, so that it is difficult to derive general and immediate correlations [89].
The only conclusion from the recent database is that we did not observe any breaking points between 2009 and 2016. However, it is not informative of any variations before, especially in the 2000s. Let us remember that Loisel et al. [58] showed that, from the full archives of MERIS data over the 2003–2012 period (~2000 satellite images), a very clear and regular decrease of suspended sediment concentration was observed along the Mekong delta coastal waters between 10 and 20 m depth. This decrease (of the order of −5% per year), accentuated in the wet season as compared to the dry season, was such that the difference between suspended sediment concentrations in dry and wet season kept going smaller so as to become almost equal in 2011. In another study of the shoreline change based on a 43-year Landsat image database (1973–2015), Li et al. [42] showed that the 600-km of coasts shifted from mainly accreted (at 68% between 1973 and 1988) to mainly eroded (at 56%, during 2005–2015). While most of the shorelines was in accretion until 2005, most has become eroded after 2005. Currently, 66% of the delta is under erosion, and the Mekong Delta has undergone a shift from growth to shrinkage since 2005 [42].
4.3. Spatial and Temporal Variation of Annual Sediment Flux in the Mekong River
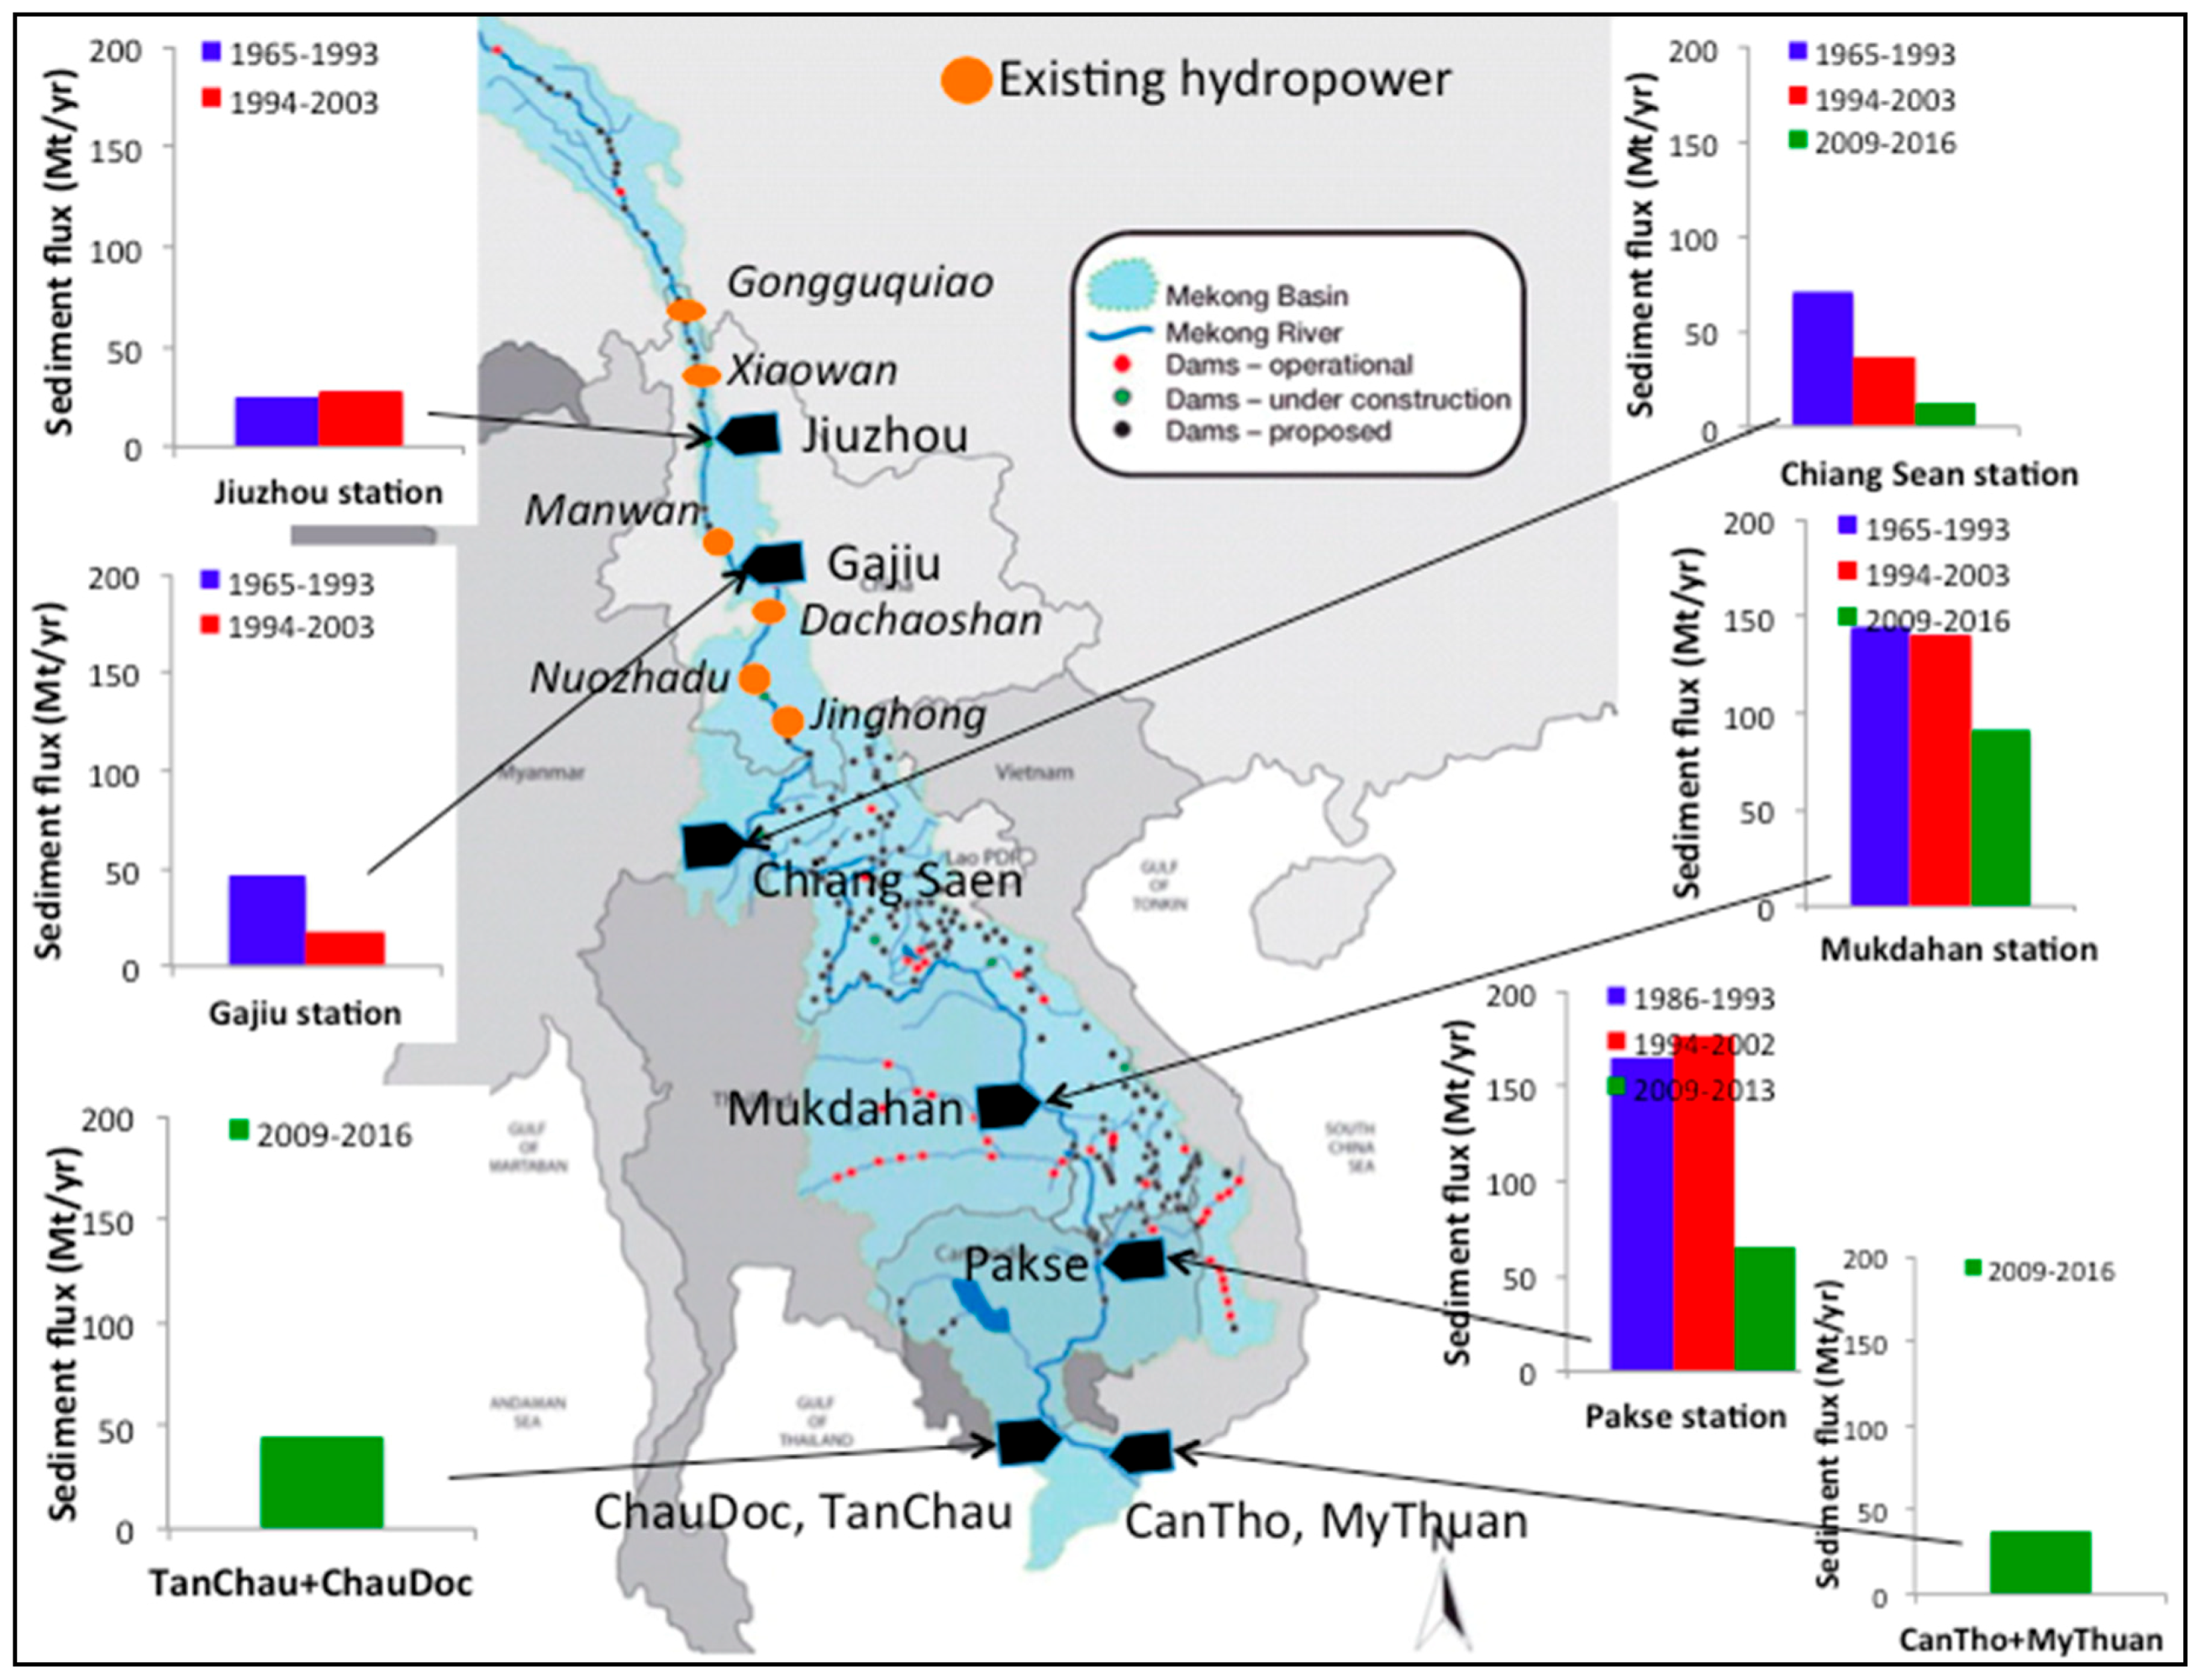
In order to analyze the spatio-temporal variation of sediment flux to the sea of the Mekong River over longer timescales, we merged our observational database and data extracted from previously published articles and reports: Annual data at Jiushou and Gajiu stations in the upper Mekong River during the 1965–2003 period were extracted from Fu and He [90], Fu et al. [47]; annual sediment loads in the middle-lower Mekong River (at Chiang Saen, Mukdahan and Pakse stations) came from the reports of the Mekong River Commission (during 1961–2002 and 2009–2013). In addition, we extracted annual sediment flux during the 2009–2016 period at Tan Chau and Chau Doc stations from the reports of the National Centre for Hydro-Meteorology in Vietnam. Moreover, the historical annual sediment flux load by the Mekong River to the ocean by Milliman and Syvitski [5] and Roberts [56] were used to compare with present sediment flux. Results are reported in Table 8 and Figure 11.
Table 8 and Figure 11 show that the annual sediment flux load by the Mekong River has a strong and complex temporal/spatial variation. Qs increases from upstream to Pakse under the influences of tributaries, then decreasing values were measured from Pakse to the sea. From Pakse to the sea, a large portion of the sediment flux is deposited where the slope becomes mild [18], and/or due to water irrigation.
At the Jiuzhou station, located 269 km upstream from the Manwan reservoir, the annual sediment flux during pre- and post-dam operation was relatively stable. In contrast, the sediment load at the Gajiu station, 2 km downstream from the reservoir, decreased to one-third of the pre-dam period. At the Chiang Sean station, the annual sediment flux has decreased from the 1960s on. The sediment load seemed to be not affected from Mukdahan to Pakse, during the 10 years after completion of the Manwan Reservoir. The slight increase of sediment flux at Pakse between 1986–2002 and 2009–2013 was likely related to land-use change and intensification of human disturbance in the lower Mekong basin during at last 20 years (e.g., [18]) and/or river bed-bank erosion due to imbalance between sediment transport and sediment trapped in the reservoir [41].
During the 2009–2016 period, the annual sediment flux transported from the middle to lower Mekong River has dramatically decreased in comparison with previous periods, while the annual water discharge during this period slightly increased. The sediment flux measured at Chiang Sean, Mudkahan and Pakse stations during the 2009–2013 period decreased by 65%, 35% and 62% as compared to 1993–2003. During 2002–2016, various big to medium dams were constructed in the main stream of upper Mekong River, including the Dachaoshan dam in 2002, the Xiawan Dam in 2012, the Jinghong Dam in 2013 and the Nuozhadu Dam in 2016 (Table 2). Although there is lack of continuous data (and in particular no data from 2003 to 2008), the marked reduction in sediment load in the Mekong River during 2009–2013 likely reflects sediment trapping. The available information derived from satellite data showed a decrease in surface SPM concentrations along the prodelta at a rate of ~5% per year during 10 years, in agreement with the decrease by 62% of Qs at Pakse between 1994–2003 and 2009–2016.
Other causes of sediment reduction than reservoirs may be raised, related to the land use changes (LUC), in particular to the reforestation and soil-conservation in the upper and middle Mekong River basin. Indeed, the Chinese Government launched a reforestation and soil conservation program in the Mekong River basin from 2000s, with the objective of watershed protection [57]. The effect of reforestation programs on the sediment transport in the Mekong downstream of the existing mainstream dams is unknown but may have further reduced the sediment flux from bank erosion and landslides (e.g., [34,57]). Thus, in order to deeply analyze the impacts of the dams on the suspended sediment fluxes, the impact of reforestation in the upper basin needs to be assessed.
Finally, the present sediment supply by the Mekong River to the ocean was estimated to be 40 Mt yr−1, and can vary by +50% due to La Niña event or −50% due to El Niño event. The average value is a quarter of estimates (145–160 Mt yr−1) established before the 1980s [5,56,57] (Table 4). Although the sediment flux estimated by Milliman and Syvitski [5], Roberts [56] and Liu et al. [57] were based on limited dataset in terms of spatial coverage, temporal resolution and sampling frequency, the drastic reduction of sediment load to the ocean by the Mekong River in recent years likely results from important anthropogenic activities such as new dam construction and LUC.
5. Conclusions
A new dataset is available on flow and sediment discharge in the lower Mekong from 2009 on. This is the first dataset based on regular measurements, at high temporal resolution (hourly for discharge, twice daily measurements for sediment concentration). Even if the representability of two sediment samples for the ebb and flow periods is questionable, these measurements are fully informative and bring fresh insights to the scientific community and to the river basin authorities.
Based on high temporal resolution of water discharge and suspended sediment concentration at Can Tho and My Thuan stations during the 2009–2016 period, we observed that the annual sediment supplies by the Mekong strongly varied, in close dependence to the hydrological conditions. Considering that the total sediment flux of both (Can Tho and My Thuan) stations represents the suspended sediment supply by the Mekong River to the South China Sea, we estimated the actual annual suspended sediment supply to be now 40 Mt yr−1 in neutral years (+/− 20 Mt yr−1 following ENSO), corresponding to a specific sediment yield of 50 +/−25 t km−2 yr−1. This value is much lower than that estimated by Milliman and Syvitski [5] and Roberts [56] (~160 Mt yr−1) or by Liu et al. [57] (~145 Mt yr−1) during previous periods, before 2003. The strong influence of ENSO can be underline. It is more important on the sediment concentration C or flux Qs than on the water discharge Q, likely because of the water regulation along the Mekong River.
Merging our database with those of the literature, we observed that sediment from upstream of the Mekong River are largely trapped within the dam/reservoirs (e.g., Manwan and Dachaoshan) from decades, and that the lower Mekong was not significantly affected before 2002–2003. Sediment load in the lower Mekong basin and sediment supply to the sea started to be significantly affected during the 2000s by various anthropogenic activities such as dams, sand mining, reforestation and soil-conservation, stated by a huge decrease in sediment load at Pakse (−62% between 1994–2003 and 2009–2016) and a decrease by 5% per year of the surface suspended sediment concentration in the coastal waters between 10 m and 20 m depth, from 2003 to 2012 [58]. The measured net suspended sediment load over the period 2009–2016 as compared to previous estimates of sediment supply in the lower Mekong delta are consistent with such a scenario of a huge decrease in the 2000s, with a reduction from 145–160 Mt yr−1 to ~40 Mt yr−1 (by ~70–75%) in three or four decades. These estimates are consistent as well with the observed increase of shoreline erosion (with currently 66% of shorelines eroded) and the decrease of Mekong Delta area, since 2005 [42].
Tidal pumping still continues to bring sediments from the coast upstream in the estuary, especially in the dry season (Figure 4, see also [72]). The landward sediment flux likely increases when the water discharge decreases due to irrigation, evaporation in the reservoirs, water regulation or El Niño events. The net sediment supply from the watershed to the sea was seen to decrease recently by ~75%. The alongshore sediment transport mainly depends on wave action [91,92]. Waves from the South and Southwest induce coastal erosion during the low flow season and govern a net transport towards the Northeast of the delta, at the annual scale [91]. The coastal sediment budget seems thus oriented towards a global accelerated coastal erosion in the following years and decades, especially along the southwestern part of the delta [43], and the sediment supply may continue to decrease in a foreseeable future, like suggested by Liu et al. [57], Kondolf et al. [88]. If nothing will be done to limit the sediment storage along the reservoirs and the water pumping in the delta, the delta might disappear by the end of the century [93]. Protection or restoration measures should then be encouraged in a source-to-sink perspective (the watershed-estuary-coastal zone continuum), which requires to rapidly set up monitoring, understanding and management tools adapted at the full basin scale.
Author Contributions
S.O. and D.T.H. conceived and designed the study; G.V.V., D.T.H. and S.O. analyzed the data; D.T.H. and S.O. wrote the paper.
Funding
This research was funded by the Research Project “The erosion process in the Lower Mekong Delta Coastal Zones (LMDCZ) and the measures for protecting Go-Cong and U-Minh from coastal erosion”, supported by the European Union (EU), the Agence Française de Développement (AFD) and the Southern Institute of Water Resources Research (SIWRR).
Conflicts of Interest
The authors declare no conflict of interest.
References
- Douglas, I. Man, vegetation and the sediment yield of rivers. Nature 1967, 215, 925–928. [Google Scholar] [CrossRef]
- Ahnert, F. Functional relationships between denudation, relief, and uplift in large mid-latitude basins. Am. J. Sci. 1970, 268, 243–263. [Google Scholar] [CrossRef]
- Harrison, C.G.A. What factors control mechanical erosion rates? J. Earth Sci. 2000, 88, 752–763. [Google Scholar] [CrossRef]
- Milliman, J.D.; Meade, R.H. World-wide delivery of river sediment to the oceans. J. Geol. 1983, 91, 1–2. [Google Scholar] [CrossRef]
- Milliman, J.D.; Syvitski, J.P.M. Geomorphic/Tectonic control of sediment discharge to the Ocean: The importance of small mountainous river. J. Geol. 1992, 100, 525–544. [Google Scholar] [CrossRef]
- Farnsworth, K.L.; Milliman, J.D. Effects of climatic and anthropogenic change on small mountainous rivers: The Salinas River example. Glob. Planet. Chang. 2003, 39, 53–64. [Google Scholar] [CrossRef]
- Vörösmarty, C.J.; Meybeck, M.; Fekete, B.; Sharma, K.; Green, P.; Syvitski, J.P.M. Anthropogenic sediment retention: Major global impact from registered river impoundments. Glob. Planet. Chang. 2003, 39, 169–190. [Google Scholar] [CrossRef]
- Syvitski, J.P.M.; Vörösmarty, C.J.; Kettner, A.J.; Green, P. Impact of Humans on the flux of terrestrial sediment to the global coastal ocean. Science 2005, 308, 376–380. [Google Scholar] [CrossRef] [PubMed]
- Walling, D.E. Human impact on land-ocean sediment transfer by the world’s rivers. Geomorphology 2006, 79, 192–216. [Google Scholar] [CrossRef]
- Ouillon, S. Why and how do we study sediment transport? Focus on coastal zones and ongoing methods. Water 2018, 10, 390. [Google Scholar] [CrossRef]
- Vörösmarty, C.J.; Wasson, R.; Richey, J. Modelling the Transport and Transformation of Terrestrial Materials to Freshwater and Coastal Ecosystems; Workshop report; International Geosphere-Biosphere Programme: Stockholm, Sweden, 2003; Volume 39, 76p. [Google Scholar]
- Nilsson, C.; Reidy, C.A.; Dynesius, M.; Revenga, C. Fragmentation and flow regulation of the world’s large river systems. Science 2005, 308, 405–408. [Google Scholar] [CrossRef] [PubMed]
- Syvitski, J.P.; Milliman, J.D. Geology, Geography, and human battle for dominance over the delivery of fluvial sediment to the coastal ocean. J. Geol. 2007, 115, 1–19. [Google Scholar] [CrossRef]
- Dai, S.B.; Yang, S.L.; Li, M. The sharp decrease in suspended sediment supply from China’s rivers to the sea: Anthropogenic and natural causes. Hydrol. Sci. J. 2009, 54, 135–146. [Google Scholar] [CrossRef]
- Lu, X.X.; Jiang, T. Larger Asian rivers: Climate change, river flow and sediment flux. Quat. Int. 2009, 208, 1–3. [Google Scholar] [CrossRef]
- Cohen, S.; Kettner, A.J.; Syvitski, J.P.M. Global suspended sediment and water discharge dynamics between 1960 and 2010: Continental trends and intra-basin sensitivity. Glob. Planet. Chang. 2014, 115, 44–58. [Google Scholar] [CrossRef]
- Walling, D.E. The changing sediment loads of the world’s rivers. Ann. Warsaw Univ. Life Sci. SGGW Land Reclam. 2008, 39, 3–20. [Google Scholar] [CrossRef]
- Walling, D.E. The changing sediment load of the Mekong. Ambio 2008, 37, 150–157. [Google Scholar] [CrossRef]
- Walling, D.E. The impact of Global Change on Erosion and Sediment Transport by Rivers: Current Progress and Future Challenges; The United Nations World Water Development Report 3; UNESCO: Paris, France, 2009; 26p. [Google Scholar]
- Ludwig, W.; Probst, J.L. River sediment discharge to the oceans: Present-day controls and global budgets. Am. J. Sci. 1998, 298, 265–295. [Google Scholar] [CrossRef]
- Walling, D.E.; Fang, D. Recent trend in suspended sediment load of the world’s river. Glob. Planet. Chang. 2003, 39, 111–126. [Google Scholar] [CrossRef]
- Wang, H.; Yang, Z.; Wang, Y.; Saito, Y.; Liu, J.P. Reconstruction of sediment flux from the Changjiang (Yangtze River) to the sea since the 1860. J. Hydrol. 2008, 349, 318–332. [Google Scholar] [CrossRef]
- Xu, K.; Milliman, J.D. Seasonal variations of sediment discharge from the Yangtze River before and after impoundment of the Three Gorges Dam. Geomorphology 2009, 104, 276–283. [Google Scholar] [CrossRef]
- Xiong, M.; Xu, Q.; Yuan, J. Analysis of multi-factors affecting sediment load in the three Gorges Reservoir. Quat. Int. 2009, 208, 76–84. [Google Scholar] [CrossRef]
- Dang, T.H.; Coynel, A.; Orange, D.; Blanc, G.; Etcheber, H.; Le, L.A. Long-term monitoring (1960–2008) of the river-sediment transport in the Red River Watershed (Vietnam): Temporal variability and dam-reservoir impact. Sci. Total Environ. 2010, 408, 4654–4664. [Google Scholar] [CrossRef] [PubMed]
- Vinh, V.D.; Ouillon, S.; Tanh, T.D.; Chu, L.V. Impact of the Hoa Binh dam (Vietnam) on water and sediment budgets in the Red River basin and delta. Hydrol. Earth Syst. Sci. 2014, 18, 3987–4005. [Google Scholar] [CrossRef] [Green Version]
- King, P.; Bird, J.; Haas, L. The Current Status of Environmental Criteria for Hydropower Development in the Mekong Region: A Literature Compilation; Consultants Report to ADB (Asian Development Bank), MRCS (Mekong River Commission Secretariat) and WWF (World Wide Fund for Nature); WWF Living Mekong Program: Vientiane, Laos, 2007; 155p. [Google Scholar]
- Keskinen, M.; Kummu, M.; Kakönen, M.; Varis, O. Mekong at the Crossroads: Next Steps for Impact Assessment of Large Dams. Ambio 2012, 41, 319–324. [Google Scholar] [CrossRef] [PubMed] [Green Version]
- Keskinen, M.; Chinvanno, S.; Kummu, M.; Nuorteva, P.; Snidvongs, A.; Varis, O.; Vastilä, K. Climate change and water resources in the Lower Mekong River Basin: Putting adaptation into the context. J. Water Clim. Chang. 2010, 1, 103–117. [Google Scholar] [CrossRef]
- Lauri, H.; de Moel, H.; Ward, P.J.; Räsänen, T.A.; Keskinen, M.; Kummu, M. Future changes in Mekong River hydrology: Impact of climate change and reservoir operation on discharge. Hydrol. Earth Syst. Sci. 2012, 16, 4603–4619. [Google Scholar] [CrossRef] [Green Version]
- Adamson, P.T. Hydrological perspectives on the Lower Mekong Basin—The potential impacts of hydropower developments in Yunnan on the downstream flow regime. Int. Water Power Dam Constr. 2001, 53, 16–21. [Google Scholar]
- Asian Development Bank. Laos—Nam Theun 2 Hydroelectric Project (Vol. 5): Cumulative Impact Analysis and Nam Theun 2 Contributions; Final Report, Prepared by NORPLAN and EcoLao for Asian Development Bank; World Bank: Vientiane, Laos, 2004; 540p, Available online: http://documents.worldbank.org/curated/en/332511468046791545/Cumulative-impact-analysis-and-Nam-Thuen-2-contributions-final-report (accessed on 19 September 2017).
- World Bank Report: Modeled Observations on Development Scenarios in the Lower Mekong Basin; Prepared for the World Bank with Mekong River Commission Cooperation; World Bank: Vientiane, Laos, 2004; 146p.
- Kummu, M.; Varis, O. Sediment-related impacts due to upstream reservoir trapping, the Lower Mekong River. Geomorphology 2007, 85, 275–293. [Google Scholar] [CrossRef]
- Kummu, M.; Lu, X.X.; Wang, J.J.; Varis, O. Basinwide sediment trapping efficiency of emerging reservoirs along the Mekong. Geomorphology 2010, 119, 181–197. [Google Scholar] [CrossRef]
- Hoanh, C.T.; Jirayoot, K.; Lacombe, G.; Srinetr, V. Impacts of Climate Change and Development on Mekong Flow Regime, First Assessment—2009; MRC Technical Paper No. 29; Mekong River Commission: Vientiane, Laos, 2010. [Google Scholar]
- Mekong River Commission (MRC). State of the Basin Report; Mekong River Commission: Vientiane, Laos, 2010. [Google Scholar]
- Xue, Z.; Liu, J.P.; Ge, Q.A. Changes in hydrology and sediment delivery of the Mekong River in the last 50 years: Connection to damming, monsoon, and ENSO. Earth Surf. Proc. Land. 2011, 36, 296–308. [Google Scholar] [CrossRef]
- Wang, H.; Saito, Y.; Zhang, Y.; Bi, N.; Sun, X.; Yang, Z. Recent changes of sediment flux to the western Pacific Ocean from major rivers in East and Southeast Asia. Earth-Sci. Rev. 2011, 108, 80–100. [Google Scholar] [CrossRef]
- Räsänen, T.A.; Koponen, J.; Lauri, H.; Kummu, M. Downstream hydrological impacts of hydropower development in the upper Mekong basin. Water Resour. Manag. 2012, 26, 3495–3513. [Google Scholar] [CrossRef]
- Nguyen, X.H.; Tran, T.; Luong, H.D. Study of water discharge and sediment load variation in the lower Mekong River. In Proceedings of the National Conference on Meteo-Hydrological, Climatic Change and Environment, Ho Chi Minh City, Vietnam, 18–20 July 2013. [Google Scholar]
- Li, X.; Liu, J.P.; Saito, Y.; Nguyen, V.L. Recent evolution of the Mekong Delta and the impacts of dams. Earth-Sci. Rev. 2017, 175, 1–17. [Google Scholar] [CrossRef]
- Piman, T.; Shrestha, M. Case Study on Sediment in the Mekong River Basin: Present State and Future Trends; UNESCO, Stockholm Environment Institute (SEI) Asia Centre: Stockholm, Sweden, 2017; 41p. [Google Scholar]
- Ngoc, T.A. Assessing the Effects of Upstream Dam Developments on Sediment Distribution in the Lower Mekong Delta, Vietnam. J. Water Resour. Prot. 2017, 9, 822–840. [Google Scholar] [CrossRef]
- Ogston, A.S.; Allison, M.A.; Mullarney, J.C.; Nittrouer, C.A. Sediment- and hydro-dynamics of the Mekong Delta: From tidal river to continental shelf (editorial). Cont. Shelf Res. 2017, 147, 1–6. [Google Scholar] [CrossRef]
- Pokhrel, Y.; Burbano, M.; Roush, J.; Kang, H.; Sridhar, V.; Hyndman, D.W. A Review of the Integrated Effects of Changing Climate, Land Use, and Dams on Mekong River Hydrology. Water 2018, 10, 266. [Google Scholar] [CrossRef]
- Fu, K.D.; He, D.M.; Lu, X.X. Sedimentation in the Manwan reservoir in the Upper Mekong and its downstream impacts. Quat. Int. 2008, 186, 91–99. [Google Scholar] [CrossRef]
- Wild, T.B.; Loucks, D.P. Managing flow, sediment, and hydropower regimes in the Sre Pok, Se San, and Se Kong Rivers of the Mekong basin. Water Resour. Res. 2014, 50, 5141–5157. [Google Scholar] [CrossRef]
- Darby, S.E.; Hackney, C.R.; Leyland, J.; Kummu, M.; Lauri, H.; Parsons, D.R.; Best, J.L.; Nicholas, A.P.; Aalto, R. Fluvial sediment supply to a mega-delta reduced by shifting tropical-cyclone activity. Nature 2016, 539, 276–279. [Google Scholar] [CrossRef] [PubMed] [Green Version]
- Gugliotta, M.; Saito, Y.; Nguyen, V.L.; Ta, T.K.O.; Nakashima, R.; Tamura, T.; Uehara, K.; Katsuki, K.; Yamamoto, S. Process regime, salinity, morphological, and sedimentary trends along the fluvial to marine transition zone of the mixed-energy Mekong River delta, Vietnam. Cont. Shelf Res. 2017, 147, 7–26. [Google Scholar] [CrossRef]
- Lu, X.X.; Siew, R.Y. Water discharge and sediment flux changes over the past decades in the Lower Mekong River: Possible impacts of Chinese Dams. Hydrol. Earth Syst. Sci. 2006, 10, 181–195. [Google Scholar] [CrossRef]
- Kite, G. Modelling the Mekong: Hydrological simulation for environmental impact studies. J. Hydrol. 2001, 253, 1–13. [Google Scholar] [CrossRef]
- Unverricht, D.; Szczuciński, W.; Stattegger, K.; Jagodziński, R.; Le, X.T.; Kwong, L.L.W. Modern sedimentation and morphology of the subaqueous Mekong Delta, Southern Vietnam. Glob. Planet. Chang. 2013, 110, 223–235. [Google Scholar] [CrossRef]
- Kummu, M.; Lu, X.X.; Rasphone, A.; Sarkkula, J.; Koponen, J. Riverbank changes along the Mekong River: Remote sensing detection in the Vientiane-Nong Khai area. Quat. Int. 2008, 186, 100–112. [Google Scholar] [CrossRef]
- Ta, T.K.O.; Nguyen, V.L.; Tateishi, M.; Kobayashi, I.; Tanabe, S.; Saito, Y. Holocene delta evolution and sediment discharge of the Mekong River, southern Vietnam. Quat. Sci. Rev. 2002, 21, 1807–1819. [Google Scholar] [CrossRef]
- Roberts, T. Downstream Ecological Implications of China’s Langcang Hydropower and Mekong Navidation Project; Min, C., Huabin, H., Liming, L., Eds.; Biodiversity Management and Sustainable Development in the Lancang-Mekong River in the New Millennium. Xishuangbanna, China: Yunnan Research & Coordination Office for Lancang-Mekong Sub-regional Cooperation; International Rivers: Oakland, CA, USA, 2001; Available online: https://www.internationalrivers.org/resources/downstream-ecological-implications-of-china-s-lancang-hydropower-and-mekong-navigation (accessed on 3 January 2018).
- Liu, C.; He, Y.; Walling, D.E.; Wang, J.J. Changes in the sediment load of the Lancang-Mekong River over the period 1965–2003. Sci. China Technol. Sci. 2013, 56, 843–852. [Google Scholar] [CrossRef]
- Loisel, H.; Mangin, A.; Vantrepotte, V.; Dessailly, D.; Dinh, N.D.; Garnesson, P.; Ouillon, S.; Lefebvre, J.P.; Mériaux, X.; Phan, M.T. Variability of suspended particulate matter concentration in coastal waters under the Mekong’s influence from ocean color (MERIS) remote sensing over the last decade. Remote Sens. Environ. 2014, 150, 218–230. [Google Scholar] [CrossRef]
- Kiem, A.S.; Hapuarachchi, H.P.; Ishidaira, H.; Magome, J.; Takeuchi, K. Relationship between ENSO and snow covered area in the Mekong and Yellow River basins. IAHS Publ. 2005, 296, 255–264. [Google Scholar]
- Räsänen, T.A.; Kummu, M. Spatiotemporal influences of ENSO on precipitation and flood pulse in the Mekong River Basin. J. Hydrol. 2013, 476, 154–168. [Google Scholar] [CrossRef]
- Fok, H.S.; He, Q.; Chun, K.P.; Zhou, Z.; Chu, T. Application of ENSO and drought indices for water level reconstruction and prediction: A case study in the lower Mekong River Estuary. Water 2018, 10, 58. [Google Scholar] [CrossRef]
- Piton, V.; Delcroix, T. Seasonal and interannual (ENSO) climate variabilities and trends in the South China Sea over the last three decades. Ocean Sci. Discuss. 2018. [Google Scholar] [CrossRef]
- The CGIAR (Consultative Group on International Agricultural Research) Research Program on Water, Land and Ecosystems (WLE). Dataset on the Dams of the Irrawaddy, Mekong, Red and Salween River Basins; International Water Management Institute: Vientiane, Laos, 2016. [Google Scholar]
- Wang, J.J.; Lu, X.X.; Kummu, M. Sediment load estimates and variations in the lower Mekong River. River Res. Appl. 2011, 27, 33–46. [Google Scholar] [CrossRef]
- Bravard, J.P.; Goichot, M.; Tronchère, H. An assessment of sediment-transport processes in the Lower Mekong River based on deposit grain sizes, the CM technique and flow-energy data. Geomorphology 2014, 207, 174–189. [Google Scholar] [CrossRef]
- Brunier, G.; Anthony, E.J.; Goichot, M.; Provansal, M.; Dussouillez, P. Recent morphological changes in the Mekong and Bassac river channels, Mekong delta: The marked impact of river-bed mining and implications for delta stabilization. Geomorphology 2014, 224, 177–191. [Google Scholar] [CrossRef]
- Anthony, E.J.; Brunier, G.; Besset, M.; Goichot, M.; Dussouillez, P.; Nguyen, V.L. Linking rapid erosion of the Mekong River delta to human activities. Sci. Rep. 2015, 5, 14745. [Google Scholar] [CrossRef] [PubMed] [Green Version]
- Ogston, A.S.; Allison, M.A.; McLachlan, R.L.; Nowacki, D.J.; Stephens, J.D. How tidal processes impact the transfer of sediment from source to sink: Mekong River collaborative studies. Oceanography 2017, 30, 22–33. [Google Scholar] [CrossRef]
- Xing, F.; Meselhe, E.A.; Allison, M.A.; Weathers III, H.D. Analysis and numerical modelling of the flow and sand dynamics in the lower Song Hau channel, Mekong delta. Cont. Shelf Res. 2017, 147, 62–77. [Google Scholar] [CrossRef]
- Wolanski, E.; Ngoc Huan, N.; Trong Dao, L.; Huu Nhan, N.; Ngoc Thuy, N. Fine sediment dynamics in the Mekong River Estuary, Vietnam. Estuar. Coast. Shelf Sci. 1996, 43, 565–582. [Google Scholar] [CrossRef]
- Wolanski, E.; Nhan, N.H.; Spagnol, S. Sediment dynamics during low flow conditions in the Mekong River Estuary, Vietnam. J. Coast. Res. 1998, 14, 472–482. [Google Scholar]
- Nowacki, D.J.; Ogston, A.S.; Nittrouer, C.A.; Fricke, A.T.; Van, P.D.T. Sediment dynamics in the lower Mekong River: Transition from tidal river to estuary. J. Geophys. Res Oceans 2015, 120, 6363–6383. [Google Scholar] [CrossRef] [Green Version]
- National Centre for Hydro-Meteorology. Variation of Water Discharge and Sediment Flux at Lower Mekong River; Ministry of Natural Resources and Environment (MONRE): Hanoi, Vietnam, 2017; 15p. (In Vietnamese)
- Ministry of Natural Resources and Environment of Vietnam. TCVN 6663-6:2008. Water Quality—Sampling—Part 6: Guidance on Sampling of Rivers and Streams; Ministry of Natural Resources and Environment (MONRE): Hanoi, Vietnam, 2008; 17p. (In Vietnamese)
- Southern Oscillation Index (SOI). Available online: https://www.ncdc.noaa.gov/teleconnections/enso/indicators/soi/ (accessed on 20 December 2017).
- Searcy, J.K.; Hardison, C.H. Double-Mass Curves; USGS Water-Supply Paper 1541-B; USGS: Washington, DC, USA, 1960.
- Walling, D.E. The response of sediment yields to environmental change, IAHS Publ. 245. In Human Impact on Erosion and Sedimentation; Walling, D.E., Probst, J.L., Eds.; IAHS Press: Wallingford, UK, 1977; pp. 77–89. [Google Scholar]
- Achite, M.; Ouillon, S. Recent changes in climate, hydrology and sediment load in the Wadi Abd, Algeria (1970–2010). Hydrol. Earth Syst. Sci. 2016, 20, 1355–1372. [Google Scholar] [CrossRef] [Green Version]
- Gratiot, N.; Bildstein, A.; Anh, T.T.; Thoss, H.; Denis, H.; Michallet, H.; Apel, H. Sediment flocculation in the Mekong River estuary, Vietnam, an important driver of geomorphological changes. Comptes Rendus Geosci. 2017, 349, 260–268. [Google Scholar] [CrossRef]
- Vinh, V.D.; Ouillon, S.; Uu, D.V. Estuarine Turbidity Maxima and variations of aggregate parameters in the Cam-Nam Trieu estuary, North Vietnam, in early wet season. Water 2018, 10, 68. [Google Scholar] [CrossRef]
- Garel, E.; Nunes, S.; Magalhães Neto, J.; Fernandes, R.; Neves, R.; Marques, J.C.; Ferreira, O. The autonomous Simpatico system for real-time continuous water-quality and current velocity monitoring: Examples of application in three Portuguese estuaries. Geo-Mar. Lett. 2009, 29, 331–341. [Google Scholar] [CrossRef]
- Contreras, E.; Polo, M.J. Measurement frequency and sampling spatial domains required to characterize turbidity and salinity events in the Guadalquivir estuary (Spain). Nat. Hazards Earth Syst. Sci. 2012, 12, 2581–2589. [Google Scholar] [CrossRef] [Green Version]
- Jalón-Rojas, I.; Schmidt, S.; Sottolichio, A. Turbidity in the fluvial Gironde Estuary (southwest France) based on 10-year continuous monitoring: Sensitivity to hydrological conditions. Hydrol. Earth Syst. Sci. 2015, 19, 2805–2819. [Google Scholar] [CrossRef]
- Jalón-Rojas, I.; Schmidt, S.; Sottolichio, A.; Bertier, C. Tracking the turbidity maximum zone in the Loire Estuary (France) based on a long-term, high-resolution and high-frequency monitoring network. Cont. Shelf Res. 2016, 117, 1–11. [Google Scholar] [CrossRef]
- Koehnken, L. Discharge Sediment Monitoring Project (DSMP) 2009–2013: Summary & Analysis of Results; Technical Advice on Water, Final Report; Mekong River Commission Secretariat: Vientiane, Laos, 2014; 126p, Available online: http://portal.mrcmekong.org/assets/documents/Report-workshop/Technical-Report_DSMP/DSMP-Report-2009_13-Final-Report-July-2014.pdf (accessed on 3 January 2018).
- Gupta, A.; Hock, L.; Xiaojing, H.; Ping, C. Evaluation of part of the Mekong River using satellite imagery. Geomorphology 2002, 44, 221–239. [Google Scholar] [CrossRef]
- Adamson, P.T.; Rutherfurd, I.D.; Peel, M.C.; Conlan, I.A. Chapter 4—The hydrology of the Mekong river. In The Mekong, Aquatic Ecology; Campbell, I.C., Ed.; Academic Press: San Diego, CA, USA, 2009; pp. 53–76. [Google Scholar]
- Kondolf, G.M.; Schmitt, R.J.P.; Carling, P.; Darby, P.; Arias, M.; Bizzi, S.; Castelletti, A.; Cochrane, T.A.; Gibson, S.; Kummu, M.; et al. Changing sediment budget of the Mekong: Cumulative threats and management strategies for a large river basin. Sci. Total Environ. 2018, 625, 114–134. [Google Scholar] [CrossRef] [PubMed]
- Brandt, S.A. Classification of geomorphological effects downstream of dams. Catena 2000, 40, 375–401. [Google Scholar] [CrossRef]
- Fu, K.D.; He, D.M. Analysis and prediction of sediment trapping efficiencies of the reservoirs in the mainstream of the Langcang River. Chin. Sci. Bull. 2007, 52, 134–140. [Google Scholar] [CrossRef]
- Vinh, V.D.; Ouillon, S.; Thao, N.V.; Tien, N.N. Numerical Simulations of Suspended Sediment Dynamics Due to Seasonal Forcings in the Mekong Coastal Area. Water 2016, 8, 255. [Google Scholar] [CrossRef]
- Anthony, E.J.; Dussouillez, P.; Dolique, F.; Besset, M.; Brunier, G.; Nguyen, V.L.; Goichot, M. Morphodynamics of an eroding beach and foredune in the Mekong River delta: Implications for deltaic shoreline change. Cont. Shelf Res. 2017, 147, 155–164. [Google Scholar] [CrossRef]
- Schmitt, R.J.P.; Rubin, Z.; Kondolf, G.M. Losing ground—Scenarios of land loss as consequence of shifting sediment budgets in the Mekong delta. Geomorphology 2017, 294, 58–69. [Google Scholar] [CrossRef]
Figure 1.
Hydrological network of the Mekong River Basin.

Figure 2.
Evolution of monthly mean sediment flux (Mt month−1) and water discharge (m3 s−1) at CanTho (upper panel) and MyThuan (lower panel) stations during the 2009–2016 period.
Figure 2.
Evolution of monthly mean sediment flux (Mt month−1) and water discharge (m3 s−1) at CanTho (upper panel) and MyThuan (lower panel) stations during the 2009–2016 period.

Figure 3.
Evolution of annual mean water discharge (m3 s−1) and sediment flux (Mt yr−1) of the Mekong River from 2009 to 2016.
Figure 3.
Evolution of annual mean water discharge (m3 s−1) and sediment flux (Mt yr−1) of the Mekong River from 2009 to 2016.

Figure 4.
Evolution of monthly sediment fluxes oriented seaward and landward at Can Tho and My Thuan stations for the period 2009–2016.
Figure 4.
Evolution of monthly sediment fluxes oriented seaward and landward at Can Tho and My Thuan stations for the period 2009–2016.

Figure 5.
Evolution of annual sediment fluxes oriented seaward and landward at Can Tho and My Thuan stations for the period 2009–2016.
Figure 5.
Evolution of annual sediment fluxes oriented seaward and landward at Can Tho and My Thuan stations for the period 2009–2016.

Figure 6.
Variation of annual water discharge measured at Can Tho and My Thuan stations during 2000–2016 period. 2000–2008: Data from [85] based on daily water discharge; 2009–2016: This study.
Figure 6.
Variation of annual water discharge measured at Can Tho and My Thuan stations during 2000–2016 period. 2000–2008: Data from [85] based on daily water discharge; 2009–2016: This study.

Figure 7.
Relationships between monthly sediment flux (Mt month−1) and monthly water discharges (m3 s−1); annual sediment flux (Mt yr−1) and annual water discharges (m3 s−1) at Can Tho and My Thuan for the 2009–2016 period. R2 values were calculated including all months (above) or all years (below).

Figure 8.
Time variation of sediment flux of the Mekong River (running averaged values over 5 months, expressed in Mt month−1) and SOI (running averaged value over 3 months), with a time-lag of 9 months for SOI (i.e., for example: the running averaged value of SOI for January, a given year, is shown here for October—9 months later—same year).

Figure 9.
Monthly evolution of the sediment flux-out and flux-in of the Mekong River.

Figure 10.
Double-mass plots of annual sediment flux and annual water flux for the Mekong River (sum of fluxes at Can Tho and My Thuan stations) during 2009–2016 period.
Figure 10.
Double-mass plots of annual sediment flux and annual water flux for the Mekong River (sum of fluxes at Can Tho and My Thuan stations) during 2009–2016 period.

Figure 11.
Mean annual sediment fluxes at stations along the Mekong River.


Table 1.
Number of planned and proposed dams in the Mekong River basin (source: [63]).
Table 1.
Number of planned and proposed dams in the Mekong River basin (source: [63]).
| Country | Planned Dams | Proposed Dams |
|---|---|---|
| China | 11 | 2 |
| Laos | 43 | 20 |
| Myanmar | 7 | 0 |
| Thailand | 7 | 0 |
| Cambodia | 12 | 0 |
| Vietnam | 1 | 0 |
| Total | 74 | 22 |
Table 2.
List of recent or planned main hydropower dams in the main stream of the Mekong River (source: [63]).
Table 2.
List of recent or planned main hydropower dams in the main stream of the Mekong River (source: [63]).
| Dam | Country | Capacity (MW) | Annual Generation (GWh) | Total Storage (million m3) | Commissioning |
|---|---|---|---|---|---|
| Manwan | China | 1500 | 7870 | 920 | 1986–1993 |
| Dachaoshan | China | 1350 | 7090 | 880 | 1997–2002 |
| Gongguquiao | China | 750 | 4670 | 510 | 2009–2012 |
| Xiaowan | China | 4200 | 18,540 | 15,130 | 2010–2012 |
| Jinhong | China | 1500 | 8470 | 1040 | 2012–2013 |
| Nuozhadu | China | 5500 | 22,670 | 24,670 | 2013–2016 |
| Xayaburi | Laos | 1295 | 6035 | 1300 | 2012–2020 |
Table 3.
Monthly mean water discharge and sediment flux at Can Tho and My Thuan stations during the 2009–2016 period.
Table 3.
Monthly mean water discharge and sediment flux at Can Tho and My Thuan stations during the 2009–2016 period.
| Month | Can Tho Station | My Thuan Station | ||
|---|---|---|---|---|
| Q (m3 s−1) | Qs (Mt month−1) | Q (m3 s−1) | Qs (Mt month−1) | |
| January | 3359 | 0.382 | 3725 | 0.392 |
| February | 2136 | 0.238 | 2386 | 0.248 |
| March | 1330 | 0.141 | 1800 | 0.171 |
| April | 1251 | 0.114 | 1860 | 0.121 |
| May | 1689 | 0.157 | 2490 | 0.168 |
| June | 3360 | 0.530 | 4174 | 0.615 |
| July | 6358 | 1.478 | 7361 | 1.998 |
| August | 10,296 | 2.688 | 11,194 | 3.636 |
| September | 12,502 | 3.900 | 12,687 | 4.802 |
| October | 13,270 | 3.988 | 13,414 | 5.378 |
| November | 9785 | 1.696 | 9853 | 2.507 |
| December | 5624 | 0.882 | 6085 | 1.234 |
Table 4.
Annual water discharge and sediment flux at Can Tho and My Thuan stations during the 2009–2016 period.
Table 4.
Annual water discharge and sediment flux at Can Tho and My Thuan stations during the 2009–2016 period.
| Year | Can Tho Station | My Thuan Station | ||
|---|---|---|---|---|
| Q Annual (m3 s−1) | Qs Annual (Mt yr−1) | Q Annual (m3 s−1) | Qs Annual (Mt yr−1) | |
| 2009 | 6381 | 34.22 | 6948 | 30.70 |
| 2010 | 4929 | 11.13 | 5410 | 14.65 |
| 2011 | 7660 | 23.37 | 8572 | 38.32 |
| 2012 | 5774 | 12.48 | 6363 | 17.24 |
| 2013 | 6582 | 15.02 | 6888 | 23.70 |
| 2014 | 6482 | 16.39 | 6791 | 22.70 |
| 2015 | 4347 | 8.43 | 4737 | 9.15 |
| 2016 | 5151 | 8.51 | 5645 | 13.63 |
| Min | 4347 | 8.43 | 4737 | 9.15 |
| Max | 7660 | 34.22 | 8572 | 38.32 |
| CV (%) | 18.1 | 54.1 | 18.4 | 42.4 |
| Average | 5913 | 16.20 | 6419 | 21.26 |
Table 5.
Average monthly concentrations at flood tide (Cf) and at ebb tide (Ce) at Can Tho and My Thuan stations during the 2009–2016 period.
Table 5.
Average monthly concentrations at flood tide (Cf) and at ebb tide (Ce) at Can Tho and My Thuan stations during the 2009–2016 period.
| Month | Can Tho Station | My Thuan Station | Ratio Can Tho/My Thuan | |||
|---|---|---|---|---|---|---|
| Cf (mg L−1) | Ce (mg L−1) | Cf (mg L−1) | Ce (mg L−1) | Cf CT/Cf MT | Ce CT/Ce MT | |
| January | 31.18 | 38.17 | 23.95 | 32.26 | 1.30 | 1.18 |
| February | 32.07 | 38.44 | 24.40 | 32.42 | 1.32 | 1.19 |
| March | 34.51 | 36.70 | 22.49 | 27.16 | 1.53 | 1.35 |
| April | 35.11 | 35.36 | 22.90 | 23.87 | 1.53 | 1.48 |
| May | 30.84 | 31.81 | 20.50 | 22.56 | 1.50 | 1.41 |
| June | 32.59 | 46.61 | 33.29 | 47.75 | 0.97 | 0.98 |
| July | 58.05 | 74.81 | 56.34 | 90.11 | 1.03 | 0.83 |
| August | 68.19 | 92.61 | 72.35 | 114.85 | 0.94 | 0.81 |
| September | 68.01 | 117.92 | 91.35 | 142.03 | 0.74 | 0.83 |
| October | 49.90 | 106.82 | 60.74 | 138.58 | 0.82 | 0.77 |
| November | 33.63 | 63.55 | 46.81 | 92.46 | 0.72 | 0.69 |
| December | 31.03 | 52.82 | 41.19 | 70.12 | 0.75 | 0.75 |
| CV (%) | 35.13 | 49.09 | 51.31 | 64.85 | 28.92 | 27.86 |
| Average | 42.09 | 61.30 | 42.59 | 69.51 | 1.10 | 1.02 |
Table 6.
Correlation coefficients (r) at given lags (in month) between the running average of SOI over 3 months and the running average of water discharge (Q) and sediment flux (Qs) of the Mekong River (sum of fluxes at Can Tho and My Thuan) over 1, 3 and 5 months.
Table 6.
Correlation coefficients (r) at given lags (in month) between the running average of SOI over 3 months and the running average of water discharge (Q) and sediment flux (Qs) of the Mekong River (sum of fluxes at Can Tho and My Thuan) over 1, 3 and 5 months.
| Period of Q or Qs Averaging | Correlation Coefficient between SOI and Q or Qs | |||||
|---|---|---|---|---|---|---|
| Q | Qs | |||||
| 7 m lag | 8 m lag | 9 m lag | 7 m lag | 8 m lag | 9 m lag | |
| 1 month | 0.27 | 0.26 | 0.23 | 0.38 | 0.41 | 0.41 |
| 3 months | 0.29 | 0.28 | 0.26 | 0.41 | 0.45 | 0.45 |
| 5 months | 0.34 | 0.34 | 0.33 | 0.47 | 0.51 | 0.52 |
Table 7.
Average yearly water and sediment discharges at Can Tho and My Thuan stations during different ENSO stages over the 2009–2016 period.
Table 7.
Average yearly water and sediment discharges at Can Tho and My Thuan stations during different ENSO stages over the 2009–2016 period.
| Period | Can Tho | My Thuan | Total Mekong | ||||||
|---|---|---|---|---|---|---|---|---|---|
| Flux In | Flux Out | Total | Flux In | Flux Out | Total | Flux In | Flux Out | Total | |
| Q 2011 (La Niña) * | 47.9 | 290.2 | 242.3 | 36.7 | 307.9 | 271.2 | 84.6 | 598.1 | 513.5 |
| Q 2015–16 (El Niño) * | 70.7 | 221.1 | 150.4 | 57.1 | 221.6 | 164.5 | 127.8 | 442.7 | 314.9 |
| Q neutral phase * | 54.4 | 245.2 | 190.8 | 40.4 | 245.6 | 205.2 | 94.9 | 490.9 | 396.0 |
| Qs 2011 (La Niña) ** | 1.88 | 25.25 | 23.37 | 1.01 | 39.33 | 38.32 | 2.89 | 64.58 | 61.69 |
| Qs 2015–16 (El Niño) ** | 2.11 | 10.58 | 8.47 | 1.74 | 13.13 | 11.39 | 3.84 | 23.70 | 19.86 |
| Qs neutral phase ** | 1.93 | 19.77 | 17.85 | 1.11 | 22.91 | 21.80 | 3.04 | 42.68 | 39.65 |
* in km3 yr−1; ** in Mt yr−1.
Table 8.
Summary of mean annual sediment flux (F in Mt yr−1) and annual average water discharge (Q in m3 s−1) in the Mekong River basin.
Table 8.
Summary of mean annual sediment flux (F in Mt yr−1) and annual average water discharge (Q in m3 s−1) in the Mekong River basin.
| Before 1993 * | 1994–2003 * | 2009–2016 ** | ||||
|---|---|---|---|---|---|---|
| Q (m3 s−1) | Qs (Mt yr−1) | Q (m3 s−1) | Qs (Mt yr−1) | Q (m3 s−1) | Qs (Mt yr−1) | |
| Jiuzhou (1965–2003) | 25 | 27.5 | ||||
| Gajiu (1965–2003) | 45.8 | 18.1 | ||||
| Chiang Saen (1961–2002, 2009–2013) | 2917 | 71 | 2822 | 37 | 2502 | 12.8 |
| Mukdahan (1961–2002, 2009–2013) | 8974 | 144 | 6310 | 140 | 8530 | 91 |
| Pakse (1986–2002, 2009–2013) | 12,177 | 165 | 12,303 | 176 | 13,128 | 65.6 |
| Tan Chau + Chau Doc (2009–2016) | 13,302 | 45 | ||||
| Can Tho + My Thuan (2009–2016) | 12,332 | 37.5 | ||||
| Historical delivery to the ocean | 14,904 | 145–160 | ||||
* Monthly measurements; ** Daily measurements. During 2003–2008: no available data.
© 2018 by the authors. Licensee MDPI, Basel, Switzerland. This article is an open access article distributed under the terms and conditions of the Creative Commons Attribution (CC BY) license (http://creativecommons.org/licenses/by/4.0/).
Share and Cite
MDPI and ACS Style
Thi Ha, D.; Ouillon, S.; Van Vinh, G. Water and Suspended Sediment Budgets in the Lower Mekong from High-Frequency Measurements (2009–2016). Water 2018, 10, 846. https://doi.org/10.3390/w10070846
AMA Style
Thi Ha D, Ouillon S, Van Vinh G. Water and Suspended Sediment Budgets in the Lower Mekong from High-Frequency Measurements (2009–2016). Water. 2018; 10(7):846. https://doi.org/10.3390/w10070846
Chicago/Turabian StyleThi Ha, Dang, Sylvain Ouillon, and Giap Van Vinh. 2018. "Water and Suspended Sediment Budgets in the Lower Mekong from High-Frequency Measurements (2009–2016)" Water 10, no. 7: 846. https://doi.org/10.3390/w10070846
Note that from the first issue of 2016, this journal uses article numbers instead of page numbers. See further details here.