Article

Ecosystemic Assessment of Surface Water Quality in the Virilla River: Towards Sanitation Processes in Costa Rica

by
Leonardo Mena-Rivera
1,*,†,
Oscar Vásquez-Bolaños
2,†,
Cinthya Gómez-Castro
3,
Alicia Fonseca-Sánchez
2,
Abad Rodríguez-Rodríguez
4 and
Rolando Sánchez-Gutiérrez
1
1
Water Resources Management Laboratory, School of Chemistry, Universidad Nacional, Heredia 83-3000, Costa Rica
2
Laboratory of Environmental Hydrology, School of Biological Sciences, Universidad Nacional, Heredia 83-3000, Costa Rica
3
Empresa de Servicios Públicos de Heredia S.A., Heredia 40301, Costa Rica
4
Laboratory of Microbial Biotechnology, School of Biological Sciences, Universidad Nacional, Campus Omar Dengo, Heredia 83-3000, Costa Rica
*
Author to whom correspondence should be addressed.
These authors contributed equally to this work.
Water 2018, 10(7), 845; https://doi.org/10.3390/w10070845
Submission received: 14 May 2018 / Revised: 31 May 2018 / Accepted: 1 June 2018 / Published: 26 June 2018
(This article belongs to the Special Issue Current and Emerging Issues Surrounding Water in the Americas )

Abstract

:
Water quality information is essential supporting decision making in water management processes. The lack of information restricts, at some point, the implementation of adequate sanitation, which is still scarce in developing countries. In this study, an ecosystemic water quality assessment was conducted in the Virilla river in Costa Rica, in a section of particular interest for future sanitation development. It included the monitoring of physical, chemical, microbiological and benthic macroinvertebrate parameters from 2014 to 2016. Mutivariate statistics and water quality indexes were used for data interpretation. Results indicated that water quality decreased downstream towards more urbanised areas. Particularly, extreme values of phosphorous, nitrogen and E. coli were found. Sample sites were grouped in two clusters, which were consistent with land use. Benthic macroinverterbrates diversity was predominantly represented by Baetidae, Chironomidae, Leptohyphidae, Hydropsychidae, Simuliidae and Physidae. They were mostly influenced by water temperature, nitrite, ammonium, soluble reactive phosphorous, total solids, alkalinity, nitrate and total suspended solids. Three water quality indexes consistently showed the poor condition of the water body. The overall results indicate that the main sources of pollution in the river are likely to be wastewater discharges. Thus, special efforts should be undertaken regarding its regulation in the country.

1. Introduction

Rivers are an important source of aquatic biota and water for human development. They provide essential resources for recreation, tourism, human water consumption, agriculture, electricity generation and industry [1,2]. However, riverine systems have been constantly modified by human activities [3], causing the alteration of the hydrological cycle and the degradation of their water quality at both a local or regional scale [4]. Whereas natural processes such as erosion, soil mineralisation and meteorological conditions, eventually impact surface water quality; the major impact on its degradation is due to anthropogenic activities such as the excessive use of pesticides and fertilizers, alteration of land use and untreated wastewater discharges from industries and houses [5,6].
Untreated wastewater discharges are the main source of surface water pollution in urban areas [7,8,9,10]. They reduce the quality of the water body and stimulate the proliferation of pathogenic organisms that can cause severe diseases concerning public health [11,12,13]. Its collection, transport, treatment, disposal and reuse are taken into account in the framework of sanitation according to the United Nations and the World Health Organisation. In addition, the provision of adequate treatment for the disposal of urine and human faeces is considered a human right [14,15]. Despite this, there remain countries, in particular developing ones, where access to sanitation is limited [16,17,18].
Central American countries face substantial challenges regarding water and sanitation. In Costa Rica, for example, 76% of houses use septic tanks and only 22% are connected to sewerage; but only 8.2% of the wastewater is treated before being discharged into the rivers [19]. The effect of this lack of wastewater treatment in the riverine ecosystem could be even worse in areas with accelerated socio-economic development [2]. One of these areas is the Virilla river catchment, which drains the Greater Metropolitan Area (GAM) and receives approximately 67% of the wastewater discharges of the country [15]. The GAM corresponds to only 4% of the Costa Rican territory but its population density is nearly 1200 hab km 2 . It also contains the largest sector of industrial and commercial activities in the country [15]. To reduce the potential impact of these activities in the environment, implementation of new legislation and environmental programs have been undertaken during the last years [19,20]. However, the success of these policies is difficult to estimate, due to the functions overlapping across different institutions and the lack of accurate information about the ecological status of the water bodies [17,19,20]. Notably, information about the surface water bodies is essential regarding control of pollution and the application of mitigation strategies. These networks are useful in providing reliable information to better understand temporal and spatial changes in water quality and supporting integrated water management processes [17,21]. But only a few studies have been reported in the country and water monitoring networks are scarce [22,23,24,25,26].
Water quality in rivers can be estimated using physical and chemical characteristics or macro and micro biological indicators [22,23,27]. The category and number of such indicators are not generally uniform among similar studies and its selection depends on the objectives and financial resources of the monitoring program. This makes difficult the comparison among different studies and different disciplines are rarely integrated together. One approach oriented to simplify this is the water quality index; which takes into account the value of certain parameters in an overall water quality score, through the estimation of a relative weight of each parameter [28,29]. However, there is still uncertainty related to the selection and weight of the parameters. Thus, there is an interest in more holistic approaches, which will provide better and integrative perspectives of the riverine ecosystem status [30].
This study presents results of an holistic integrative approach to surface water quality assessment in the Virilla river catchment in Costa Rica, where sanitation mitigation measures will be developed. Nevertheless, there is not enough background information about the water quality of this area in general. The ecosystemic approach presented here includes physical, chemical, microbiological and benthic macroinvertebrate data; which are interpreted using land use information, multivariate statistics and water quality indexes. This information is useful to better understand the water quality status in the Virilla river catchment; and therefore, to generate evidence-based mitigation strategies in the near future. Finally, this information will provide a surface water quality background in Costa Rica for further implementation of sanitation processes in the country.

2. Materials and Methods
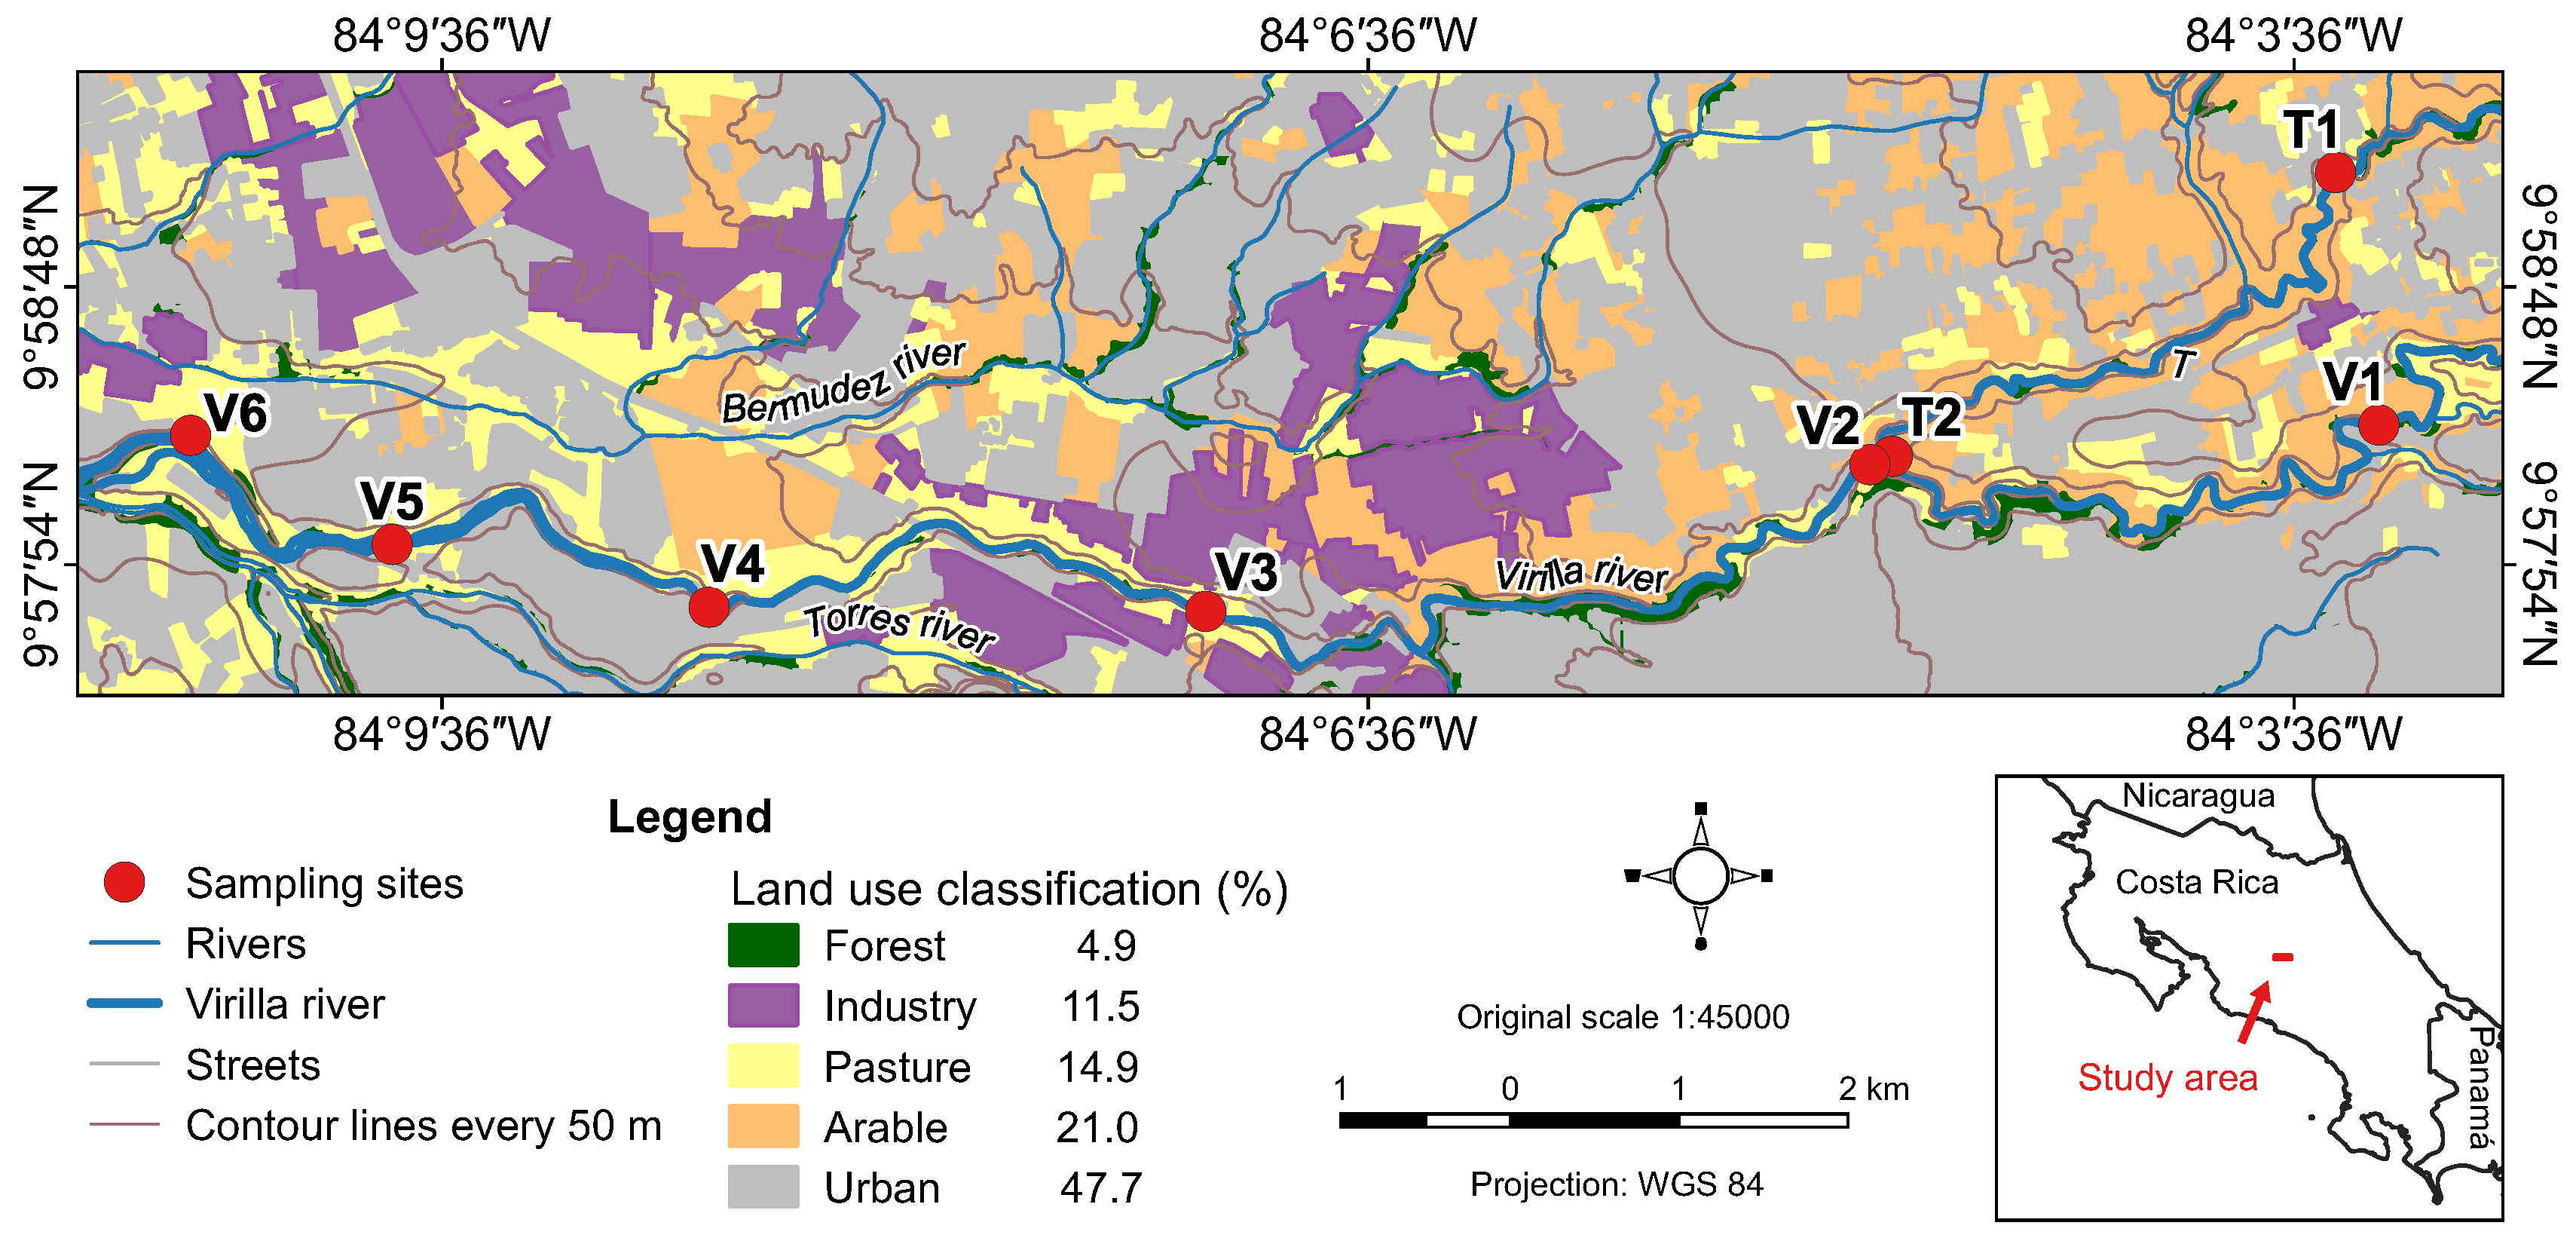
2.1. Study Area

This study was developed in the Virilla river catchment in Costa Rica, between the longitude 84 10 48 and 84 02 38 , and the latitude 9 59 30 and 9 57 28 (see Figure 1). The Virilla river flows from the north-east Central Volcanic range of the Central Valley in Costa Rica, to the south-west Pacific region; where it confluences with the Grande river and forms the Grande de Tárcoles river. The covered area includes a section of approximately 20 km of the river from the city of San Miguel to San Antonio, both of the Heredia providence. This section is remarkably important because it will be directly impacted by the implementation of a sewage treatment plant in the upcoming years. In this area, the climate is characterised by a dry season (December to March) and rainy season (May to October) regarding April and November as transition months. During the study period, the average monthly precipitation was 148 mm and air temperature ranged from 17.7 C to 24.8 C with an average of 21.4 C. The elevation gradient was 277 m ranging from 1161 m to 884 m. This area is classified as premontane wet forest zone with irregular relief and soils predominantly vertisols. Land use categorisation (56 km 2 ) included forest (4.9%), pasture (14.9%), arable (21.0%), industry (11.5%) and urban (47.7%), and it was generated by the photo-interpretation technique in ArcGIS 10.4.1 (ESRI) at scale 1:5000, using the satellite images Quick Bird II at 0.6 m resolution distributed by Digital Globe in Google Earth Pro ®. In this section of the river, there are wastewater discharges from real estate activities (e.g., sewage disposal from condos), from manufacturing industries of concrete, cement and food products (e.g., coffee, beverages and food preservatives).

2.2. Sampling and Methods

Water samples were collected at eight sample sites, every two months, from October 2014 to March 2016 (n = 71). They were collected using high-density polyethylene and glass bottles previously washed with hydrochloric acid 3% m/v and de-ionised water. Samples were then stored at 4 C and delivered to the laboratory within 6 h of collection. Microbiological samples were collected in 100 mL sterile vessels and stored separately. All samples were analysed using the procedures of the Standard Methods for the Examination of Water and Wastewater [31].
Temperature, dissolved oxygen (DO), pH and conductivity were determined in situ using a field meter Oakton 300 (Vernon Hills, IL, USA) and a Thermo Orion Star A222 (Chelmsford, MA, USA). An aliquot of each water sample was filtered through 0.45 μ m pore filter (Advantec® GC-50) for analysis of total dissolved solids (TDS), total suspended solids (TSS), ammonium, nitrite and soluble reactive phosphorous (SRP). Alkalinity was measured by titration using a sulphuric acid standard solution. Total solids (TS), TDS and TSS were determined by gravimetry at 105 C, 180 C and 105 C, respectively. Nephelometry was used to analyse turbidity (Oakton Inst. T100, Vernon Hills, IL, USA). Biochemical oxygen demand (BOD) was determined using the 5-days test and the modified Winkler method. Ammonium was measured using the indophenol blue reaction at 640 nm and nitrite was colorimetric determined at 543 nm. Total phosphorous (TP) and SRP were analysed spectrophotometrically by the stannous chloride method after the application of the persulfate digestion procedure for TP and after filtration for SRP. All spectrophotometric analyses were carried out in a Thermo Aquamate 2000E (Cambridge, UK). Fluoride, chloride, nitrate and sulphate were analysed by ion chromatography (Dionex ICS-5000, Sunnyvale, CA, USA). Finally, total coliform (TC) and Escherichia coli were determined by the multiple tube fermentation technique using the Fluorocult® medium and 24–48 h of incubation at 37 C. The microbial population was estimated using the table reported by Woomer [32].
The sampling of benthic macroinvertebrate community was undertaken in the water body in safe and accessible sites, on the same day as water sample collection, from February 2015 to March 2016 (n = 49). Sample collection and preservation were achieved according to the methods described by Springer et al. [33]. In brief, composite samples were collected using a D network (500 μ m mesh) placed opposite to the water direction flow; while the substrate was gently moved for approximately five minutes in order to collect the maximum amount of macroinvertebrates possible. This procedure was repeated three times in different points around each sample site (e.g., upstream and downstream) for a total of 15 min of effort per site. An initial selection was made in the field where macroinvertebrates were picked live and preserved in ethanol 70% m/v. In addition, samples were stored in plastic bags with ethanol 95% m/v and delivered to the laboratory for a more extensive selection. Macroinvertebrates were processed, classified and quantified as families using a stereoscope according to the taxonomic guidelines established in the Costa Rican surface water legislation [34].

2.3. Data Analysis

Data analysis, including non-parametric survival methods and ordination exploratory analysis, were carried out in R statistical package using NADA and vegan libraries [35,36,37]. Analysis of data with values below the quantification limit (<QL) included the calculation of descriptive statistics using the Maximum Likelihood Estimation (MLE) method, and their transformation to tied ranks before performing multivariate non-parametric tests [38]. In order to estimate the degree of association between water quality parameters the non-parametric, Kendall’s Tau correlation coefficient was used [39]. An analysis of similarities (ANOSIM) was performed computing 999 permutations to evaluate the difference among sample sites and among sample campaigns. The spatial grouping of the sample sites was defined using hierarchical cluster analysis with Ward’s method of association [40] and squared Euclidian distance as a measure of similarity. These last two tests were performed using only the physical, chemical and microbiological data.
Richness, abundance and the Shannon index [41] were calculated as measures of macroinvertebrate’s diversity. Redundancy analysis (RDA) was applied to elucidate the relationships between environmental and community data. Based on the percentage of occurrence, the families that were not present more than 24 times were removed for the subsequent analysis. Previous RDA, physical and chemical variables were standardised [42] and biological data were transformed using a Hellinger transformation [43]. Multiple linear regression, variation inflation factors (VIF) and BIOENV function (Best Subset of Environmental Variables with Maximum Correlation with Community Dissimilarities) were employed to select the best subset of physical and chemical variables that influenced the macroinvertebrate data [44,45,46]. A Monte Carlo permutation test (999 permutations) then allowed the statistical validation of the RDA.
Finally, three water quality indexes (WQI) were calculated to evaluate water quality overall. These were the widely used index of the National Sanitation Foundation of the United States (NSF) [47], and the two indexes established in the Costa Rican national legislation; which includes the Dutch index and the Biological Monitoring Working Party modified to Costa Rica (BMWP-CR) [34]. E. coli concentration was used instead of faecal coliform for the calculation of the NSF-WQI.

3. Results and Discussion

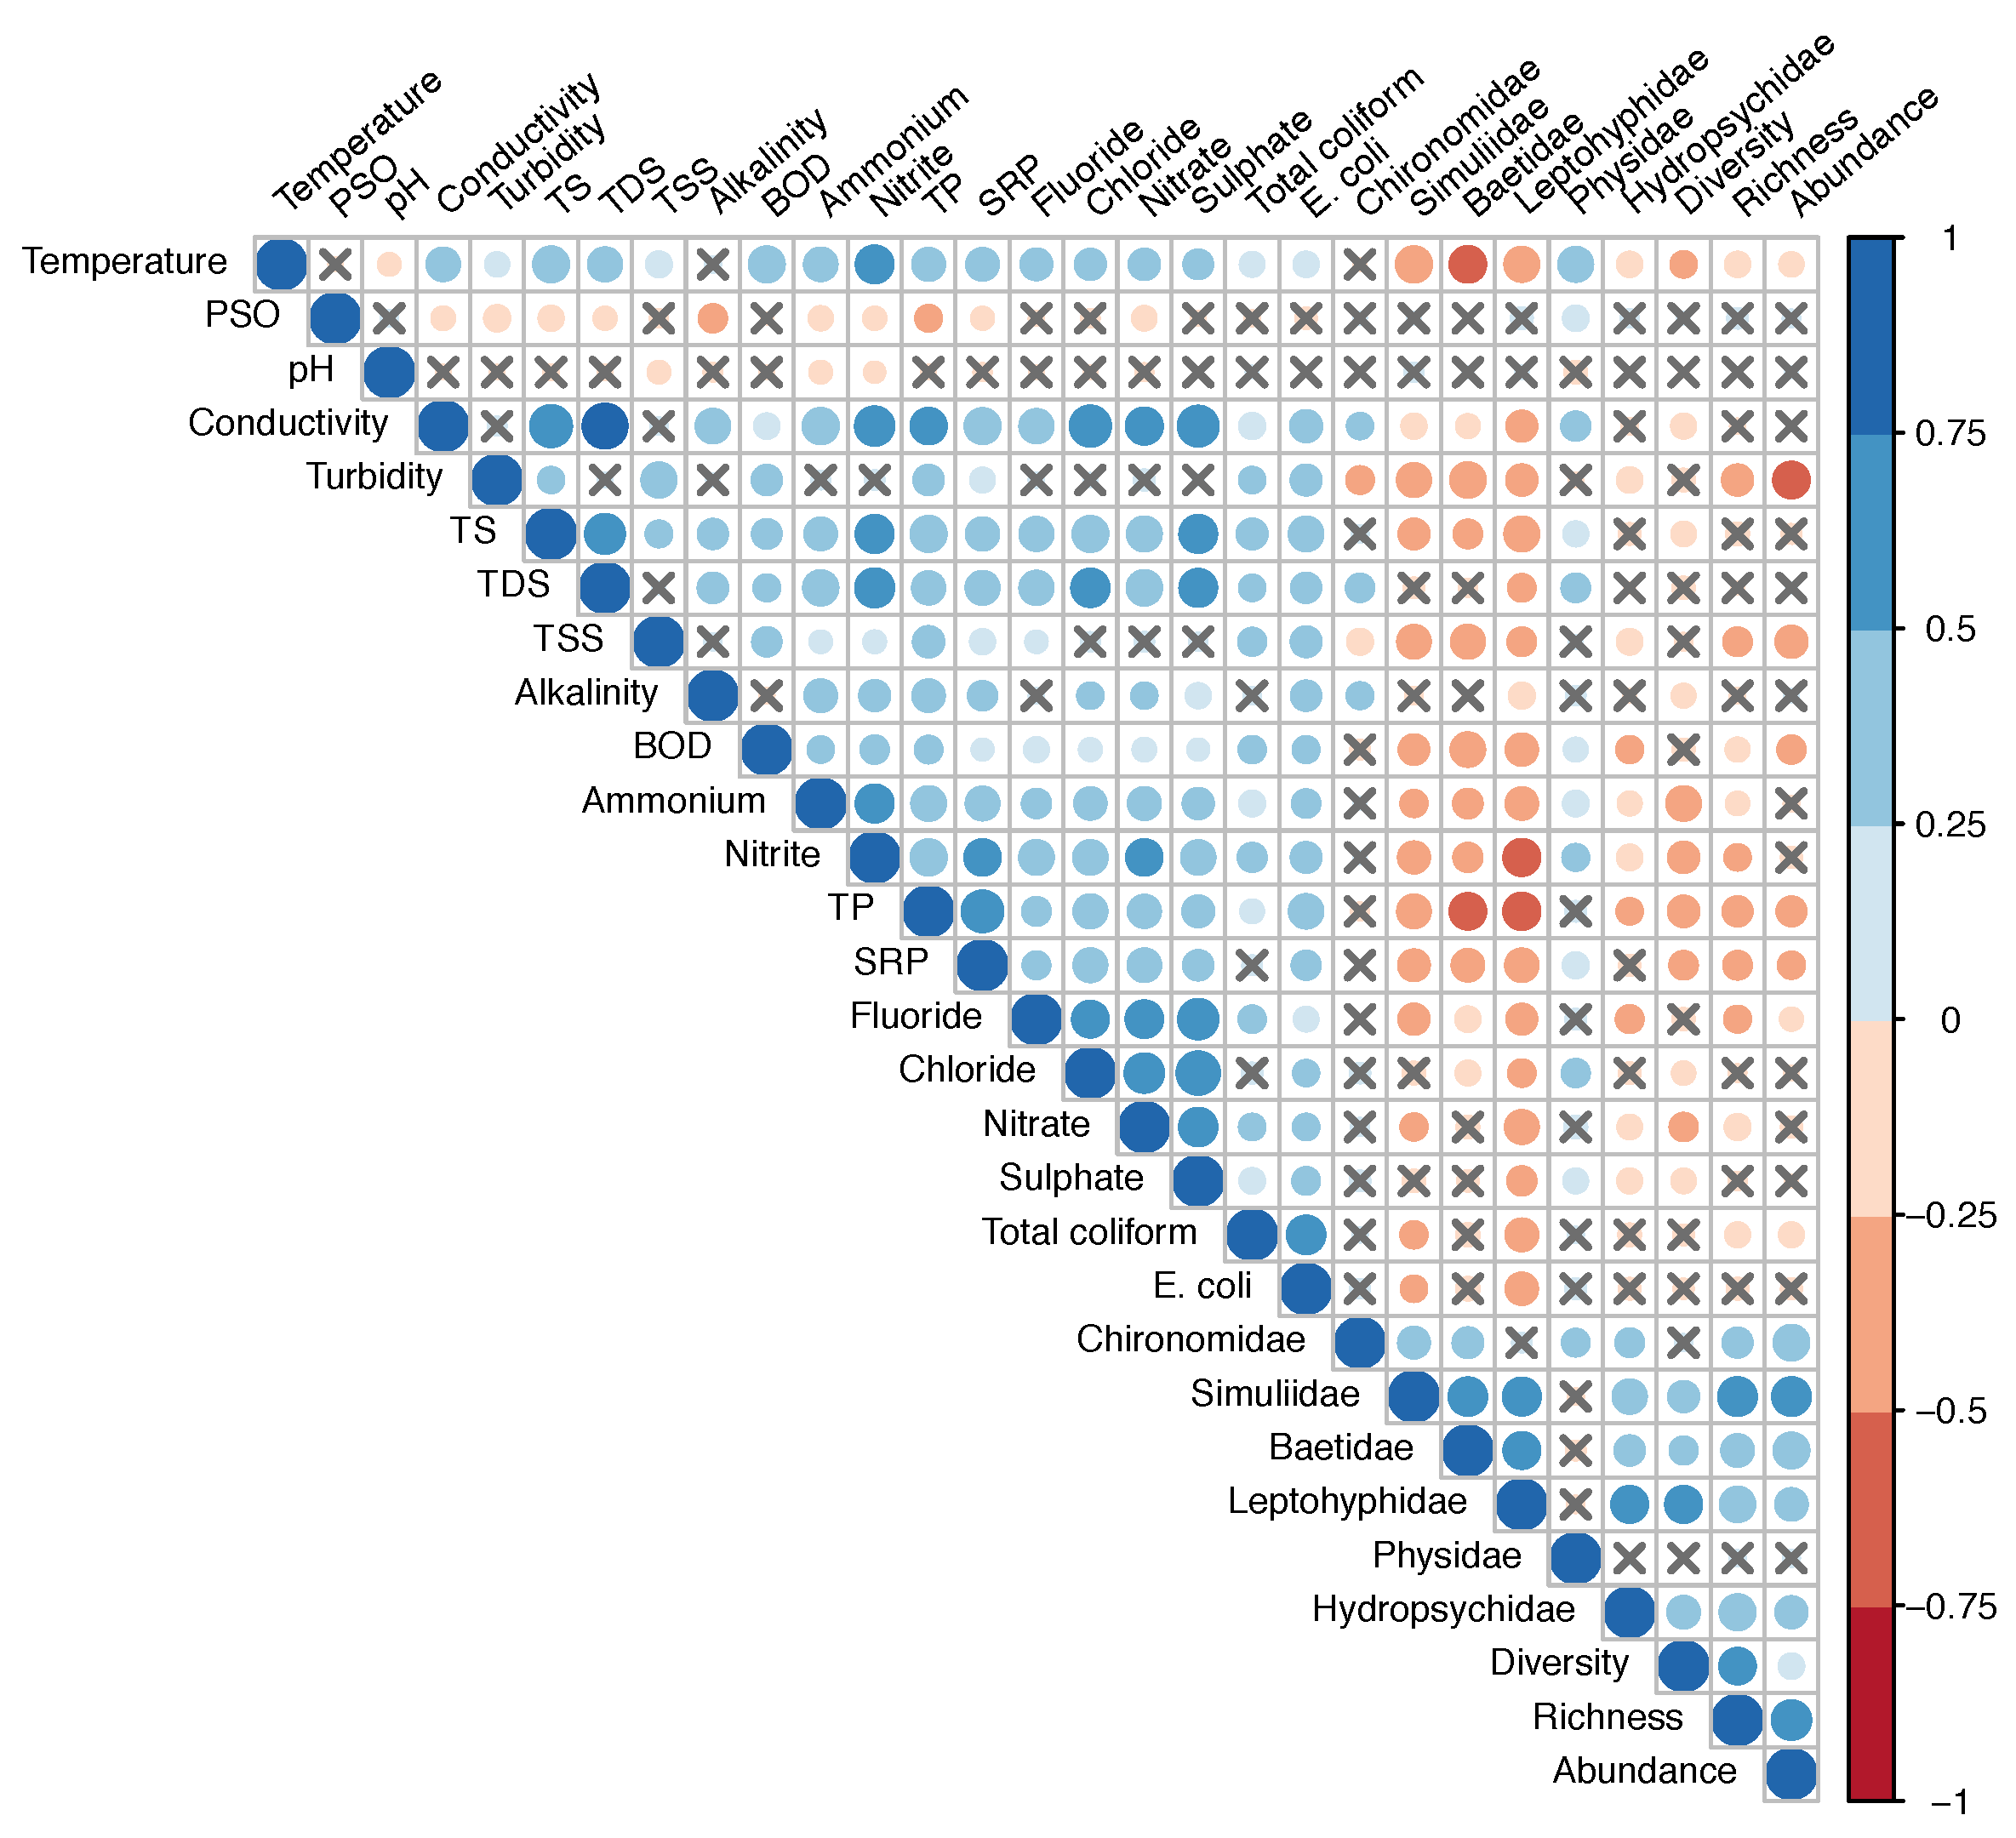
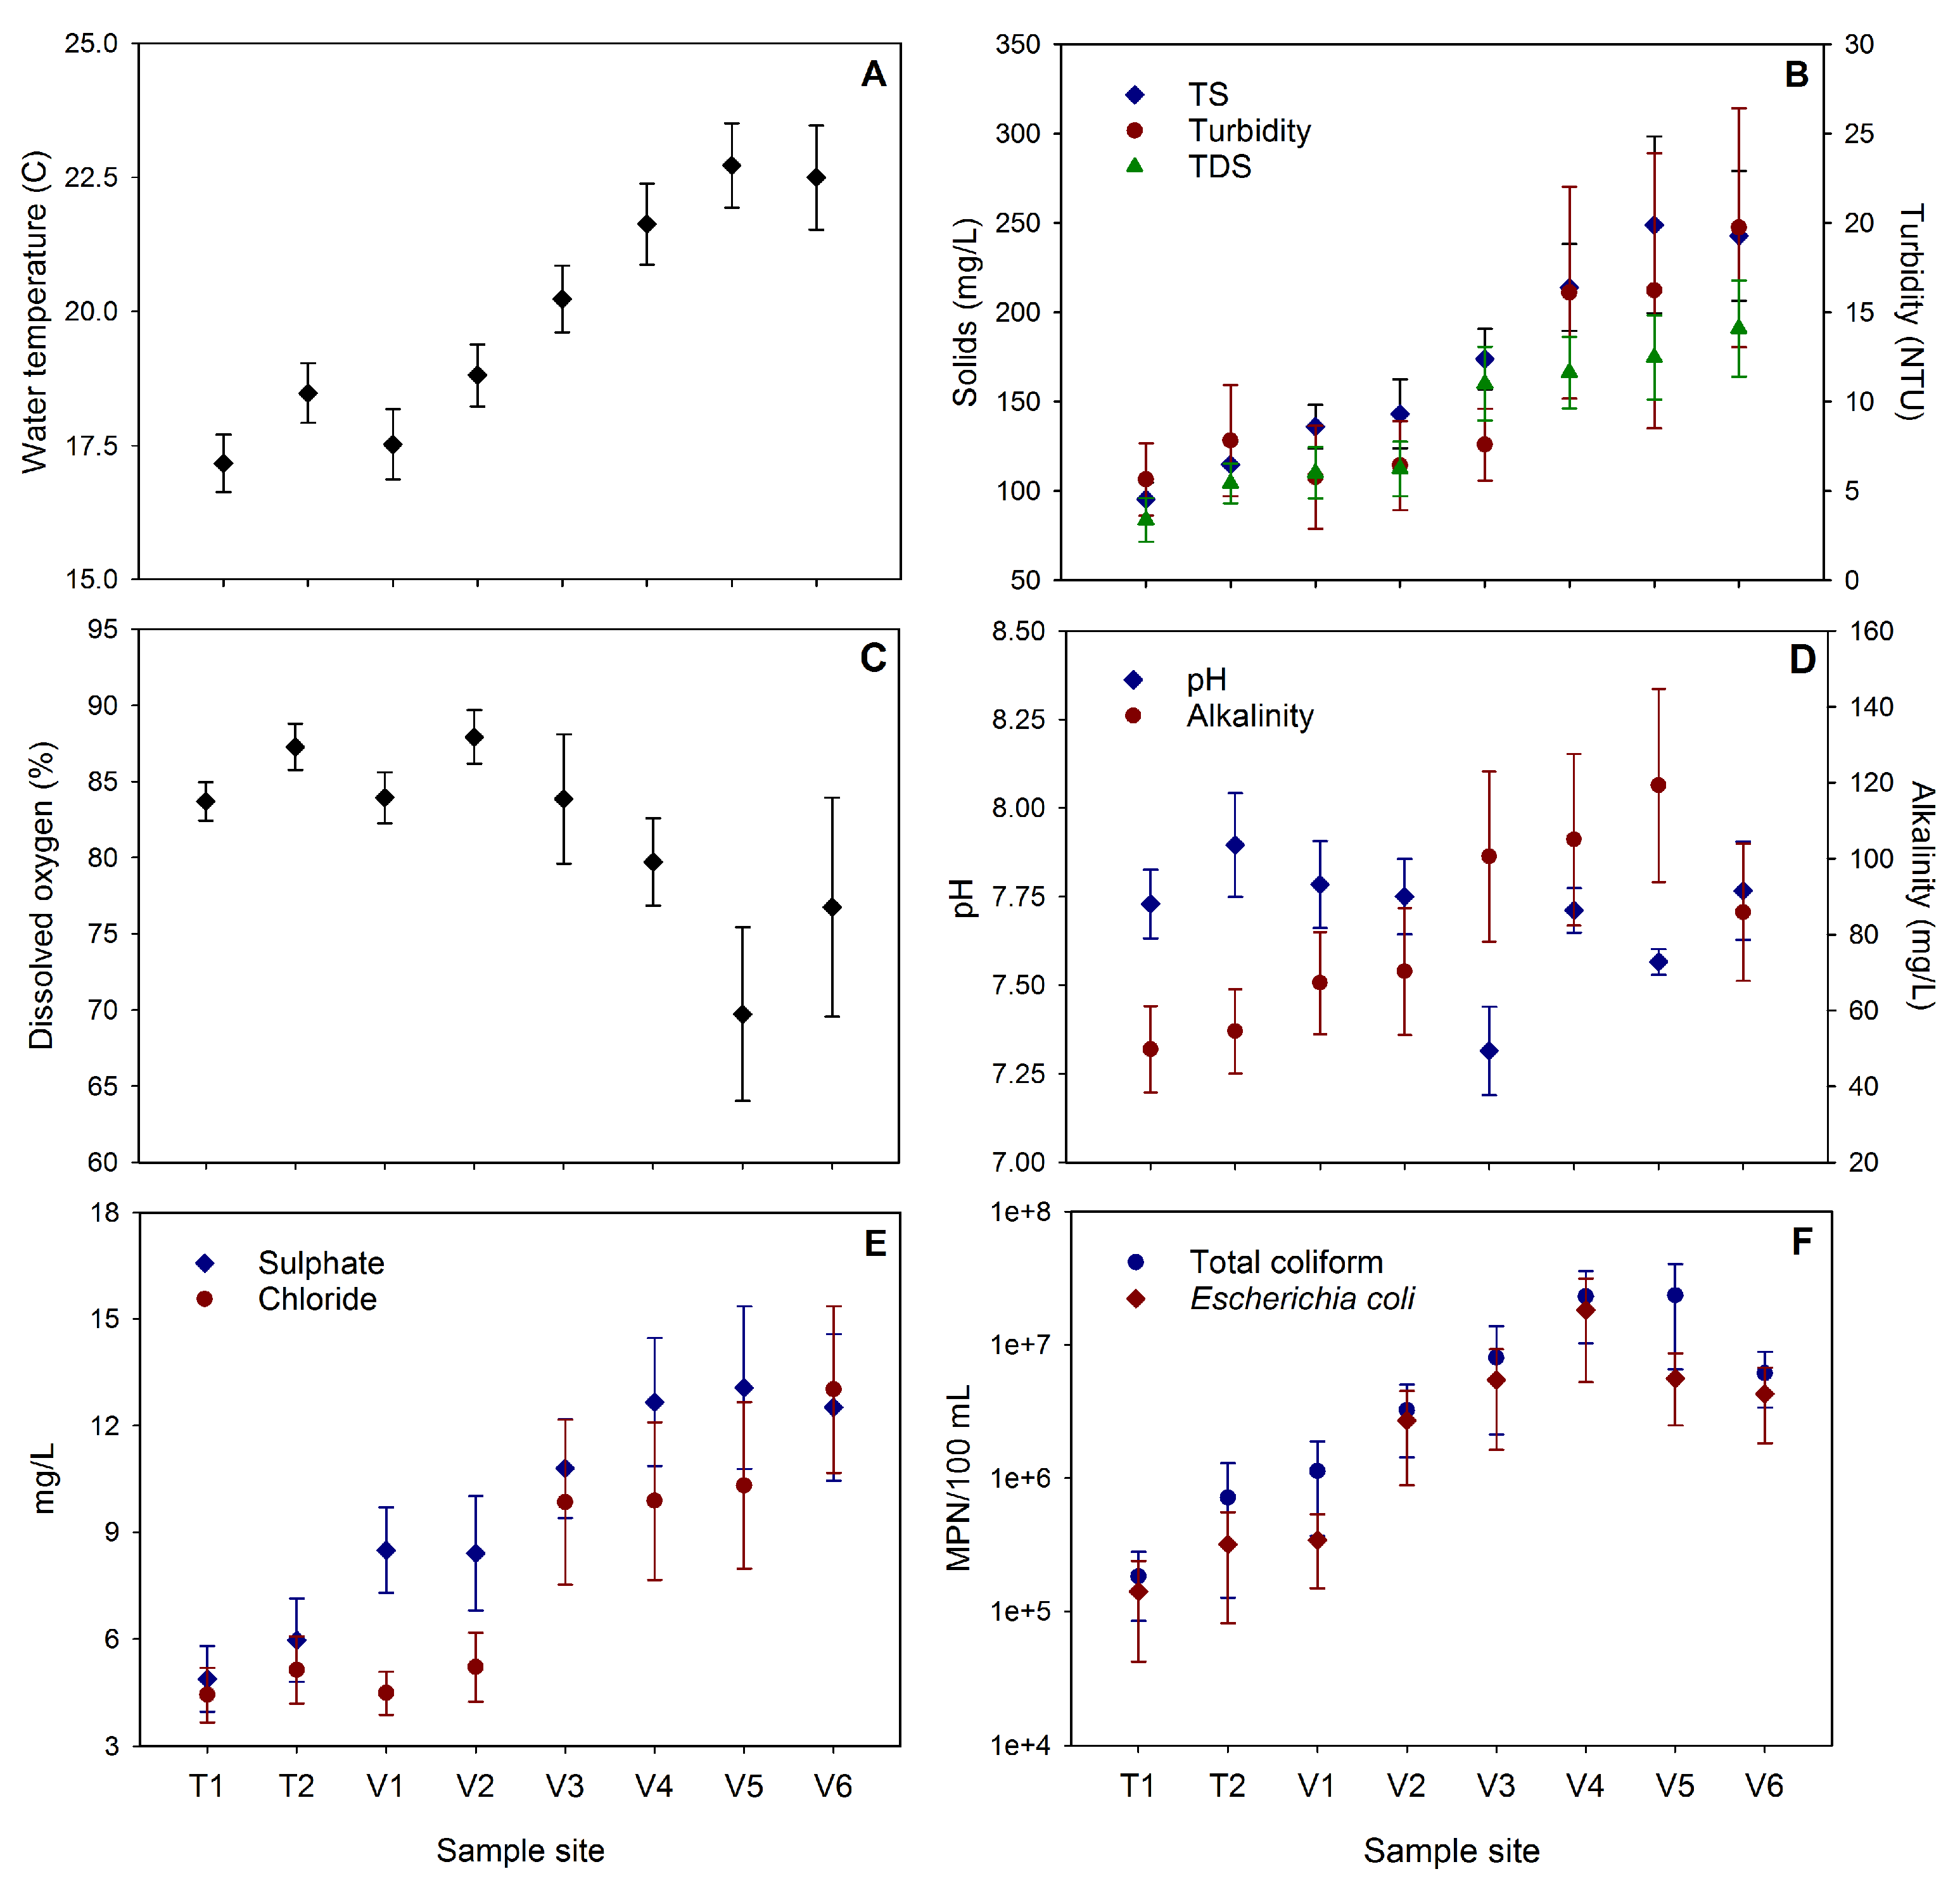
3.1. Physical, Chemical and Microbiological Data

Table 1 presents the summary of the descriptive analysis of the physical, chemical and microbiological parameters in the study area. The spatial trend for some of these parameters is shown in Figure A1. Average water temperature was 19.8 C, ranging from 15.2 C to 28.2 C. Higher temperature values were observed downstream, where riparian vegetation is less abundance. Non-extreme pH values were observed, ranging from 6.69 to 8.75. However, alkalinity concentration increased downstream with values up to 264 mg/L CaCO 3 . These levels were previously associated to vertisol soils presented in the catchment [48], which can also increase conductivity. Average DO concentration was 81.8%, but some critical values were obtained. For instance, the minimum value was 21.6% in sample site V6, but site V5 presented the lowest average DO concentration (69.7%). Turbidity, TS, TDS and TSS concentration also presented the same trend, an increasing towards a more industrialised and urbanised area. Its variation and increase can be related to wastewater discharges into the river as observed at the bottom of the study area.
BOD average concentration was 10.15 mg/L O 2 . This is consistent with the results reported by Herrera et al. [48]. However, BOD ranged from <2 mg/L O 2 in sample site V1 to a maximum of 206.8 mg/L O 2 in site V4. Particularly, in the riparian area of this last sample site, landfill was observed. This comes from an informal urban settlement next to the river. In addition, illegal sewage discharges may be present. The concentration of different N-compounds changed with elevation (ammonium, nitrite and nitrate). The first four sample sites presented constant concentration of these compounds, prevailing nitrate. This may be related to the arable land use in this area of the catchment. Since site V3, ammonium concentration increased drastically, being as high as nitrate concentration in some cases. Ammonium, nitrite and nitrate values were found in concentrations that may be toxic for aquatic species [49,50]. Sources of such higher concentration of nitrogen and phosphorus can be either point or diffuse. Some of these are fertilisers, run-off from agricultural fields, industrial effluents and untreated wastewater discharges [51]. Increasing of solids, BDO, ammonium and SRP suggests that the last one may be the main cause of pollution. In contrast, fluoride, chloride and sulphate concentrations were within the standards even for drinking water purposes [52]. This indicates that there are no significant sources of pollution for these compounds.
Total coliform concentration ranged from 2 MPN/100 mL to 1.40 × 10 8 MPN/100 mL, with an average of 7.8 0× 10 6 MPN/100 mL. The lowest and highest average concentrations were found in site T1 (1.83 × 10 5 MPN/100 mL) and site V5 (2.35 × 10 7 MPN/100 mL), respectively. The average E. coli concentration was 4.42 × 10 6 MPN/100 mL and the same pattern was observed for E. coli in accordance to the sites with maximum and minimum concentrations. Coliforms concentration also increased downstream as reported by Leandro et al. [23]; additionally, the results were above the national legislation for wastewater discharges. The high values indicate that there is strong faecal pollution in the river which represents a threat to human health. This includes bacterial gastrointestinal and parasitic infections or harmful virus diseases [53].
Kendall’s Tau correlation coefficients of the parameters evaluated in the study area are shown in Figure 2. Of the 406 possible correlations, 273 were significant (p < 0.05). TDS and conductivity ( τ = 0.776), and sulphate and chloride ( τ = 0.721) presented high positive significant correlations. Moderate correlations (0.5–0.7) were found in 37 cases, where 33 were classified as positive correlations and 4 as negative. Low correlation distribution (0.3–0.5) included 84 positive and 38 negative, for a total of 122. Finally, negligible correlations (<0.3) were presented between 122 variables, which 55 were positive and 57 negative. In general, most of the physical and chemical parameters were positively correlated each other. However, PSO presented a negative correlation with most of the parameters as expected, whereas the positive correlations previously mentioned indicate that the level of pollution increased.
Water composition among sample sites was significantly different (R = 0.3596, p = 0.001). In addition, cluster analysis generated two clusters at D l i n k /D m a x < 40 (Figure A2). The first group is formed by sites T1, T2, T1 and V2; which are located at the top of the study site. The second group included sites V3, V4, V5 and V6. These sites are distributed at the middle and bottom of the study area. Grouping of sample sites was consistent with land use. There is a change from arable-urban land use to a more pasture-arable-industrial use downstream. In addition, riparian land cover changes from forest to pasture-urban as elevation decreases. This change in land use is likely to be influencing water quality [54]. In the other hand, significant differences among sample campaigns were also observed (R = 0.3924, p = 0.001). This suggested that water quality may change seasonally. However, Mena-Rivera et al. [22] reported non-significant differences in water quality in another sub-catchment of the Virilla river. Long-term high-resolution monitoring networks are necessary to track these changes in seasonal patterns.
Despite the slightly improvement showed in sample site V6, the general trend observed with the parameters mentioned above is that water quality in the Virilla river decreased downstream. There is an increase of pollution at some point between sample sites V2 and V3, where the natural condition of the river has been extremely modified. Few meters before site V3, wastewater discharges are more evident, mainly from a coffee processing plant, an oxidation pond and houses. In addition to this condition, riparian landfill as cited previously was observed in site V4. Moreover, there is a reservoir in site V5. There, accumulation of material forms a surface layer, which also affect the minimum flow (ecological flow) observed in site V6. All these conditions are likely to be influencing water quality toward more critical levels.

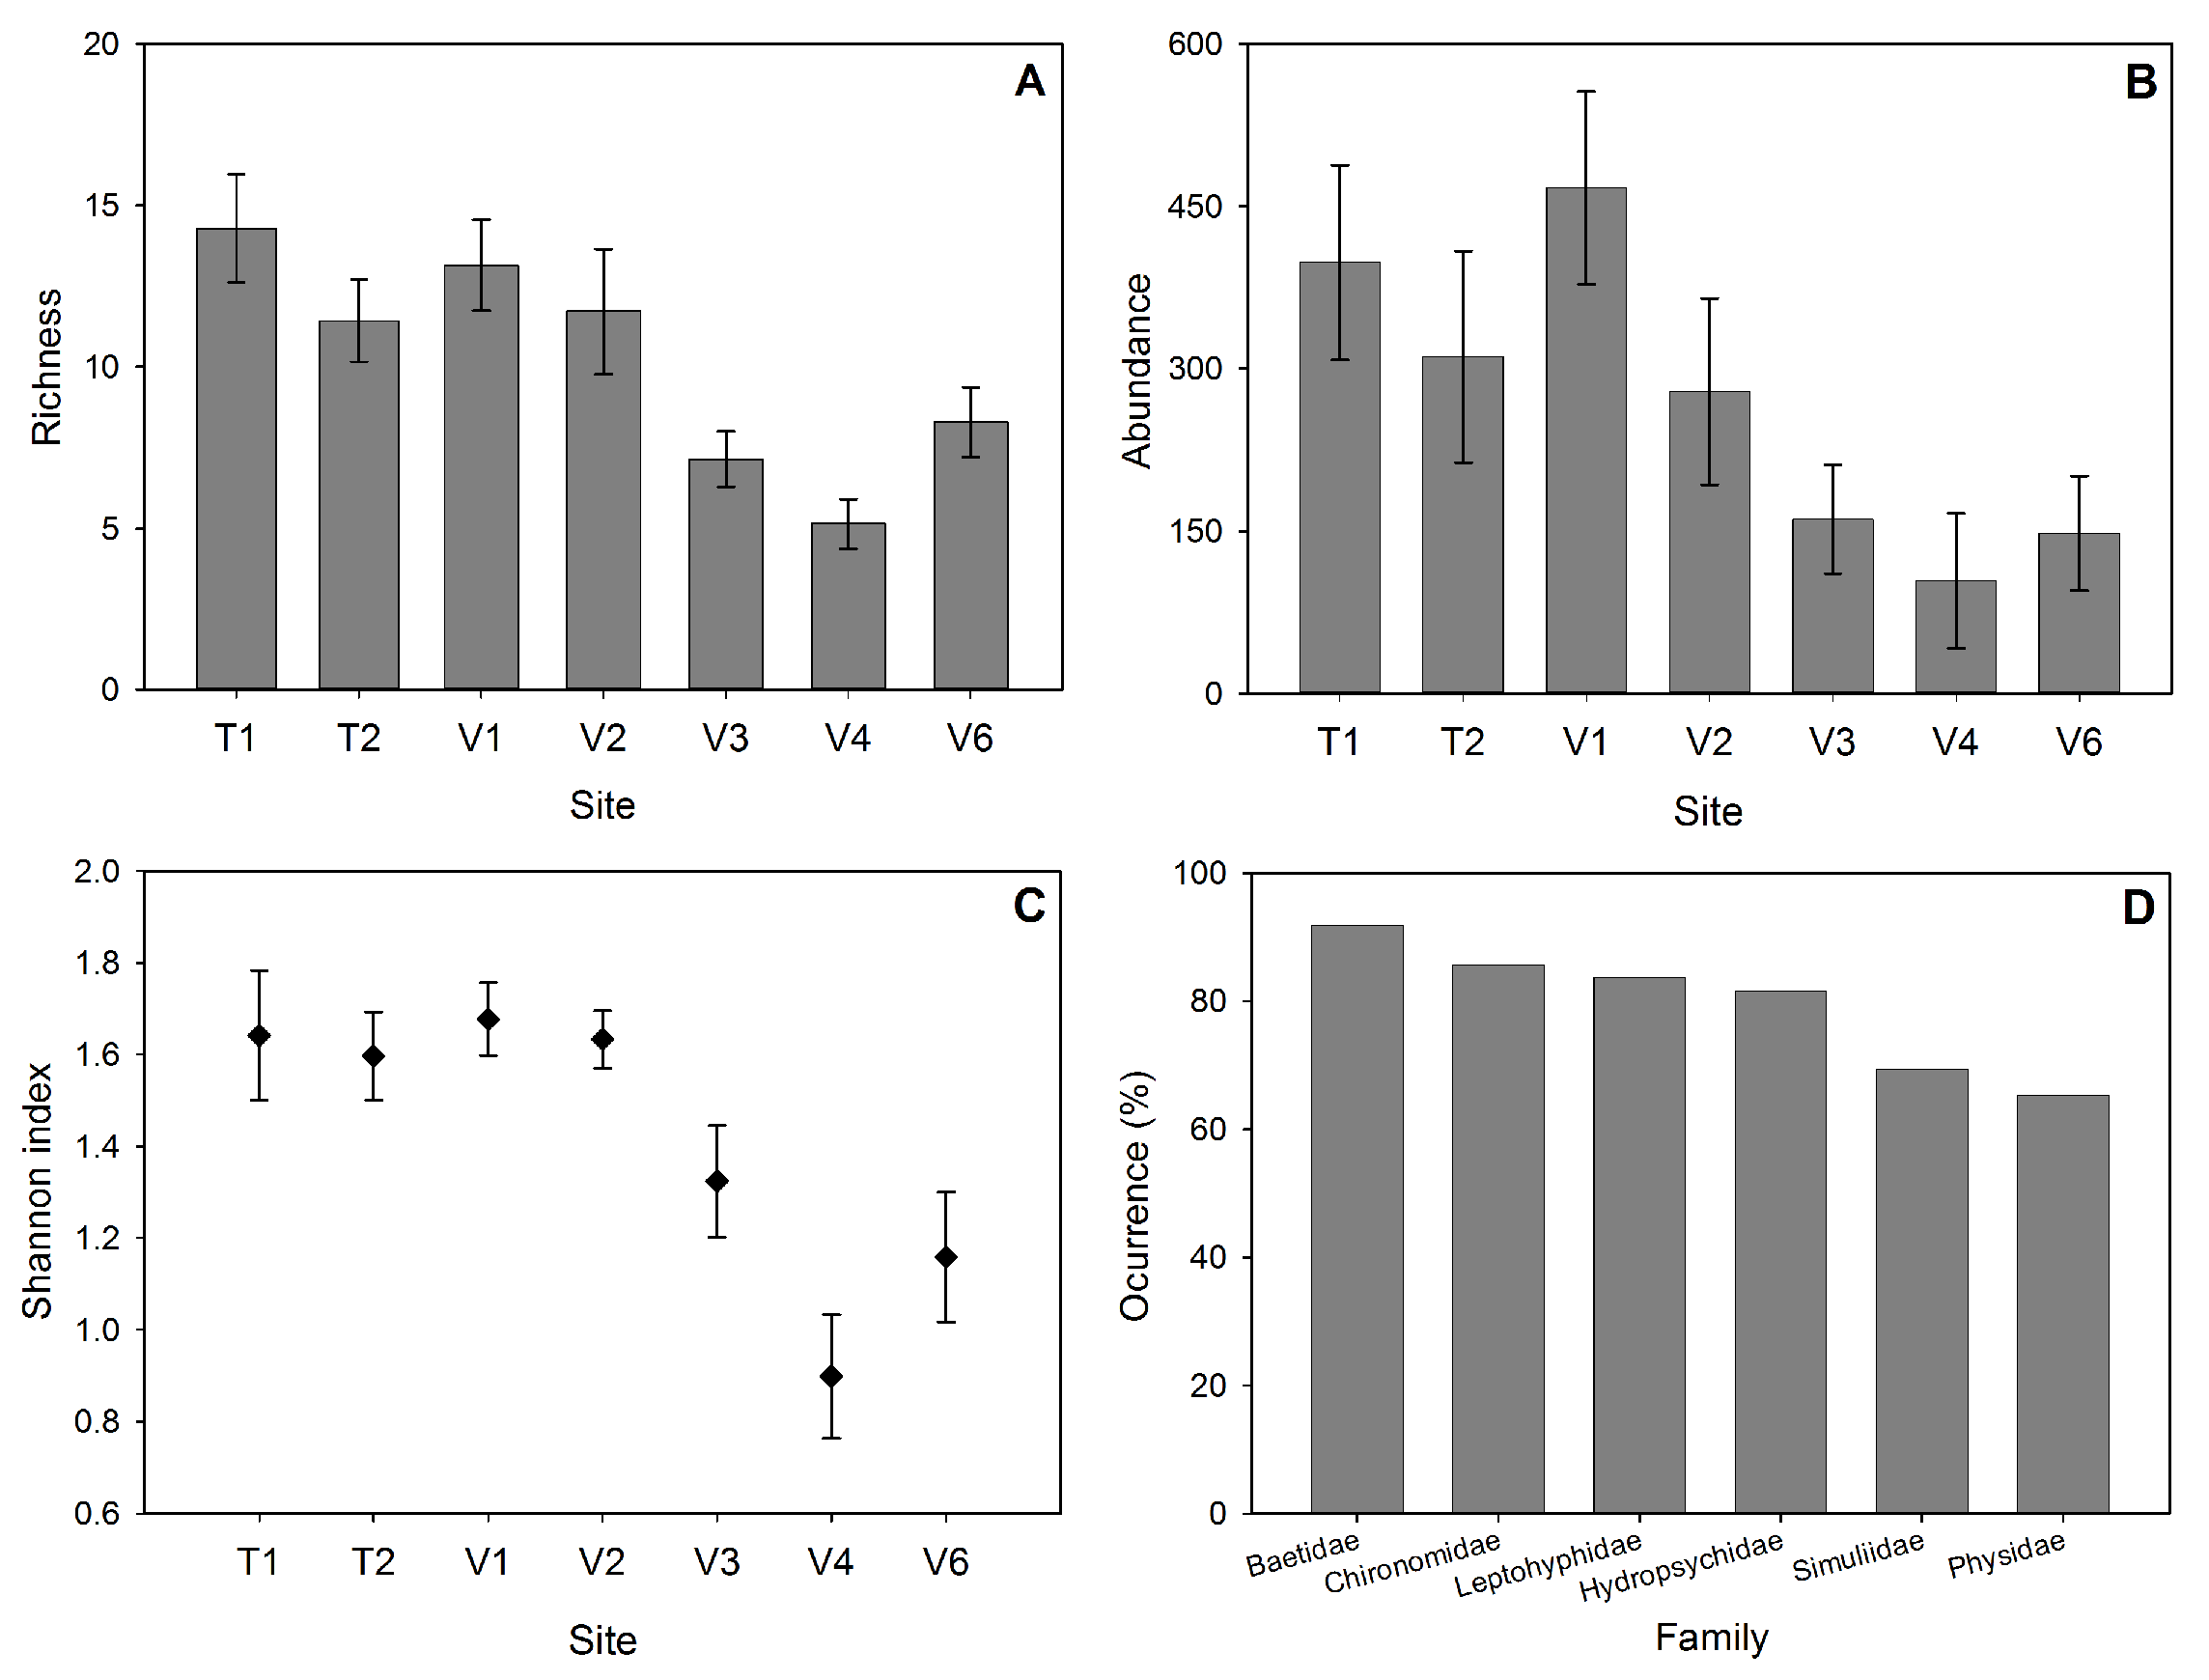
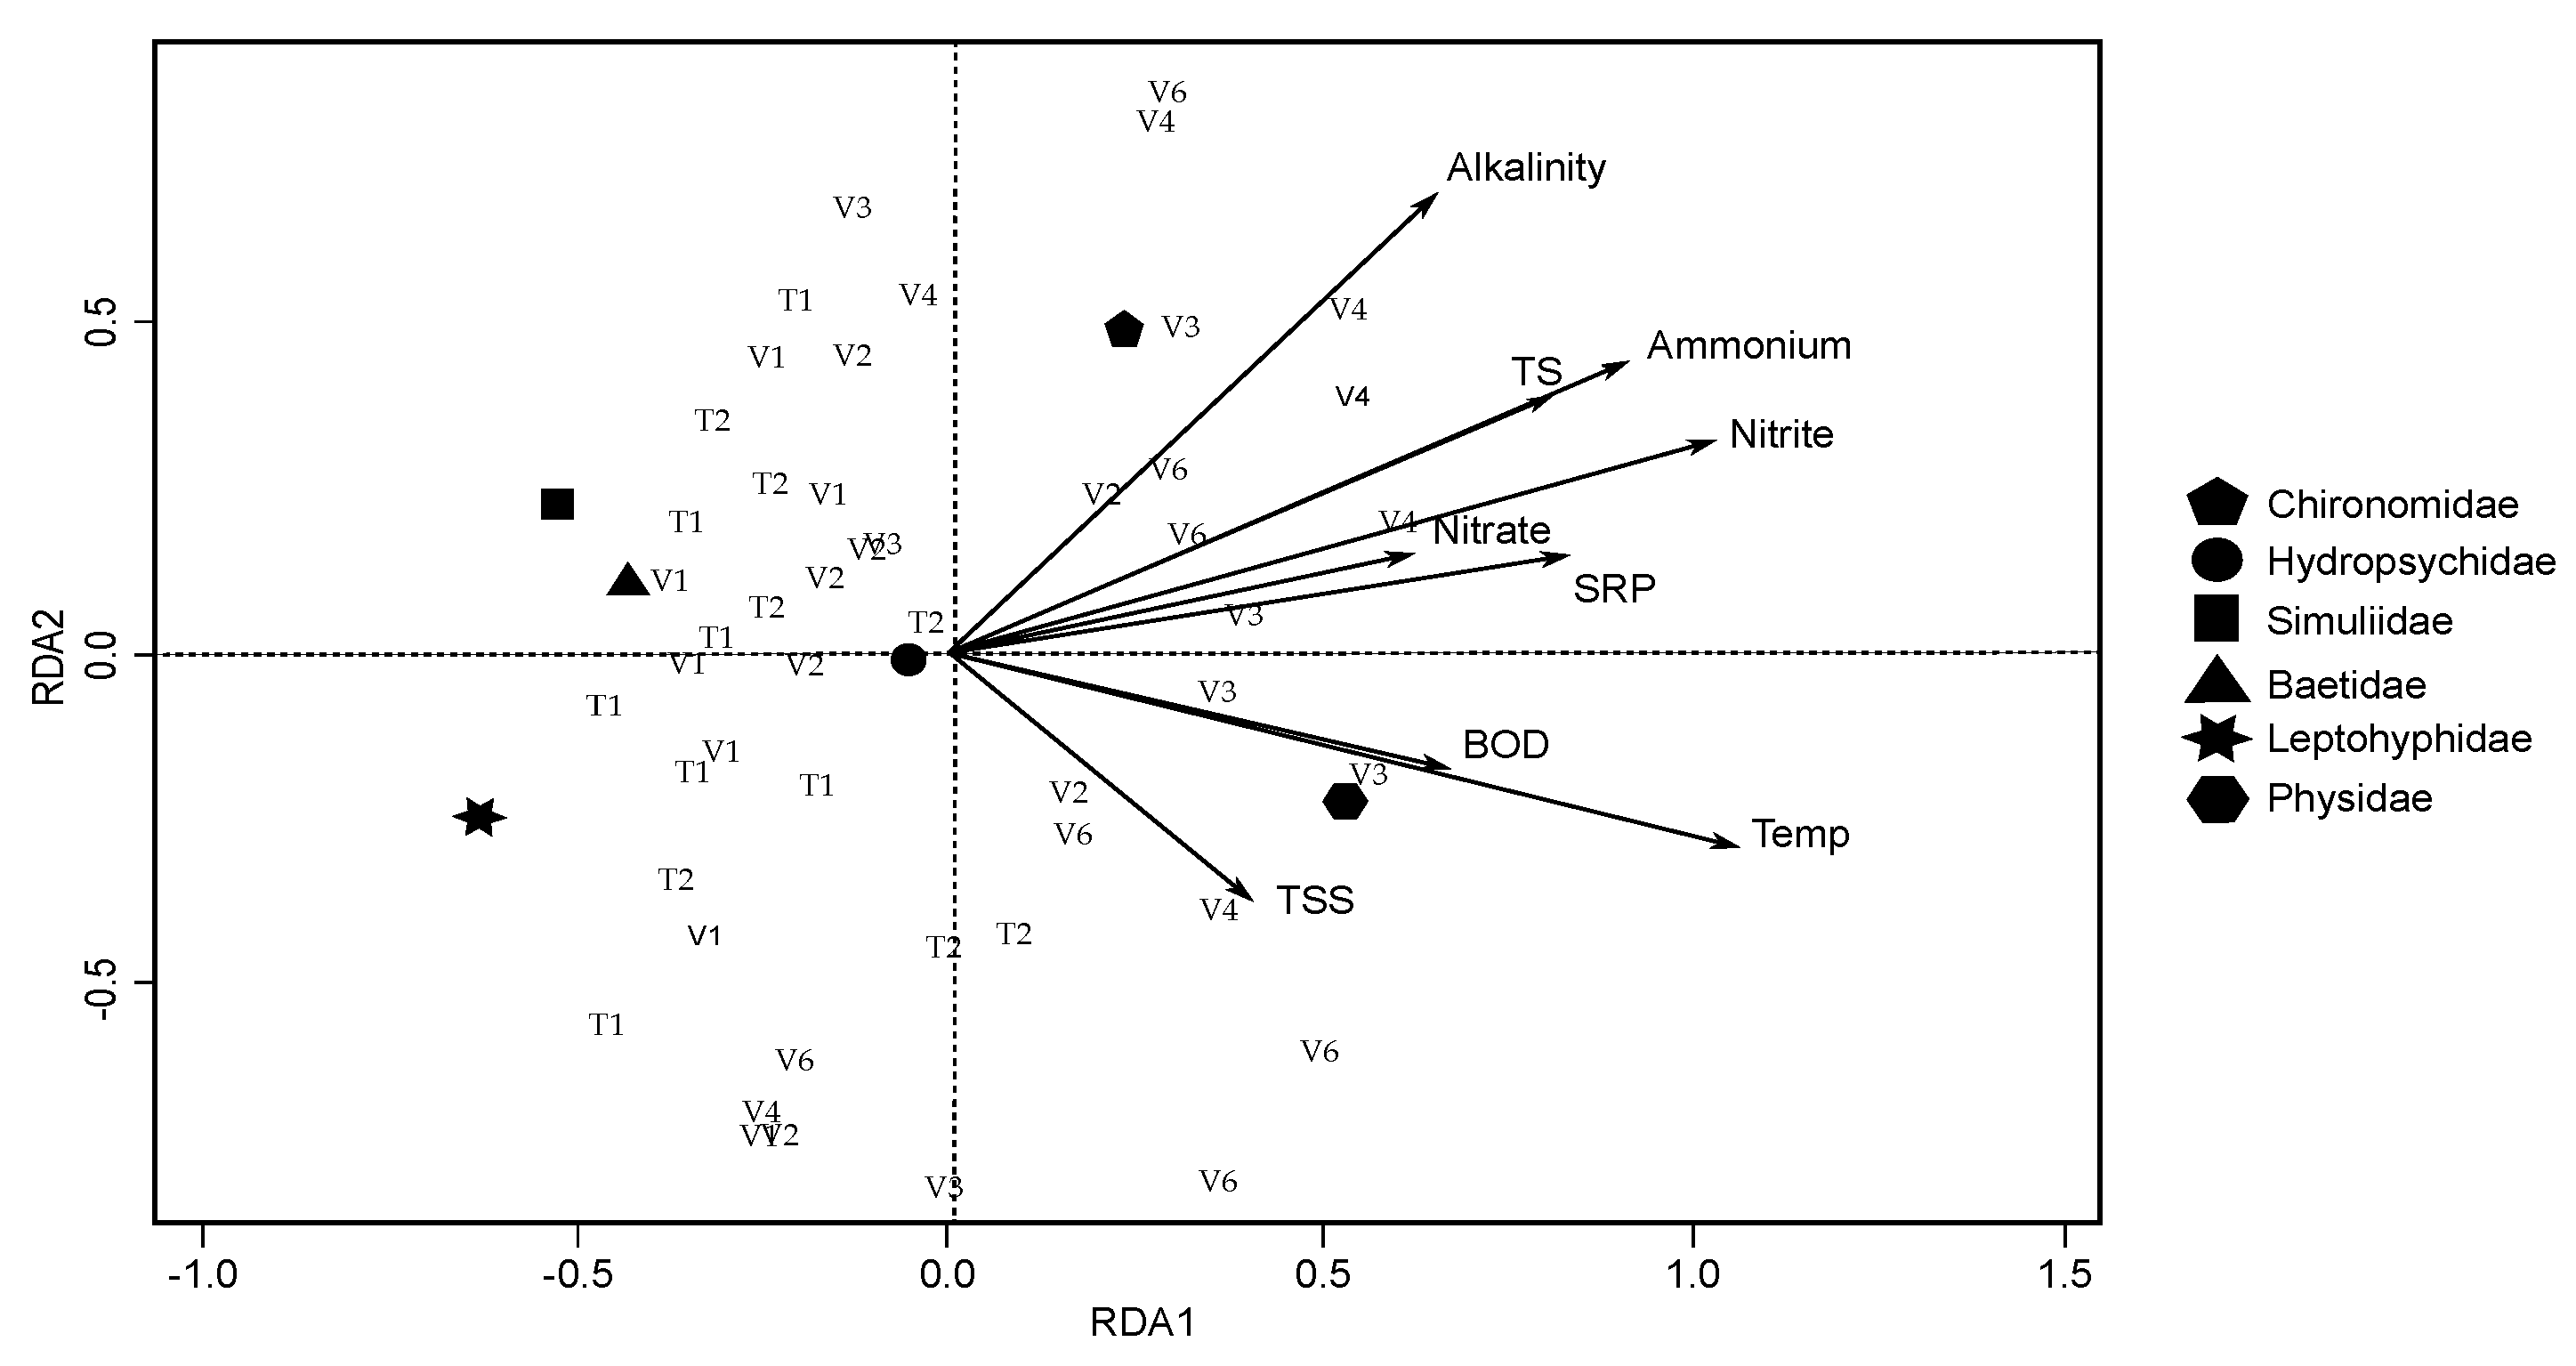
3.2. Benthic Macroinvertebrates

A total of 13,063 benthic macroinvertebrates were collected and classified into 47 families which correspond to 18 orders (Table A1). Insecta was the group with the greatest dominance (n = 11,576). Richness, abundance and Shannon index per sample site are showed in Figure 3. Sample site T1 presented the highest richness with 32 families identified; whereas the lowest richness was observed in site V4 with only 14 families. Average abundance ranged from 467 macroinvertebrates in sample site V1 to 104 in sample site V4. Total Shannon index was H = 2.10 and average diversity ranged from 1.68 (site V1) to 0.90 (site V4). Families with major occurrence were Physidae (65.3%), Simuliidae (69.4%), Leptohyphidae (83.7%), Hydropsychidae (81.6%), Chironomidae (85.7%) and Baetidae (91.5%). In general, diversity and average abundance of macroinvertebrates per family decreased downstream, regardless the slight improvement in richness in sample V6 in comparison to the previous site. This trend is consistent with the physicochemical data previously mentioned.
In tropical rivers, benthic macroinvertebrates community distribution can be affected by the complex dynamic of physical and chemical parameters [55,56]. In this study, families with major occurrence were significantly correlated with some these parameters (Figure 2). Negative moderate correlations were found between Leptohyphidae and TP ( τ = −0.523), Leptohyphidae and nitrite ( τ = −0.521), Baetidae and water temperature ( τ = −0.507), and Baetidae and TP ( τ = −0.506). Low negative significant correlations were presented between Simuliidae and water temperature, turbidity, TS, TSS, BOD, nitrite, TP, SRP and fluoride; Baetidae and turbidity, TS, TSS, BOD, ammonium, nitrite and SRP; Leptohyphidae and water temperature, conductivity, turbidity, TS, TSS, BOD, ammonium, SRP, fluoride, nitrate, sulphate, TC and EC. Nevertheless, Physidae presented low positive correlations with water temperature, conductivity and TDS. In addition, macroinvertebrate indexes also showed negative significant correlations. These were between diversity and ammonium ( τ = −0.450), diversity and nitrite ( τ = −0.363), diversity and TP ( τ = −0.368), richness and turbidity ( τ = −0.362), richness and TSS ( τ = −0.302), richness and TP ( τ = −0.335), richness and SRP ( τ = −0.302), abundance and turbidity ( τ = −0.508), abundance and TSS ( τ = −0.385), and abundance and TP ( τ = −0.330).
According to the RDA (Table 2) approximately 49.1% of the variance of benthic macroinvertebrate data is explained by the physical and chemical variables. The parameters that most influenced macroinvertebrates community were water temperature, nitrite, ammonium, SRP, TS, alkalinity, nitrate and TSS. The RDA biplot (Figure 4) shows that most of the families with the highest occurrence (Simuliidae, Leptohyphidae, Baetidae and Hydropsychidae) presented negative correlations with the degree of pollution. Particularly, there was a high influence of N-compounds in aquatic insects diversity. Their capacity to tolerate high nitrogen concentration can be limited [57,58] and when it increased the insects abundance decreased, even for families that can tolerate some degree of pollution. In summary, diversity of benthic macroinvertebrates community decreased as pollution increased.
Families with less pollution tolerance were found in the upstream samples. For instance, Hydrobiosidae which is usually found under good water quality conditions. However, the families with major occurrence were those who are able to tolerate different levels of pollution. Chironomidae, the most second abundant family in all the samples sites, has the capacity to survive under polluted and anoxic environments. This is likely to be consistent with our results due to, according to the RDA, it was positive correlated with most of the chemical parameters; but negatively correlated with DO. This family can remove up to 70 g of organic matter per m 2 day 1 [59], because of its biomass increases with nutrients concentration [60]. This characteristic and the fact that Costa Rica is a “hotspot” for this family [61], suggest that further investigation have to be done as this group of insects could be relevant for rivers self-depuration in the country. Hydropsychidae and Simuliidae were also present with high occurrence. Both are able to filter fine organic matter and they are usually found in moderate and high discharge, being abundant locally [62]. Despite these characteristics, these families along with Baetidae and Leptohyphidae, were less found where pollution increased. They presented negative correlation with water temperature and TSS. The increase in water temperature between site T1 and V6 (∼5 C) could be a affecting its distribution. In addition, it has been reported that abrasion and scouring by the increasing of suspended solids can affect macroinvertebrate community drift [63].
Physidae was also found in an important occurrence. This family showed a positive correlation with the temperature and BOD. Temperature seems to strongly influence its life cycle, when warmer environments foster a quicker growth [64]. Physidae also can feed on detritus [65], which could link them to areas with high BOD. This change in environmental conditions like the increase in the temperature and salinity may favour the prevalence of certain species of snails [64]. These pulmonate molluscs are also able to refresh the air from their cavity in the water surface [66]. This might be an advantage to stand in low oxygen levels and under certain pollution conditions.
No clear pattern was observed between the physicochemical variables and the Hydropsychidae family with the RDA. This could be associated with the taxonomic level employed, since its adequacy to track changes in different conditions depends on the species [67,68,69]. Therefore, it is necessary to study the different groups of macroinvertebrates at the genus or species level in order to better understand their role into water quality assessments. Finally, contrary to the trend of degradation downstream, sample site V6 showed some recovery signs. These were a small increase in diversity (H: 1.16), and a slight improvement in the quality index’s score. This may be associated with partial changes in the river structure, which increase the heterogeneity of micro environments [70] along with the DO increasing [57,71].

3.3. Water Quality Indexes

Results of the water quality indexes are presented in Table 3. According to the NSF-WQI, the water quality of the Virilla river is classified into two categories, “medium” and “good”. Their distribution was consistent with the grouping of the cluster analysis. These results are likely to be considered normal in rivers near the study area. For instance, Leandro et al. [23] and Mena-Rivera et al. [22] reported similar water quality classification using the NSF-WQI in different rivers and years in Costa Rica. In the other hand, the Dutch index showed “incipient” pollution in samples sites located at the top of the study area. Subsequently, from sample site V3 an increase in the index value was observed, resulting in higher levels of pollution. “Incipient”, “moderate” and “severe” are typical categories for rivers in areas with low to medium population density in the GAM [25].
BMWP-CR water quality scores also decreased downstream in the Virilla river. The highest average value was 71 in sample site T1, representing a “regular” condition. This condition is presented when the score is between 67 and 95. The lowest score was obtained in sample V4 with an average of 17. This score allowed a water quality classification as “bad” or “highly polluted”. BMWP-CR results were similar than NSF-WQI and the Dutch index, showing an almost identical trend in the water quality status. The NSF-WQI and the Dutch index pointed out that sample site V5 presented the worst condition in water quality. Nonetheless, the Dutch index better represented this condition, allowing a change into its classification to “severe”. On this site, the collection of macroinvertebrate samples was not possible.
Despite this interpretation, the applicability of water quality indexes could be limited. This is because of the number and characteristics of the parameters incorporated (robustness), and the index’s capacity to track changes under different spatial and temporal conditions (sensitivity). For instance, calculation of the NSF index is based on nine parameters including physical, chemical and microbiological indicators; while the Dutch index takes into account only three parameters (DO, BOD and ammonium). Nevertheless, the three water quality indexes employed in this study fairly represent the condition of the river, according to the trends previously mentioned. Nonetheless, the categorical classification used by each index is very different (both phrase and colour) and it may cause misinterpretation of the water quality by decision-makers. For example, Dutch index categorised site T2 as “incipient” pollution while the BMWP-CR as “bad” water quality. The disparate terms may influence the implementation of different mitigation efforts. Thus, the development of an integrative river health index for Costa Rica could lead into a more efficient and accurate monitoring tool for supporting management processes in the country.

4. Conclusions

Here, we reported useful information to support evidence-based decision making regarding water resources management in the Virilla river catchment in Costa Rica. High values of the physical, chemical and microbiological data were obtained. In addition, the benthic macroinvertebrate community was mainly affected by parameters related to point sources of pollution, such as wastewater discharges. Water quality decreased in the bottom of the study area, where industrialisation and urbanisation increases. Thus, better regulation of these sources of pollution, as well as the implementation of efficient sewerage and drainage systems should be addressed by local authorities.
The results of the water quality indexes established in the national legislation (Dutch index and BMWP-CR) were consistent; considering that there can not be a difference of two classes between the two indexes. However, the development of a more holistic water quality index have to be considered. Finally, the information presented here, as any water quality data in the country, can be useful for first implementations of numerical models, which would improve the efficiency estimation of current (e.g., septic tanks) and future wastewater treatment systems.

Author Contributions

C.G.-C., L.M.-R. and A.F.-S. conceived and designed the experiments; L.M.-R., O.V.-B. and A.R.-R. performed the experiments; L.M.-R. and O.V.-B. made the data analysis; L.M.-R., O.V.-B. and R.S.-G. wrote the paper. All the authors contributed to the manuscript.

Acknowledgments

This work was developed under an agreement between Universidad Nacional (grant SIA 0126-14) and the Empresa de Servicios Públicos de Heredia S.A. (www.esph-sa-com). The authors thank the Stable Isotope research group of Universidad Nacional who provided the meteorological data; Adrian González, Elberth Pizarro, Jonathan Vindas and Christian Nuñez for their colaboration in sample campaigns; and Cristina Benavides, Silvia Mau, Katherine Rodríguez, Marian López and Fabian Madrigal for their contribution in laboratory analyses and field work.

Conflicts of Interest

The authors declare no conflict of interest.

Appendix A

Figure A1. Spatial variation of some parameters in the study area (Average and standard error). (A) water temperature. (B) total solids (TS), turbidity and total dissolved solids (TDS). (C) dissolved oxygen. (D) pH and alkalinity. (E) sulphate and chloride. (F) total coliform and Escherichia coli.
Water 10 00845 g0a1
Figure A2. Dendogram of the sample sites based on the physical, chemical and microbiological data in the Virilla river.
Water 10 00845 g0a2
Table A1. Cumulative of families per sample site and occurrence of the macroinvertebrate data.
OrderFamilySample SiteOccurrence (%)
T1T2V1V2V3V4V6
AnnelidaOligochaeta370134531030.6
ArhynchobdellidaErpobdellidae888336273749.0
ArhynchobdellidaSalifidae351630622.4
BasommatophoraLymnaeidae00000012.0
BasommatophoraPlanorbidae00010014.1
BasommatophoraPhysidae92346262328839465.3
BlattariaBlaberidae10000002.0
ColeopteraCurculionidae00010014.1
ColeopteraDytiscidae10000014.1
ColeopteraDryopidae20410006.1
ColeopteraElmidae12000004.1
ColeopteraHydraenidae10000002.0
ColeopteraHydrophilidae00000114.1
ColeopteraLampyridae10000002.0
ColeopteraStaphylinidae649510432.7
ColeopteraPsephenidae001110004.1
DipteraCeratopogonidae40000006.1
DipteraChironomidae34358832468849350543085.7
DipteraEmpididae11020006.1
DipteraMuscidae51110101616.3
DipteraPsychodidae11139122926.5
DipteraSimuliidae9915953831042882669.4
DipteraStratiomyidae100000030.6
DipteraTipulidae50811008.2
EntomobryomorphaEntomobryidae00100014.1
EphemeropteraBaetidae370378409319133232191.8
EphemeropteraLeptohyphidae5999267003342381283.7
EphemeropteraLeptophlebiidae1768571121057.1
HemipteraBelostomatidae05000004.1
HemipteraCicadellidae03000004.1
HemipteraGuerridae10000002.0
HemipteraVeliidae1140200310.2
IsopodaAsellota00100002.0
LepidopteraPyralidae482100018.4
LittorinimorphaHydrobiidae00002014.1
OdonataCalopterygidae12109321032.7
OdonataCoenagrionidae334000322.4
OdonataLibellulidae403200016.3
RhynchobdellidaGlossiphoniidae06652945105226.5
TrichopteraGlossosomatidae3753601600036.7
TrichopteraHelicopsychidae00110004.1
TrichopteraHydrobiosidae22183600028.6
TrichopteraHydropsychidae15629316610924627581.6
TrichopteraHydroptilidae29240014.1
TricladidaPlanariidae20200004.1
TrombidiformesHydrachnidia01410004.1
VeneroidaSphaeriidae0190111112.2
Total of invertebrates identified278632702177194611287291027
Total of families identified33282930181425

References

  1. Massoud, M.A. Assessment of water quality along a recreational section of the Damour River in Lebanon using the water quality index. Environ. Monit. Assess. 2012, 184, 4151–4160. [Google Scholar] [CrossRef] [PubMed]
  2. Ha, P.T.T.; Kokutse, N.; Duchesne, S.; Villeneuve, J.P.; Bélanger, A.; Hien, H.N.; Toumbou, B.; Bach, D.N. Assessing and selecting interventions for river water quality improvement within the context of population growth and urbanization: A case study of the Cau River basin in Vietnam. Environ. Dev. Sustain. 2017, 19, 1701–1729. [Google Scholar] [CrossRef]
  3. Meybeck, M. Global analysis of river systems: From Earth system controls to Anthropocene syndromes. Philos. Trans. R. Soc. B Biol. Sci. 2003, 358, 1935–1955. [Google Scholar] [CrossRef] [PubMed]
  4. Meybeck, M. Riverine quality at the Anthropocene: Propositions for global space and time analysis, illustrated by the Seine River. Aquat. Sci. 2002, 64, 376–393. [Google Scholar] [CrossRef]
  5. Zhao, Y.; Zou, X.; Liu, Q.; Yao, Y.; Li, Y.; Wu, X.; Wang, C.; Yu, W.; Wang, T. Assessing natural and anthropogenic influences on water discharge and sediment load in the Yangtze River, China. Sci. Total Environ. 2017, 607–608, 920–932. [Google Scholar] [CrossRef] [PubMed]
  6. Vrebos, D.; Beauchard, O.; Meire, P. The impact of land use and spatial mediated processes on the water quality in a river system. Sci. Total Environ. 2017, 601–602, 365–373. [Google Scholar] [CrossRef] [PubMed]
  7. Da Rocha, M.P.; Dourado, P.L.R.; Cardoso, C.A.L.; Cândido, L.S.; Pereira, J.G.; de Oliveira, K.M.P.; Grisolia, A.B. Tools for monitoring aquatic environments to identify anthropic effects. Environ. Monit. Assess. 2018, 190, 61. [Google Scholar] [CrossRef] [PubMed]
  8. Hofstra, N.; Vermeulen, L.C. Impacts of population growth, urbanisation and sanitation changes on global human Cryptosporidium emissions to surface water. Int. J. Hyg. Environ. Health 2016, 219, 599–605. [Google Scholar] [CrossRef] [PubMed]
  9. Barrenha, P.I.I.; Tanaka, M.O.; Hanai, F.Y.; Pantano, G.; Moraes, G.H.; Xavier, C.; Awan, A.T.; Grosseli, G.M.; Fadini, P.S.; Mozeto, A.A. Multivariate analyses of the effect of an urban wastewater treatment plant on spatial and temporal variation of water quality and nutrient distribution of a tropical mid-order river. Environ. Monit. Assess. 2017, 190, 43. [Google Scholar] [CrossRef] [PubMed]
  10. Calvo-Brenes, G.; Mora-Molina, J. Evaluación y clasificación preliminar de la calidad del agua de la cuenca del río Tárcoles y el Reventazón Parte I: Análisis de la contaminación de cuatro ríos del área metropolitana. Rev. Tecnol. Marcha 2007, 20, 3–9. [Google Scholar]
  11. Katukiza, A.; Ronteltap, M.; van der Steen, P.; Foppen, J.; Lens, P. Quantification of microbial risks to human health caused by waterborne viruses and bacteria in an urban slum. J. Appl. Microbiol. 2014, 116, 447–463. [Google Scholar] [CrossRef] [PubMed]
  12. Hristovski, K.D.; Pacemska-Atanasova, T.; Olson, L.W.; Markovski, J.; Mitev, T. Potential health implications of water resources depletion and sewage discharges in the Republic of Macedonia. J. Water Health 2016, 14, 682–691. [Google Scholar] [CrossRef] [PubMed]
  13. Kim, M.; Boithias, L.; Cho, K.H.; Silvera, N.; Thammahacksa, C.; Latsachack, K.; Rochelle-Newall, E.; Sengtaheuanghoung, O.; Pierret, A.; Pachepsky, Y.A.; Ribolzi, O. Hydrological modeling of Fecal Indicator Bacteria in a tropical mountain catchment. Water Res. 2017, 119, 102–113. [Google Scholar] [CrossRef] [PubMed]
  14. Feris, L. The Human Right to Sanitation: A Critique on the Absence of Environmental Considerations. Rev. Eur. Comp. Int. Environ. Law 2015, 24, 16–26. [Google Scholar] [CrossRef]
  15. Bower, K.M. Water supply and sanitation of Costa Rica. Environ. Earth Sci. 2014, 71, 107–123. [Google Scholar] [CrossRef]
  16. Cantor, J.; Krometis, L.A.; Sarver, E.; Cook, N.; Badgley, B. Tracking the downstream impacts of inadequate sanitation in central Appalachia. J. Water Health 2017, 15, 580–590. [Google Scholar] [CrossRef] [PubMed]
  17. Biswas, A.; Tortajada, C.; Braga, B.; Rodriguez, D. Water Quality Management in the Americas. In Water Resources Development and Management; Springer: Berlin/Heidelberg, Germany, 2006. [Google Scholar]
  18. Mena-Rivera, L.; Quirós-Vega, J. Assessment of drinking water suitability in low income rural areas: A case study in Sixaola, Costa Rica. J. Water Health 2018. [Google Scholar] [CrossRef]
  19. Herrera, J. Informe Estado de la Nación en Desarrollo Humano Sostenible; Technical Report; Programa Estado de la Nación: San José, Costa Rica, 2017. [Google Scholar]
  20. MINAE; AyA; MS. Política Nacional de Saneamiento en Aguas Residuales 2016–2045; AyA; MINAE; MS: San José, Costa Rica, 2016; pp. 1–100. [Google Scholar]
  21. Golfieri, B.; Surian, N.; Hardersen, S. Towards a more comprehensive assessment of river corridor conditions: A comparison between the Morphological Quality Index and three biotic indices. Ecol. Indic. 2018, 84, 525–534. [Google Scholar] [CrossRef]
  22. Mena-Rivera, L.; Salgado-Silva, V.; Benavides-Benavides, C.; Coto-Campos, J.M.; Swinscoe, T.H. Spatial and Seasonal Surface Water Quality Assessment in a Tropical Urban Catchment: Burío River, Costa Rica. Water 2017, 9, 558. [Google Scholar] [CrossRef]
  23. Leandro, H.; Coto, J.; Salgado, V. Calidad del agua de los ríos de la microcuenca IV del Río Virilla. Uniciencia 2010, 24, 69–74. [Google Scholar]
  24. Herrera-Murillo, J.; Rodríguez-Román, S.; Solís-Torres, L.; Castro-Delgado, F. Aplicación de técnicas quimiométricas para clasificar la calidad de agua superficial de la microcuenca del río Bermúdez en Heredia, Costa Rica. Rev. Tecnol. Marcha 2009, 22, 75–85. [Google Scholar]
  25. Calvo-Brenes, G.; Mora-Molina, J. Evaluación y clasificación preliminar de la calidad de agua de la cuenca del río Tárcoles y el Reventazón Parte III: Calidad de cuerpos receptores de agua, según el Sistema Holandés de Valoración. Rev. Tecnol. Marcha 2007, 20, 59–67. [Google Scholar]
  26. Calvo-Brenes, G.; Mora-Molina, J. Análisis de la calidad de varios cuerpos de agua superficiales en el GAM y la Península de Osa utilizando el Índice Holandés. Rev. Tecnol. Marcha 2012, 25, 37–44. [Google Scholar] [CrossRef]
  27. Guevara, M. Insectos acuáticos y calidad del agua en la cuenca y embalse del río Peñas Blancas, Costa Rica. Rev. Biol. Trop. 2011, 59, 635–654. [Google Scholar] [CrossRef]
  28. Perrin, J.L.; Salles, C.; Bancon-Montigny, C.; Raïs, N.; Chahinian, N.; Dowse, L.; Rodier, C.; Tournoud, M.G. Comparison of index systems for rating water quality in intermittent rivers. Environ. Monit. Assess. 2018, 190, 70. [Google Scholar] [CrossRef] [PubMed]
  29. Singh, P.K.; Saxena, S. Towards developing a river health index. Ecol. Indic. 2018, 85, 999–1011. [Google Scholar] [CrossRef]
  30. Meybeck, M. Looking for water quality. Hydrol. Process. 2005, 19, 331–338. [Google Scholar] [CrossRef]
  31. APHA; AWWA; WEF. Standard Methods for the Examination of Water & Wastewater; American Public Health Association: Washington, DC, USA, 2005. [Google Scholar]
  32. Woomer, P.L. Most Probable Number Counts. In Methods of Soil Analysis: Part 2—Microbiological and Biochemical Properties; SSSA Book Series SV-5.2; Soil Science Society of America: Madison, WI, USA, 1994; pp. 59–79. [Google Scholar]
  33. Springer, M.; Ramírez, A.; Hanson, P. Macroinvertebrados de agua dulce de Costa Rica I. Rev. Biol. Trop. 2010, 58, 93–136. [Google Scholar]
  34. MINAE. Reglamento para la Evaluación y Clasificación de la Calidad de Cuerpos de Agua Superficiales; Decreto, No. 33903; La Gaceta: San José, Costa Rica, 2007; pp. 1–21. [Google Scholar]
  35. R Core Team. R: A Language and Environment for Statistical Computing; R Foundation for Statistical Computing: Vienna, Austria, 2017. [Google Scholar]
  36. Lee, L. NADA: Nondetects and Data Analysis for Environmental Data; R Package Version 1.6-1; R Foundation for Statistical Computing: Vienna, Austria, 2017. [Google Scholar]
  37. Oksanen, J.; Blanchet, F.G.; Friendly, M.; Kindt, R.; Legendre, P.; McGlinn, D.; Minchin, P.R.; O’Hara, R.B.; Simpson, G.L.; Solymos, P.; et al. Vegan: Community Ecology Package; R Package Version 2.4-4; R Foundation for Statistical Computing: Vienna, Austria, 2017. [Google Scholar]
  38. Helsel, D.R. Statistics for Censored Environmental Data Using Minitab® and R; John Wiley & Sons, Inc.: Hoboken, NJ, USA, 2011. [Google Scholar] [CrossRef]
  39. Croux, C.; Dehon, C. Influence functions of the Spearman and Kendall correlation measures. Stat. Methods Appl. 2010, 19, 497–515. [Google Scholar] [CrossRef] [Green Version]
  40. Ward, J.H. Hierarchical Grouping to Optimize an Objective Function. J. Am. Stat. Assoc. 1963, 58, 236–244. [Google Scholar] [CrossRef] [Green Version]
  41. Shannon, C.E.; Weaver, W. The mathematical theory of communication. Bell Syst. Tech. J. 1949, 27, 379–423. [Google Scholar] [CrossRef]
  42. Legendre, P.; Legendre, L. Numerical Ecology; Developments in Environmental Modelling; Elsevier: Amsterdam, The Netherlands, 2012. [Google Scholar]
  43. Legendre, P.; Gallagher, E.D. Ecologically meaningful transformations for ordination of species data. Oecologia 2001, 129, 271–280. [Google Scholar] [CrossRef] [PubMed] [Green Version]
  44. Ter Braak, C.J.F.; Verdonschot, P.F.M. Canonical correspondence analysis and related multivariate methods in aquatic ecology. Aquat. Sci. 1995, 57, 255–289. [Google Scholar] [CrossRef]
  45. Beyene, A.; Addis, T.; Kifle, D.; Legesse, W.; Kloos, H.; Triest, L. Comparative study of diatoms and macroinvertebrates as indicators of severe water pollution: Case study of the Kebena and Akaki rivers in Addis Ababa, Ethiopia. Ecol. Indic. 2009, 9, 381–392. [Google Scholar] [CrossRef]
  46. Narangarvuu, D.; Hsu, C.B.; Shieh, S.H.; Wu, F.C.; Yang, P.S. Macroinvertebrate assemblage patterns as indicators of water quality in the Xindian watershed, Taiwan. J. Asia-Pac. Entomol. 2014, 17, 505–513. [Google Scholar] [CrossRef]
  47. Brown, R.M.; McClelland, R.M.; Deininger, R.; Tozer, R. A Water Quality Index—Do We Dare? Water Sew. Works 1970, 117, 339–343. [Google Scholar]
  48. Herrera, J.; Rodríguez, S.; Rojas, J.F.; Herrera, É.; Chaves, M. Variación temporal y espacial de la calidad de las aguas superficiales en la subcuenca del río Virilla (Costa Rica) entre 2006 y 2010. Rev. Cienc. Ambient. 2013, 45. [Google Scholar] [CrossRef] [Green Version]
  49. Chapman, D. Water Quality Assessments; Taylor & Francis: Abingdon, UK, 1992; Volume 2, p. 609. [Google Scholar] [CrossRef]
  50. U.S. Environmental Protection Agency. Quality Criteria for Water; United States Environmental Protection Agency: Washington, DC, USA, 1986; p. 447.
  51. Nnane, D.E.; Ebdon, J.E.; Taylor, H.D. Integrated analysis of water quality parameters for cost-effective faecal pollution management in river catchments. Water Res. 2011, 45, 2235–2246. [Google Scholar] [CrossRef] [PubMed]
  52. World Health Organization. Guidelines for Drinking-Water Quality, 4th ed.; WHO: Geneva, Switzerland, 2011; p. 564. [Google Scholar]
  53. Davies, G.; McIver, L.; Kim, Y.; Hashizume, M.; Iddings, S.; Chan, V. Water-Borne Diseases and Extreme Weather Events in Cambodia: Review of Impacts and Implications of Climate Change. Int. J. Environ. Res. Public Health 2014, 12, 191–213. [Google Scholar] [CrossRef] [PubMed] [Green Version]
  54. Giri, S.; Qiu, Z. Understanding the relationship of land uses and water quality in Twenty First Century: A review. J. Environ. Manag. 2016, 173, 41–48. [Google Scholar] [CrossRef] [PubMed] [Green Version]
  55. Gutiérrez-Fonseca, P.E.; Ramí­rez, A.; Pringle, C.M. Large-scale climatic phenomena drive fluctuations in macroinvertebrate assemblages in lowland tropical streams, Costa Rica: The importance of ENSO events in determining long-term (15y) patterns. PLoS ONE 2018, 13, 1–24. [Google Scholar] [CrossRef] [PubMed]
  56. Ometo, J.P.H.B.; Martinelli, L.A.; Ballester, M.V.; Gessner, A.; Krusche, A.V.; Victoria, R.L.; Williams, M. Effects of land use on water chemistry and macroinvertebrates in two streams of the Piracicaba river basin, south-east Brazil. Freshw. Biol. 2000, 44, 327–337. [Google Scholar] [CrossRef]
  57. Dodds, W.K.; Whiles, M.R. Freshwater Ecology: Concepts and Environmental Applications of Limnology; Aquatic Ecology; Elsevier Science: Amsterdam, The Netherland, 2010. [Google Scholar]
  58. UNEP/WHO. Water Quality Monitoring—A Practical Guide to the Design and Implementation of Freshwater Quality Studies and Monitoring Programmes; WHO: Geneva, Switzerland, 1996; Volume 2. [Google Scholar]
  59. Sokolova, N.Y.; Paliy, A.V.; Izvekova, B.I. Biology of Chironomus piger Str. (Diptera: Chironomidae) and its role in the self-purification of a river. Neth. J. Aquat. Ecol. 1992, 26, 509–512. [Google Scholar] [CrossRef]
  60. Alonso, R.; Pringle, C.M. Fast growth and turnover of chironomid assemblages in response to stream phosphorus levels in a tropical lowland landscape. Limnol. Oceanogr. 2006, 51, 189–196. [Google Scholar] [CrossRef] [Green Version]
  61. Ferrington, L.C. Global diversity of non-biting midges (Chironomidae; Insecta-Diptera) in freshwater. In Freshwater Animal Diversity Assessment; Balian, E.V., Lévêque, C., Segers, H., Martens, K., Eds.; Springer: Dordrecht, The Netherlands, 2008; pp. 447–455. [Google Scholar] [CrossRef]
  62. Merritt, R.W.; Cummins, K.W. An Introduction to the Aquatic Insects of North America; Kendall/Hunt Publishing Company: Dubuque, IA, USA, 1996. [Google Scholar]
  63. Bilotta, G.S.; Brazier, R.E. Understanding the influence of suspended solids on water quality and aquatic biota. Water Res. 2008, 42, 2849–2861. [Google Scholar] [CrossRef] [PubMed]
  64. Zukowski, S.; Walker, K.F. Freshwater snails in competition: Alien Physa acuta (Physidae) and native Glyptophysa gibbosa (Planorbidae) in the River Murray, South Australia. Mar. Freshw. Res. 2009, 60, 999–1005. [Google Scholar] [CrossRef]
  65. Smith, D.G.; Pennak, R.W. Pennak’s Freshwater Invertebrates of the United States: Porifera to Crustacea; Wiley: Hoboken, NJ, USA, 2001. [Google Scholar]
  66. Thorp, J.H.; Covich, A.P. Ecology and Classification of North American Freshwater Invertebrates; Academic Press: Cambridge, MA, USA, 2001. [Google Scholar]
  67. Lenat, D.R.; Resh, V.H. Taxonomy and stream ecology—The benefits of genus- and species-level identifications. J. N. Am. Benthol. Soc. 2001, 20, 287–298. [Google Scholar] [CrossRef]
  68. Bowman, M.F.; Bailey, R.C. Does taxonomic resolution affect the multivariate description of the structure of freshwater benthic macroinvertebrate communities? Can. J. Fish. Aquat. Sci. 1997, 54, 1802–1807. [Google Scholar] [CrossRef]
  69. Jackson, J.K.; Sweeney, B.W. Egg and Larval Development Times for 35 Species of Tropical Stream Insects from Costa Rica. J. N. Am. Benthol. Soc. 1995, 14, 115–130. [Google Scholar] [CrossRef]
  70. Wenger, S.J.; Roy, A.H.; Jackson, C.R.; Bernhardt, E.S.; Carter, T.L.; Filoso, S.; Gibson, C.A.; Hession, W.C.; Kaushal, S.S.; Martí, E.; et al. Twenty-six key research questions in urban stream ecology: An assessment of the state of the science. J. N. Am. Benthol. Soc. 2009, 28, 1080–1098. [Google Scholar] [CrossRef]
  71. Allan, J.D.; Castillo, M.M. Stream Ecology: Structure and Function of Running Waters, 2nd ed.; Springer: Dordrecht, The Netherlands, 2007. [Google Scholar] [CrossRef]
Figure 1. Study area in the Virilla river sub-catchment: including sample sites and land use.
Water 10 00845 g001
Figure 2. Kendall’s Tau correlation diagram of the water quality parameters in the Virilla river. (Crosses indicate no statistical significance, p > 0.05).
Water 10 00845 g002
Figure 3. Benthic macroinverbrate indexes per site in the Virilla river. (A) Richness. (B) Abundance. (C) Shannon index. (D) occurrence of major families.
Water 10 00845 g003
Figure 4. Biplot of the RDA results in the study area, including water quality variables and sample sites.
Water 10 00845 g004
Table 1. Summary of the physical, chemical and microbiological parameters in the Virilla river.
ParameterUnitsAverageMinimumMaximumSD
Temperature C19.815.228.22.85
pH-7.696.698.750.35
Conductivity μ S/cm1833740894.9
DO%81.821.6113.11.35
TurbidityNTU10.591.4166.5313.8
TSmg/L1704854389.4
TDSmg/L1371131264.5
TSS *mg/L30<1382223
Alkalinitymg/L CaCO 3 81.512.226457.2
BOD *mg/L O 2 10.15<2206.88.06
Ammonium *mg/L N-NH 4 + 1.050<0.079.3002.88
Nitrite *mg/L N-NO 2 0.1243<0.0120.92600.59
Nitratemg/L N-NO 3 1.9540.0478.5461.78
TP *mg/L0.435<0.023.5200.71
SRP *mg/L0.350<0.023.7060.69
Fluoride *mg/L0.106<0.0430.2700.07
Chloridemg/L7.750.9525.455.79
Sulphatemg/L9.551.0222.435.39
Total coliformMPN/100 mL7.80 × 10 6 21.40 × 10 8 2.21 × 10 7
Escherichia coliMPN/100 mL4.42 × 10 6 21.07 × 10 8 1.41 × 10 7
DO: dissolved oxygen; TS: total solids; TDS: total dissolved solids; TSS: total suspended solids; BOD: biochemical oxygen demand; TP: total phosphate; SRP: soluble reactive phosphorus; NTU: nephelometric turbidity units; MPN: most probable number. *: calculated using the Maximum Likelihood Estimation method.
Table 2. Redundancy analysis (RDA) results showing the variance of the macroinvertebrate data explained by canonical axes and explanatory variables.
Axes and VariablesExplained Variation (%)Pseudo-Fp-Value
Canonical axes
First axis32.326.60.001 *
Second axis10.78.80.001 *
All axes49.14.20.001 *
Explanatory variables
Temperature−70.918.50.005 **
Nitrite−64.917.20.005 **
Ammonium−64.313.00.005 **
SRP−63.39.90.005 **
TS−62.69.80.005 **
Alkalinity−59.87.80.005 **
Nitrate−61.15.20.005 **
TSS−57.83.40.005 **
* p < 0.01; ** p < 0.05.
Table 3. Average of water quality indexes per sample site in the Virilla river (standard error in parenthesis).
SiteNSF-WQIDutch IndexBMWP-CR
AverageClassification *AverageClassification **AverageClassification *
T173 (0.8)Good5 (0.3)Incipient71 (7.2)Regular
T273 (1.1)Good5 (0.2)Incipient54 (6.5)Bad
V174 (1.3)Good5 (0.3)Incipient55 (7.2)Bad
V271 (0.8)Good6 (0.4)Incipient50 (10)Bad
V369 (1.2)Medium7 (0.5)Moderate28 (3.4)Bad, highly polluted
V464 (2.7)Medium9 (1.0)Moderate17 (3.5)Bad, highly polluted
V563 (2.2)Medium10 (0.8)Severe--
V665 (3.4)Medium9 (0.5)Moderate28 (4.1)Bad, highly polluted
NFS-WQI: National Sanitation Foundation water quality index; BMWP-CR: Biological Monitoring Working Party modified to Costa Rica. * in terms of water quality; ** in terms of pollution.

