Assessing Vegetation Response to Soil Moisture Fluctuation under Extreme Drought Using Sentinel-2


1
Centre for Water, Communities & Resilience, Department of Geography & Environmental Management, Faculty of Environment & Technology, University of the West of England, Bristol BS16 1QY, UK
2
Department of Engineering, Design and Mathematics, Faculty of Environment & Technology, University of the West of England, Bristol BS16 1QY, UK
*
Author to whom correspondence should be addressed.
Water 2018, 10(7), 838; https://doi.org/10.3390/w10070838
Submission received: 31 May 2018
/
Revised: 12 June 2018
/
Accepted: 21 June 2018
/
Published: 24 June 2018
(This article belongs to the Special Issue Applications of Remote Sensing and GIS in Hydrology)
Abstract
:The aim of this study was to determine the extent to which Sentinel-2 Normalised Difference Vegetation Index (NDVI) reflects soil moisture conditions, and whether this product offers an improvement over Landsat-8. Based on drought exposure, cloud-free imagery availability, and measured soil moisture, five sites in the Southwestern United States were selected. These sites, normally dry to arid, were in various states of drought. A secondary focus was therefore the performance of the NDVI under extreme conditions. Following supervised classification, the NDVI values for one-kilometre radius areas were calculated. Sentinel-2 NDVI variants using Spectral Bands 8 (10 m spatial resolution), 5, 6, 7, and 8A (20 m spatial resolution) were calculated. Landsat-8 NDVI was calculated at 30 m spatial resolution. Pearson correlation analysis was undertaken for NDVI against moisture at various depths. To assess the difference in correlation strength, a principal component analysis was performed on the combination of all bands and the combination of the new red-edge bands. Performance of the red-edge NDVI against the standard near infrared (NIR) was then evaluated using a Steiger comparison. No significant correlations between Landsat-8 NDVI and soil moisture were found. Significant correlations at depths of less than 30 cm were present between Sentinel-2 NDVI and soil moisture at three sites. The remaining two sites were characterised by low vegetation cover, suggesting a cover threshold of approximately 30–40% is required for a correlation to be present. At all sites of significant positive moisture to NDVI correlation, the linear combination of the red-edge bands produced stronger correlations than the poorer spectral but higher spatial resolution band. NDVI calculated using the higher spectral resolution bands may therefore be of greater use in this context than the higher spatial resolution option. Results suggest potential for the application of Sentinel-2 NDVI in soil moisture monitoring, even in extreme environments. To the best of our knowledge, this paper represents the first study of this kind using Sentinel-2.
1. Introduction
Drought is a pervasive global hazard that considerably impacts on both human and natural systems [1,2]. Economically significant and extended droughts have occurred in several regions, such as Australia (1995–2009), Brazil (2012–2015), U.S. (2000–2016), Southern Africa (2015–2017), China (2007–2012), and the Mediterranean and Middle East (2007–2010) [3,4,5,6,7,8,9,10,11,12]. Climate models suggest that for many locations the frequency, duration, and severity of droughts are likely to increase due to rising temperatures and changes to the amount, intensity, and seasonal distribution of precipitation, with consequent impacts to local and regional hydrology and dependent economic systems [13]. Effective drought monitoring and impact mitigation is therefore an urgent research priority [14].
Remote sensing methods and products are well established in the field of drought monitoring. Multispectral indices such as the Enhanced Vegetation Index (EVI), Evaporative Stress Index (ESI), Vegetation Condition Index (VCI), Vegetation Health Index (VHI), and the Soil Adjusted Vegetation Index (SAVI), have been used to assess drought. In particular, the Normalised Difference Vegetation Index (NDVI) has been central to regional scale drought monitoring. The NDVI is a key variable in many of the indices listed above and is commonly applied in drought assessment due to the value of the index in detecting photosynthetically active plant material, from which plant stress can be inferred when the available moisture within the root zone is depleted [15,16,17]. For this reason, the NDVI is also a good indicator of agricultural drought and was the indicator selected in this study. Agricultural or soil moisture drought refers to a deficit in soil moisture available for vegetation, driven by meteorological drought [13,18]. Persistent soil moisture drought may develop into hydrological drought where flow in rivers and aquifers decreases, with consequent impacts to ecosystems as well as managed water resource systems. Some refer to this as socio-economic drought, but even relatively short-lived agricultural drought can have severe economic impacts. As such, improving the monitoring of soil moisture drought is important not only for mitigation of agricultural impacts, but also as an early warning system for hydrological and socio-economic drought [13,19].
In the 20th century, agricultural drought monitoring relied on often patchy and site-based meteorological indices [13], which principally included rainfall and evaporative demand. Developments in remote sensing science in the latter part of the 20th century enabled significant advances in drought monitoring based on inferring vegetation condition and other hydrological variables using multispectral or radar satellite data [20]. Previous approaches were significantly limited by the lack in continuous spatio-temporal meteorological observations [21,22]. The main benefit of a remote sensing approach for drought monitoring is that it provides a cost effective method to assess key variables related to drought over larger temporal and spatial scales than was previously possible [13,20,23,24].
NDVI time series calculated from a range of sensors, such as NOAA-AVHRR, Terra/Aqua-MODIS, and PROBA-V, have been widely used in drought research [25,26,27]. The value of these platforms is derived from their frequent observations, wide swath, and multispectral/thermal instruments that enable rapid, regional scale coverage of trends in vegetation condition. Some of these datasets underpin national-scale drought monitoring, such as the use of VegDRI in the USA Drought Monitor [28], and MODIS NDVI in the African Flood and Drought Monitor [29]. Evidence is emerging that NDVI does reflect changing soil moisture conditions. For example, NDVI generated from MODIS at 16 km resolution was shown to be significantly correlated with field moisture measurements in the Southwest U.S. [15], although these relationships were influenced by environmental and climatic conditions at the time of image acquisition and the chosen averaging periods for both NDVI and soil moisture [30].
The Landsat satellites have also been used in NDVI-based drought monitoring [31,32]. However, the higher spatial resolution compared to AVHRR and MODIS generally means a trade-off between scale and revisit period. Research has suggested that the use of Landsat-8 at sub-regional scales to infer vegetation-soil moisture dynamics is nevertheless challenging due to the Operational Land Imager (OLI) sensor’s spatial (30 m) and spectral resolution. Regardless, sensors with higher resolutions may be able to more accurately use NDVI to infer plant-water dynamics at these scales [33].
Sentinel-2 is equipped with a single Multi-Spectral Instrument (MSI) with 13 spectral bands, including four bands positioned at the red-edge region of the electromagnetic spectrum (EMS) to provide improved vegetation condition and leaf chlorophyll content measurements [34,35]. Spatial resolution of bands varies from 10 to 60 m. The improved spatial and spectral resolution of Sentinel-2 MSI (referred to hereafter as Sentinel-2) has the potential to considerably advance the field of remote sensing of vegetation [36,37,38,39,40]. Several studies used simulated Sentinel-2 imagery to assess its usefulness in vegetation monitoring, with particular interest in the new red-edge bands. Findings suggested that the new bands are well positioned for the derivation of indices that assess leaf chlorophyll content, which, when coupled with relatively good spatial resolution (20 m), indicate that Sentinel-2 will be important for agricultural applications [41,42]. Studies have also sought to assess the extent to which Sentinel-2 can provide high resolution landcover thematic maps, with results suggesting that Sentinel-2 has strong potential for the monitoring of fine habitats and environments [43]. However, studies have also found a high correlation between the reflectance values recorded by the red-edge bands, thus raising concerns over their discriminatory abilities [43].
As Sentinel-2 is a relatively new sensor, minimal research has examined its suitability for environmental monitoring under extreme climatic conditions. Initial indications demonstrate that the improved spatial and spectral resolution of Sentinel-2 should allow for significantly improved assessment of vegetation condition, and consequently enhance its application in conditions of moisture deficit and drought. The principal aim of this study was to determine the extent to which NDVI time series, generated using both the high spatial resolution (10 m) and special near infrared (NIR) bands (20 m), reflects depleted soil moisture conditions, and whether this offers an improvement over Landsat-8 OLI (referred to as Landsat-8). As some of the selected sites experienced severe to extreme drought over the study period, a second focus of the paper was the performance of Sentinel-2 NDVI under extreme conditions. To the best of our knowledge, this represents the first study of its kind using Sentinel-2 data. The rationale for the selection of Sentinel-2 and Landsat-8 datasets, without supplementation of higher-resolution (<10 m) aerial or satellite products for sub-pixel analysis, is that these sensors represent the highest resolution, freely available multispectral imagery.
2. Methodology
2.1. Site Selection and Data
The Southwest U.S. was selected as a study area for two reasons. Firstly, the region has experienced one of the most severe multi-year droughts on record. In December 2016, 41% of the region was under extreme/exceptional drought conditions, and 28% was under moderate/severe conditions based on the classification scheme of the U.S. Drought Monitor (USDM). However, following extreme precipitation in late 2016 and early 2017, much of the region was experiencing normal conditions by Spring 2017. Secondly, this region was selected because approximately 40 Climate Reference Network/Soil Climate Analysis Network (CRN/SCAN) soil moisture monitoring stations are situated in the area, measuring at depths ranging from 5 to 100 cm. Sites were selected based on optimisation for relatively continuous soil moisture data and regular cloud-free imagery. Selection criteria included each site having at least one image per month with <10% cloud coverage for both Sentinel-2 and Landsat-8, and 0% cloud cover within 1 km of the monitoring site.
These constraints resulted in five sites being selected with different periods of available data and subject to varying drought severity over time (Figure 1). The sites also had varying landcover, ecoregion classification, and climate characteristics. Whereas all sites are located within generally dry environments, vegetation type varied from relatively wet marsh (Merced) to dry patchy grassland found in the more semi-arid sites (Desert Center/Las Cruces). Sentinel-2 and Landsat-8 data were obtained from the European Environment Agency Copernicus Access Hub and the United States Geological Survey (USGS) EarthExplorer, respectively.
For both Sentinel (Level-2A) and Landsat (Level-2), the values for bottom of atmosphere reflection were corrected as part of the image preprocessing. Soil moisture and precipitation data was obtained from either the NOAA CRN Database or the NRCS SCAN Database (Table 1). As precipitation data was not available for two sites (Desert Center, Ford Dry Lake), proxy data was obtained from Blythe Airport, 57 km and 36 km to the east of these sites, respectively, and at comparable elevation. Long-term regional average annual rainfall data (1981–2010) were obtained from the U.S. Drought Monitor (USDM). The 10 m Digital Elevation Model (DEM) used for topographic correction was downloaded from USGS EarthExplorer, and soil constants for dominant soil types at each site were obtained from the Soil Survey Geographic Database (SSURGO) soils database.
2.2. NDVI Calculation
Prior to generating the Landsat-8 and Sentinel-2 NDVI time series, topographic correction was performed for one site (Fallbrook) due to its hilly terrain using the Minneart correction method [44]. Thereafter, a probability-based supervised landcover classification was performed for all sites to identify areas of vegetation in each available image from both Sentinel-2 (10 and 20 m resolution) and Landsat-8 (30 m resolution). The identified areas defined the extent to which mean NDVI was calculated for each Landsat-8 or Sentinel-2 image, as shown in Equation (1). Where inputs had different spatial resolution, such as between the Sentinel-2 red-edge bands and the visible red band, the processing was set to the maximum resolution of the inputs. Correlation analysis of NDVI and soil moisture time series was then performed as described below.
NDVI values can be inflated by soil and bare earth reflectance as these surfaces typically reflect more electromagnetic radiation (EMR). To calculate NDVI only for vegetated areas, thereby reducing the risk of reflectance inflation, supervised landcover classification methods were used to identify the landcover types within a 1 km radius of each site. Given the local and site-based nature of this study, a fixed 1 km radius was selected. This radius was chosen due to the variation in local soil and topographic conditions. Prior to the generation of training areas, each image was segmented allowing for object-based classification. Image segmentation was used to group together neighboring pixels with similar spectral and geometric characteristics. Combining both geometric and spectral characteristics allows for a more robust classification process [45,46]. Training fields were identified with at least 100 pixels representing each desired informational class, with no individual training area larger than 10 ha. Informational class descriptors were chosen from the U.S. National Landcover Classification schema. Training areas were identified and used as inputs into a Maximum Likelihood Classification (MLC) algorithm for each image in the series.
For each MLC output, a class probability function was applied to vegetation classes for the site. Class probability analysis uses the spectral signatures of the class to determine the probability, expressed as a percentage, that pixel X belongs to class Y. Therefore, the higher the assigned value, the greater the likelihood of that pixel belonging to the given informational class. Areas were only selected for further analysis if they were classified as vegetation and the class probability value exceeded 70% in more than 70% of the images in the time series for each site. This refinement process should have removed any non-vegetated pixels such as bare earth that would affect the mean NDVI value.
The derived vegetation extent served as the spatial mask within which NDVI values were calculated. For each image in the time series and for each of the five sites, the NDVI was calculated using Equation (1) for bands 8, 5, 6, 7, and 8A (NDVI8, NDVI5, NDVI6, NDVI7, and NDVI8A, respectively). This resulted in a total of six NDVI time series per site: one Landsat-8 time series (NDVILS) and five Sentinel-2 NDVI variants. Note that NDVI8 had a spatial resolution of 10 m, whereas the other Sentinel-2 derived datasets had 20 m resolution. NDVILS had a 30 m spatial resolution and was derived using the NIR band (Band 5) and visible red band (Band 4). The mean NDVI for the vegetation within 1 km of the soil monitoring sites was calculated.
2.3. Statistical Analysis
Pearson correlation analysis was performed to examine the relationships between the key variables. Firstly, measured soil moisture time series at each soil depth were correlated with one another to gain an understanding of soil moisture redistribution characteristics at each site. The soil moisture time series was also contextualised by establishing the upper and lower likely bounds of plant available water (PAW) based on the estimated field capacity and wilting point of the soil, respectively. In the absence of horizon or site-specific soil water constants, field capacity and wilting point were obtained from the generalised values for the dominant soil mapped in SSURGO for the sites. Monthly seasonal total water (mm) and plant available water (mm) were calculated on this basis.
Soil moisture at each depth was also correlated against the six NDVI time series. Correlating soil moisture against indices derived from satellites to test for relationships is an established analytical technique [15,30,47]. Significant positive relationships between NDVI and soil moisture would suggest that the NDVI time series does reflect soil moisture dynamics in the root zone. Due to the varying time intervals between suitable (i.e., cloud-free) satellite images, soil moisture was averaged between each image acquisition date. Averaging periods varied between 5 and 20 days, consistent with averaging periods in previous research [15,30].
Few studies have performed more than standard correlation analysis when assessing the utility of NDVI as a soil moisture proxy. We used additional statistical analytical methods not routinely used in a remote sensing context to examine the relative significance of the correlations produced by the different NIR bands.
Vegetation types in different environments vary in their response to fluctuations in soil moisture content. Vegetation found in consistently dry, semi-arid environments is likely to be more resistant to moisture deficit [48] and therefore NDVI values are anticipated to fall between a smaller range. Vegetation in wetter environments that later experience drought are likely to have wider-ranging NDVI values due to the vegetation’s greater dependence on moisture to maintain growth and health. Tolerance intervals can help quantify the likely range of a variable at a defined level of confidence, and describe the range within which a proportion of the values within a sample will fall for the stated confidence level [49]. Tolerance intervals for each Sentinel-2 band were calculated for a sample proportion value of 90% and confidence level of 90%.
Based on calculated NDVI from a range of Sentinel-2 bands, principal component analysis (PCA) was conducted. The rationale for using PCA was to assess whether the linear combination of NDVI values from a range of bands would form a mutually correlated system that better characterises the vegetation condition associated with soil moisture. The analysis was performed on the combination of all Sentinel-2 NDVI variants (NDVI8, NDVI5, NDVI6, NDVI7, and NDVI8A) and the combination of the special 20 m resolution red-edge bands (NDVI5, NDVI6, NDVI7, and NDVI8A). As with the original NDVI calculation, the processing resolution was set to the maximum resolution of the inputs. Any individual component (band) producing correlation coefficients of greater strength than the correlation produced by the PCA and soil moisture suggests that a particular band is better suited to that environment or vegetation type.
To further compare the NDVI values produced by the Sentinel-2 red-edge bands and the standard NIR band, a Steiger correlation comparison test was undertaken [50]. This test examines the relationship between two overlapping correlation coefficients (the correlations share the common variable of soil moisture) and determines whether the coefficients produced are significantly different. The Steiger test is known to have relatively good robustness in terms of validity and efficiency for data that do not display excessive degrees of skewness. These properties are retained for small sample sizes [51].
3. Results
3.1. Soil Moisture Dynamics
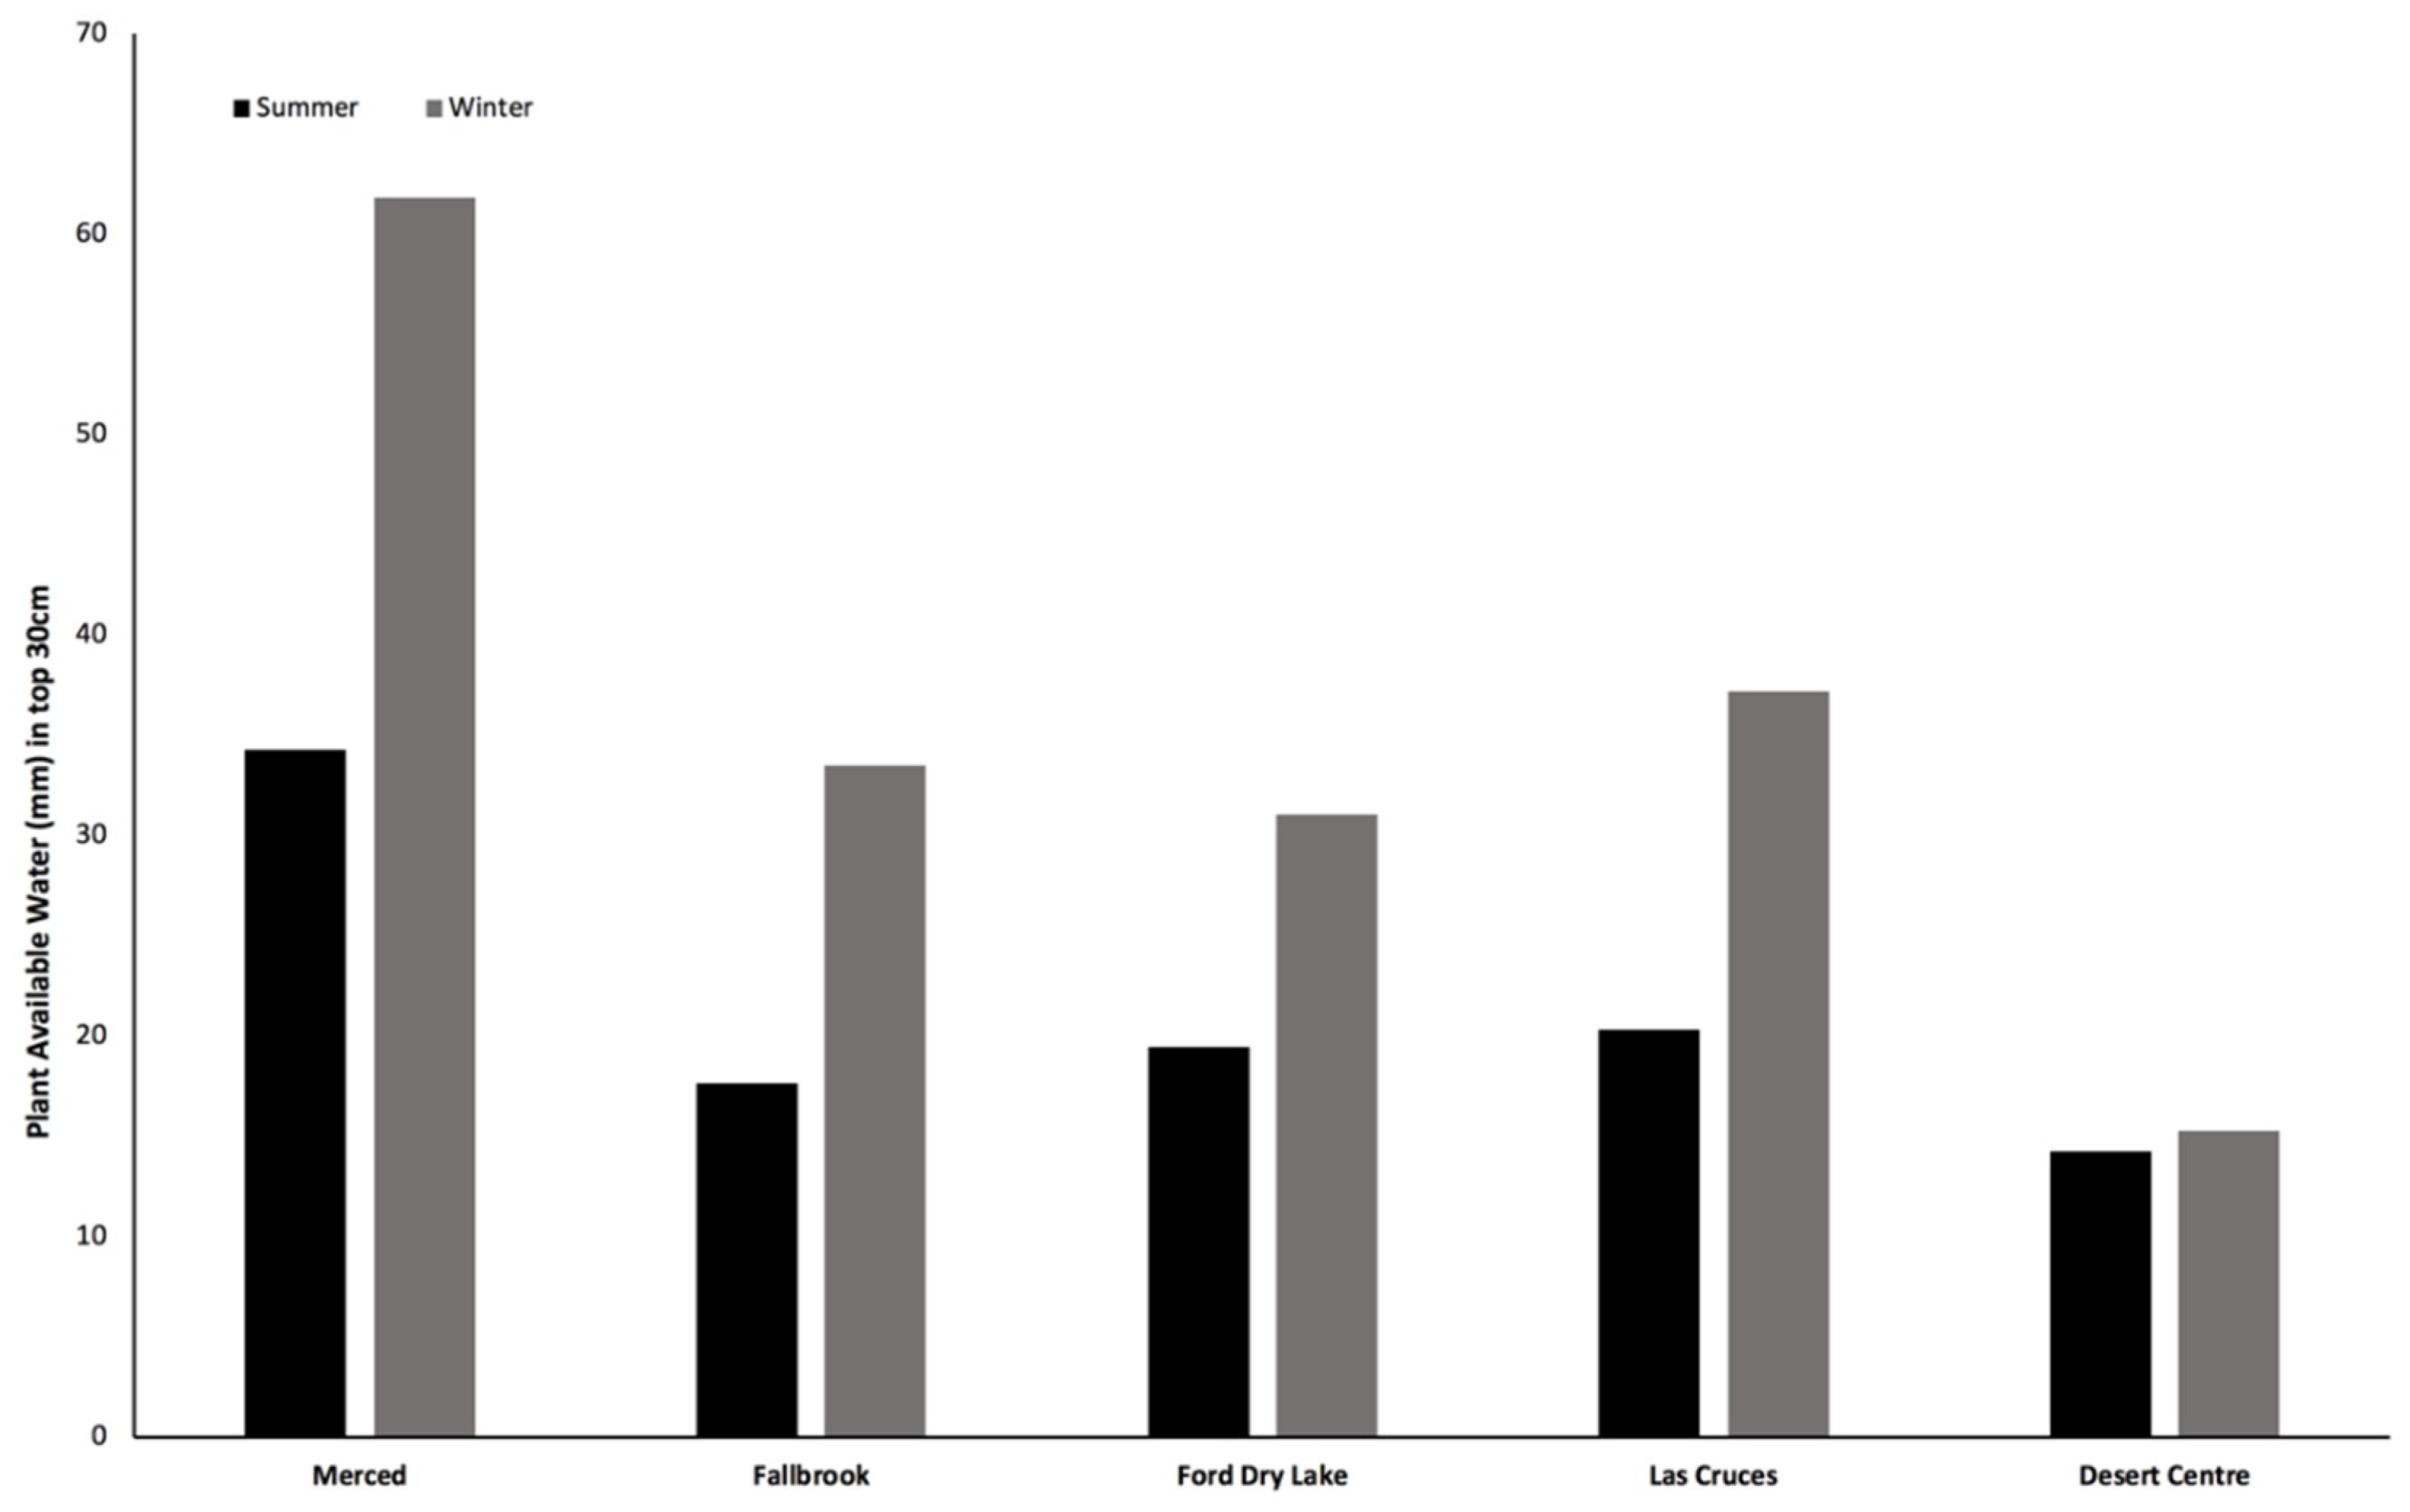
As is evident from the regional annual average rainfall (AAR) in Table 1, the five sites were typically dry, with the wettest, Fallbrook (406 mm) and Merced (332 mm), normally receiving considerably more than the 91 mm received by the two driest sites (Ford Dry Lake and Desert Center). However, over the study period, Merced and Fallbrook experienced more sustained and intense drought conditions. The other sites, although experiencing drought, received two-thirds or more of their AAR. This reduced the normal difference in moisture drivers between the stations, although Ford Dry Lake and Desert Center were still considerably drier than the other sites. For the period of study, three of the sites showed fairly similar seasonal averages of plant available water (Figure 2), and a notable difference between Merced and Desert Center was observed.
Figure 3 shows the recorded precipitation and corresponding soil moisture at four depths for the Merced site. Figures for all sites are provided as Figures S1 to S5 in the online Supplementary Materials. Approximate values for field capacity and wilting point are shown as solid lines, with likely plant available water represented as the area between the lines. Note that at this site, the moisture gradient generally increases with depth. Moisture at 5 cm (considered to represent the top 7.5 cm of soil) was almost always below wilting point, representing desiccated surface conditions with the little moisture here not being available to plants. Immediate peaks in soil moisture at intermediate depths of 10 cm and 20 cm following rainfall showed that infiltration and redistribution of soil moisture occurred fairly rapidly. Sometimes percolation was sufficient to cause a peak in soil moisture at 50 cm, as observed in mid-January 2016 and particularly in January and February of 2017. Moisture measured at 20 cm (representing depths between 15 and 30 cm below the surface) was mostly plant available water. Nevertheless, moisture at this depth remained constant over the dry summer, suggesting that the moisture is not being drawn down by vegetation. Notably, during the summer of 2016 no rain fell, yet soil moisture at 50 cm reached a seasonal maximum mid-summer. Similar seasonal peaks at depth were observed at Ford Dry Lake (50 cm and 100 cm, Figure S3), Desert Center (50 cm) and Las Cruces (100 cm, Figure S5). A possible explanation for the relatively small seasonal moisture differences at depth is the upward capillary action from more moist conditions at depth [52].
Table 2 shows the Pearson correlation coefficients between each soil depth at each site. Very high, significant positive correlations between moisture at 5 cm and 10 cm at all sites but Desert Center suggest that moisture in the upper 15 cm is controlled by similar soil texture and desiccation patterns. Highly significant and positive correlations were also found between 10 cm and 20 cm depths at the same sites. At 50 cm, negative correlations appeared, likely related to upward capillary action and the resulting reverse moisture gradient during summer. Table 1 provides a summary of the inferred soil dynamics and moisture characteristics from the analysis.
3.2. Soil Moisture and NDVI Calculations
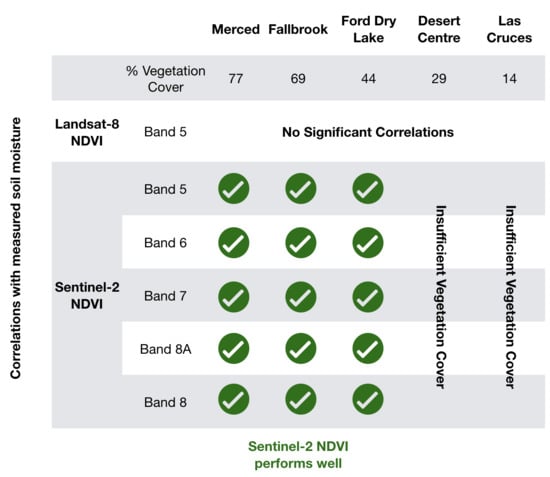
Figure 4 indicates very low and relatively uniform NDVILS for three sites: Ford Dry Lake, Las Cruces, and Desert Center. The NDVILS time series for Merced and Fallbrook had a similar pattern with seasonal low NDVILS points in November and December and a high point in April, but the numerical values of NDVILS were low. Table 3 provides the correlation coefficients for each combination of site and soil depth and mean NDVILS. No significant positive correlations at any site, or any soil depth, were found between measured soil moisture and NDVILS.
In contrast, significant positive correlations with soil moisture at certain depths were found using Sentinel-2 derived NDVI. For example, Figure 5 shows the NDVI calculated using each of the five alternate bands and soil moisture at 10 cm, representing soil depths between 7.5 and 15 cm from the surface. Correlation coefficients of all NDVI variants and 10 cm soil moisture were all high and statistically significant. For a comparison, note the solid line representing the equivalent NDVILS, showing markedly lower NDVI values and much less variation over the study period. Figures S6–S21 in the online Supplementary Materials show the relationship between NDVI across each Sentinel-2 NIR band and measured soil moisture at the various depths associated with each site. Only depths where soil moisture was within PAW for at least some of the time are graphed.
Table 3 shows the Pearson correlation coefficients produced between mean NDVI (calculated using all variants) and measured soil moisture at each depth. The Merced and Fallbrook sites show a similar pattern with significant positive correlations between all NDVI variants and moisture measured at depths of 5, 10, and 20 cm. The strongest correlations occurred at the 10 cm depth for both sites, and correlations were generally stronger for Merced. Similar significant positive correlations were found for most bands at shallower depths for Ford Dry Lake, with the strongest also being 10 cm. However, overall correlations were weakest for this site. In contrast, for both Las Cruces and Desert Center, there were no positive correlations between NDVI and soil moisture at any depth between 5 and 20 cm. There were, however, some significant negative correlations between NDVI and soil moisture, particularly for lower depths (50 and 100 cm).
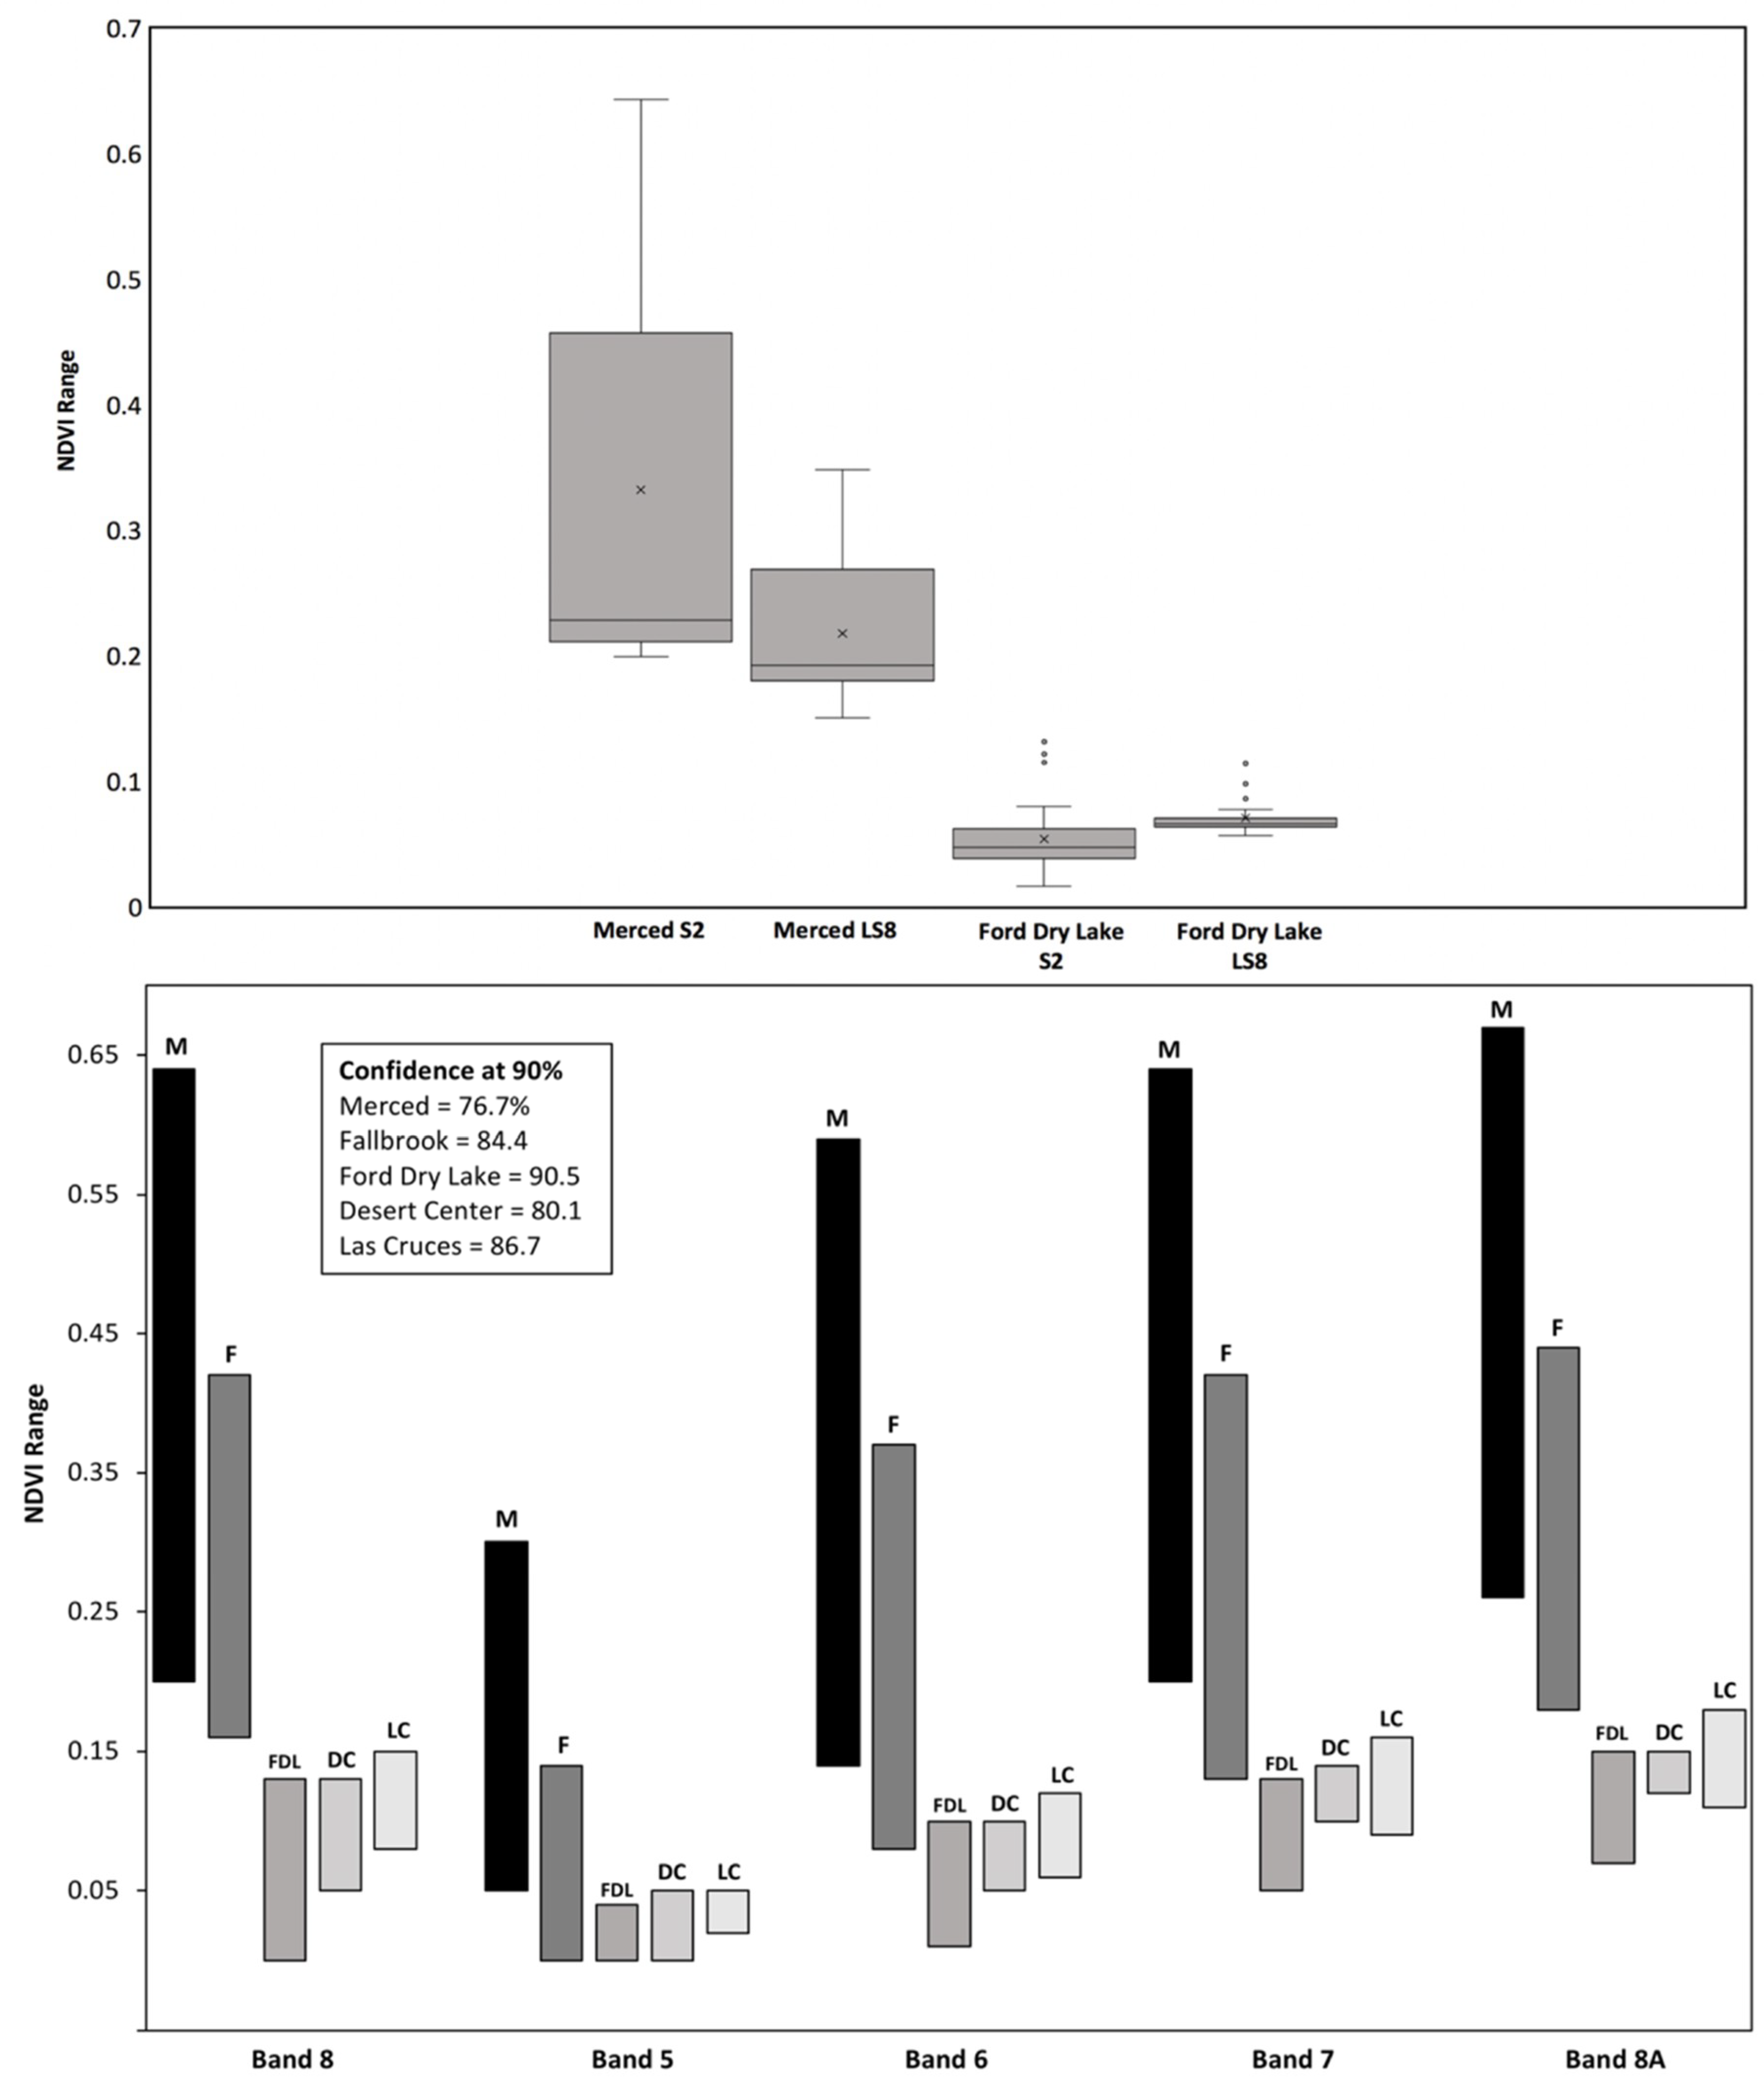
The tolerance intervals produced for each band are shown in Figure 6. The lower and upper values indicate where the NDVI values for that site are most likely to fall. The tolerance intervals produced demonstrate the large differences between the sites in terms of the size of the interval. For example, Merced has a large interval, suggesting that NDVI, and therefore vegetation condition, are variable for this location, which was likely the result of natural seasonal variation. However, in the much drier sites (Ford Dry Lake, Desert Center, and Las Cruces), the NDVI will likely fall between a much narrower range. Not unexpectedly, the NDVI was generally higher at Merced and Fallbrook, with both sites receiving 340 mm rainfall over the 2016 calendar year, compared with 174 mm for Las Cruces and around 91 mm estimated for Desert Center and Ford Dry Lake. Table 4 summarizes the analysis assessing the observed NDVI trends at each site and the relationship between NDVI and measured soil moisture.
3.3. Principal Component and Correlation Comparison Analysis
The results of the principal component analysis output correlations with measured soil moisture are shown in Table 5. Factor-NIR is the linear component analysis of the NDVI values obtained from all NIR bands (NDVI8, NDVI5, NDVI6, NDVI7, and NDVI8A), whereas Factor-RedEdge is the component analysis of the 20 m high spectral resolution bands (NDVI5, NDVI6, NDVI7, and NDVI8A). The results of the PCA show that at all sites where significant positive correlations between soil moisture and NDVI were present, the linear combination of the red-edge bands at 20 m spatial resolution produced stronger correlations than the same analysis including the poorer spectral but higher spatial resolution NDVI8. However, each site and measurement with a relationship present also had an individual band which out-performed the PCA combination in correlation strength.
The results of the Steiger test used to assess whether the correlations produced using Band 8 or the Factor-RedEdge PCA combination were significantly different, as shown in Table 5.
The results of the correlation comparison analysis indicate that, for the majority of situations where a positive correlation exists between measured soil moisture and Sentinel-2 NDVI, a significant difference exists between the correlation produced by using values derived from NDVI8 and the PCA of the special red-edge bands. The correlations produced using the higher spectral resolution bands were significantly stronger than those derived from the standard NIR band. The exception was Fallbrook, where no significant advantage was gained in using the red-edge bands. No significant positive correlation differences were present at the sites where NDVI and soil moisture were weakly or not correlated at all (Desert Center and the lower depths of Ford Dry Lake). The correlations at Las Cruces, while significantly different, did not allow for defensible conclusions to be drawn as no significant positive correlations were observed between NDVI and measured soil moisture.
4. Discussion
This study examined the relative utility of Sentinel-2 derived NDVI for inferring soil moisture regimes within the zone of plant available water across five sites. All five sites were experiencing periods of drought for the majority of the study period, representing the soil moisture and NDVI detection and dynamics under extreme conditions.
Lower values and no significant positive correlations between NDVILS and measured soil moisture at any depth or at any site were found. This suggests a rather limited role for the sensor in this context [33]. Compared to Sentinel-2, Landsat-8 has coarser spectral and spatial resolution (30 m), and this, in combination with the characteristics of vegetation at the sites, likely contributed to the lack of significant correlations with soil moisture. In particular, the coarser spatial resolution may result in the spectral mixing of individual pixels, thus diluting the signal of sparse vegetation at some sites. The lack of correlation could also be related to the relatively fewer available Landsat-8 images. Between 9 and 12 additional Sentinel-2 images per site were available due to the better temporal resolution of the satellite (Table 1).
At Merced, Fallbrook, and Ford Dry Lake, statistically significant positive correlations were found between Sentinel-2 derived NDVI and measured soil moisture at depths of up to 20 cm, (representing the top 30 cm of soil). This suggests that NDVI reflects the vegetation response to changing moisture gradients at these sites. At these sites, no significant positive correlations were found between NDVI and any measurements of soil moisture below 20 cm, despite moisture measured in deeper horizons appearing to be within the plant available moisture range. This suggests that the vegetation is not accessing the moisture as there is either sufficient moisture in the upper horizons, or the maximum rooting depth of the vegetation is not sufficiently deep to access the moisture.
The vegetation at Merced and Fallbrook varied more in NDVI across the study period, as represented by the greater tolerance intervals for these locations. These sites typically produced higher correlations between NDVI and soil moisture. During the (dry) summer at Merced, both NDVI and soil moisture remained relatively constant, with NDVI values for June through to October mostly in the range of 0.1 to 0.3, depending on the NDVI variant. A sharp drop in soil moisture below wilting point in April and May resulted in vegetation becoming stressed and responding through a variety of physiological mechanisms, such as leaf drying and leaf loss. Semi-deciduousness is relatively common in drylands, which may account for the NDVI in the region of 0.2. Even with complete leaf loss, the NDVI of dry leaves and bare tree crowns is generally higher than soil, which could also be an explanation for the relatively constant but perceptible NDVI values at this site. Depending on the species present, plants can also depend on stem-stored water for survival during these periods [53]. These and other physiological adaptations that characterise the phonologies of dry ecosystems may explain the relatively constant NDVI and measured moisture during the summer months. A more complete characterisation of physiological responses giving rise to the observed NDVI would require a detailed ground-survey of vegetation, which was not available for this study.
At Ford Dry Lake, conditions were extreme with very low NDVI, generally less than 0.1. This either reflects bare soil, or bare soil and some dormant and desiccated vegetation that later responded quickly to moisture increases toward the end of the analysis period. The grasses and other herbaceous vegetation at Ford Dry Lake has likely adapted to survive extremes [49] as 2016 conditions were normal relative to the long-term average. With a mean annual precipitation of around 90 mm, vegetation would respond rapidly to a sufficiently high rainfall pulse, afterward drying and dying as soil moisture decreased. However, NDVI was still correlated up to a depth of 20 cm. This compares well with studies assessing the root depths of desert grasses [52,54]. In semi-arid regions, vegetation commonly has rooting depths of less than 50 cm [55,56]. Studies found that up to 80% of the rooting systems in the Mojave Desert, with similar desert grassland to the sites in this study, are within the first 20 cm of the soil [57]. This is contrary to the often-held assumption that plants tend to be deeply rooted in dry environments [54]. Shallow rooting depth in such environments is likely the result of limited percolation following precipitation [57], therefore positive correlations in the first 20 cm of the soil are expected, assuming moisture is within the range available to the plant.
Notably, significant negative correlations were found between NDVI and soil moisture measured in the deeper horizons at Ford Dry Lake (100 cm). Such negative correlations at a depth of 50 cm were also observed at Desert Center. These sites have very low levels of annual rainfall and relatively high temperatures. The upper horizon soil moisture measurements for these sites have several peaks, characteristic of infrequent and intense precipitation events in semi-arid environments [58,59]. Available moisture from sudden precipitation events is unlikely to infiltrate as far as 50–100 cm due to rapid vegetation uptake, high evapotranspiration, and lateral soil moisture transfer [60]. Long-term infiltration depths rarely exceed 30 cm in climates with annual average precipitation below 100 mm [54]. If plant roots are within the first 30 cm, and moisture is unlikely to infiltrate beyond this depth, NDVI may be negatively correlated with measurements at depth. As suggested earlier, these negative correlations may also be the result of capillary forces acting in an upward direction producing a reverse moisture gradient with depth. Upward capillary forces are known to produce such trends under dry conditions where the temperatures result in desiccation of topsoil in the summer months [52]. These upward forces result in peaks in soil moisture during the summer months when NDVI is at its lowest, which is the inverse of the expected trend.
Soil moisture regimes at Las Cruces appeared to be broadly similar to Ford Dry Lake and Fallbrook (Figure 2). Almost all the soil moisture within the top 50 cm of soil at Las Cruces was within the expected rooting depth and as plant available water. Although Desert Center had a drier regime, some plant available moisture was present at depth. Nevertheless, at Las Cruces and Desert Center, no significant positive correlations with NDVI and soil moisture were found, suggesting that all NDVI variants at these sites fail to represent the vegetation condition response to moisture gradients. Identifying the reason for this phenomenon is important. One explanation might relate to landcover, as the percentage vegetation cover within the one km radius (as determined by the supervised landcover classification analysis) at Las Cruces and Desert Center was considerably lower than the other sites, at 14% and 29%, respectively. Despite the rigorous attempt to only calculate NDVI for vegetated areas, spectral mixing of bare earth and soils and the distortion of NDVI values may have occurred due to the fineness of the vegetation coverage. There is clearly a minimum threshold of vegetation cover beyond which NDVI cannot reasonably infer soil moisture dynamics due to the vegetation patches being finer than the highest spatial resolution available for the sensor (for Sentinel-2 MSI, this is 10 m). Based on our findings, we suggest that this is probably of the order of 30 to 40% cover for these environments. This has important practical implications, given that many U.S. rangeland landscapes have less than 35% foliar cover. Therefore, the broad-scale applicability of Sentinel-2 NDVI in such environments may be limited.
One of the anticipated advances in Sentinel-2 was the provision of four high spectral resolution red-edge bands (20 m resolution) for vegetation monitoring. Although having a higher spectral resolution, these bands have a lower spatial resolution than the standard NIR band. One aim of this research was to assess the relative importance of spatial versus spectral resolution. Of interest was the extent to which band resolution affected the relationship between NDVI and soil moisture. A comparative statistical analysis was therefore completed between NDVI and soil moisture correlations produced from the red-edge bands and the standard NIR band.
Differences in the strength of the correlations using NDVI derived from the different bands were evident. Generally, where positive correlations were present between NDVI and measured soil moisture, the strength of the correlations produced was greater when one of the red-edge bands was used to derive NDVI. Furthermore, the PCA of the red-edge bands consistently produced stronger correlations than the PCA of all NIR bands. Steiger correlation comparisons demonstrated that the correlations produced using the PCA of the red-edge bands were significantly stronger at Merced and Ford Dry Lake than those derived using NDVI8. This suggests that NDVI calculated using the higher spectral resolution bands is of greater use for monitoring vegetation response to soil moisture through NDVI than using the higher spatial resolution band.
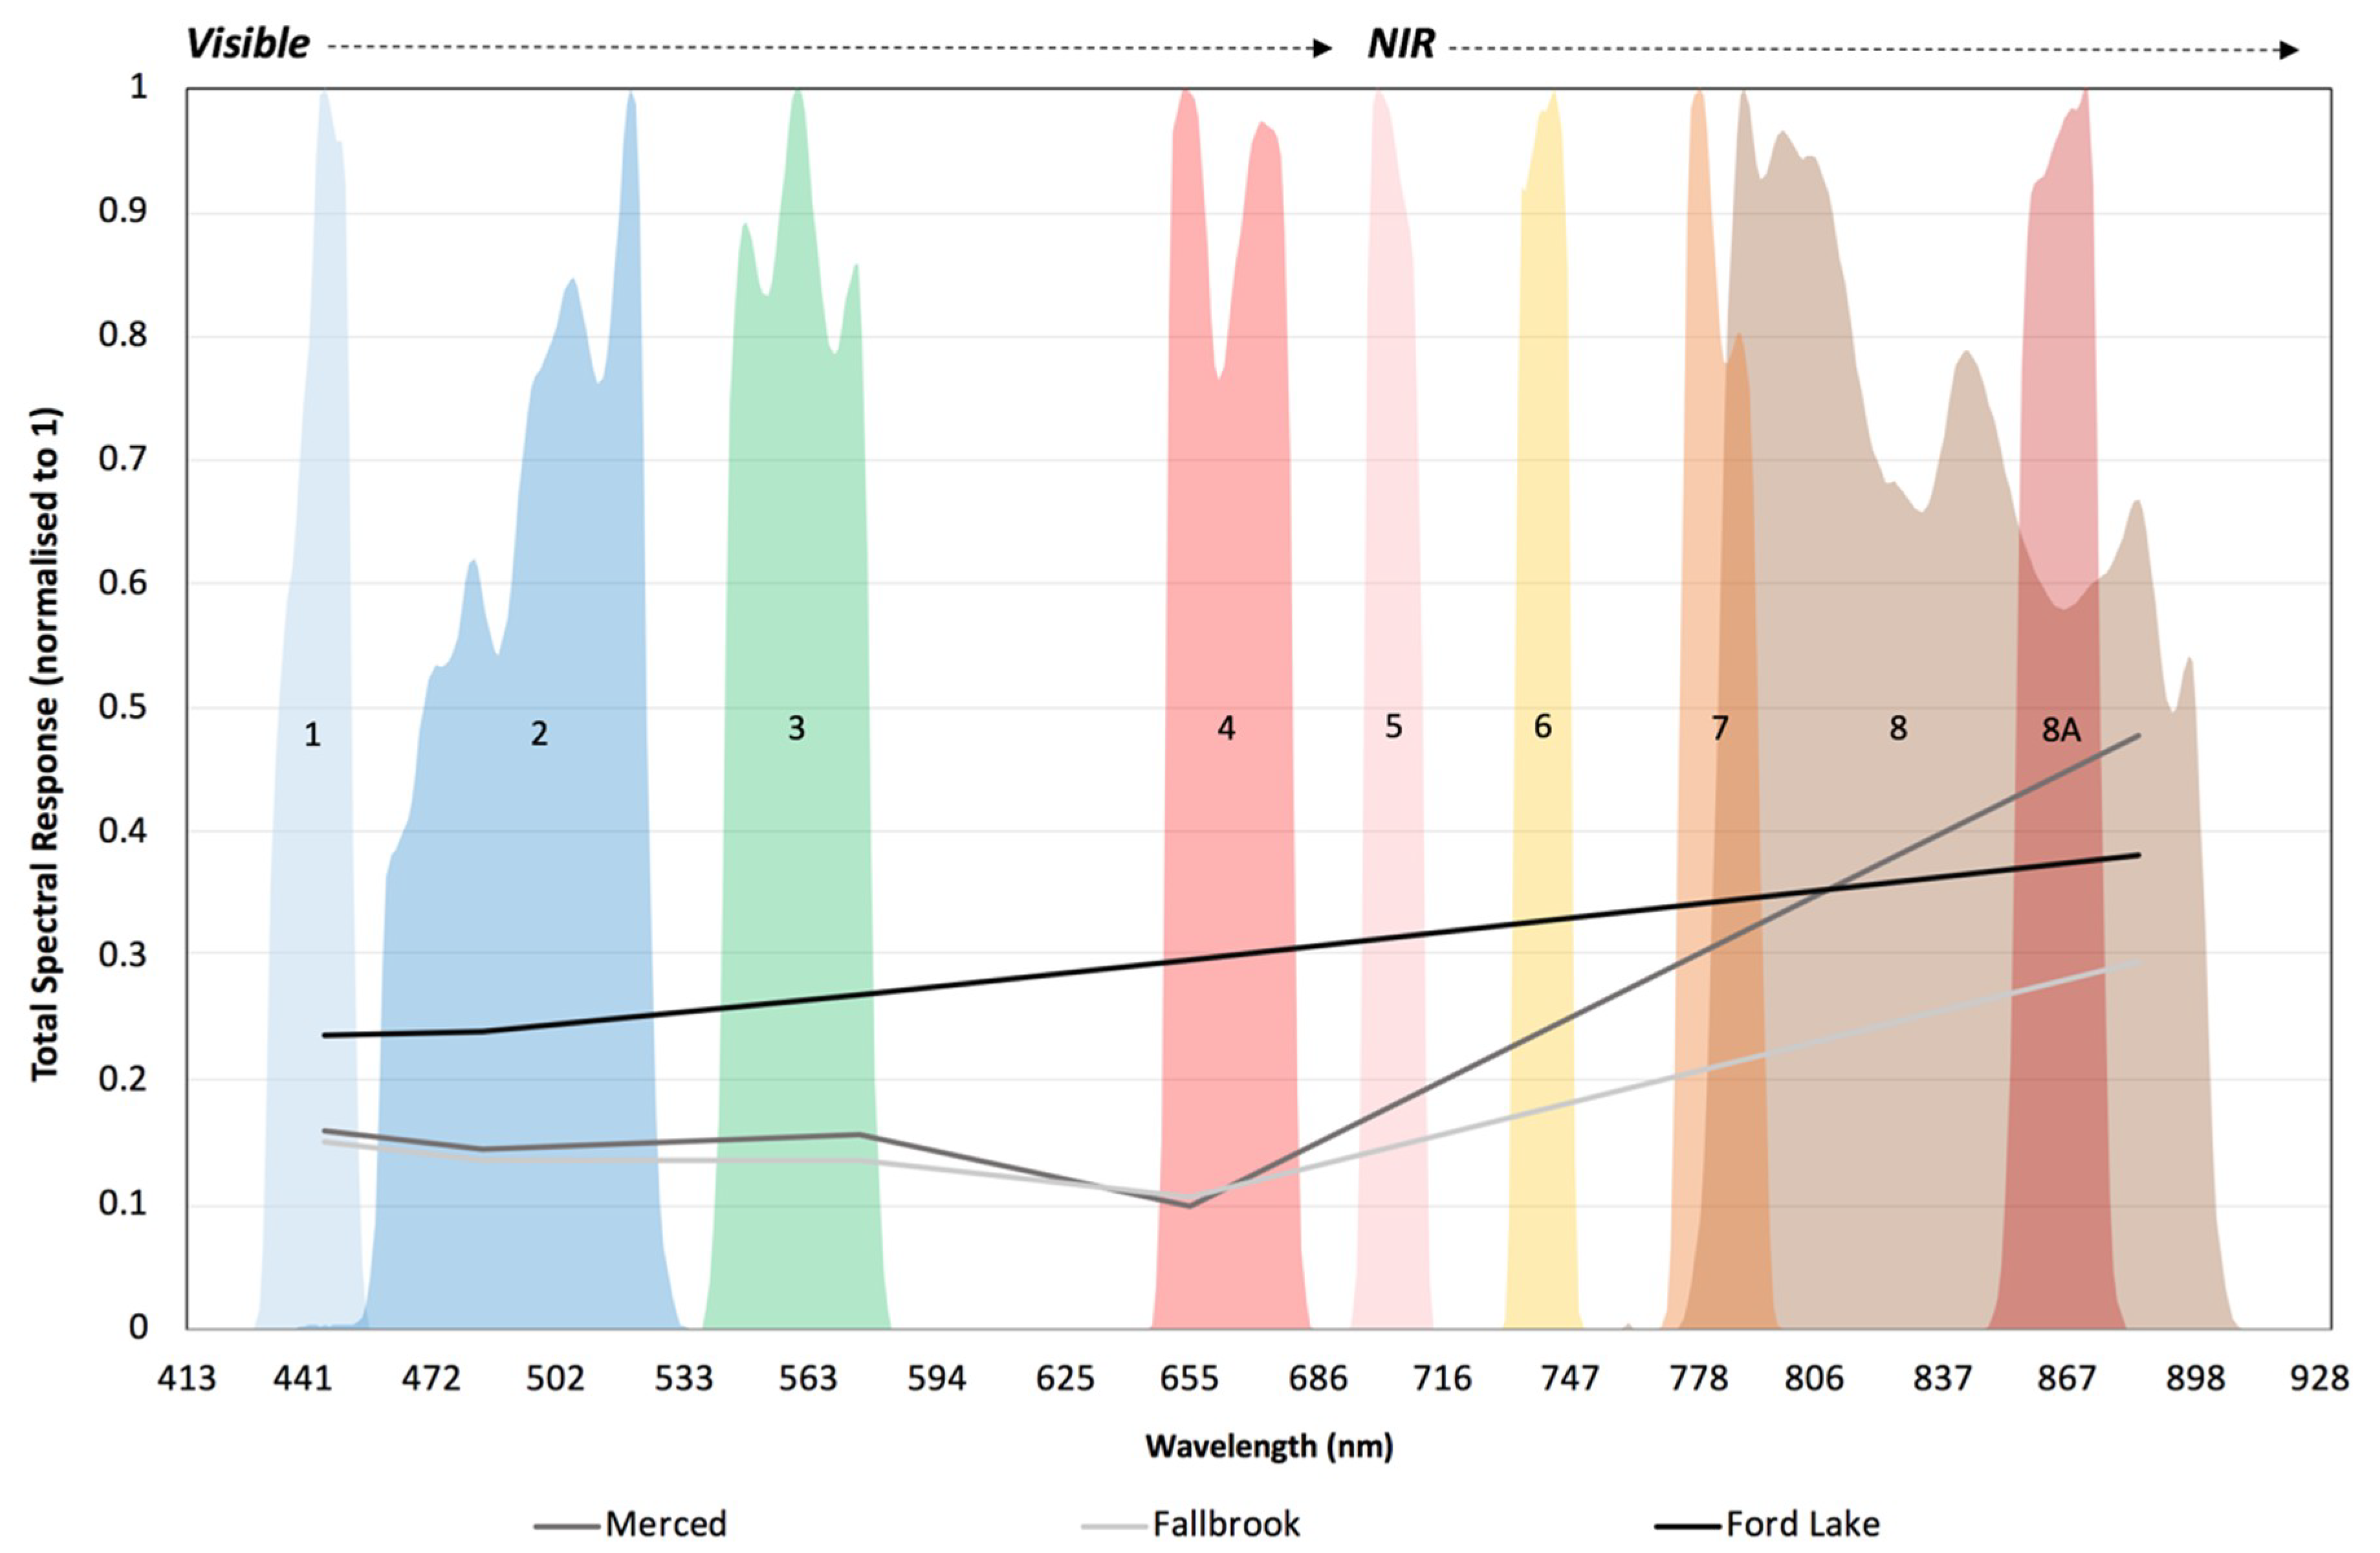
Across the three sites that produced significant positive correlations between NDVI and soil moisture, different NDVI variants produced the strongest correlation: NDVI5 for Merced, NDVI6 for Fallbrook, and NDVI7 for Ford Dry Lake. These sites all have different climatic and environmental characteristics, including the dominant vegetation type and drought severity. Some NDVI variants also performed much better compared with others at different sites. For example, while NDVI5 produced the strongest result at Merced, it performed poorly at Ford Dry Lake. This was due to the positioning of each band across the EMS. Band 5 for example is positioned close to the visible red band (Band 4). Different vegetation types and conditions reflect varying amounts of NIR radiation; vegetation that is green and moist reflects more NIR and considerably increases the reflectance between the red and NIR regions. Dry, poor quality grass will have a more modest increase in reflectance across the same region [58,59]. This suggests that the gradient of the change in reflectance from the red to the NIR part of the spectrum could assist with the selection of the most appropriate Sentinel-2 NIR band for a given vegetation or climatic context.
Figure 7 shows the vegetation reflectance for each site plotted against the spectral positioning of each Sentinel-2 band. The dry vegetation at Ford Dry Lake showed a modest increase in reflectance between the visible and NIR parts of the EMS. This explains why NDVI5 performed poorly at this location. The wetter grassland environment at Merced had a much steeper increase, meaning NDVI5 performed relatively well.
The results and discussion above highlight the advances made possible through the development of the Sentinel-2 red-edge bands. These bands, with their medium spatial and high spectral resolutions, out-performed the higher spatial resolution NIR band in the majority of situations in this study. This supports previous research into the new NIR bands observable by Sentinel-2. Studies prior to the launch of Sentinel-2 using MSI data found that the new bands were well positioned to provide highly accurate estimations of Leaf Area Index (LAI) and chlorophyll content in vegetation [35,41,42].
Some studies found strong correlations between the reflectance values recorded across the new red-edge bands with a Pearson’s coefficients of 0.99 [43]. This naturally raises concerns regarding their discriminatory abilities. Our study suggests that the NDVI calculated using the red-edge bands is useful for approximating soil moisture where sufficient vegetation is present. The subtle variation in NDVI values from each band resulted in different strength correlations. The utility of each band is determined by local site conditions. This indicates the need for a spectral assessment of the target vegetation prior to the NDVI calculation stage, so that the most suitable band (i.e., the band that represents the steepest reflectance increase for that vegetation type) can be used for NDVI calculation. Incorporating such preliminary analysis into fieldwork often used in the early stages of thematic landcover classification is possible.
The correlation of NDVI with soil moisture in both naturally very dry conditions where vegetation is highly resilient (Ford Dry Lake), and areas in extreme drought relative to normal conditions (Merced and Fallbrook), highlights the potential for the application of Sentinel-2 in the field of agricultural drought monitoring. In particular, correlations produced using the new red-edge high spectral resolution bands show significant promise. However, before use, users should consider the spectral characteristics of the vegetation under assessment and select bands accordingly.
In comparison to other sensors, studies using NDVI derived from MODIS have also successfully identified positive correlations between NDVI and measured soil moisture in the U.S. Other studies produced Pearson correlation coefficients ranging between 0.46 and 0.73 [15,30], with the strongest correlations being associated with areas of homogeneous vegetation cover. The analysis completed with Landsat-8 in this study produced no significant correlations. The Pearson correlations between Sentinel-2 NDVI and measured soil moisture in this study were typically higher (Merced = 0.855, Fallbrook = 0.785, and Ford Dry Lake = 0.597) than those of previous studies and were significant compared to Landsat-8. This highlights the importance of Sentinel-2 in this field, offering both higher spatial and spectral resolution when compared with other non-commercial remote sensing (RS) missions (e.g., Landsat and MODIS).
5. Conclusions
Given rising global temperatures and the likelihood of an increase in the frequency and intensity of drought events, an urgent need exists to develop effective and implementable drought monitoring techniques [13]. This study aimed to assess the improvements offered by Sentinel-2 in generating NDVI time series that represent vegetation response to soil moisture dynamics, particularly in extreme conditions.
In this study, Sentinel-2 NDVI was positively correlated with soil moisture at depths of less than 30 cm in a range of environments, including both naturally dry and under uncommon drought conditions. Depths that produced significant positive correlations between NDVI and soil moisture appeared to approximate typical rooting depth, suggesting that NDVI reflects plant response to moisture dynamics within the active root zone. The strongest correlations were produced at Merced and Fallbrook, which, for the length of the study period, experienced the most extreme USDM drought classifications relative to long term averages. This indicates that the NDVI is an effective metric, even in extreme drought. The NDVI at these sites also appeared to identify periods in which vegetation adaptation mechanisms for coping with extreme dry conditions are active.
Significant positive correlations were also produced at Ford Dry Lake, which is a naturally extremely dry environment. Although the positive results at Ford Dry Lake were not as strong as those at Merced or Fallbrook, they do demonstrate that there is some potential in Sentinel-2 NDVI variants to act as a proxy for soil moisture in extremely dry semi-arid environments. However, at the comparable Las Cruces and Desert Center sites, no positive correlations were found. The similar soil moisture dynamics and climatic and environmental characteristics of these sites are likely the consequence of reduced vegetation cover, suggesting that a threshold exists where the patchiness of vegetation limits the NDVI’s ability to infer soil moisture due to spectral mixing. For sites in these environments, the limit appears to be vegetation cover of approximately 30 to 40%. Due to the varying results in the semi-arid sites in this research, further study in such environments is recommended.
Ideally, correlations should be examined between NDVI and effective root zone plant available water, rather than total soil moisture. However, since neither site-specific soil parameters nor site vegetation and rooting depth data were available, this could not be completed. Further work relating Sentinel-2 NDVI to plant available water in the active root zone is warranted, including analysis to assess the potential time lag between moisture and vegetation dynamics [61] and a quantification of the impact of sparse vegetation cover on NDVI signal. This research demonstrates the potential of Sentinel-2 derived NDVI in monitoring soil moisture; however, as more refined vegetation indices can also be calculated (e.g., SAVI or VHI), there is further potential to examine the role of these indices as a replacement or adjunct to the NDVI. Such future Sentinel-2 index-based approaches may also represent a useful addition to emerging satellite-based soil moisture products (e.g., the Soil Moisture Active Passive (SMAP) and Soil Moisture and Ocean Salinity (SMOS)) [62] that represent primarily shallow (0–5 cm) soil depths, but show strong correlations to depths up to 20 cm for some environments [63]. Studies have suggested that high resolution soil moisture measurements can be obtained through the combination of Sentinel-1 Synthetic Aperture Rader (SAR) and Sentinel-2 imagery [64].
Resolution clearly determines the ability of a sensor to generate NDVI, which can successfully approximate soil moisture. Landsat-8 NDVI produced no significant correlations, whereas Sentinel-2 NDVI variants, with its higher spectral and spatial resolution, were positively correlated in three of the five monitoring sites. The importance of spectral resolution is demonstrated through the comparative analysis of the new red-edge bands of Sentinel-2. The NDVI produced using the red-edge bands consistently out-performed the standard NIR band, even though this band has a higher spatial resolution. This may suggest that improvements in sensor spectral resolution offer greater advantages for this application of NDVI than improvements in spatial resolution. Due to the ease of NDVI calculation and high temporal resolution of the data, Sentinel-2 may have a future role in drought early warning systems, allowing for high resolution vegetation condition monitoring, which may be useful in detecting the onset of agricultural drought.
Supplementary Materials
The following are available online at https://www.mdpi.com/2073-4441/10/7/838/s1, Figure S1: Measured soil moisture and precipitation at Merced; Figure S2: Measured soil moisture and precipitation at Fallbrook; Figure S3: Measured soil moisture at Ford Dry Lake; Figure S4: Measured soil moisture at Las Cruces; Figure S5: Measured soil moisture at Desert Center; Figure S6: NDVI and measured soil moisture at 10 cm at Merced; Figure S7: NDVI and measured soil moisture at 20 cm at Merced; Figure S8: NDVI and measured soil moisture at 50 cm at Merced; Figure S9: NDVI and measured soil moisture at 5 cm at Fallbrook; Figure S10: NDVI and measured soil moisture at 10 cm at Fallbrook; Figure S11: NDVI and measured soil moisture at 5 cm at Ford Dry Lake; Figure S12: NDVI and measured soil moisture at 10 cm at Ford Dry Lake; Figure S13: NDVI and measured soil moisture at 20 cm at Ford Dry Lake; Figure S14: NDVI and measured soil moisture at 50 cm at Ford Dry Lake; Figure S15: NDVI and measured soil moisture at 100 cm at Ford Dry Lake; Figure S16: NDVI and measured soil moisture at 5 cm at Las Cruces; Figure S17: NDVI and measured soil moisture at 10 cm at Las Cruces; Figure S18: NDVI and measured soil moisture at 20 cm at Las Cruces; Figure S19: NDVI and measured soil moisture at 50 cm at Las Cruces; Figure S20: NDVI and measured soil moisture at 20 cm at Desert Center; Figure S21: NDVI and measured soil moisture at 50 cm at Desert Center.
Author Contributions
Conceptualization, H.W., N.Q. and M.H.; Data curation, H.W. and P.W.; Formal analysis, H.W., M.H. and P.W.; Methodology, H.W., N.Q., M.H. and P.W.; Software, H.W.; Supervision, N.Q., M.H. and P.W.
Funding
This research received no external funding.
Acknowledgments
The research presented in this paper was kindly supported by the Centre for Water, Communities and Resilience at the University of the West of England, Bristol, UK.
Conflicts of Interest
The authors declare no conflict of interest.
References
- Hayes, M.J.; Svoboda, M.D.; Wardlow, B.D.; Anderson, M.C.; Kogan, F. Drought Monitoring. In Remote Sensing of Drought: Innovative Monitoring Approaches; Wardlow, B.D., Anderson, M.C., Verdin, J.P., Eds.; CRC Press: New York, NY, USA, 2012; pp. 1–23. [Google Scholar]
- Touma, D.; Ashfaq, M.; Nayak, M.A.; Kao, S.C.; Diffenbaugh, N.S. A Multi-Model and Multi-Index Evaluation of Drought Characteristics in the 21th Century. J. Hydrol. 2015, 526, 196–207. [Google Scholar] [CrossRef]
- Ummenhofer, C.C.; England, M.H.; McIntosh, P.C.; Meyers, G.A.; Pook, M.J.; Risbey, J.S.; Gupta, A.S.; Taschetto, A.S. What Causes Southeast Australia’s Worst Droughts. Geophys. Res. Lett. 2009, 36, 1–5. [Google Scholar] [CrossRef]
- Aghakouchak, A.; Feldman, D.; Stewardson, M.J.; Saphores, J.D.; Grant, S.; Sanders, B. Australia’s Drought: Lessons for California. Science 2014, 343, 1430–1431. [Google Scholar] [CrossRef] [PubMed]
- Wang, J.; Jiang, D.; Huang, Y.; Wang, H. Drought Analysis of the Haihe River Basin Based on GRACE Terrestrial Water Storage. Sci. World J. 2014, 2014, 1–10. [Google Scholar] [CrossRef] [PubMed]
- Ault, T.R.; Mankin, J.S.; Cook, B.I.; Smerdon, J.E. Relative Impacts of Mitigation Temperature and Precipitation on 21st Century Megadrought in the American Southwest. Sci. Adv. 2016, 2, 1–8. [Google Scholar]
- Chao, N.; Wang, Z.; Jiang, W.; Chao, D. A Quantitative Approach for Hydrological Drought Characterisation in South-Western China using GRACE. Hydrogeol. J. 2016, 24, 893–903. [Google Scholar] [CrossRef]
- Loeb, N.G.; Wang, H.; Liang, L.; Kato, S.; Rose, F.G. Surface Energy Budget Changes over Central Australia during the early 21st Century Drought. Int. J. Climatol. 2016, 37, 159–168. [Google Scholar] [CrossRef]
- Baudoin, M.A.; Vogel, C.; Nortje, K.; Naik, M. Living with Drought in South Africa: Lessons Learnt from the Recent El Niño Drought Period. Int. J. Disaster Risk Reduct. 2017, 23, 128–137. [Google Scholar] [CrossRef]
- Marengo, J.A.; Torres, R.R.; Alves, L.M. Drought in Northeast Brazil—Past, Present and Future. Theor. Appl. Climatol. 2017, 129, 1189–1200. [Google Scholar] [CrossRef]
- Cook, B.I.; Anchukaitis, K.J.; Touchan, R.; Meko, D.M.; Cook, E.R. Spatiotemporal drought variability in the Mediterranean over the last 900 years. J. Geophys. Res. 2016, 121, 2060–2074. [Google Scholar] [CrossRef] [PubMed] [Green Version]
- Kelley, C.P.; Mohtadi, S.; Cane, M.A.; Seager, R.; Kushnir, Y. Climate change in the Ferticle Crescent and implications of the recent Syrian drought. Proc. Natl. Acad. Sci. USA 2015, 112, 3241–3246. [Google Scholar] [CrossRef] [PubMed]
- Luce, C.H.; Pederson, N.; Campbell, J.; Miller, C.; Kormos, P.; Vose, J.M.; Woods, R. Characterising Drought for Forested Landscapes and Streams. In Effects of Drought on Forests and Rangelands in the United States: A Comprehensive Science Synthesis; Vose, J.M., Clark, J.S., Luce, C.H., Patel-Weynand, T.P., Eds.; US Forest Service: Research & Development: Washington, DC, USA, 2016. [Google Scholar]
- Liu, X.; Zhu, X.; Pan, Y.; Li, S.; Liu, Y.; Ma, Y. Agricultural Drought Monitoring: Progress, Challenges & Prospects. J. Geogr. Sci. 2016, 26, 750–767. [Google Scholar]
- Wang, X.; Hongjie, X.; Guan, H.; Zhou, X. Different Responses of MODIS-Derived NDVI to Root-Zone Soil Moisture in Semi-Arid and Humid Regions. J. Hydrol. 2007, 340, 12–24. [Google Scholar] [CrossRef]
- Chen, T.; De Jeu, R.; Liu, Y.Y.; Van der Werf, G.R.; Dolman, A.J. Using Satellite Based Soil Moisture to Quantify the Water Driven Variability in NDVI: A Case Study over Mainland Australia. Remote Sens. Environ. 2014, 140, 330–338. [Google Scholar] [CrossRef]
- Ahmed, M.; Else, B.; Eklundh, L.; Ardö, J.; Seaquist, J. Dynamic Response of NDVI to Soil Moisture Variations during Different Hydrological Regimes in the Sahel Region. Int. J. Remote Sens. 2017, 38, 5408–5429. [Google Scholar] [CrossRef]
- Tate, E.L.; Gustard, A. Drought Definition: A Hydrological Perspective. In Drought and Drought Mitigation in Europe; Vogt, J.V., Somma, F., Eds.; Springer: Dordrecht, The Netherlands, 2000. [Google Scholar]
- Van Loon, A.F.; Stahl, K.; Di Baldassarre, G.; Clark, J.; Rangecroft, S.; Wanders, N.; Gleeson, T.; Van Dijk, A.I.J.M.; Tallaksen, L.M.; Hannaford, J.; et al. Drought in a Human-Modified World: Reframing Drought Definitions Understanding, and Analysis Approaches. Hydrol. Earth Syst. Sci. 2016, 20, 3631–3650. [Google Scholar] [CrossRef]
- Sur, C.; Hur, J.; Kim, K.; Choi, W.; Choi, M. An Evaluation of Satellite-Based Drought Indices on a Regional Scale. Int. J. Remote Sens. 2015, 36, 5593–5612. [Google Scholar] [CrossRef]
- Janowiak, J.E. An Investigation of interannual rainfall variability in Africa. J. Clim. 1988, 1, 240–255. [Google Scholar] [CrossRef]
- Nicholson, S.E. African Drought: Characteristics. Casual Theories, and Global Teleconnections. In Understanding Climate Change; Berger, A., Dickinson, R.E., Kidson, J.W., Eds.; American Geophysical Union: Washington, DC, USA, 1989. [Google Scholar]
- Trotter, C.M. Remotely Sensed Data as an Information Source for Geographical Information Systems in Natural Resource Management: A Review. Int. J. Geogr. Inf. Syst. 1991, 5, 225–239. [Google Scholar] [CrossRef]
- Choi, M.; Jacobs, J.M.; Anderson, M.C.; Bosch, D.D. Evaluation of Drought Indices via Remotely Sensed Data with Hydrological Variables. J. Hydrol. 2013, 476, 265–273. [Google Scholar] [CrossRef]
- Tucker, C.J.; Vanpraet, C.L.; Boerwinkel, E.; Gatson, A. Satellite Remote Sensing of Total Herbaceous Biomass Production in the Senegalese Sahel: 1980–1984. Remote Sens. Environ. 1983, 17, 461–474. [Google Scholar] [CrossRef]
- Anyamba, A.; Tucker, C.J.; Eastman, J.R. NDVI Anomaly Patterns over Africa during the 1997/8 ENSO Warm Event. Int. J. Remote Sens. 2001, 22, 1847–1859. [Google Scholar]
- Klisch, A.; Atzberger, C. Operational Drought Monitoring in Kenya using MODIS NDVI Time Series. Remote Sens. 2016, 8, 267. [Google Scholar] [CrossRef]
- Brown, J.F.; Wardlow, B.D.; Tadesse, T.; Hayes, M.J.; Reed, B.C. The Vegetation Drought Response Index (VegDRI): A New Integrated Approach for Monitoring Drought Stress in Vegetation. GISci. Remote Sens. 2008, 45, 16–46. [Google Scholar] [CrossRef]
- Sheffield, J.; Wood, E.F.; Chaney, N.; Guan, K.; Sadri, S.; Yuan, X.; Olang, L.; Amani, A.; Ali, A.; Demuth, S.; et al. A Drought Monitoring and Forecasting System for Sub-Sahara African Water Resources and Food Security. Bull. Am. Meteorol. Soc. 2014, 95, 861–882. [Google Scholar] [CrossRef]
- Gu, Y.; Hunt, E.; Wardlow, B.; Basara, J.B.; Brown, J.F.; Verdin, J.P. Evaluation of MODIS NDVI and NDWI for Vegetation Drought Monitoring using Oklahoma Mesonet Soil Moisture Data. Geophys. Res. Lett. 2008, 35. [Google Scholar] [CrossRef]
- Ozelkan, E.; Chen, G.; Ustundag, B.B. Multiscale Object-Based Drought Monitoring and Comparison in Rainfed and Irrigated Agriculture from Landsat 8 OLI Imagery. Int. J. Appl. Earth Obs. Geoinf. 2016, 44, 159–170. [Google Scholar] [CrossRef]
- Sholihah, R.I.; Trisasongko, B.H.; Shiddiq, D.; La Ode, S.I.; Kusdaryanto, S.; Panuju, D.R. Identification of Agricultural Drought Extent Based on Vegetation Health Indices of Landsat Data: Case of Subang and Karawang, Indonesia. Procedia Environ. Sci. 2016, 33, 14–20. [Google Scholar] [CrossRef]
- Davies, T.; Everard, M.; Horswell, M. Community-Based Groundwater and Ecosystem Restoration in Semi-Arid North Rajasthan (3): Evidence from Remote Sensing. Ecosyst. Serv. 2016, 21, 20–30. [Google Scholar] [CrossRef]
- Gitelson, A.A.; Viña, A.; Ciganda, V.; Rundquist, D.C.; Arkebauer, T.J. Remote Estimation of Canopy Chlorophyll Content in Crops. Geophys. Res. Lett. 2005, 32. [Google Scholar] [CrossRef]
- Delegido, J.; Verrelst, J.; Alonsa, L.; Moreno, J. Evaluation of Sentinel-2 Red-edge Bands for Empirical Estimation of Green LAI and Chlorophyll Content. Sensors 2011, 11, 7063–7081. [Google Scholar] [CrossRef] [PubMed]
- Hill, M.J. Vegetation Index Suites as Indicators of Vegetation State in Grassland and Savanna: An Analysis with Simulated Sentinel 2 Data for a North American Transect. Remote Sens. Environ. 2013, 137, 94–111. [Google Scholar] [CrossRef]
- Ramoelo, A.; Cho, M.; Mathieu, R.; Skidmore, A.K. Potential of Sentinel 2 Spectral Configuration to Assess Rangeland Quality. J. Appl. Remote Sens. 2015, 9, 1–11. [Google Scholar] [CrossRef]
- Wang, Q.; Wenzhong, S.; Zhongbin, L.; Atkinson, P.M. Fusion of Sentinel 2 Images. Remote Sens. Environ. 2016, 187, 241–252. [Google Scholar] [CrossRef]
- Sadeghi, M.; Babaeian, E.; Tuller, M.; Jones, S.B. The Optical Trapezoid Model: A Novel Approach to Remote Sensing of Soil Moisture Applied to Sentinel 2 and Landsat 8 Observations. Remote Sens. Environ. 2017, 198, 52–68. [Google Scholar] [CrossRef]
- Korhonen, L.; Hadi; Packalen, P.; Rautiainen, M. Comparison of Sentinel 2 and Landsat 8 in the Estimation of Boreal Forest Canopy Cover and Leaf Area Index. Remote Sens. Environ. 2017, 195, 259–274. [Google Scholar] [CrossRef]
- Frampton, W.J.; Dash, J.; Watmough, G.; Milton, E.J. Evaluating the Capabilities of Sentinel 2 for Quantitative Estimation of Biophysical Variables in Vegetation. ISPRS J. Photogramm. Remote Sens. 2013, 82, 83–92. [Google Scholar] [CrossRef]
- Clevers, J.G.P.W.; Gitelson, A.A. Remote Estimation of Crop and Grass Chlorophyll and Nitrogen Content Using Red-Edge Bands on Sentinel 2 and 3. Int. J. Appl. Earth Obs. Geoinf. 2013, 23, 344–351. [Google Scholar] [CrossRef]
- Stratoulias, D.; Balzter, H.; Sykioti, O.; Zlinszky, A.; Toth, V.R. Evaluating Sentinel 2 for Lakeshore Habitat Mapping Based on Airborne Hyperspectral Data. Sensors 2015, 15, 22956–22969. [Google Scholar] [CrossRef] [PubMed]
- Teillet, P.M.; Guindon, B.; Goodenough, D.G. On the Slope-Aspect Correction of Multispectral Scanner Data. Can. J. Remote Sens. 1982, 8, 84–106. [Google Scholar] [CrossRef] [Green Version]
- Yu, Q.; Gong, P.; Clinton, N.; Biging, G.; Kelly, M.; Schirokauer, D. Object-Based Detailed Vegetation Classification with Airborne High Spatial Resolution Remote Sensing Imagery. Photogramm. Eng. Remote Sens. 2006, 72, 799–811. [Google Scholar] [CrossRef]
- Lu, D.; Weng, Q. A Survey of Image Classification Methods and Techniques for Improving Classification Performance. Int. J. Remote Sens. 2007, 25, 823–870. [Google Scholar] [CrossRef]
- Engstrom, R.; Hope, A.; Kwon, H.; Stow, D. The Relationship between Soil Moisture and NDVI near Barrow, Alaska. Phys. Geogr. 2008, 29, 38–53. [Google Scholar] [CrossRef]
- Porporato, A.; Laio, F.; Ridolfi, L.; Rodriguez-Iturbe, I. Plants in Water-Controlled Ecosystems: Active Role in Hydrologic Processes and Response to Water Stress III. Adv. Water Resour. 2001, 24, 725–744. [Google Scholar] [CrossRef]
- Krishnamoorthy, K. Statistical Tolerance Regions: Theory, Applications and Computation; John Wiley & Sons: New York, NY, USA, 2009. [Google Scholar]
- Steiger, J.H. Tests for Comparing Elements of a Correlation Matrix. Psychol. Bull. 1980, 87, 245–251. [Google Scholar] [CrossRef]
- Hittner, J.B.; May, K.; Silver, N.C. A Monte Carlo Evaluation of Tests for Comparing Dependent Correlations. J. Gen. Psychol. 2003, 130, 149–168. [Google Scholar] [CrossRef] [PubMed]
- Yeh, P.J.F.; Famiglietti, J.S. Regional Groundwater Evapotranspiration in Illinois. J. Hydrometeorol. 2009, 10, 464–478. [Google Scholar] [CrossRef] [Green Version]
- Gibbens, R.P.; Lenz, J.M. Root Systems of Some Chihauhuan Desert Plants. J. Arid Environ. 2001, 49, 221–263. [Google Scholar] [CrossRef]
- Jochen Schenk, H.; Jackson, R.B. Rooting Depths, Lateral Root Spreads and Below-Ground/Above Ground Allometries of Plants in Water-Limited Ecosystems. J. Ecol. 2002, 90, 480–494. [Google Scholar] [CrossRef]
- Cannon, W.A. The Root Habits of Desert Plants; Carnegie Institution of Washington: Washington, DC, USA, 1911. [Google Scholar]
- Forseth, I.N.; Ehleringer, J.R.; Werk, K.S.; Cook, C.S. Field Water Relations of Sonoran Desert Annuals. Ecology 1984, 65, 1436–1444. [Google Scholar] [CrossRef]
- Wallace, A.; Romney, E.M.; Cha, J.W. Depth Distribution of Roots of Some Perennial Plants in the Nevada Test Site Area of the Northern Mojave Desert. Great Basin Nat. Mem. 1980, 4, 201–207. [Google Scholar]
- Baret, F.; Jacquemoud, S.; Hanocq, J.F. The Soil Line Concept in Remote Sensing. Remote Sens. Rev. 1993, 7, 65–82. [Google Scholar] [CrossRef]
- Canton, Y.; Domingo, F.; Sole-Benet, A.; Puigdefabregas, J. Hydrological and Erosion Response of a Badlands System in Semi-Arid SE Spain. J. Hydrol. 2001, 252, 65–84. [Google Scholar] [CrossRef]
- Abu-Awwad, A.M.; Shatanawi, M.R. Water Harvesting and Infiltration in Arid Areas affected by Surface Crust: Examples from Jordan. J. Arid Environ. 1997, 37, 443–454. [Google Scholar] [CrossRef]
- Zribi, M.; Anguela, T.P.; Duchemin, B.; Lili, Z.; Wagner, W.; Hasenauer, S.; Chehbouni, A. Relationship between Soil Moisture and Vegetation in the Kairouan Plain Region of Tunisia using Low Spatial Resolution Satellite Data. Water Resour. Res. 2010, 46, 1–13. [Google Scholar] [CrossRef]
- Al-Yaari, A.; Wingeron, J.-P.; Kerr, Y.; Rodriguez-Fernandez, N.; O’Neill, P.E.; Jackson, T.J.; De Lannoy, G.J.M.; Al Bitar, A.; Milan, A.; Richaume, P.; et al. Evaluating Soil Moisture Retrievals from ESA’s SMOS and NASA’s SMAP Brightness Temperature Datasets. Remote Sens. Environ. 2017, 193, 257–273. [Google Scholar] [CrossRef] [PubMed]
- Velpuri, N.M.; Senay, G.B.; Morisette, J.T. Evaluating New SMAP Soil Moisture for Drought Monitoring in the Rangelands of the US High Plains. Rangelands 2016, 38, 183–190. [Google Scholar] [CrossRef]
- El Hajj, M.; Baghdadi, N.; Zribi, M.; Bazzi, H. Synergic Use of Sentinel-1 and Sentinel-2 Images for Operational Soil Moisture Mapping at High Spatial Resolution over Agricultural Areas. Remote Sens. 2017, 9, 1292. [Google Scholar] [CrossRef]
Figure 1.
Top: Location of each site and Level III Ecoregion classifications (Southwest United States). Bottom: Drought severity at each site as classified by the U.S. Drought Monitor. Note: different analysis periods were used at each station due to variation in available data. The white cells indicate where no data were available. Data obtained from: http://droughtmonitor.unl.edu/CurrentMap.aspx.

Figure 2.
Seasonal average plant available water in the top 30 cm. Winter is December, January, and February; Summer is June, July, and August.
Figure 2.
Seasonal average plant available water in the top 30 cm. Winter is December, January, and February; Summer is June, July, and August.

Figure 3.
Measured soil moisture and precipitation at four depths at Merced. Likely plant available water is shown as the area between field capacity and wilting point (SSURGO database values).
Figure 3.
Measured soil moisture and precipitation at four depths at Merced. Likely plant available water is shown as the area between field capacity and wilting point (SSURGO database values).

Figure 4.
Mean Normalised Difference Vegetation Index for Landsat-8 time series (NDVILS) trends for the five sites.
Figure 4.
Mean Normalised Difference Vegetation Index for Landsat-8 time series (NDVILS) trends for the five sites.

Figure 5.
NDVI variants and soil moisture measured at 10 cm depth representing soil between 7.5 cm and 15 cm below the surface at the Merced site.
Figure 5.
NDVI variants and soil moisture measured at 10 cm depth representing soil between 7.5 cm and 15 cm below the surface at the Merced site.

Figure 6.
Top: Box plots of Sentinel-2 Band 8 and Landsat-8 (Band 5) NDVI for Merced and Ford Dry Lake; Bottom: Graphical representation of tolerance intervals for Sentinel-2 NDVI at each site (letters represent the initials of each site).
Figure 6.
Top: Box plots of Sentinel-2 Band 8 and Landsat-8 (Band 5) NDVI for Merced and Ford Dry Lake; Bottom: Graphical representation of tolerance intervals for Sentinel-2 NDVI at each site (letters represent the initials of each site).

Figure 7.
Spectral response curves of site vegetation and sensor band positions. Sentinel-2 bands are shown in block colors and numbers correspond to band names.
Figure 7.
Spectral response curves of site vegetation and sensor band positions. Sentinel-2 bands are shown in block colors and numbers correspond to band names.


Table 1.
Environmental conditions and available Sentinel-2 and Landsat 8 imagery at each monitoring site. Data obtained from the United Stated Department of Agriculture (USDA) and U.S. Climate Data.
Table 1.
Environmental conditions and available Sentinel-2 and Landsat 8 imagery at each monitoring site. Data obtained from the United Stated Department of Agriculture (USDA) and U.S. Climate Data.
| Site | National Landcover Classification/Köppen-Geiger Climate Classification | Level III/IV Ecoregion Classification (% Cover) | Geology and Soil | Annual Rainfall (mm) | Sentinel-2 Mages | Landsat 8 Mages | |
|---|---|---|---|---|---|---|---|
| 1981–2010 Regional AAR | |||||||
| 2014/2015 (%AAR) | 2015/2016 (%AAR) | ||||||
| Merced (37.2381/−120.8825) California | Temperate and Boreal Freshwater Wet Meadow Marsh/BSk: Arid | Central California Valley: San Joaquin Basin (77%) | Quaternary alluvium and marine deposits: Edminster loam, poorly drained, high runoff when saturated | 332 | 27 | 17 | |
| 210.1 (63.3%) | 320.7 (96.6%) | ||||||
| Fallbrook (33.4392/−117.1904) California | Mediterranean Scrub/Csa: Warm Temperate | Southern California: Diegan Western Granitic Foothills (69%) | Mesozoic granitic rocks: Las Posas rocky loam, 15 to 50% slopes, eroded, high runoff when saturated | 406 | 32 | 20 | |
| 287.1 (70.7%) | 213.1 (52.5%) | ||||||
| Ford Dry Lake (33.6547/−115.09763) California | Warm Semi- Arid Grassland/BWh: Arid | Sonoran Desert: Central Sonoran (44%) | Quaternary sand deposits: Orita gravelly fine sandy loam, low runoff when saturated, percolation is unimpeded | 91 | 38 | 26 | |
| 71.9 (79.1%) | 181.7 (199.6%) | ||||||
| Las Cruces (32.6137/−106.7414) New Mexico | Warm Semi-Arid Grassland/BWk: Arid | Chihuahuan Desert: Chihauhuan Basins and Playas (14%) | Quaternary and Tertiary: Dona Ana association, low runoff potential and percolation is unimpeded unconsolidated deposits | 257 | 29 | 20 | |
| 283.6 (110.4%) | 41.1 (16.1%) | ||||||
| Desert Center (33.80208/−15.30505) California | Warm Semi-Arid Grassland/BWh: Arid | Sonoran Desert: Central Sonoran (29%) | Quaternary sand deposits: Orita gravelly fine sandy loam, low runoff when saturated, percolation is unimpeded | 91 | 34 | 24 | |
| 71.9 (79.1%) | 181.7 (199.6%) | ||||||
Table 2.
Pearson correlation coefficients between each soil depth and each monitoring site.
| Soil Depth | Site | Correlation with 10 cm | Correlation with 20 cm | Correlation with 50 cm | Correlation with 100 cm |
|---|---|---|---|---|---|
| 5 cm | Merced | 0.977 * | 0.827 * | 0.156 | NA |
| Fallbrook | 0.959 * | NA | NA | NA | |
| Ford Dry Lake | 0.919 * | 0.741 * | −0.456 * | −0.595 * | |
| Las Cruces | 0.934 * | 0.649 * | 0.176 | −0.708 | |
| Desert Center | 0.049 | 0.302 | 0.119 | NA | |
| 10 cm | Merced | 0.789 * | 0.07 | NA | |
| Ford Dry Lake | 0.895 * | −0.31 | −0.612 | ||
| Las Cruces | 0.825 * | 0.342 * | −0.775 * | ||
| Desert Center | 0.721 * | −0.017 | NA | ||
| 20 cm | Merced | 0.606 * | NA | ||
| Ford Dry Lake | −0.051 | −0.478 | |||
| Las Cruces | 0.755 * | −0.578 | |||
| Desert Center | −0.04 | NA | |||
| 50 cm | Ford Dry Lake | 0.784 * | |||
| Las Cruces | −0.165 |
Notes: * denotes statistical significance at the 5% level; NA represents no data available at this depth.
Table 3.
Correlation coefficients between Normalised Difference Vegetation Index (NDVI) and measured soil moisture at each monitoring site.
Table 3.
Correlation coefficients between Normalised Difference Vegetation Index (NDVI) and measured soil moisture at each monitoring site.
| Soil Depth | Site | Landsat-8 | Sentinel-2 | ||||
|---|---|---|---|---|---|---|---|
| NDVILS | NDVI8 | NDVI5 | NDVI6 | NDVI7 | NDVI8A | ||
| 5 cm | Merced | 0.308 | 0.78 * | 0.816 * | 0.811 * | 0.803 * | 0.78 * |
| Fallbrook | 0.027 | 0.603 * | 0.587 * | 0.686 * | 0.636 * | 0.53 * | |
| Ford Dry Lake | 0.353 | 0.392 * | 0.299 | 0.486 * | 0.5 * | 0.487 * | |
| Las Cruces | −0.603 | –0.21 | 0.205 | −0.298 | −0.456 * | −0.539 * | |
| Desert Center | 0.338 | −0.122 | −0.23 | −0.099 | 0.053 | 0.121 | |
| 10 cm | Merced | 0.397 | 0.826 * | 0.85 * | 0.855 * | 0.846 * | 0.824 * |
| Fallbrook | 0.294 | 0.729 * | 0.647 * | 0.785 * | 0.758 * | 0.669 * | |
| Ford Dry Lake | 0.558 | 0.504 * | 0.4 * | 0.591 * | 0.597 * | 0.579 * | |
| Las Cruces | −0.595 | −0.091 | 0.334 | −0.256 | −0.446 * | −0.524 * | |
| Desert Center | −0.10 | 0.148 | 0.151 | 0.152 | 0.156 | 0.093 | |
| 20 cm | Merced | 0.104 | 0.489 * | 0.578 * | 0.526 * | 0.516 * | 0.487 * |
| Ford Dry Lake | 0.653 | 0.479 * | 0.323 * | 0.547 * | 0.589 * | 0.594 * | |
| Las Cruces | −0.27 | 0.054 | 0.343 | −0.144 | −0.303 | −0.352 * | |
| Desert Center | −0.10 | 0.19 | 0.239 | 0.213 | 0.215 | 0.164 | |
| 50 cm | Merced | −0.418 | −0.29 | −0.158 | −0.258 | −0.27 | −0.297 |
| Ford Dry Lake | 0.203 | −0.277 | −0.38 | −0.252 | −0.158 | −0.133 | |
| Las Cruces | 0.256 | 0.191 | 0.29 | 0.038 | −0.045 | −0.058 | |
| Desert Center | −0.562 | −0.734 * | −0.593 * | −0.759 * | −0.655 * | −0.546 * | |
| 100 cm | Ford Dry Lake | −0.145 | −0.523 * | −0.604 * | −0.499 * | −0.384 * | −0.333 * |
| Las Cruces | 0.165 | 0.172 | −0.449 | 0.387 | 0.623 | 0.697 | |
Note: * denotes statistical significance at the 5% level.
Table 4.
Summary of NDVI observed trends, relationship with soil moisture, and NDVI tolerance intervals for each site.
Table 4.
Summary of NDVI observed trends, relationship with soil moisture, and NDVI tolerance intervals for each site.
| Site | Description | Strongest NDVI Correlation | Tolerance Interval Analysis |
|---|---|---|---|
| Merced | NDVI trends showed seasonal variation. Higher NDVI values were present during the winter, associated with frequent precipitation events. During summer, NDVI and soil moisture at 10 cm dropped significantly as a result of intensifying drought conditions, then remained constant. NDVI calculated using each of the S2 bands produced significant positive correlations with soil moisture at 10 cm and 20 cm. No correlations between NDVI and soil moisture at 50 cm were found, suggesting that plants do not respond to moisture at this depth. | NDVI5 | Each band produced a large NDVI range with high confidence. This suggests the vegetation condition varied more widely over the study period. |
| Fallbrook | Some seasonal variation with average NDVI during the winter and spring were higher than summer when drought conditions were most severe. Significant positive correlations were found between NDVI from S2 and soil moisture measured at 5 cm and 10 cm. | NDVI6 | Each band produced moderate NDVI ranges with high confidence, suggesting vegetation condition varied over the study period. |
| Ford Dry Lake | No seasonal variations in NDVI or soil moisture were observed and NDVI remained relatively constant. NDVI values produced for this site were very low, suggesting the vegetation was under constant stress, but with a discernible NDVI response to slightly wetter conditions from December 2016. Significant positive relationships between NDVI and soil moisture were present for the first 20 cm of the soil. Significant negative correlations between NDVI and moisture at 100 cm were also present. The seasonal trends at depths of 50 cm and 100 cm were the inverse of monthly rainfall. Higher moisture levels occurred in summer when conditions were dry, resulting in negative correlations between NDVI and moisture. | NDVI7 | Each band produced a small NDVI range with high confidence. This suggests the vegetation condition did not vary over the study period. |
| Las Cruces | As with the other two semi-arid sites, NDVI and soil moisture values at Las Cruces were low with no variation. No significant positive correlations were present between S2 NDVI and the soil moisture. Significant negative correlations were calculated between Bands 7 and 8A with soil moisture (5 cm and 10 cm) measurements. There were no significant positive correlations with any NDVI values at depths greater than 20 cm. | NA | Each band produced a small NDVI range with high confidence. This suggests the vegetation condition did not vary over the study period. |
| Desert Center | No seasonal variations in NDVI or soil moisture were observed. The NDVI values produced were very low, suggesting poor quality and stressed vegetation. No correlation between S2 NDVI and soil moisture was present at a depth of 20 cm. Significant negative correlations were present at a depth of 50 cm. | NA | Each band produced a small NDVI range with high confidence. This suggests the vegetation condition did not vary over the study period. |
Table 5.
Steiger Correlation Comparison between Sentinel-2 near infrared (NIR) Bands.
| Site | Soil Depth (cm) | NDVI8 | Factor-RedEdge | Factor-NIR |
|---|---|---|---|---|
| Merced | 5 | 0.78 * | 0.805 * | 0.8 * |
| 10 | 0.826 * | 0.846 * | 0.842 * | |
| 20 | 0.489 * | 0.528 * | 0.521 * | |
| 50 | −0.29 | −0.247 | −0.255 | |
| Fallbrook | 5 | 0.603 * | 0.649 * | 0.641 * |
| 10 | 0.729 * | 0.763 * | 0.759 * | |
| Ford Dry Lake | 5 | 0.392 * | 0.48 * | 0.463 * |
| 10 | 0.504 * | 0.585 * | 0.57 * | |
| 20 | 0.479 * | 0.557 * | 0.542 * | |
| 50 | −0.277 | −0.24 | −0.252 | |
| 100 | −0.523 * | −0.481 * | −0.495 * | |
| Desert Center | 5 | −0.112 | −0.033 | −0.061 |
| 10 | 0.148 | 0.156 | 0.157 | |
| 20 | 0.19 | 0.233 | 0.227 | |
| 50 | −0.734 | 0.727 * | −0.741 * | |
| Las Cruces | 5 | −0.21 | −0.382 * | −0.332 |
| 10 | −0.091 | −0.341 * | −0.258 | |
| 20 | 0.054 | −0.203 | −0.129 | |
| 50 | 0.191 | 0.023 | 0.073 |
Notes: Grey shading indicates significant difference in correlation; * denotes statistical significance at the 5% level.
© 2018 by the authors. Licensee MDPI, Basel, Switzerland. This article is an open access article distributed under the terms and conditions of the Creative Commons Attribution (CC BY) license (http://creativecommons.org/licenses/by/4.0/).
Share and Cite
MDPI and ACS Style
West, H.; Quinn, N.; Horswell, M.; White, P. Assessing Vegetation Response to Soil Moisture Fluctuation under Extreme Drought Using Sentinel-2. Water 2018, 10, 838. https://doi.org/10.3390/w10070838
AMA Style
West H, Quinn N, Horswell M, White P. Assessing Vegetation Response to Soil Moisture Fluctuation under Extreme Drought Using Sentinel-2. Water. 2018; 10(7):838. https://doi.org/10.3390/w10070838
Chicago/Turabian StyleWest, Harry, Nevil Quinn, Michael Horswell, and Paul White. 2018. "Assessing Vegetation Response to Soil Moisture Fluctuation under Extreme Drought Using Sentinel-2" Water 10, no. 7: 838. https://doi.org/10.3390/w10070838
Note that from the first issue of 2016, this journal uses article numbers instead of page numbers. See further details here.