An Integrated Method for Accounting for Water Environmental Capacity of the River–Reservoir Combination System


1
Ministry of Education Key Lab of Water and Sand Science, School of Environment, Beijing Normal University, Beijing 100875, China.
2
College of Resources and Environment, Yangtze University, Wuhan, 430100 China
3
Sate Key Laboratory of Environmental Criteria and Risk Assessment, Chinese Research Academy of Environmental Sciences, Beijing 100012, China
*
Authors to whom correspondence should be addressed.
Water 2018, 10(4), 483; https://doi.org/10.3390/w10040483
Submission received: 31 January 2018
/
Revised: 26 March 2018
/
Accepted: 11 April 2018
/
Published: 14 April 2018
(This article belongs to the Special Issue Adaptive Catchment Management and Reservoir Operation)
Abstract
:The security of drinking water is a serious issue in China and worldwide. As the backup source of drinking water for the Changde City in China, the Huangshi Reservoir suffers from the threat of eutrophication due to the water quality of the reservoir ecosystem being affected by the tributaries that carry Non-Point Source (NPS) pollutants. The calculation of the water environmental capacity (WEC) can provide a scientific basis for water pollution control, which refers to the maximum amount of pollutants that the water can accommodate. In this paper, according to the hydrological characteristics of the river–reservoir combination system, a one-dimensional (1-D) water quality model and the Environmental Fluid Dynamics Code (EFDC) model were chosen to calculate the water environmental capacity of each functional zone in this basin. The quantity control of pollution from the tributaries was conducted based on the combined results of the water environmental capacity calculation from the EFDC model and a one-dimensional (1-D) river water quality model. The results show that total water environmental capacity of the tributaries included a chemical oxygen demand (COD) of 421.97 tons; ammonia nitrogen (NH3-N) of 40.99 tons; total nitrogen (TN) of 35.94 tons; and total phosphorus (TP) of 9.54 tons. The water environmental capacity of the Huangshi Reservoir region accounts for more than 93% of the total capacity. The reduction targets of the major pollutants in the Huangshi Reservoir and its four major input rivers, which are, namely, the Bamao River, the Longtan River, the Fanjiafang River, and the Dongtan River, have been determined to achieve the water quality objectives for the reservoir in 2020 and 2025. The results will be helpful for the local water quality management and will provide a valuable example for other similar water source reservoirs.
1. Introduction
In recent years, instead of flood control and irrigation, drinking water supplementation has become the primary purpose of reservoirs in China [1]. The issue of drinking water security plays a decisive role in the national economy and social wellbeing in China [2,3]. With the enormous development of aquaculture, water pollution in reservoirs has become a serious problem with the water quality of drinking water source directly influencing people’s health, which is related to the economic development and stability of the general social situation.
The water environmental capacity (WEC) refers to the maximum amount of pollutants that the water can accommodate under the designed hydrological conditions and the specified environmental objectives without destroying its own function [4,5]. Generally, the calculation of WEC can provide a scientific basis for water pollution control as it provides a baseline for the total pollutant reduction needed. Previous studies mainly focused on various methods of calculating WEC [6,7,8,9,10,11,12,13,14,15,16,17,18], including analytical methods, dynamic mechanism model methods, and the calculation of the water environment capacity in a specific area [11,14,16,19,20,21,22,23]. Most case studies mainly use a river [12,15,16,19,23], lake, and reservoir [6,14,20,22] as objects in China, but there has been less research on the WEC of a certain river–reservoir combination system.
In addition, there are many models and equations available to calculate the WEC of rivers, lakes, and reservoirs. For this study, it is important to select the proper water quality simulation model. In calculating WEC, the use of three-dimensional modeling for simulating the water ecosystems has been used extensively and successfully by many studies [24,25,26]. They can simulate and predict the overall water quality of the water bodies for evaluating the WEC. In this sense, they are superior to the traditional field monitoring methods, which are mainly based on the field data monitored at limited locations [27,28,29,30,31].
Many studies have indicated that the inflow discharges will affect the variations of pollutants or nutrients in reservoirs [3,4,5,32,33,34]. As the backup drinking water source reservoir for Changde City in China, the Huangshi Reservoir, with multiple tributaries, is currently suffering from the threat of eutrophication, with the influence of pollutants or nutrients from the tributaries of Huangshi Reservoir having not been taken into consideration. It is necessary to calculate the WEC of the river–reservoir combination system. The purpose of this study is to simulate the WEC and control the amount of pollution in a drinking water reservoir with multiple tributaries using a widely used model, the environmental fluid dynamic model (EFDC), coupled with a 1-D convection equation.
This research paper is arranged as follows: firstly, the EFDC model is applied to analyze the changing trends of the water quality in the Huangshi Reservoir and its tributaries. Secondly, the 1-D water quality model and the EFDC model were chosen to calculate the WEC of each functional zone of the river–reservoir combination system. Finally, the quantity control of pollution of the multiple tributaries is analyzed based on the combined results of the WEC calculation.
2. Study Area
2.1. Study Area
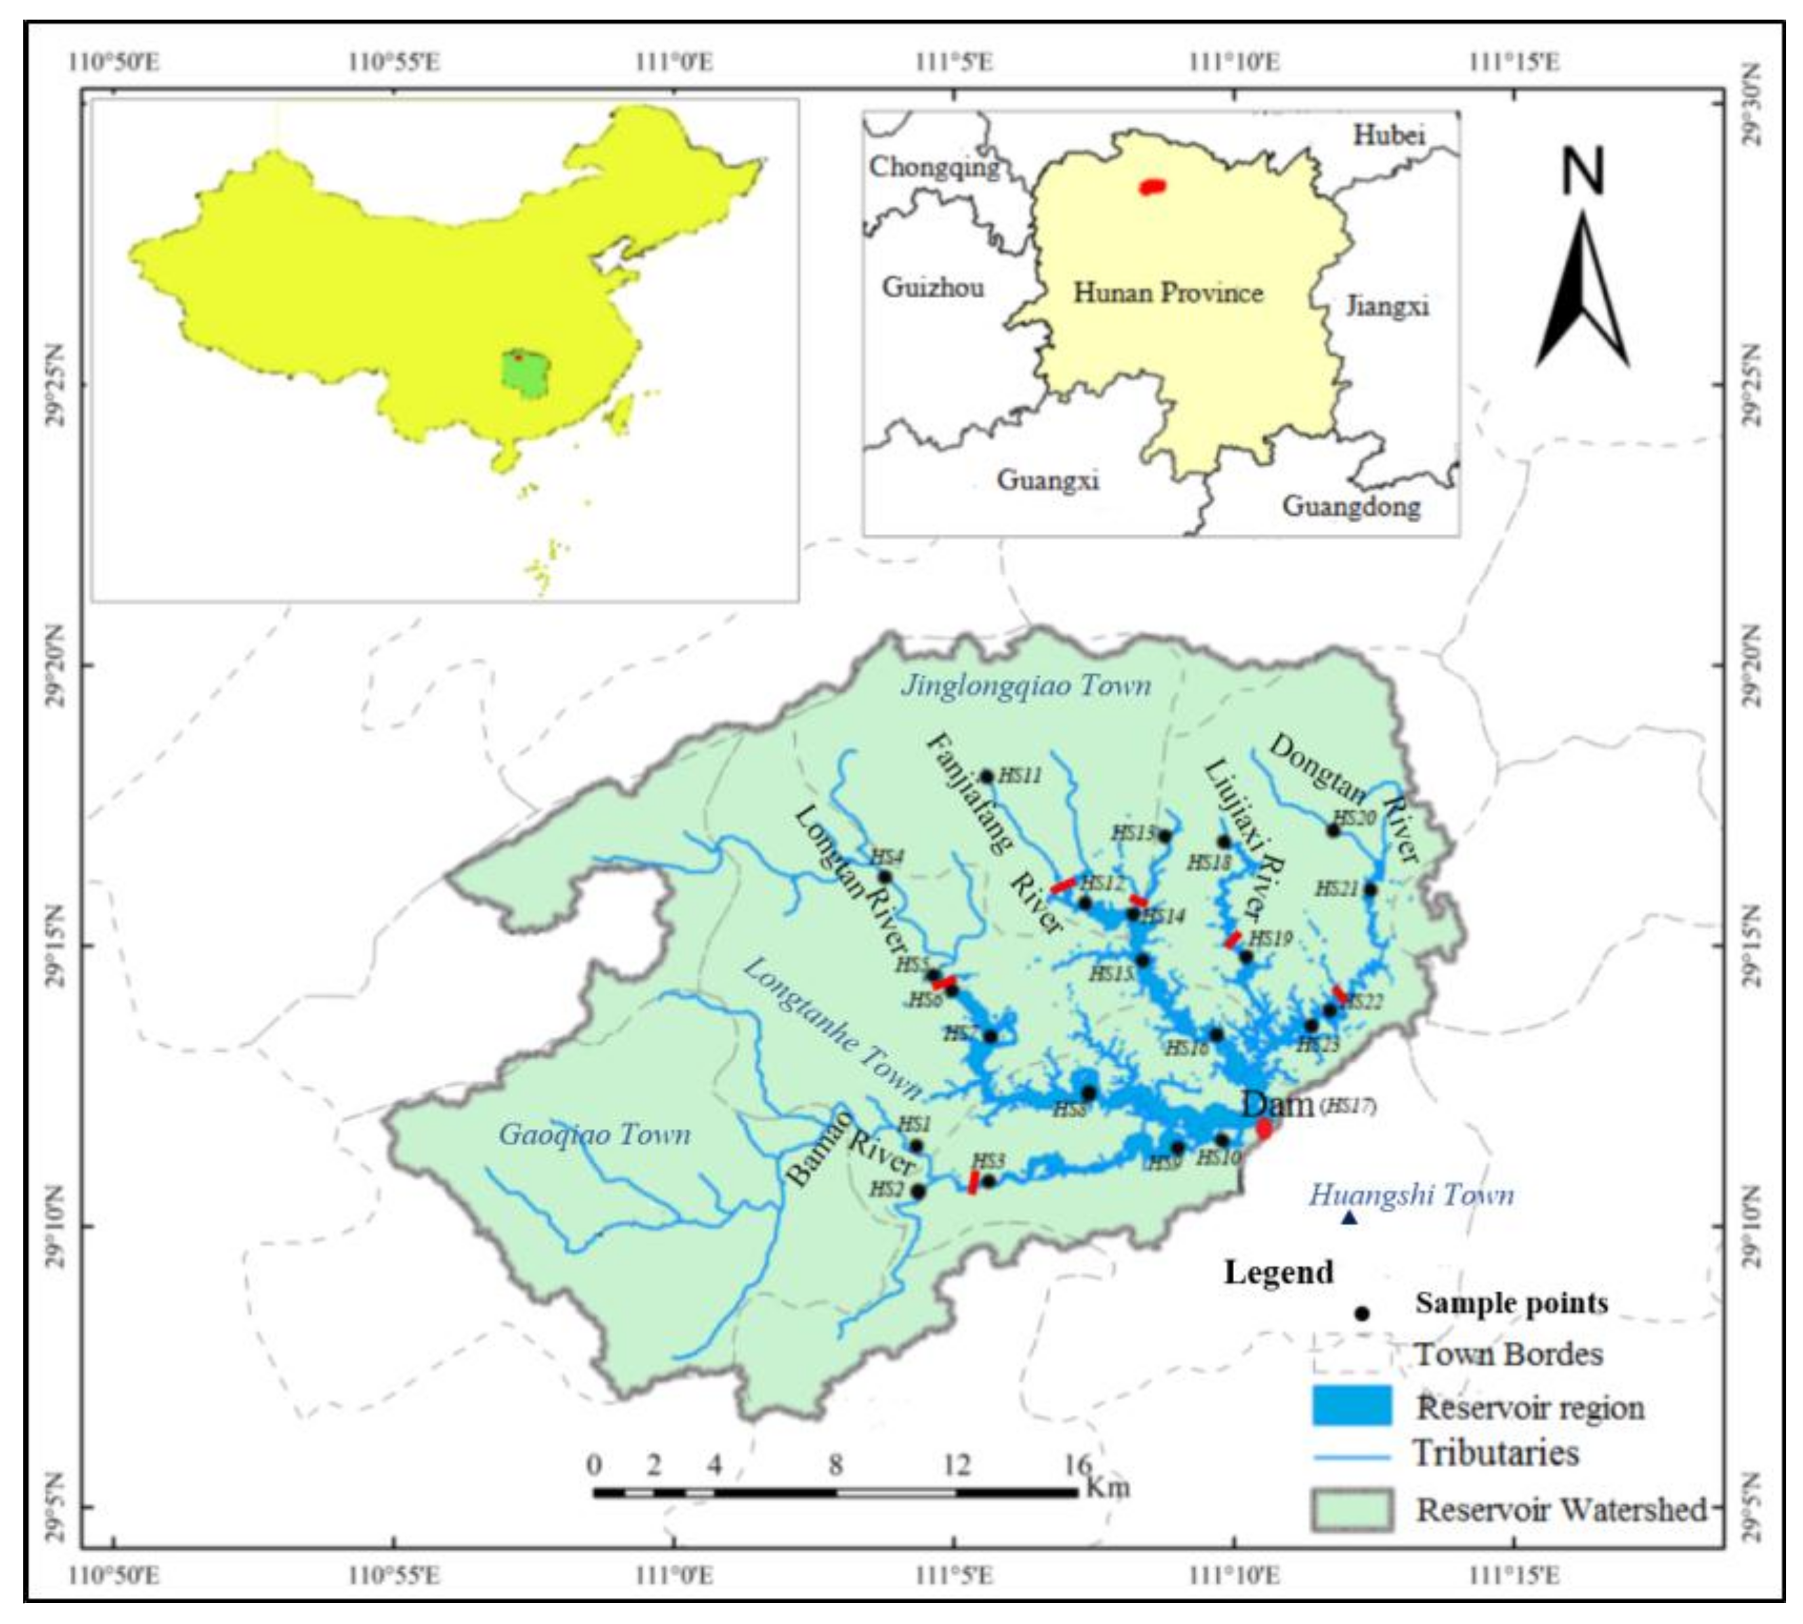
The Huangshi Reservoir is a large-scale water conservancy project, which mainly provides the benefits of irrigation, flood control, power generation, and a habitat for fish, among others. It is located in the Huangshi town, Hunan Province, China. The reservoir is mainly fed by the convergences of the Bamao River, the Longtan River, the Fanjiafang River, the Liujiaxi River, and the Dongtan River. The boundary of the reservoir and the tributaries is shown in Figure 1, with the main characteristics of the tributaries shown in Table 1. The weather is relatively moderate with an annual average temperature of 16.8 °C. The annual average precipitation is about 1465.2 mm, the annual mean evaporation is about 1284.2 mm, and the relative humidity is 77%. The total storage capacity of the reservoir is 6.02 × 10⁹ m3, and the effective storage capacity is 3.38 × 10⁹ m3. The watershed has a total area of 494.34 km2, with forests being the major land use type that accounts for 85.12% of the total basin area.
2.2. Water Quality Assessment in the Huangshi Reservoir Basin
A total of 23 representative sampling points was set up in the Huangshi Reservoir area for the assessment of the water quality and hydrobiology (shown in Figure 1), from which two points were monitored in the Bamao River (HS1, HS2), two points were monitored in the Longtan River (HS4, HS5), two points were monitored in the Dongtan River (HS20, HS21), and only one point was monitored in both the Fanjiafang River (HS13) and the Liujiaxi River (HS18). The rest of the 15 points were monitored in the reservoir region. According to the monitored water quality data of the sampling points in the years of 2013–2015 for the surface water environmental quality standard of China (GB3838–2002), the water quality of the Huangshi Reservoir is in accordance with the requirements of drinking water quality. Namely, the water quality of Huangshi Reservoir is classified as degree II and III (shown in Table 2). However, the main water quality indexes, including the chemical oxygen demand (COD), the ammonia nitrogen (NH3-N), the total nitrogen (TN), and the total phosphorus (TP), exceed the environmental quality standards (shown in Table 3 and Table 4), with the Longtan River exceeding the standards most compared to with the other four tributaries.
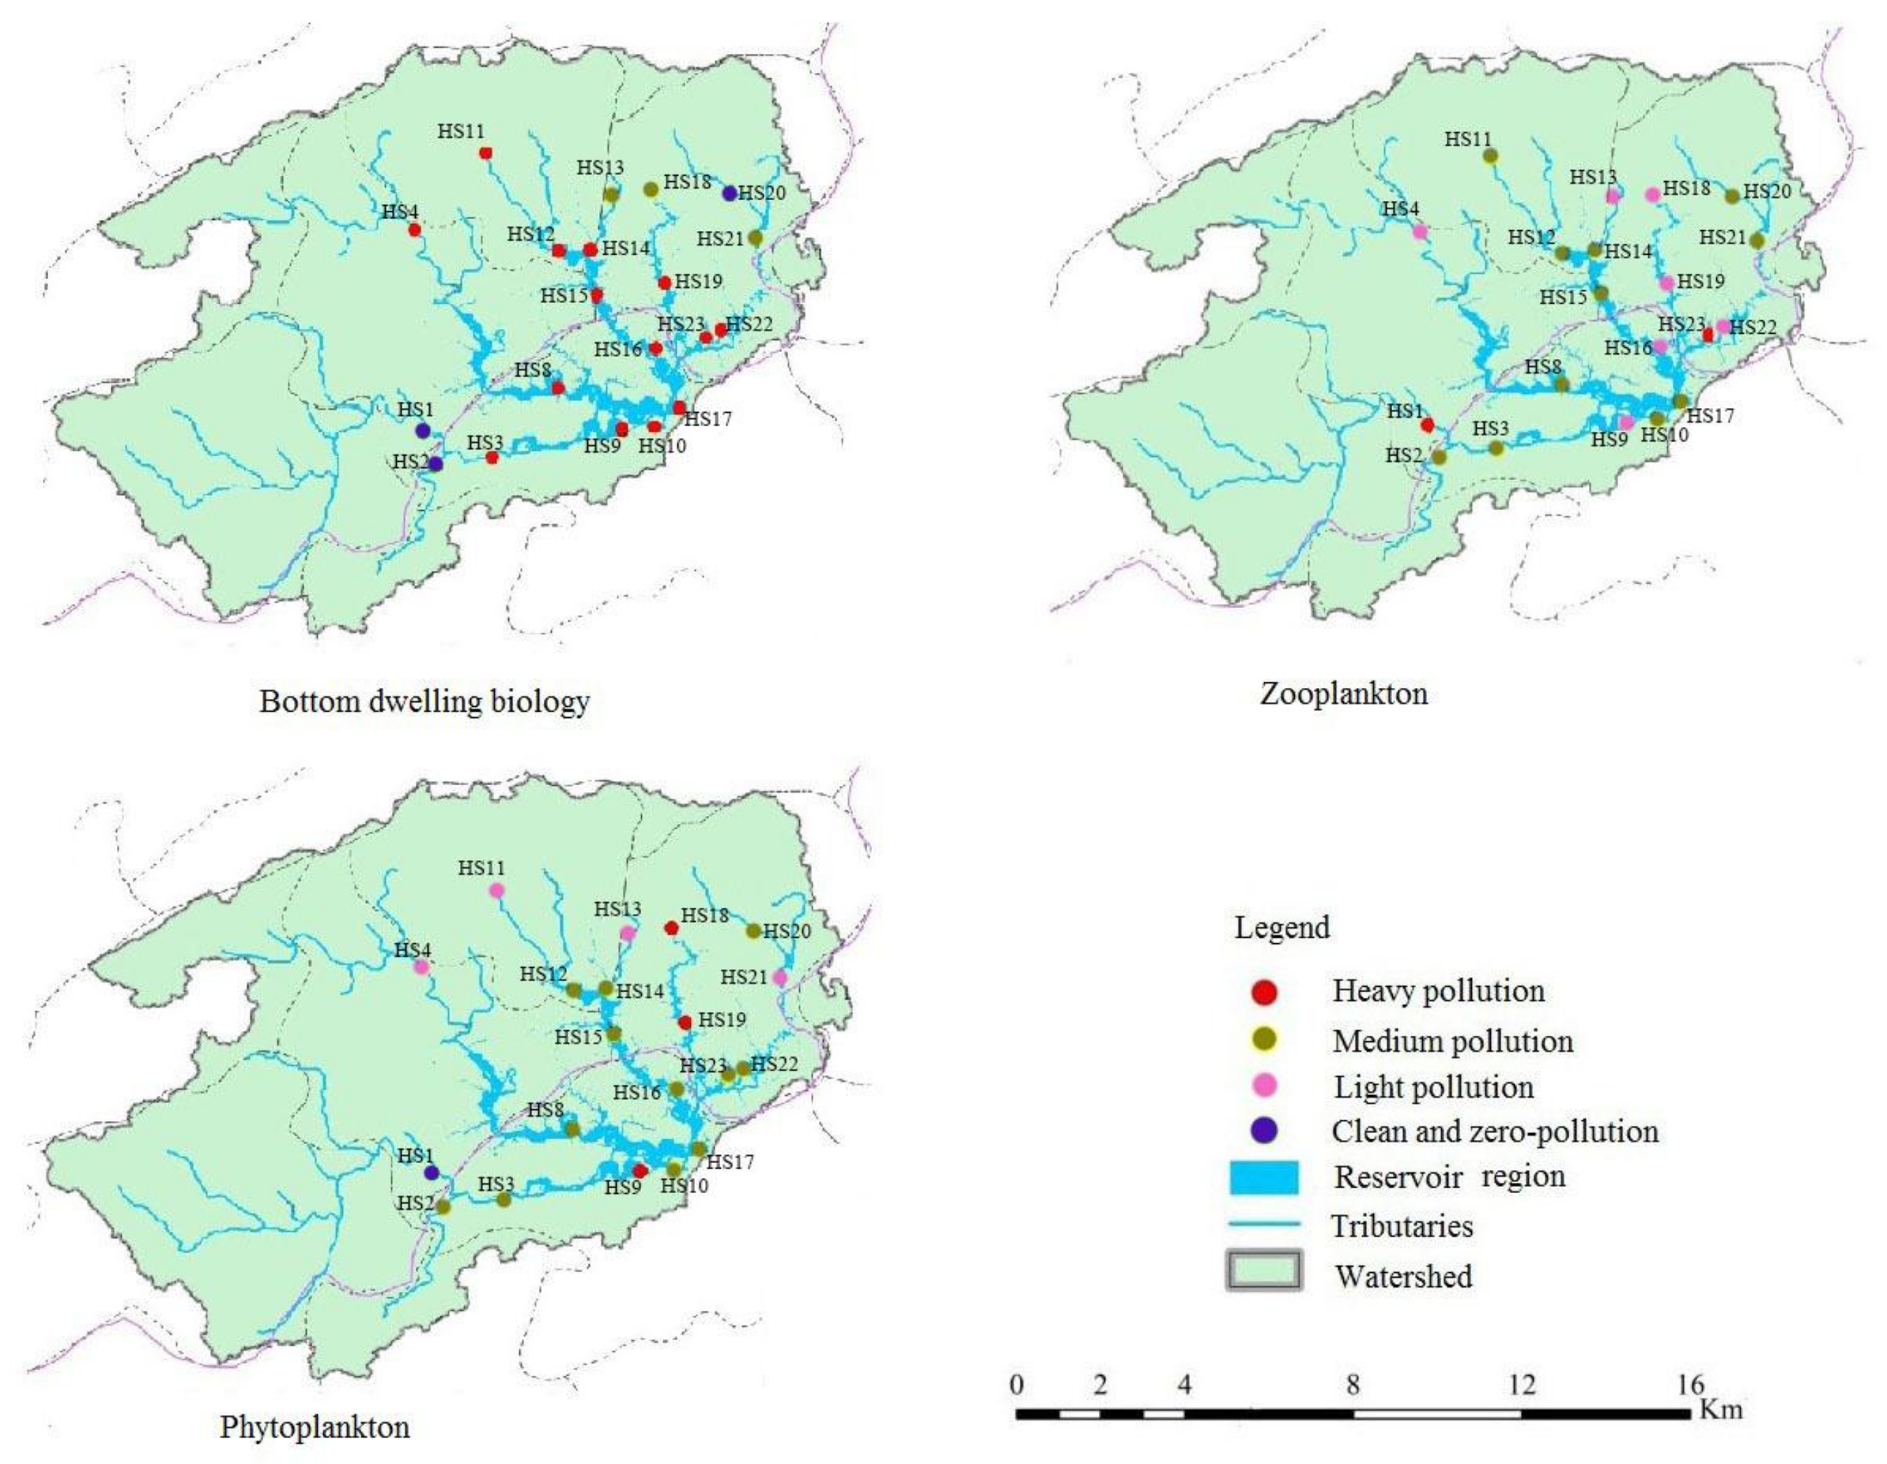
The monitored data of the sampling points set up in the Huangshi Reservoir (Figure 1), the water quality based on the assessment of the hydrobiology with the species, and the quantity measures are shown in Figure 2.
The tributaries were seriously affected by agricultural non-point source (NPS) pollution and living pollution, while the water quality in the vicinity of the reservoir was worse. The water quality of the reservoir is increasingly worsening, with the levels of nitrogen and phosphorus nutrient salts exceeding the standard.
3. Methods
3.1. Water Environmental Capacity of the River-Reservoir Combination System
For fulfilling the purpose of water pollutant control in a drinking water reservoir with multiple tributaries, the paper selected 2014 as the status quo year, and 2020 and 2025 as the forecast years.
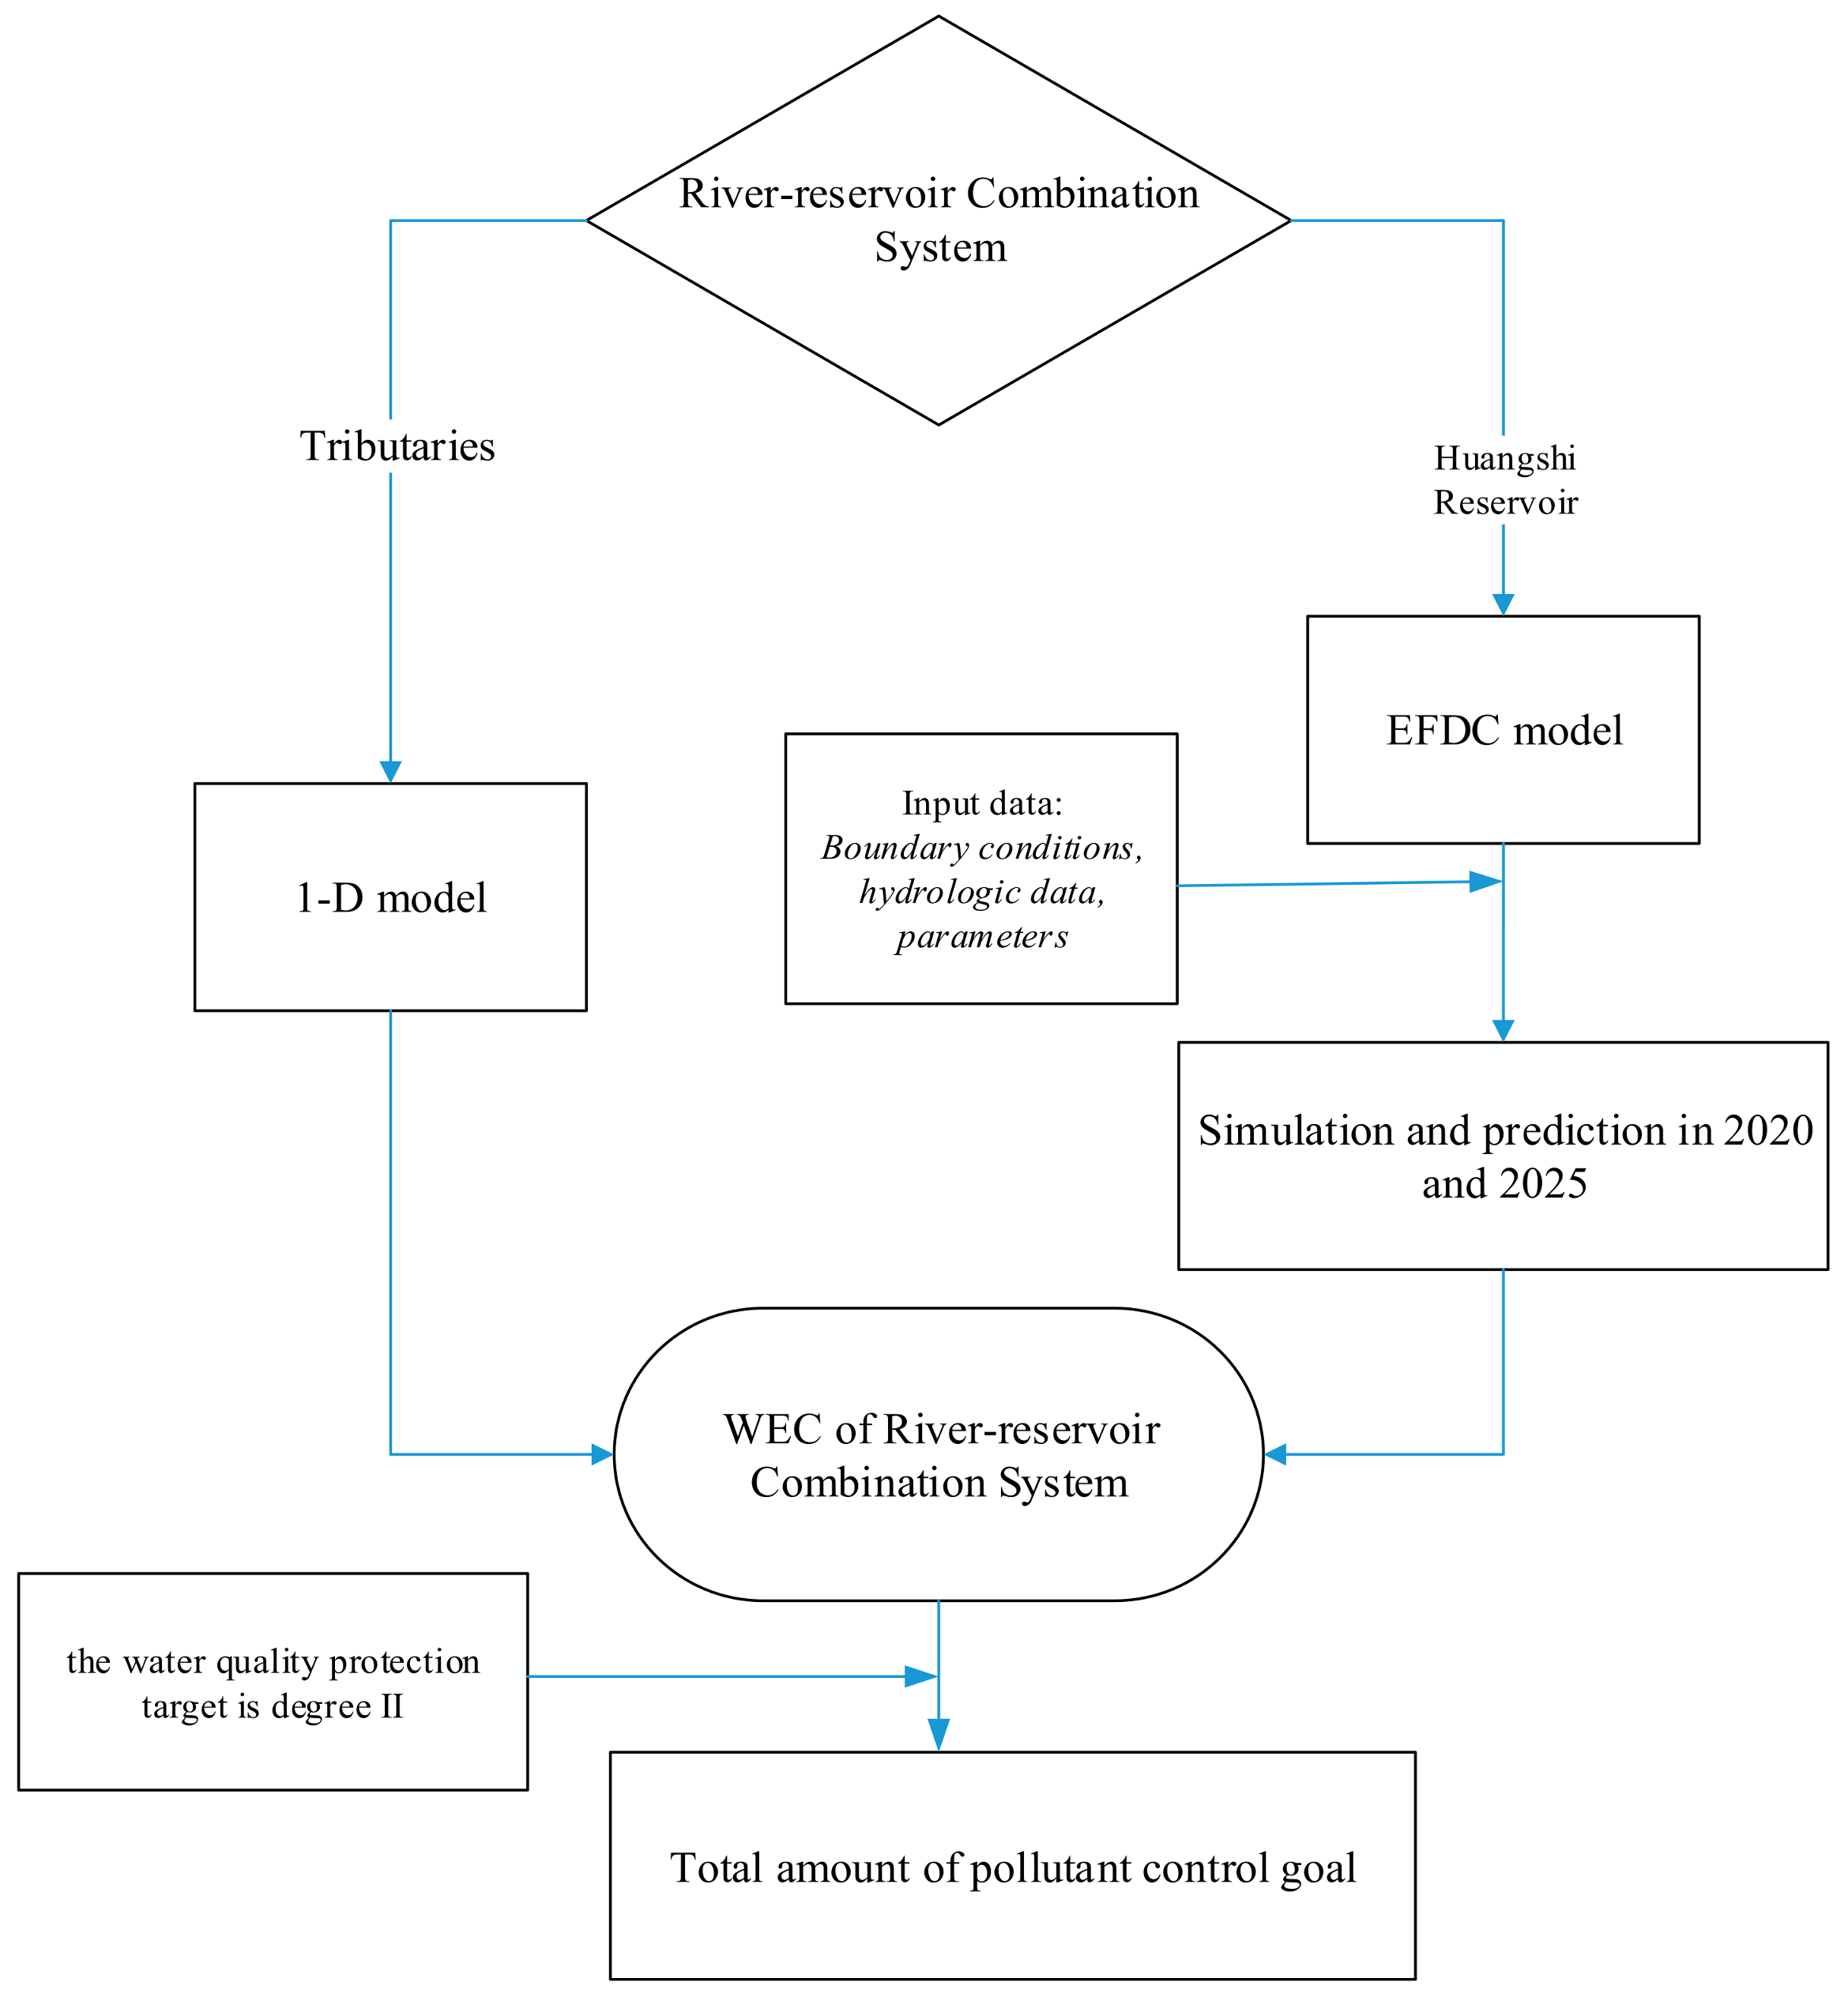
In order to simulate the WEC and control the amount of pollution of the Huangshi Reservoir with multiple tributaries in 2020 and 2025, we developed an integrated method to evaluate the WEC of the river–reservoir combination system, which consisted of the coupling of the 1-D model and the EFDC model. The technical route is as follows (Figure 3).
3.2. Water Environmental Capacity Model of the Tributaries
The equation for calculating the WEC was derived based on a 1-D convection-diffusion equation, with the adopted model expressed as follows [5]:
where is the water environmental capacity per unit time (t); is the pollutant concentration of the tail section in mg/L; is the pollutant concentration of the initial section in mg/L; is the pollutant degradation coefficient in 1/s; and is the length of the reach. A plurality of sewage outlets in the reach can be generalized as a centralized outfall and the outfall was located at the middle point of the reach. Therefore, it is equivalent to a concentrated point source, of which the self-purification length is half the length of the river reach. This means that the self-purification length is L/2 when the length of the river reach is . In addition, is the average flow velocity under the design flow in m/s; and is the design flow.
In this paper, the climatic characteristics have been considered [36] and the degradation coefficients of COD, NH3-N, TN, and TP are 0.5, 0.25, 0.03, and 0.011/day, respectively.
3.3. Water Environmental Capacity Model of the Huangshi Reservoir
In this study, the EFDC model developed by Hamrick [37] was applied to the Huangshi Reservoir. This model is an integrated modeling system that has been successfully applied to many surface water systems, including rivers, estuaries, lakes, and coastal bays [12,38,39,40]. The EFDC model includes four major sub-models: (1) a hydrodynamic model; (2) a sediment transport model; (3) a toxic model; and (4) a water quality model. This simulation is mainly based on the EFDC hydrodynamic, convective diffusion, and first-order degradation modules of the water quality model.
The water quality module not only considers the wind direction, wind speed, and evaporation effect on the flow field and the pollutant transport but also the influence of the distribution characteristics of different types of aquatic plants and waves on the bottom stress. Its numerical simulation can estimate C, N, P, and other forms of nutrients, as well as a variety of algae. It is a strong model of water quality and movement and can accurately reflect the level of pollution in water.
In the water quality module, the governing mass-balance equation for each water quality state variable and the temperature of the water was expressed as follows [41]:
where is the concentration of a water quality state variable or is the temperature of the water; , and are the velocity components in the x, y, and z directions, respectively; , and are the turbulent diffusion coefficients in the , , and directions, respectively; and is the internal and external sources and sinks per unit volume.
By combining the water quality simulation results simulated by the EFDC model with the environmental target of the Huangshi Reservoir, an inverse method was selected to calculate the WEC, which is able to deduce the concentration of pollutants corresponding to water quality targets.
3.3.1. Hydrological Parameters
The protection of the water quality of the Huangshi Reservoir is strict. The lowest water monthly average flow rate and the lowest water level condition in 2013 and 2014 were chosen to calculate the environmental capacity of the reservoir.
3.3.2. Boundary Conditions
Flow boundary conditions: There are six boundary conditions in the simulated water area, which are formed by the inflow of the five rivers using the flow boundary, and the dam using the water surface elevation.
Meteorological boundary conditions: The data were obtained from the Meteorological Data Sharing Service Network of China, including rainfall, evaporation, solar radiation, cloud coverage, atmospheric pressure, air temperature, air humidity, wind speed, wind direction, and so on.
Water quality boundary conditions: The concentrations of COD, NH3-N, TN, and TP in the five main input rivers were used.
3.3.3. Parameters of Model
Due to the lack of longtime serial hydrological data and water quality monitoring data of inflows and outflows of the Huangshi Reservoir, the parameters of the hydrodynamic model of the Huangshi Reservoir referenced some classical cases of the hydrodynamic model in South China. The degradation coefficients of COD, NH3-N, TN, and TP of the Huangshi Reservoir referenced the research report of comprehensive improvement of the water environment and ecological protection plan in the Shanxi Reservoir area. The degradation coefficients of COD, NH3-N, TN, and TP are 0.03 /day, 0.03/day, 0.03/day, and 0.01/day, respectively. The parameters of the water quality model are shown in Table 5.
3.3.4. Model Verification
In this study, four main water quality variables were simulated, namely COD, NH3-N, TN, and TP. The observed data from 2013 to 2014 were used for the verification of the water quality model.
The error statistics of the model verification are listed in Table 6. It is clear that the simulated values agree well with the measured values, which demonstrates that the established water quality model is able to simulate the process of water quality in the Huangshi Reservoir.
4. Results
4.1. Water Quality Simulation and Prediction
The Huangshi Reservoir is the backup source of drinking water for Changde City. There are no industrial districts in the area and water quality is affected mainly by agriculture NPS pollutants, domestic sewage, and aquaculture pollutants.
Based on the pollutant loads discharged into the river in the status quo year of 2014 (shown in Table 7), the increase of the population and the development of urbanization, and the scale of eco-agriculture and the increase of aquaculture, the pollutant loads in the tributaries of the Huangshi Reservoir in 2020 and 2025 have been estimated according to the Report of Huangshi Reservoir protection planning from the Chinese Academy of Environmental Sciences (shown in Table 8). The values have also been converted into concentrations of pollutants in the tributaries of the Huangshi Reservoir, which is shown in Table 9.
The hydraulic conditions adopted the average level of the status year and have no prediction for the future hydraulic conditions, that is, the hydraulic conditions almost stay constant in the model. The annual average wind speed used in Huangshi Reservoir was 2 m/s, the dominant wind direction was northeast, and the annual average evaporation was 1160 mm. The hydrological calculation of WEC was based on the driest monthly flow in 2013 and 2014. The pollutant loads estimated in 2020 and 2025 are allocated on a monthly basis.
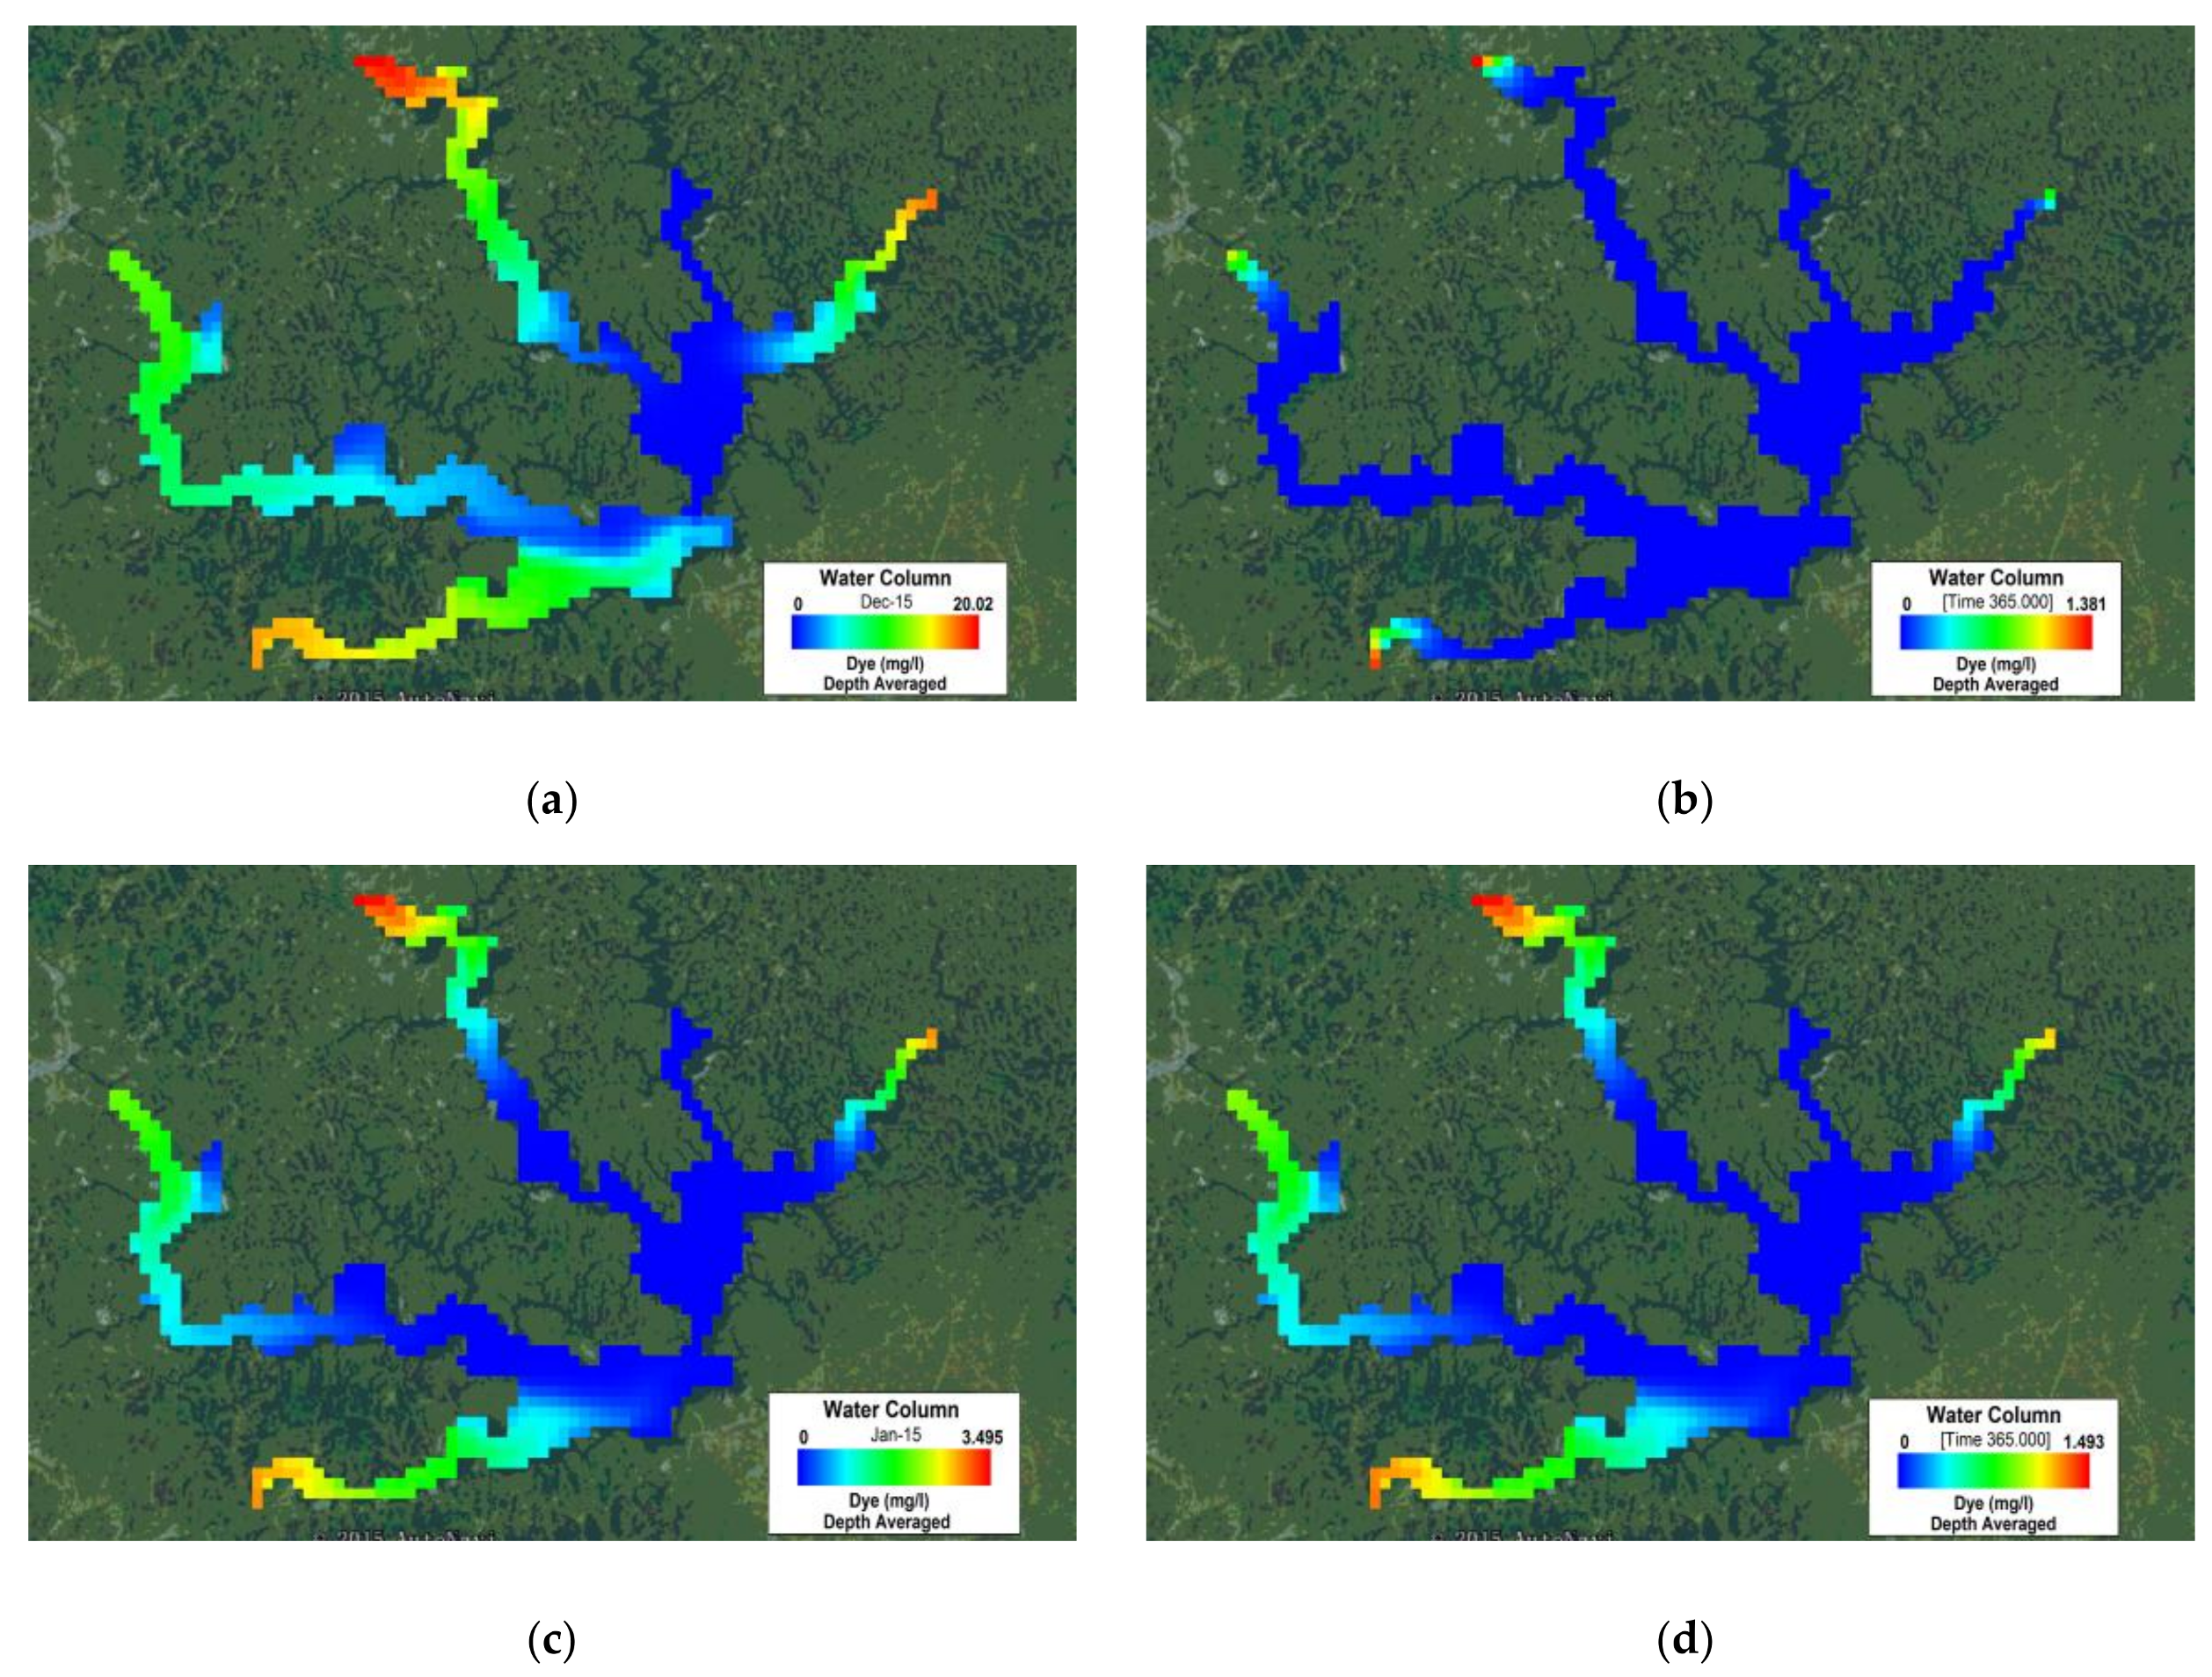
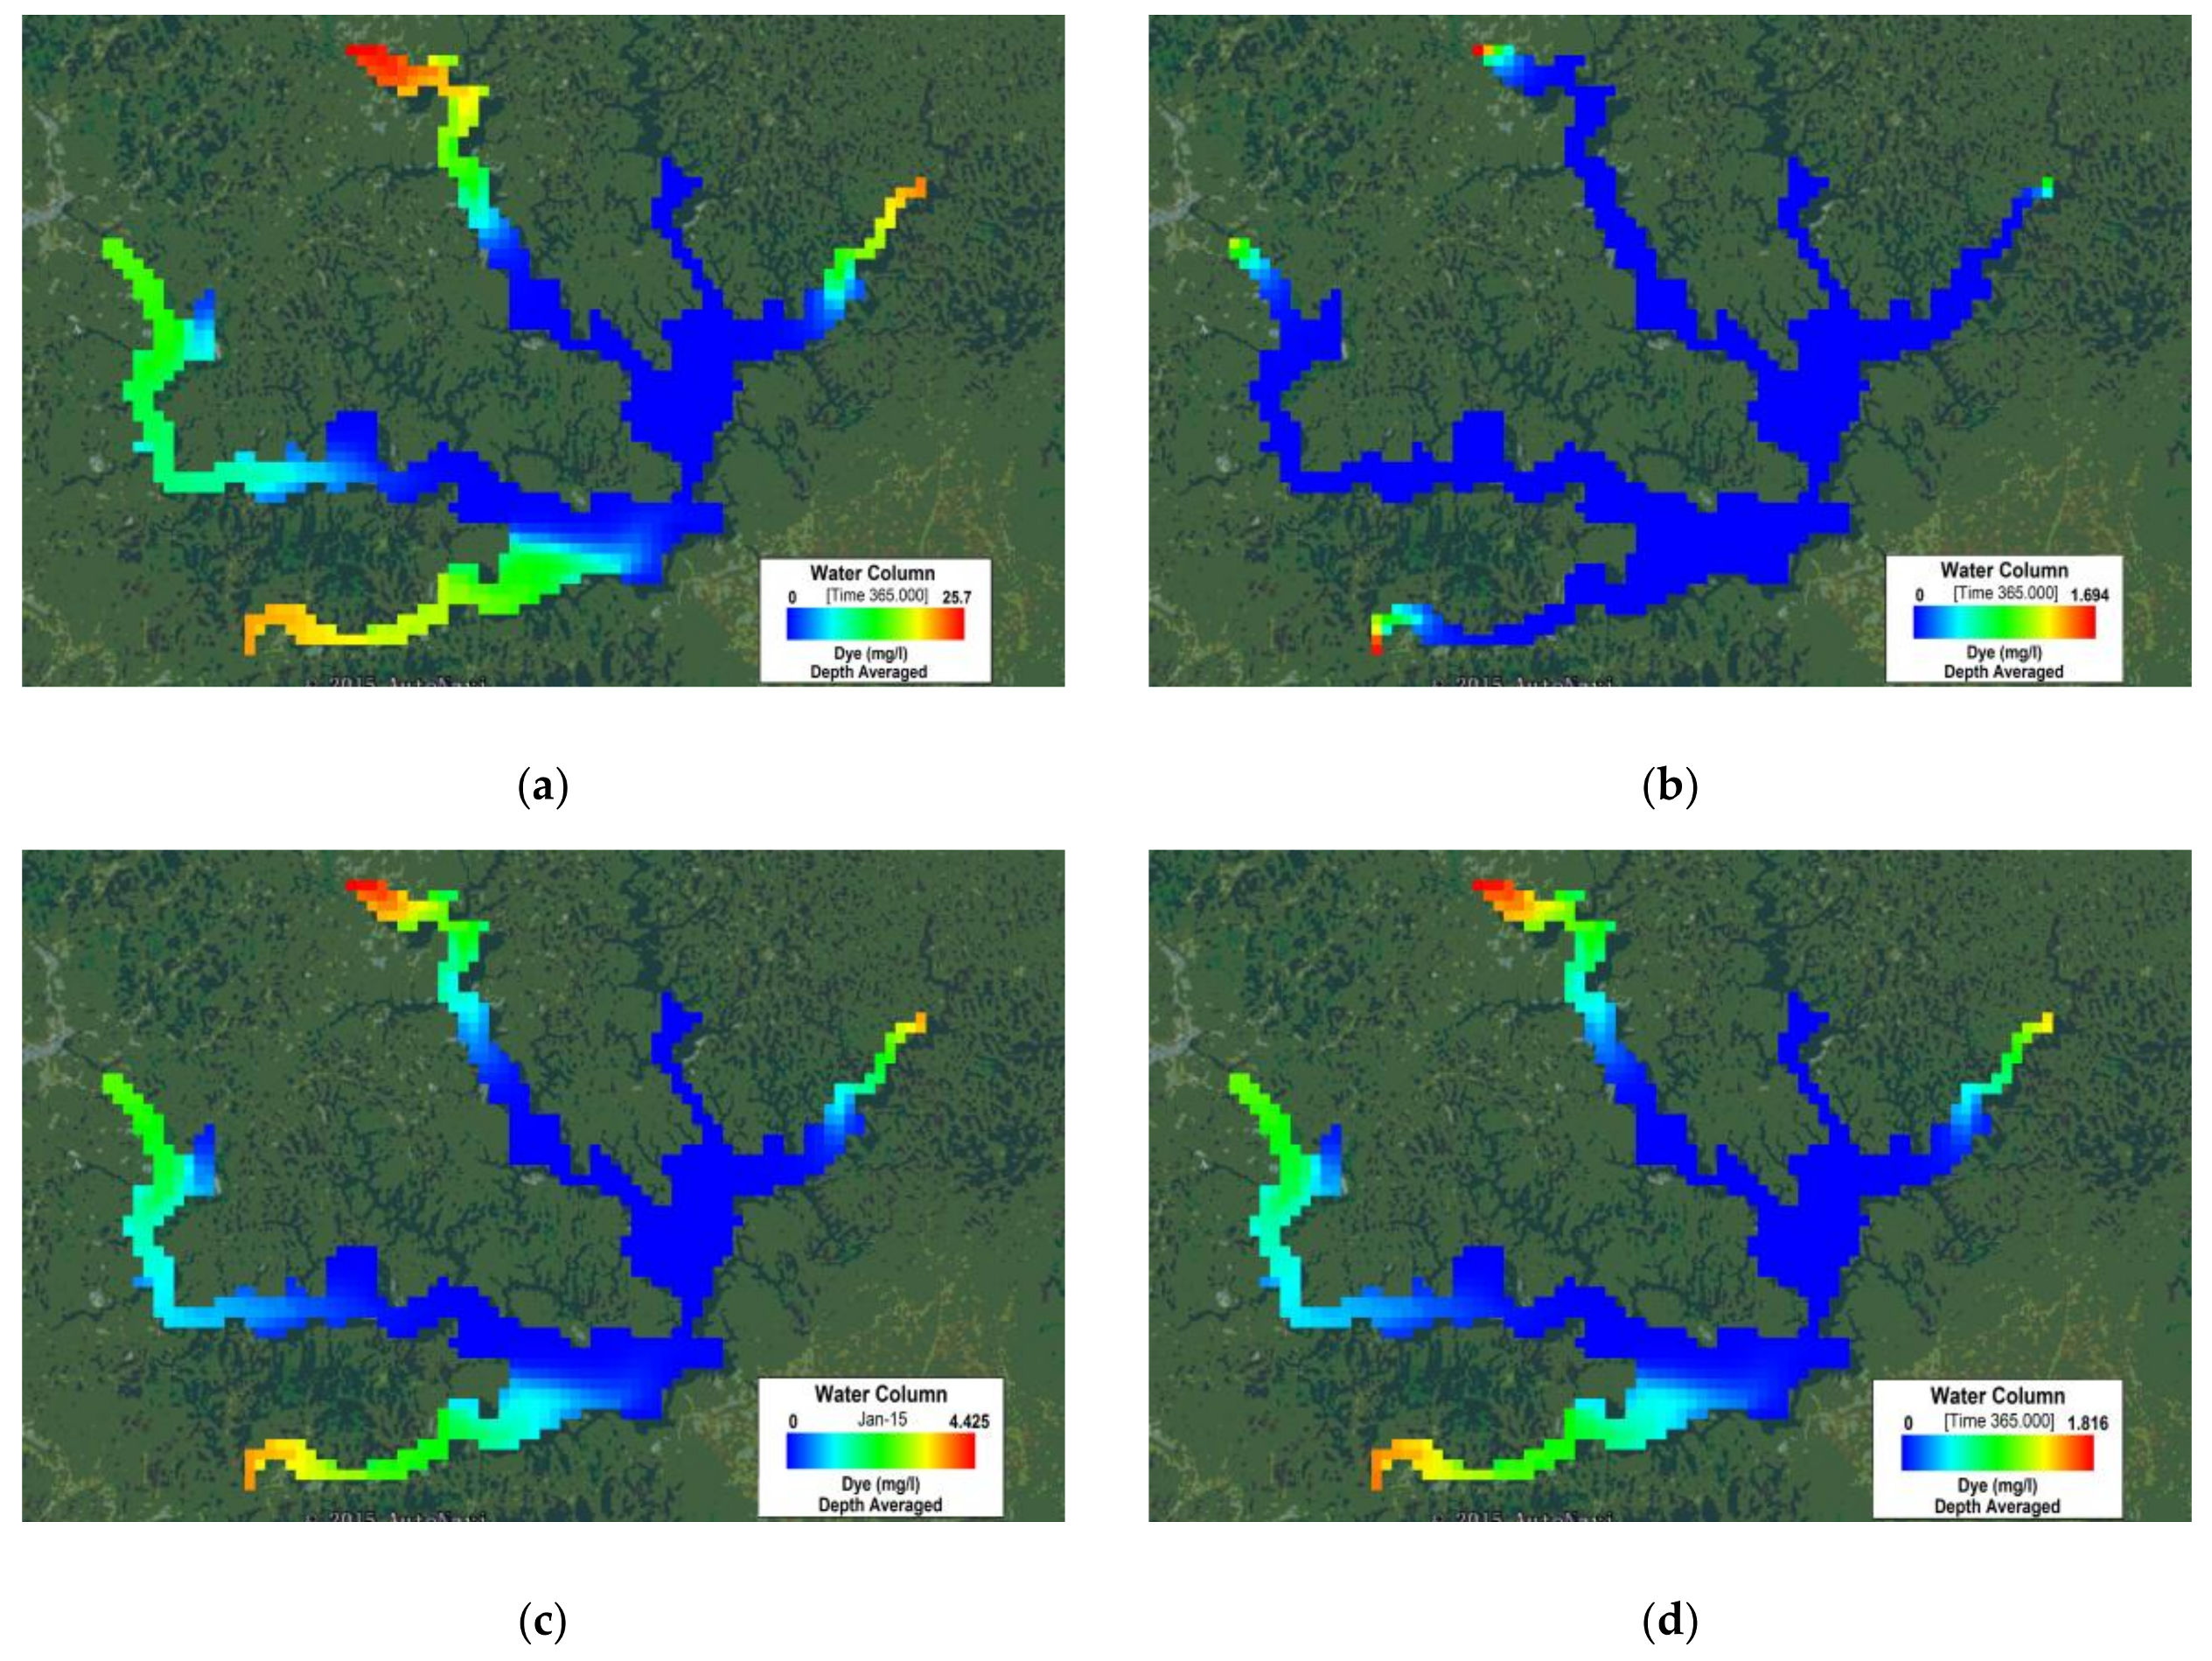
The water quality of the Huangshi Reservoir without reduction measures simulated the predicted values of the inflow for COD, NH3-N, TN, and TP in 2020 and 2025. The results are displayed in Figure 4 and Figure 5, which respectively show the following:
(a) In 2020, the affected areas are the incoming parts of the tributaries, based on the concentration distribution of COD and NH3-N. The main reservoir area is less affected. TN has a bigger area of the effect. In addition, the influence of TP from the tributaries on the water quality of the reservoir is confined to the inner part of the tributaries in the reservoir.
(b) In 2025, the influences of the tributaries on the water quality of the reservoir are confined to the inner parts of the tributaries in the reservoir, but they have bigger areas of effect on the concentrations of COD, NH3-N, TN, and TP compared to those in 2020.
4.2. Water Environmental Capacity of the River–Reservoir Combination System
As the Huangshi Reservoir is a water source protection zone, the water quality protection target is degree II. Assuming that the water quality degree of the initial section is degree I when the water quality degree of the reservoir control point is degree II, the results of the WEC for the tributaries of each section are shown in Table 10.
The highest WEC values of the COD, NH3-N, TN, and TP were in the Bamao River, while the lowest WEC values of the COD, NH3-N, TN, and TP were in the Dongtan River. The total WEC of the tributaries included a COD of 421.97 tons; an NH3-N of 40.99 tons; a TN of 35.94 tons; and a TP of 9.54 tons. Thus, it is obvious that the WEC of the Huangshi Reservoir region mainly accounts for more than 93% of the total capacity.
4.3. Total Amount of Pollutant Control Goal Based on the Water Environmental Capacity
Based on the pollutant loads discharged into the river in 2014, the utilized peculiarities of the reservoir and tributaries, as well as the water environmental capabilities, were estimated and shown in Table 11.
The utilization rates of COD, NH3-N, TN, and TP in most tributaries were over 100%. The highest utilization rate of COD and TP occurred in the Fanjiafang River, exceeding 100% by 2 times and 1.98 times, respectively. The highest utilization rate of NH3-N and TN occurred in the Dongtan River, exceeding 100% by 2.77 times and 4.18 times, respectively.
The utilization rates of COD and NH3-N in the reservoir region were 13% and 65%, respectively, while there was still a certain WEC. However, the maximum utilization rate of TN and TP exceeded 100% by 1.34 times and 1.2 times, respectively. These were mainly caused by the fish cage culture and the internal release of pollutants. Furthermore, this rate had a significant relationship with the high degree of eutrophication in the reservoir region.
According to the pollutant inflows into the reservoir and the WEC results, the pollutant control target can be determined based on the WEC. The water pollutant reductions of the Huangshi Reservoir region as well as the Bamao River, Longtan River, Fanjiafang River, and Dongtan River—which are the 4 major tributaries into the reservoir—have been determined for 2020 and 2025 (Table 12 and Table 13).
The pollutants in the tributaries of the Huangshi Reservoir will need a large number of cuts both in 2020 and 2025, with respect to the degree II national surface water quality standards. The largest COD reduction will occur in the Fanjiafang River, with approximately 61.3% and 71.9% of the inflow needing to be cut to meet the water quality objectives, respectively. Tributaries will need a total reduction of 173.8 to 401.8 tons per year, with the residual WEC for COD being approximately 4560.5 tons per year in the reservoir region.
The largest NH3-N reduction will occur in the Dongtan River and the Fanjiafang River in 2020 and 2025. More than 69.2% of the pollutant inflow will need to be cut to meet the water quality objectives in 2020, which corresponds to an increase of 7.1% in 2025. Tributaries will need a total reduction of 29.14 and 52.2 tons per year, respectively, with the residual WEC for NH3-N needing to be approximately 4560.5 and 2.79 tons per year in the reservoir region, respectively.
The largest TN reduction will occur in the Dongtan River in 2020 as well as in the Dongtan River and the Fanjiafang River in 2025. More than 80.1% and 74.59% of the inflow will need to be cut to meet the water quality objectives, respectively. The TN of the entire basin will need to be cut by 44.02% and 58.9%, respectively, which corresponds to an increase of 14.88% in 2025.
The largest TP reduction will occur in the Dongtan River and the Fanjiafang River in 2020 and 2025. More than 64.4% of the inflow will need to be cut to meet the water quality objectives, which corresponds to an increase of 10.19% in 2025. The inflow into the reservoir will be significantly larger than the WEC of the reservoir. The TP of the reservoir area will need to be reduced by 37.9% and 53.73%, respectively, with the entire basin needing to be cut by 39.6% and 55.37%, respectively.
Water pollution control is still an arduous task in all four tributaries and the reservoir region. The pollutants significantly exceed the state standards for drinking water sources in China, especially in the reservoir region, which will induce or aggravate the risk of water eutrophication.
5. Conclusions
This study constructed an integrated method to simulate the WEC of the Huangshi river–reservoir combination system, which coupled a 1-D convection-dispersion model with the EFDC model. It was further applied to study the quantity control of pollution of the input rivers based on the results of the WEC calculation and the degree II national surface water quality standards.
The highest WEC is in the Bamao River, while the lowest WEC is in the Dongtan River. Summarizing the WEC of the tributaries, the COD is 421.97 tons, NH3-N is 40.99 tons, TN is 35.94 tons, and TP is 9.54 tons.
The utilization rates of COD, NH3-N, TN, and TP in most of the tributaries are over 100%. The utilization rates of COD and NH3-N in the reservoir region are 13% and 65%, respectively, and there is still a certain WEC. However, the loads of TN and TP exceed the maximum utilization rates by 1.34 times and 1.2 times, respectively. This is mainly caused by the fish cage culture and the internal release of pollutants. Furthermore, this has a significant relationship with the high degree of eutrophication in the reservoir region.
The pollutants in the tributaries of the Huangshi Reservoir will need a large number of inflow cuts to meet the water quality objectives in 2020 and 2025. The pollutants significantly exceed the state standard, especially in the reservoir region. Therefore, the reduction and control of pollutants are the main objectives.
To exploit the WEC completely, rationally, and continuously, a balance point needs to be found between environmental concerns and the social and economic development. As the study area is the backup source of drinking water for Changde City, the calculation of WEC can enable decision makers to determine load reductions and allocations. Various measures of controlling the total amount of pollutants can be applied to realize the improvement of the water quality. This perspective can be referred as a beneficial supplement for a single study of rivers or lake.
Additionally, in calculating WEC, the uncertainty analysis should be taken into consideration. In a practical river–-reservoir combination system there are many uncertainties in terms of variable information while calculating WEC. More variable information will result in a more flexible WEC.
Acknowledgments
This research was supported by the National Water Pollution Control and Treatment Science and Technology Major Project (2017ZX07301-001), National Key Research and Development Program (2017YFC0404505). We would like to extend special thanks to the editor and the anonymous reviewers for their valuable comments in greatly improving the quality of this paper.
Author Contributions
F.Z. conceived and designed the experiments; C.L. performed the experiments; L.C. and F.Z. analyzed the data; L.C. and Y.Z. contributed reagents/materials/analysis tools; F.Z. wrote the paper.
Conflicts of Interest
The authors declare no conflict of interest.
References
- Liu, W.; Chen, W.; Hsu, M.H. Using a three-dimensional particle tracking model to estimate the residence time and age of water in a tidal estuary. Comput. Geosci. 2011, 37, 1148–1161. [Google Scholar] [CrossRef]
- Su, Q.; Qin, H.; Fu, G. Environmental and ecological impacts of water supplement schemes in a heavily polluted estuary. Sci. Total Environ. 2014, 472, 704–711. [Google Scholar] [CrossRef] [PubMed]
- Shen, Y.; Wang, J.; Zheng, B.; Zhen, H.; Feng, Y.; Wang, Z.; Yang, X. Modeling study of residence time and water age in Dahuofang Reservoir in China. Sci. China Phys. Mech. Astron. 2011, 54, 127–142. [Google Scholar] [CrossRef]
- Zhang, Y. The Development of Basic Concept of Water Environmental Capacity. Res. Environ. Sci. 1992, 5, 59–61. (In Chinese) [Google Scholar]
- Yang, Z.; Cheng, C.; Tan, X.; Cheng, R.; Zhong, M.A. Analysis of water environmental capacity of Guanting Reservoir and its upstream basin. J. Arid N.A. Res. Environ. 2015, 29, 164–166. (In Chinese) [Google Scholar]
- Gao, G.Q. Water environmental carrying capacity calculation and protection measures on Hefang Reservoir. Appl. Mech. Mater. 2011, 1446, 2537–2540. [Google Scholar] [CrossRef]
- Han, L.X.; Yan, F.F.; Peng, H.; Gao, J.J.; Pan, M.M. Methods for calculation of water environment capacity of small and medium river channels. Adv. Mater. Res. 2013, 2115, 2745–2750. [Google Scholar] [CrossRef]
- Gang, Z.; Kun, L.; Guo, F.U.; Guang-Jun, M. Calculation method of river water environmental capacity. J. Hydraul. Eng. ACSE 2014, 45, 227–234. [Google Scholar]
- Li, Y.; Zhao, L.; Li, Y. Index system of water environment capacity promotion in Jilin province in China through ways of structure, engineering and supervision. Adv. Mater. Res. 2015, 3848, 1155–1159. [Google Scholar] [CrossRef]
- Yang, J.F.; Lei, K.; Khu, S.; Meng, W.; Qiao, F. Assessment of water environmental carrying capacity for sustainable development using a coupled system dynamics approach applied to the Tieling of the Liao River Basin, China. Environ. Earth Sci. 2015, 73, 5173–5183. [Google Scholar] [CrossRef]
- Li, K.; Zhang, L.; Li, Y.; Zhang, L.J.; Wang, X.L. A three-dimensional water quality model to evaluate the environmental capacity of nitrogen and phosphorus in Jiaozhou Bay, China. Mar. Pollut. Bull. 2015, 91, 306–316. [Google Scholar] [CrossRef] [PubMed]
- Tao, Y.; Chen, Y.X.; Zhao, X.L.; Yang, L.B.; Lei, K.; Zhou, G. Analysis of seasonality difference on water environmental capacity of Ashi River based on EFDC. Environ. Eng. 2017, 35, 66–68. (In Chinese) [Google Scholar]
- Zhou, X.Y.; Lei, K.; Meng, W.; Khu, S.; Zhao, J.; Wang, M.N.; Yang, J.F. Space–time approach to water environment carrying capacity calculation. J. Clean. Prod. 2017, 149, 302–312. [Google Scholar] [CrossRef]
- Zhang, X.; Han, L.X. A water environmental capacity calculation method of the shallow lake based on water quality response coefficient. Sichuan Environ. 2017, 36, 47–49. (In Chinese) [Google Scholar]
- Wu, J.F.; Gao, Y.; Xie, F.; Chen, L.N. Research on water environment capacity by two-dimensional hydrodynamic and quality model. Environ. Sci. Manag. 2017, 42, 53–55. (In Chinese) [Google Scholar]
- Gu, J.; Li, Z.Y.; Mao, X.D.; Hu, C.F.; Kuang, C.P.; Zhang, W.L. Study of cod environmental capacity in coastal waters of Beidaihe in summer. Mar. Environ. Sci. 2017, 36, 683–685. (In Chinese) [Google Scholar]
- Wu, H.; Yang, X. Calculation of water environmental capacity based on control unit of Shuangtaizi River. Environ. Sci. Manag. 2017, 42, 61–63. (In Chinese) [Google Scholar]
- Chinh, L.V.; Hiramatsu, K.; Harada, M.; Lan, T.T. Estimation of water environment capacity in the cau river basin, vietnam using the streeter-phelps model. J.- Fac. Agric. Kyushu Univ. 2017, 62, 163–169. [Google Scholar]
- Huang, S.L.; Zhang, Y.; Li, Q.; Xu, D.S. Research on water environmental capacity of urban river: A case study of Tuohe River in Suzhou city, northern Anhui province. Adv. Mater. Res. 2012, 1479, 867–870. [Google Scholar] [CrossRef]
- Fan, L.L.; Sha, H.F.; Pang, Y. Water environmental capacity of Lake Taihu. J. Lake Sci. 2012, 24, 693–697. [Google Scholar]
- Xia, Y.; Ma, C.M.; Liu, X.J.; Liu, X.Y.; Deng, Q.L. Comprehensive carrying capacity assessment of water environment in Zhengzhou city. Appl. Mech. Mater. 2013, 2574, 390–395. [Google Scholar] [CrossRef]
- Yan, B.Y.; Xing, J.S.; Tan, H.R.; Deng, S.P.; Tan, Y.N. Analysis on water environment capacity of the Poyang Lake. Procedia Environ. Sci. 2011, 10, 2754–2759. [Google Scholar]
- Liu, Q.; Jiang, J.; Jing, C.; Qi, J. Spatial and seasonal dynamics of water environmental capacity in mountainous rivers of the Southeastern Coast, China. Int. J. Environ. Res. Public Health 2018, 15, 99. [Google Scholar] [CrossRef] [PubMed]
- Missaghi, S.; Hondzo, M. Evaluation and application of a three-dimensional water quality model in a shallow lake with complex morphometry. Ecol. Model. 2010, 221, 1512–1525. [Google Scholar] [CrossRef]
- Missaghi, S.; Hondzo, M.; Melching, C. Three-dimensional lake water quality modeling: Sensitivity and uncertainty analyses. J. Environ. Qual. 2013, 42, 1684–1698. [Google Scholar] [CrossRef] [PubMed]
- Missaghi, S. Three Dimensional Water Quality Modeling in a Shallow Lake with Complex Morphometry; Implications for Cool Water Fish Habitat under Changing Climate. Ph.D. Thesis, University of Minnesota, Minneapolis, MN, USA, July 2014. [Google Scholar]
- Heung, W.; Hu, B.Q. Application of interval clustering approach to water quality evaluation. J. Hydrol. 2013, 491, 1–12. [Google Scholar]
- Heung, W.; Hu, B.Q. Application of improved extension evaluation method to water quality evaluation. J. Hydrol. 2014, 509, 539–548. [Google Scholar]
- Peche, R.; Esther, R.E. Development of environmental quality indexes based on fuzzy logic. A case study. Ecol. Indic. 2012, 23, 555–565. [Google Scholar] [CrossRef]
- Ju, H.C.; Yoo, S.H. Using the fuzzy set theory to developing an environmental impact assessment index for a thermal power plant. Qual. Quant. 2014, 48, 673–680. [Google Scholar] [CrossRef]
- Chen, Q.W.; Wu, W.Q.; Blanckaert, K.; Ma, J.F.; Huang, G.X. Optimization of water quality monitoring network in a large river by combining measurements, a numerical model and matter-element analyses. J. Environ. Manag. 2012, 110, 116–124. [Google Scholar] [CrossRef] [PubMed]
- Jordan, T.E.; Weller, D.E.; Correll, D.L. Sources of nutrient inputs to the Patuxent River estuary. Estuaries 2003, 26, 226–243. [Google Scholar] [CrossRef]
- Shen, J.; Haas, L. Calculating age and residence time in the tidal York River using three-dimensional model experiments. Estuarine Coast. Shelf Sci. 2004, 61, 449–461. [Google Scholar] [CrossRef]
- Li, Y.; Acharya, K.; Yu, Z. Modeling impacts of Yangtze River water transfer on water ages in Lake Taihu, China. Ecol. Eng. 2011, 37, 325–334. [Google Scholar] [CrossRef]
- Ministry of Environmental Protection of the people’s Republic of China. The surface water environmental quality standard of China. GB3838-2002.
- Chen, L.B.; Yang, Z.F.; Liu, H.F. Numerical simulations of spread characteristics of toxic cyanide in the Danjiangkou Reservoir in China under the effects of dam cooperation. Math. Probl. Eng. 2014, 2014. [Google Scholar] [CrossRef]
- Hzamrick, H.M. A Three-Dimensional Environmental Fluid Dynamics Computer Code: Theoretical and Computational Aspects; The College of William and Mary, Virginia Institute of Marine Science: Williamsburg, VA, USA, 1992. [Google Scholar]
- Caliskan, A.; Elci, S. Effects of selective withdrawal on hydrodynamics of a stratified reservoir. Water Resour. Manag. 2009, 23, 1257–1273. [Google Scholar] [CrossRef]
- Wang, C.; Shen, C.; Wang, P.F.; Qian, J.; Hou, J.; Liu, J.J. Modeling of sediment and heavy metal transport in Taihu Lake, China. J. Hydrodyn. Ser. B 2013, 25, 379–387. [Google Scholar] [CrossRef]
- Zhang, C.X.; You, X.Y.; Zhao, S.M. Application of the EFDC model to waterfront planning: A case study in the Tianjin Harbor Economic Zone, China. Eng. Appl. Comp. Fluid Mech. 2014, 8, 1–13. [Google Scholar] [CrossRef]
- Park, K.; Kuo, A.Y. A Three-Dimensional Hydrodynamic Eutrophication Model: Description of Water Quality and Sediment Process Sub-Models; The College of William and Mary, Virginia Institute of Marine Science: Williamsburg, VA, USA, 1995. [Google Scholar]
Figure 1.
The location of the Huangshi Reservoir and the sample points of water quality.

Figure 2.
The assessment results of water quality.

Figure 3.
The technical route.

Figure 4.
The simulated concentration distribution of COD, NH3-N, TN, and TP in the Huangshi Reservoir in 2020. ((a) COD, (b) NH3-N, (c) TN and (d) TP).
Figure 4.
The simulated concentration distribution of COD, NH3-N, TN, and TP in the Huangshi Reservoir in 2020. ((a) COD, (b) NH3-N, (c) TN and (d) TP).

Figure 5.
The simulated concentration distribution of COD, NH3-N, TN, and TP in Huangshi Reservoir in 2025. ((a) COD, (b) NH3-N, (c) TN and (d) TP).
Figure 5.
The simulated concentration distribution of COD, NH3-N, TN, and TP in Huangshi Reservoir in 2025. ((a) COD, (b) NH3-N, (c) TN and (d) TP).


Table 1.
The features of the tributaries.
| Rivers | Control Area (km2) | Length of Reaches (km) | Water Quality Objectives (River Water Quality Standards) * | Flow (m3/s) |
|---|---|---|---|---|
| Bamao River | 102.9 | 10 | II | 1.429 |
| Longtan River | 154.4 | 14.2 | II | 1.2769 |
| Fanjiafang River | 61.2 | 4 | II | 0.6726 |
| Dongtan River | 40.3 | 5.8 | II | 0.4089 |
* Note: for the values of Water quality objectives, see also Table 2.
Table 2.
The surface water environmental quality standard of China [35] (units: mg/L).
Table 2.
The surface water environmental quality standard of China [35] (units: mg/L).
| Indicators | II | III | IV | V |
|---|---|---|---|---|
| COD | 15 | 20 | 30 | 40 |
| NH3-N | 0.5 | 1 | 1.5 | 2 |
| TP | 0.1 (lake and reservoir 0.025) | 0.2 (lake and reservoir 0.05) | 0.3 (lake and reservoir 0.1) | 0.4 (lake and reservoir 0.2) |
| TN | 0.5 | 1 | 1.5 | 2 |
Table 3.
The water quality evaluation result of the Huangshi Reservoir.
| Sections | Standard | Water Quality | Exceed Factors and Multiples * |
|---|---|---|---|
| HS7 | II | III | TN (0.92) |
| HS8 | II | V | TN (3.96) |
| HS9 | II | IV | TN (1.32) |
| HS16 | II | IV | TN (1.18), TP (0.88) |
| HS17 | II | IV | TN (1.70) |
| HS19 | II | IV | TN (0.28), TP (2.36) |
| HS3 | II | V | TN (2.86), TP (0.04) |
| HS6 | II | IV | TN (0.88) |
| HS10 | II | V | TN (2.38) |
| HS12 | II | V | TN (2.06), TP (0.76) |
| HS14 | II | IV | TN (1.54), TP (0.48) |
| HS15 | II | V | TN (1.46), TP (4.68) |
| HS22 | II | IV | TN (1.42), TP (0.92) |
| HS23 | II | IV | TN (1.08), TP (0.08) |
* Note: exceed multiples = (measured value − standard value)/standard value.
Table 4.
The water quality evaluation result of the tributaries.
| Tributaries | Sections | Standard | Water Quality | Exceed Factors and Multiples * |
|---|---|---|---|---|
| Bamao River | HS1 | III | V | TN (0.90) |
| HS2 | IV | TN (0.49) | ||
| Longtan River | HS4 | V | TN (0.90) | |
| HS5 | V | TN (0.88), TP (1.54) | ||
| Fanjiafang River | HS11 | V | TN (0.70) | |
| HS13 | V | TN (0.71), TP (0.60) | ||
| Liujiaxi River | HS18 | V | TN (0.86) | |
| Dongtan River | HS20 | V | TN (0.79) | |
| HS21 | V | TN (0.53) |
* Note: exceed multiples = (measured value − standard value)/standard value.
Table 5.
The parameters of the water quality model.
| Parameters | Roughness | Eddy Viscosity Coefficient | Diffusion Coefficient | COD | NH3-N | TN | TP |
|---|---|---|---|---|---|---|---|
| Coefficient/Degradation coefficient | 0.02 m | 1 m2/s | 0.2 | 0.03/day | 0.03/day | 0.03/day | 0.01/day |
Table 6.
The error statistics of the model verification (units: mg/L).
| Characteristic Values | COD | NH3-N | TN | TP |
|---|---|---|---|---|
| Compare numbers | 12 | 12 | 12 | 12 |
| Average observed | 7.78 | 0.12 | 1.20 | 0.15 |
| Average simulated | 6.92 | 0.10 | 1.15 | 0.10 |
| Average Error | −0.85 | 0.01 | −0.04 | 0.02 |
| Relative Error | 20.29 | 28.10 | 12.99 | 157.42 |
| Absolute Error | 1.68 | 0.02 | 0.14 | 0.03 |
| Root Mean Square Error | 2.18 | 0.03 | 0.18 | 0.03 |
| Relative Root Mean Square Error | 47.28 | 70.38 | 61.56 | 139.98 |
| Nash-Sutcliffe coefficient | −2.05 | −11.89 | −4.05 | −50.35 |
Table 7.
The pollutant quantity inlets into the river in 2014 (units: tons/year).
| Area | COD | NH3-N | TN | TP |
|---|---|---|---|---|
| Inflow | Inflow | Inflow | Inflow | |
| Bamao River | 148.66 | 17.96 | 27.04 | 4.859 |
| Longtan River | 108.67 | 13.87 | 19.65 | 2.678 |
| Fanjiafang River | 116.8 | 14.6 | 21.36 | 3.34 |
| Dongtan River | 89.292 | 12.23 | 16.23 | 1.573 |
| Reservoir region | 197.64 | 97.54 | 179.03 | 44.375 |
| Total amount | 661.062 | 156.2 | 263.31 | 56.825 |
Table 8.
The predicted values of the pollutant loads in the tributaries of the Huangshi Reservoir in 2020 and 2025 (units: tons/year).
Table 8.
The predicted values of the pollutant loads in the tributaries of the Huangshi Reservoir in 2020 and 2025 (units: tons/year).
| Year | Pollutants | Bamao River | Longtan River | Fanjiafang River | Dongtan River |
|---|---|---|---|---|---|
| 2020 | COD | 764.73 | 482.54 | 428.13 | 239.27 |
| NH3-N | 70.56 | 45.65 | 39.14 | 22.43 | |
| TN | 136.2 | 86.16 | 75.46 | 41.72 | |
| TP | 59.98 | 38.576 | 32.24 | 16.446 | |
| 2025 | COD | 981.21 | 604.68 | 549.45 | 298.1 |
| NH3-N | 86.48 | 54.60 | 48.21 | 27.08 | |
| TN | 172.16 | 106.32 | 95.67 | 51.42 | |
| TP | 72.42 | 44.424 | 39.21 | 19.544 |
Table 9.
The predicted values of the pollutant concentrations in the tributaries of the Huangshi Reservoir in 2020 and 2025 (units: tons/years).
Table 9.
The predicted values of the pollutant concentrations in the tributaries of the Huangshi Reservoir in 2020 and 2025 (units: tons/years).
| Year | Pollutants | Bamao River | Longtan River | Fanjiafang River | Dongtan River |
|---|---|---|---|---|---|
| 2020 | COD | 16.97 | 11.98 | 20.18 | 18.55 |
| NH3-N | 1.57 | 1.13 | 1.85 | 1.74 | |
| TN | 3.02 | 2.14 | 3.56 | 3.24 | |
| TP | 1.33 | 0.96 | 1.52 | 1.28 | |
| 2025 | COD | 21.77 | 15.02 | 25.90 | 23.12 |
| NH3-N | 1.92 | 1.36 | 2.27 | 2.10 | |
| TN | 3.82 | 2.64 | 4.51 | 3.99 | |
| TP | 1.61 | 1.10 | 1.85 | 1.52 |
Table 10.
The water environmental capacities of the Huangshi Reservoir and tributaries (units: tons/year).
Table 10.
The water environmental capacities of the Huangshi Reservoir and tributaries (units: tons/year).
| Sections | Water Quality Target | Water Environmental Capacity | |||
|---|---|---|---|---|---|
| COD | NH3-N | TN | TP | ||
| Bamao River | II | 185.46 | 15.37 | 13.57 | 3.60 |
| Longtan River | II | 131.32 | 13.87 | 12.11 | 3.22 |
| Fanjiafang River | II | 58.56 | 7.33 | 6.38 | 1.69 |
| Dongtan River | II | 46.63 | 4.42 | 3.88 | 1.03 |
| Sum of rivers | 421.97 | 40.99 | 35.94 | 9.54 | |
| Reservoir region (inner part) | II | 4850 | 200 | 160 | 38 |
| Total amount | 5271.97 | 240.99 | 195.94 | 47.54 | |
Table 11.
The water environmental capacity utilizations of the Huangshi Reservoir in 2014 (units: tons/year).
Table 11.
The water environmental capacity utilizations of the Huangshi Reservoir in 2014 (units: tons/year).
| Area | COD | NH3-N | TN | TP | ||||||||
|---|---|---|---|---|---|---|---|---|---|---|---|---|
| Inflow | Capacity | Utilization Ratio (%) | Inflow | Capacity | Utilization Ratio (%) | Inflow | Capacity | Utilization Ratio (%) | Inflow | Capacity | Utilization Ratio (%) | |
| Bamao River | 148.66 | 185.46 | 80 | 17.96 | 15.37 | 117 | 27.04 | 13.57 | 199 | 4.859 | 3.6 | 135 |
| Longtan River | 108.67 | 131.32 | 83 | 13.87 | 13.87 | 100 | 19.65 | 12.11 | 162 | 2.678 | 3.22 | 83 |
| Fanjiafang River | 116.8 | 58.56 | 199 | 14.6 | 7.33 | 199 | 21.36 | 6.38 | 335 | 3.34 | 1.69 | 198 |
| Dongtan River | 89.292 | 46.63 | 191 | 12.23 | 4.42 | 277 | 16.23 | 3.88 | 418 | 1.573 | 1.03 | 153 |
| Reservoir region | 197.64 | 4850 | 4 | 97.54 | 200 | 49 | 179.03 | 160 | 112 | 44.375 | 38 | 117 |
| Total amount | 661.062 | 5271.97 | 13 | 156.2 | 240.99 | 65 | 263.31 | 195.94 | 134 | 56.825 | 47.54 | 120 |
Table 12.
The pollutants reduction targets of the Huangshi Reservoir in 2020 (units: tons/year).
| Area | COD | NH3-N | TN | TP |
|---|---|---|---|---|
| Reductions | Reductions | Reductions | Reductions | |
| Bamao River | 10.39 | 6.59 | 20.93 | 3.358 |
| Longtan River | 7.18 | 2.73 | 12.16 | 0.457 |
| Fanjiafang River | 92.74 | 9.89 | 20.55 | 3.062 |
| Dongtan River | 63.55 | 9.93 | 15.61 | 1.055 |
| Reservoir region | −4560.48 * | −58.02 * | 84.81 | 23.233 |
| Total amount | −4386.62 | −28.88 | 154.06 | 31.165 |
* Note: the symbol of “−”delegates’ available capacity without reduction.
Table 13.
The pollutants reduction targets of the Huangshi Reservoir in 2025 (units: tons/year).
| Area | COD | NH3-N | TN | TP |
|---|---|---|---|---|
| Reductions | Reductions | Reductions | Reductions | |
| Bamao River | 86.64 | 13.78 | 33.19 | 6.17 |
| Longtan River | 61.22 | 8.19 | 20.68 | 1.898 |
| Fanjiafang River | 150.44 | 16.06 | 29.96 | 4.961 |
| Dongtan River | 103.48 | 14.23 | 21.89 | 1.827 |
| Reservoir region | −4445.73 * | −2.79 * | 175.45 | 44.122 |
| Total amount | −4043.95 | 49.47 | 281.17 | 58.978 |
* Note: the symbol of “−” delegates’ available capacity without reduction.
© 2018 by the authors. Licensee MDPI, Basel, Switzerland. This article is an open access article distributed under the terms and conditions of the Creative Commons Attribution (CC BY) license (http://creativecommons.org/licenses/by/4.0/).
Share and Cite
MDPI and ACS Style
Zhao, F.; Li, C.; Chen, L.; Zhang, Y. An Integrated Method for Accounting for Water Environmental Capacity of the River–Reservoir Combination System. Water 2018, 10, 483. https://doi.org/10.3390/w10040483
AMA Style
Zhao F, Li C, Chen L, Zhang Y. An Integrated Method for Accounting for Water Environmental Capacity of the River–Reservoir Combination System. Water. 2018; 10(4):483. https://doi.org/10.3390/w10040483
Chicago/Turabian StyleZhao, Fen, Chunhui Li, Libin Chen, and Yuan Zhang. 2018. "An Integrated Method for Accounting for Water Environmental Capacity of the River–Reservoir Combination System" Water 10, no. 4: 483. https://doi.org/10.3390/w10040483
Note that from the first issue of 2016, this journal uses article numbers instead of page numbers. See further details here.