Article

Estimation of the Source Apportionment of Phosphorus and Its Responses to Future Climate Changes Using Multi-Model Applications

1
Tianjin Key Laboratory of Water Resources and Environment, Tianjin Normal University, Tianjin 300387, China
2
Department of Water Environment Planning, Chinese Academy for Environmental Planning, Beijing 100012, China
*
Authors to whom correspondence should be addressed.
Water 2018, 10(4), 468; https://doi.org/10.3390/w10040468
Submission received: 8 March 2018 / Revised: 8 April 2018 / Accepted: 10 April 2018 / Published: 12 April 2018
(This article belongs to the Section Water Resources Management, Policy and Governance)

Abstract

:
The eutrophication issue in the Yangtze Basin was considered, and the phosphorus loads from its tributary, the Modaoxi River, were estimated. The phosphorus flux and source apportionment of the Modaoxi River watershed were modeled and quantified, and their changes with respect to future projected climate scenarios were simulated with multiple model applications. The Regional Nutrient Management (ReNuMa) model based on Generalized Watershed Loading Functions (GWLF) was employed as a tool to model the hydrochemical processes of the watershed and thereby estimate the monthly streamflow and the phosphorus flux as well as its source apportionment. The Long Ashton Research Station Weather Generator (LARS-WG) was used to predict future daily weather data through the statistical downscaling of the general circulation model (GCM) outputs based on projected climate scenarios. The synthetic time series of daily precipitation and temperatures generated by LARS-WG were further used as input data for ReNuMa to estimate the responses of the watershed hydrochemical processes to future changed climate conditions. The results showed that both models could be successfully applied and that the future wetter and warmer climate trends would have generally positive impacts on the watershed phosphorus yields, with greater contributions coming from runoff. These results could provide valuable support for local water environmental management.

1. Introduction

The excess phosphorus contribution and accumulation in the Yangtze Basin of China over the past several decades have resulted in great eutrophication risk [1,2]. Much work has been done to estimate the changes in phosphorus fluxes regarding both positive and negative aspects, such as the upward trends following fertilizer dispersion and population increases [3,4] and the recent declines potentially due to the construction of sewage treatment plants and dams for infrastructure [5,6]. Understanding the source apportionment of phosphorus at the watershed scale is critical for regional management [7,8]. Previous studies have identified that non-point sources provide the main contribution of phosphorus to the Yangtze and its tributary [3,9,10]. To characterize indirect, multiple and dynamic non-point sources, it is common to use suitable modeling tools for the estimation of phosphorus flux and source apportionment [11,12,13]. Studies of the responses of watershed non-point source pollution to changes in both natural and man-made factors have been widely implemented based on various models [14,15], and the impacts of future climate changes are of special concern [16,17]. Hence, it is of great significance to estimate the phosphorus source apportionment in the typical watershed/sub-watershed of the Yangtze Basin and predict its responses to future changed climate scenarios with proper multi-model applications.
As a case study, the total dissolved phosphorus (Dis-P) in the watershed of the Modaoxi River was estimated. The Modaoxi River is located in the middle reaches of the Yangtze River and serves as its right bank tributary, with a Dis-P concentration of 0.086 ± 0.039 mg/L (2011–2015, monthly monitor records base). The watershed of the Modaoxi lies along the border of Chongqing and Hubei provinces as a farmland- and forest-dominated area with active planting practices and many rural residents, indicating a considerable non-point source contribution that would potentially be sensitive to regional climate status. It is significant for local water management to estimate the current watershed Dis-P status of source apportionment and its future trends in terms of both yield and composition under various projected climate change scenarios with appropriate modeling tools. However, a detailed mechanistic model is difficult to achieve in the Modaoxi watershed due to insufficient data availability. Thus, models with modest data requirements but reliable outcomes are in great demand.
In this project, the Regional Nutrient Management (ReNuMa) model was employed as a tool to estimate the hydrochemical processes of the Modaoxi River watershed with homologous algorithms of Generalized Watershed Loading Functions (GWLF) [18,19]. The achievement of the ReNuMa model application in the study area could provide a new approach to estimate watershed Dis-P source apportionment, which is of great significance to the local society. With the advantages of modest data requirements, flexible operation, and reliable modeling capability, the ReNuMa and GWLF have been broadly applied over the past decade [20,21], and many recent applications have focused on nutrient estimations and scenario analyses based on subjective man-made and/or projected modeled data with various integrated model approaches [22,23,24]. For the Modaoxi watershed, it is valuable to understand the responses of Dis-P yields and source apportionment to various scenarios of changed regional conditions, among which climate change is one of the most important factors. The global climate status in the future had been estimated by many general circulation models (GCMs) based on various projected emission scenarios proposed by the Intergovernmental Panel on Climate Change (IPCC) and have been widely used to support response estimations in watershed models. Thus, a series of scenario analyses using the ReNuMa model to estimate future Dis-P yields and source apportionment in the Modaoxi watershed based on credible GCM outputs would be valuable for local management to support decision-making.
However, the climate change scenarios from GCM outputs cannot be directly used in the ReNuMa model because of their limited resolution at both spatial and temporal scales. It is a common issue in coupling the GCMs and the watershed model, and downscaled analysis has been recognized as an excellent approach to bridge the gap [25,26]. In this project, the Long Ashton Research Station Weather Generator (LARS-WG) was used for modeling future weather data. As a weather generator with a series of semi-empirical distribution algorithms, the LARS-WG can generate synthetic daily weather data that represent various future climate scenarios according to the GCM outputs [27,28]. There are many applications of LARS-WG for response estimation by linkage to popular watershed hydrological and/or hydrochemical models [29,30,31,32,33], but few applications have been performed with ReNuMa/GWLF. The estimations of Dis-P yields and source apportionment responses to future climate changes in the Modaoxi watershed by linking to the ReNuMa and LARS-WG applications were also relevant for other similar areas to provide a method or as reference for response estimation with modest data requirements. The results showed that the main non-point source contributions of Dis-P in the Modaoxi watershed currently come from planting and rural living, and the flux of Dis-P would generally increase under the future wetter and warmer trends of climate change with a greater contribution through runoff. This information would be helpful for regional management to design current and future Dis-P pollution control projects in more reliable ways.

2. Materials and Methods
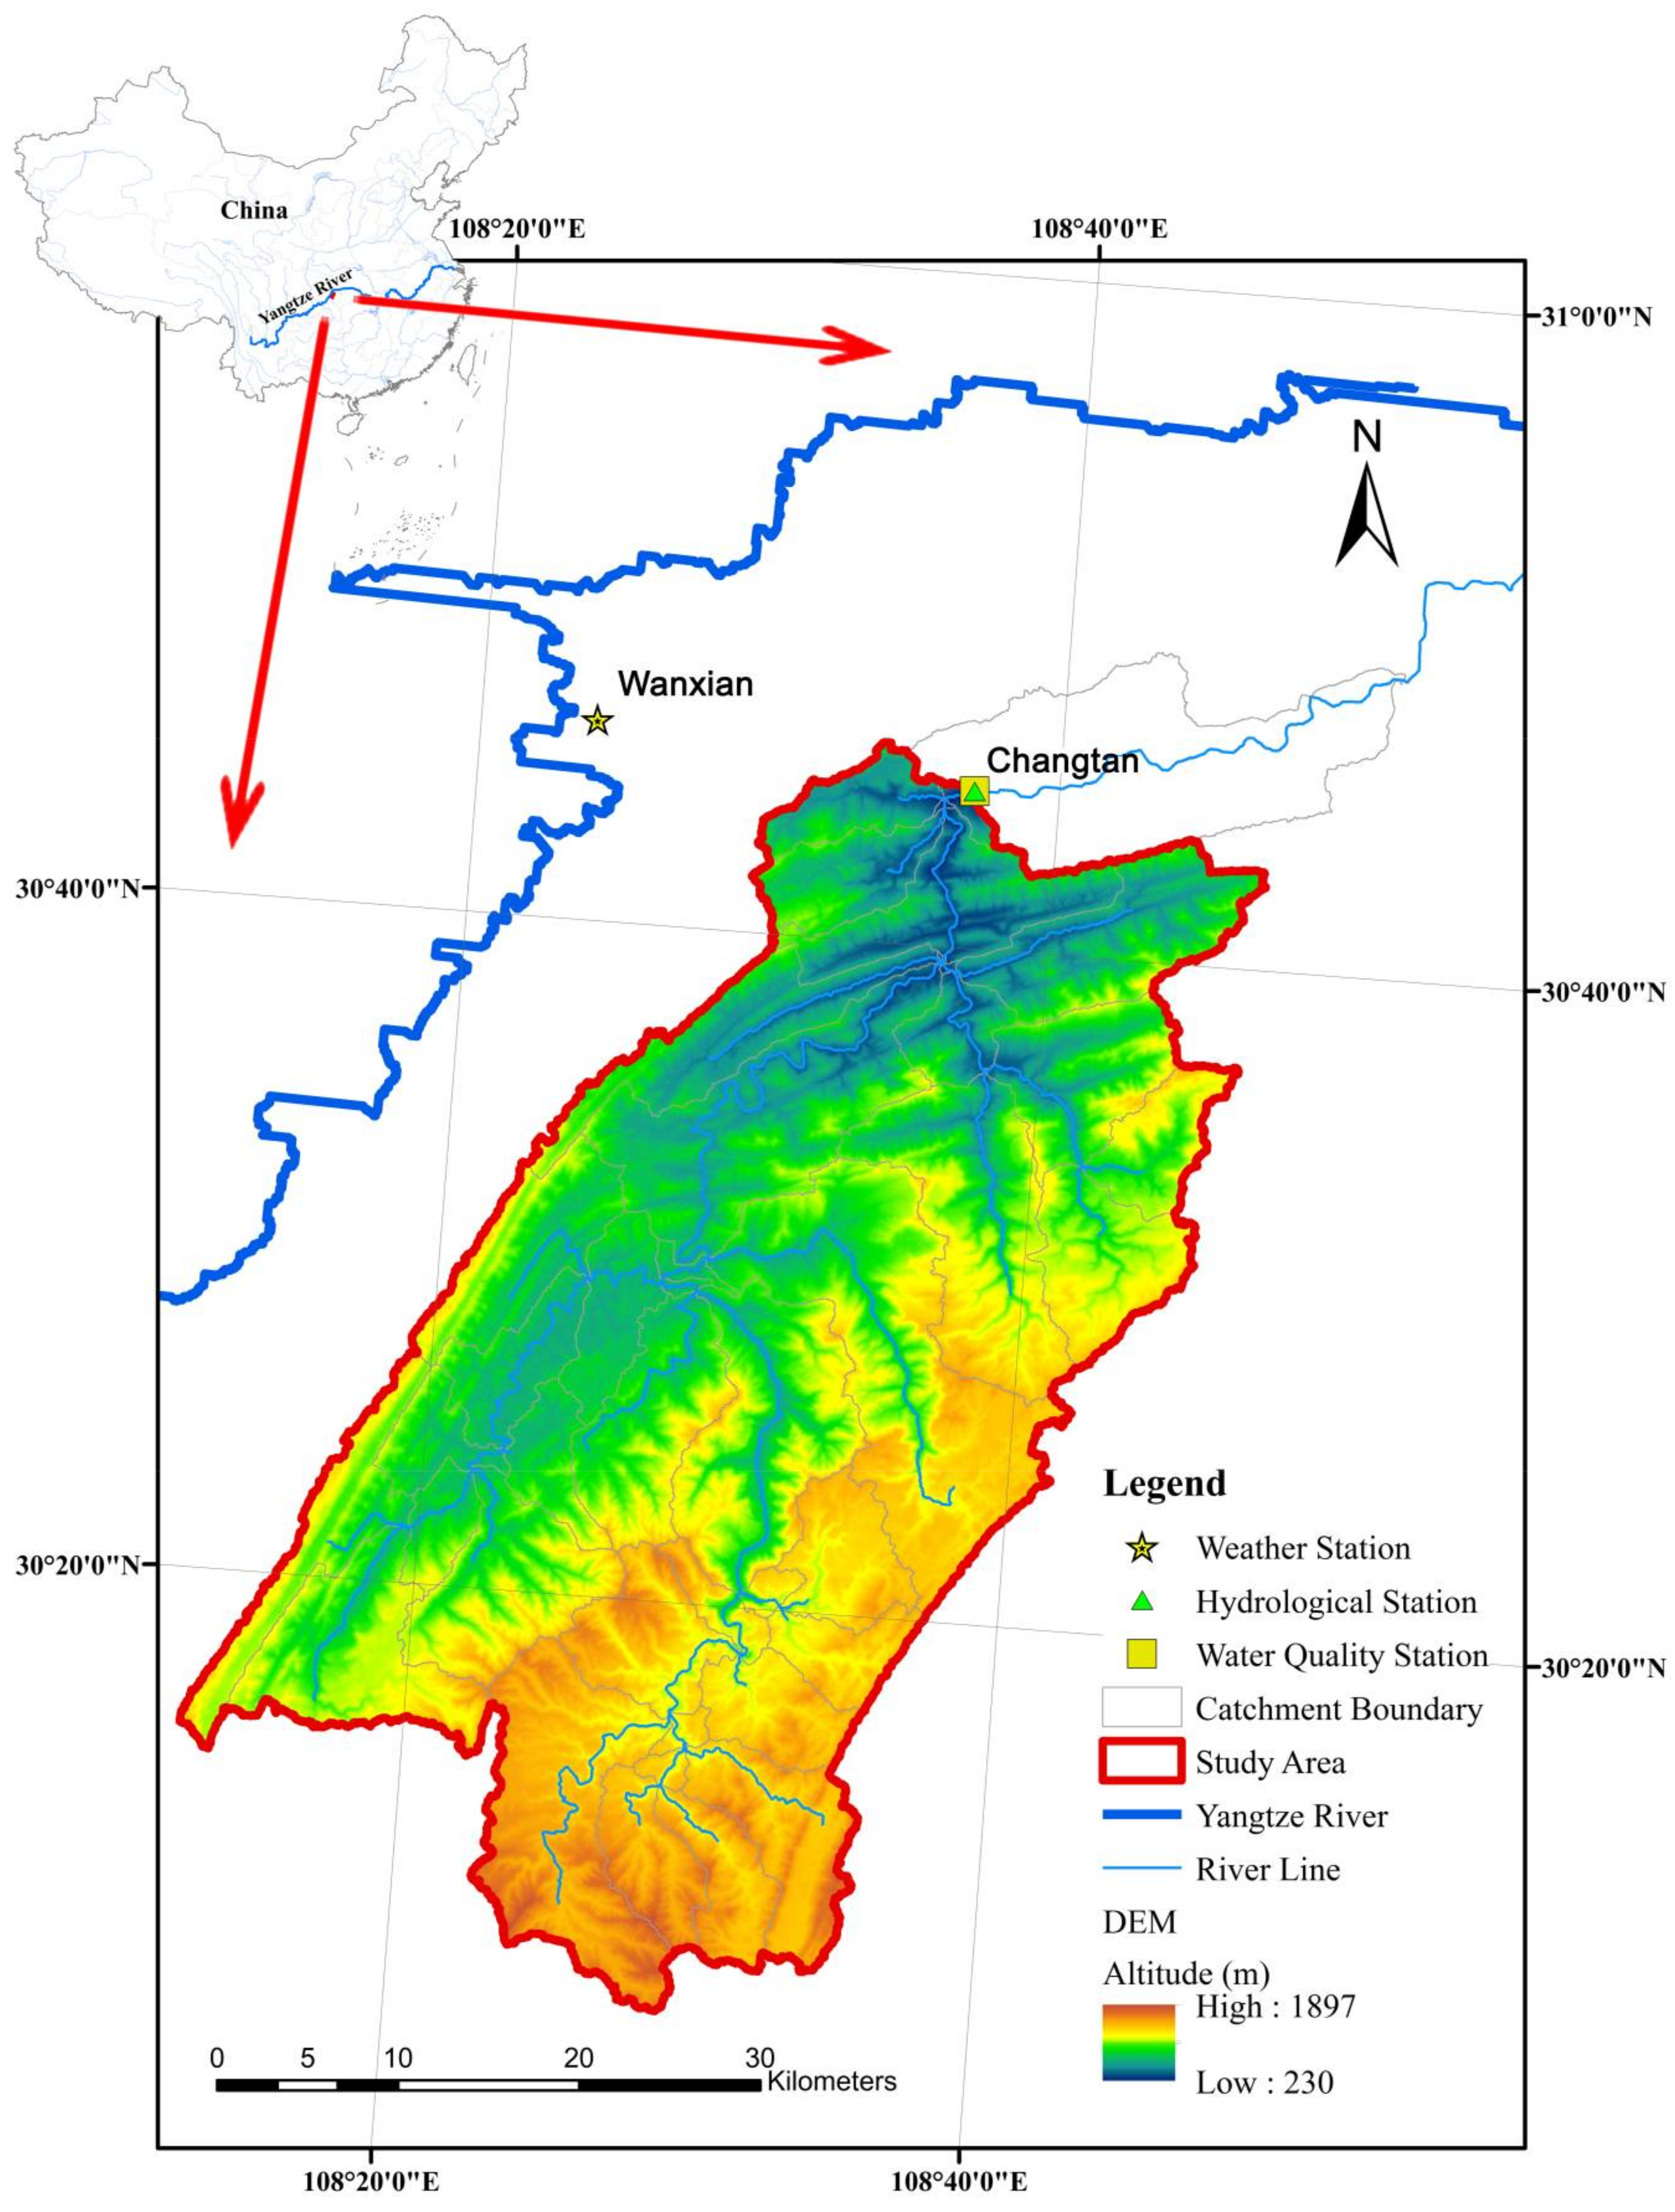
2.1. Study Area

This study was implemented in the Modaoxi River watershed, which is located in the middle reaches of the Yangtze River in southwestern China. The Modaoxi River extends from the north side of Wulingshan Mountain and drains into the Yangtze River at Wanxian in Chongqing, as the Yangtze tributary on the right bank. The portion of the Modaoxi River watershed located above the Changtan hydrologic gauge and water quality monitor station (108.62° E, 30.75° N), with an area of 1984 km2, was used as the study area. It is an area dominated by natural and cultivated lands with approximately 57% forest, 19% grass and 24% active agricultural landuse cover. The watershed lies on the border of Chongqing and Hubei provinces, with approximately 27.8 thousand people living in towns and villages. The main geographical and environmental attributes of the study watershed are shown in Figure 1.

2.2. Data Source

The sources of original data used in this study are summarized in Table 1. ArcGIS 10.2 software (Environmental Systems Research Institute (ESRI), Redlands, CA, USA) was employed for the spatial analysis of the river line and subwatershed division with Arc Hydro Tools 1.4 based on 90-m Digital Elevation Model (DEM) maps. The 1 km grid maps of land-use cover ratios and population distributions were also analyzed by ArcGIS to calculate the land-use areas and population data of the watershed; people living near the river within 50 m were accounted for as populations served by short-circuit systems used in ReNuMa for septic system estimations. The area of each land use type and number of population served by short-circuit systems in the study area were digitized from spatial maps as the model input data. The observed records of monthly streamflow from Changtan hydrologic gauge station (108.62° E, 30.75° N) were used for model calibration and validation of ReNuMa. The data records of daily temperature and precipitation from the weather station nearest to the studied watershed, located in Wanxian (No. 57432; altitude of 186.7 m; 108.40° E, 30.77° N), were used as input data for ReNuMa and calibration data for LARS-WG.

2.3. Model Methods

2.3.1. Watershed Hydrochemical Modeling

The ReNuMa model was employed to estimate the hydrochemical processes of the studied watershed. It was developed using the Microsoft Excel platform with Visual Basic for Applications (VBA) code based on the algorithms of Generalized Watershed Loading Functions (GWLF) with continuous updates and broad applications in recent years [20,34,35]. The newest version of ReNuMa (2.2.2) was used in this project, which has the same algorithms for watershed hydrological estimation as GWLF. The daily precipitation and air temperature are utilized to drive the model; the precipitation is the water source of streamflow; and the air temperature impacts the form and allocation of the precipitation transfer in the watershed. Two new algorithms, the segment function approach for the saturated zone and the leakage transport approach for the unsaturated zone, based on previous studies [36,37], were added to refine the model capacity during low-flow periods.
The algorithms for Dis-P in ReNuMa are the same as those in GWLF [19]. Both surface runoff and groundwater sources are considered, as well as Dis-P loads from on-site wastewater disposal (septic) systems. Surface Dis-P loads are transported in runoff water from numerous land use areas, each of which is considered uniform with respect to soil and cover. Runoff yields are computed by using the Soil Conservation Service Curve Number Equation and Dis-P loads are obtained through multiplying modeled runoff yields by Dis-P concentrations in each land use area defined by user as model parameters. Groundwater yields are modeled with lumped parameter watershed water balance as a linear groundwater reservoir and Dis-P loads are obtained by multiplying groundwater by one average watershed groundwater Dis-P concentration as a model parameter. Dis-P loads from septic systems are calculated by estimating the per capita daily load and the number of people living close enough to surface waters without municipal drain network in the watershed. The losses due to plant uptake in growing season months are also considered. All the three pathways of Dis-P contributions finally compose the model output of Dis-P flux.
Benefitting from the Solver macro add-in procedure embedded in Microsoft Excel based on a nonlinear least square method, the ReNuMa model has a powerful ability to calibrate parameters, which could lead to great accessibility in data-limited situations such as this study area. The parameters sensitivity analysis procedure was firstly operated to determine the sensitive parameters, which were then calibrated with the default parameter set from model manual as initial values. The goal of calibration process is to find a group of optimal parameters values to make the error sum squares between observed and modeled values least. The hydrological parameters of ReNuMa were first determined based on the model’s calibration process. The observed monthly streamflow values at the Changtan hydrologic gauge station from 2009 to 2012 were used to calibrate the model’s hydrological parameters, and the records from 2013 to 2015 were reserved for verification. With the verified hydrological parameters, the nutrient parameters concerning watershed phosphorus estimation were then determined. Due to the limited data, the observed monthly Dis-P values at the Changtan water quality monitoring station in 2011 and 2012 were used for nutrient parameter calibration, and the monthly records in the same period as for the hydrological process from 2013 to 2015 were reserved for verification. The Nash–Sutcliff coefficient of model efficiency (R2NS) and the coefficient of determination (r2) were used as the test statistic in model calibration and verification to characterize the goodness-of-fit of monthly model predictions versus observed data. High values of both R2NS and r2 represent a great modeling capability. The r2 indicates the degree of agreement of a linear relationship between predictions and observations with a value between 0 and +1 calculated by embedded function in Microsoft Excel. The R2NS takes values between − and +1, with zero indicating that the model prediction is no better than the mean of the observations and +1 indicating perfect agreement, which was formulated as,
R N S 2 = 1 i = 1 n ( O i P i ) 2 i = 1 n ( O i O ¯ ) 2
where Oi indicates the observed value in month i, Pi indicates the predicted value in month i, O ¯ indicates the mean value of observed value in all month, and n indicates the number of months being estimated. With the verified model parameter set determined based on real observed data in the Modaoxi River watershed, the current and projected watershed hydrochemical processes could be modeled by the ReNuMa model.

2.3.2. Future Weather Modeling

Three main projected future emissions scenarios proposed by the Intergovernmental Panel on Climate Change (IPCC) in the Fourth Assessment Report (AR4) were considered in this project for future climate change estimations. Although new scenarios had been released in IPCC AR5, the classic scenarios of A1B, A2 and B1 in the AR4 were still widely applied in recent studies [38,39] and are used in this project for their well-tested linkage with various general circulation models and weather generators. The outputs of the HADCM3 global circulation model were used to represent future climate status. The HADCM3 was developed at the Hadley Centre in the United Kingdom as one of the major models in the AR4. It can provide global/regional predictions of monthly/seasonal changes in precipitation and temperature for different future periods under various emissions scenarios, which have been widely used to support estimations of site-scale responses to future climate changes [40,41]. The outputs of HADCM3 here had to be further downscaled to the site and daily scales for ReNuMa applications, and the Long Ashton Research Station Weather Generator (LARS-WG) was used to achieve this work.
LARS-WG is a weather generator that uses a series of semi-empirical distributions to downscale the large-scale space and time outputs of general circulation models and to generate synthetic daily weather data to represent the future climate status. LARS-WG can generate daily time series that represent various future climate scenarios, and many applications have been conducted for the estimation of responses by linking to popular watershed hydrological and/or hydrochemical models. In this project, sixty years of observed daily weather data from 1955 to 2014 were used to calibrate the parameters of the LARS-WG model, based on which sixty years of synthetic daily weather data were generated for model validation. To assess the reliability of the LARS-WG model following its routine application, three general statistical tests were used to compare the consistency of the observed and synthetic series, including the Kolmogorov–Smirnov (K–S), the t-test, and the F-test. The seasonal wet/dry series distributions (WDSeries), daily precipitation distributions (PrecD), daily minimum temperature distributions (TminD), and daily maximum temperature distributions (TmaxD) were estimated via K–S test. The monthly mean of precipitation (PMM), monthly mean of daily maximum temperature (TmaxM), and monthly mean of daily minimum temperature (TminM) were estimated via t-test. The monthly variances of precipitation (PMV) were estimated via the F-test. The ratios of significantly different results to the total number of tests at the 5% significance level were used to represent the model performance, which is a common criterion in LARS-WG application. The larger the number is, the poorer the model performance. Otherwise, with a small number of significantly different results, the model performance would be classified as valid with reliable outputs. Then, the verified LARS-WG parameters were further updated based on the outputs of HADCM3 to generate future site-scale daily weather data, which would be suitable for ReNuMa to use for Dis-P response estimations.

2.3.3. Linkage of Model Applications

In this project, the ReNuMa model was first used in the Modaoxi River watershed to calibrate the set of model parameters and to model the watershed hydrochemical process of Dis-P and estimate the current Dis-P source contribution. Then, the LARS-WG was used to model the climate character of the watershed area and generated a series of synthetic future daily weather data. Sixty years of synthetic daily precipitation and temperature data were generated for each projected emission scenario in one future period; i.e., three emission scenarios (A1B, A2 and B1) and two future periods (2050s and 2080s) were considered, and six series of synthetic daily weather data were generated by LARS-WG and further applied as input data in the validated GWLF for simulations of future watershed hydrochemical processes. Future watershed Dis-P fluxes and source contributions under various climate change scenarios were estimated and compared with the current status.

3. Results

3.1. Model Outputs

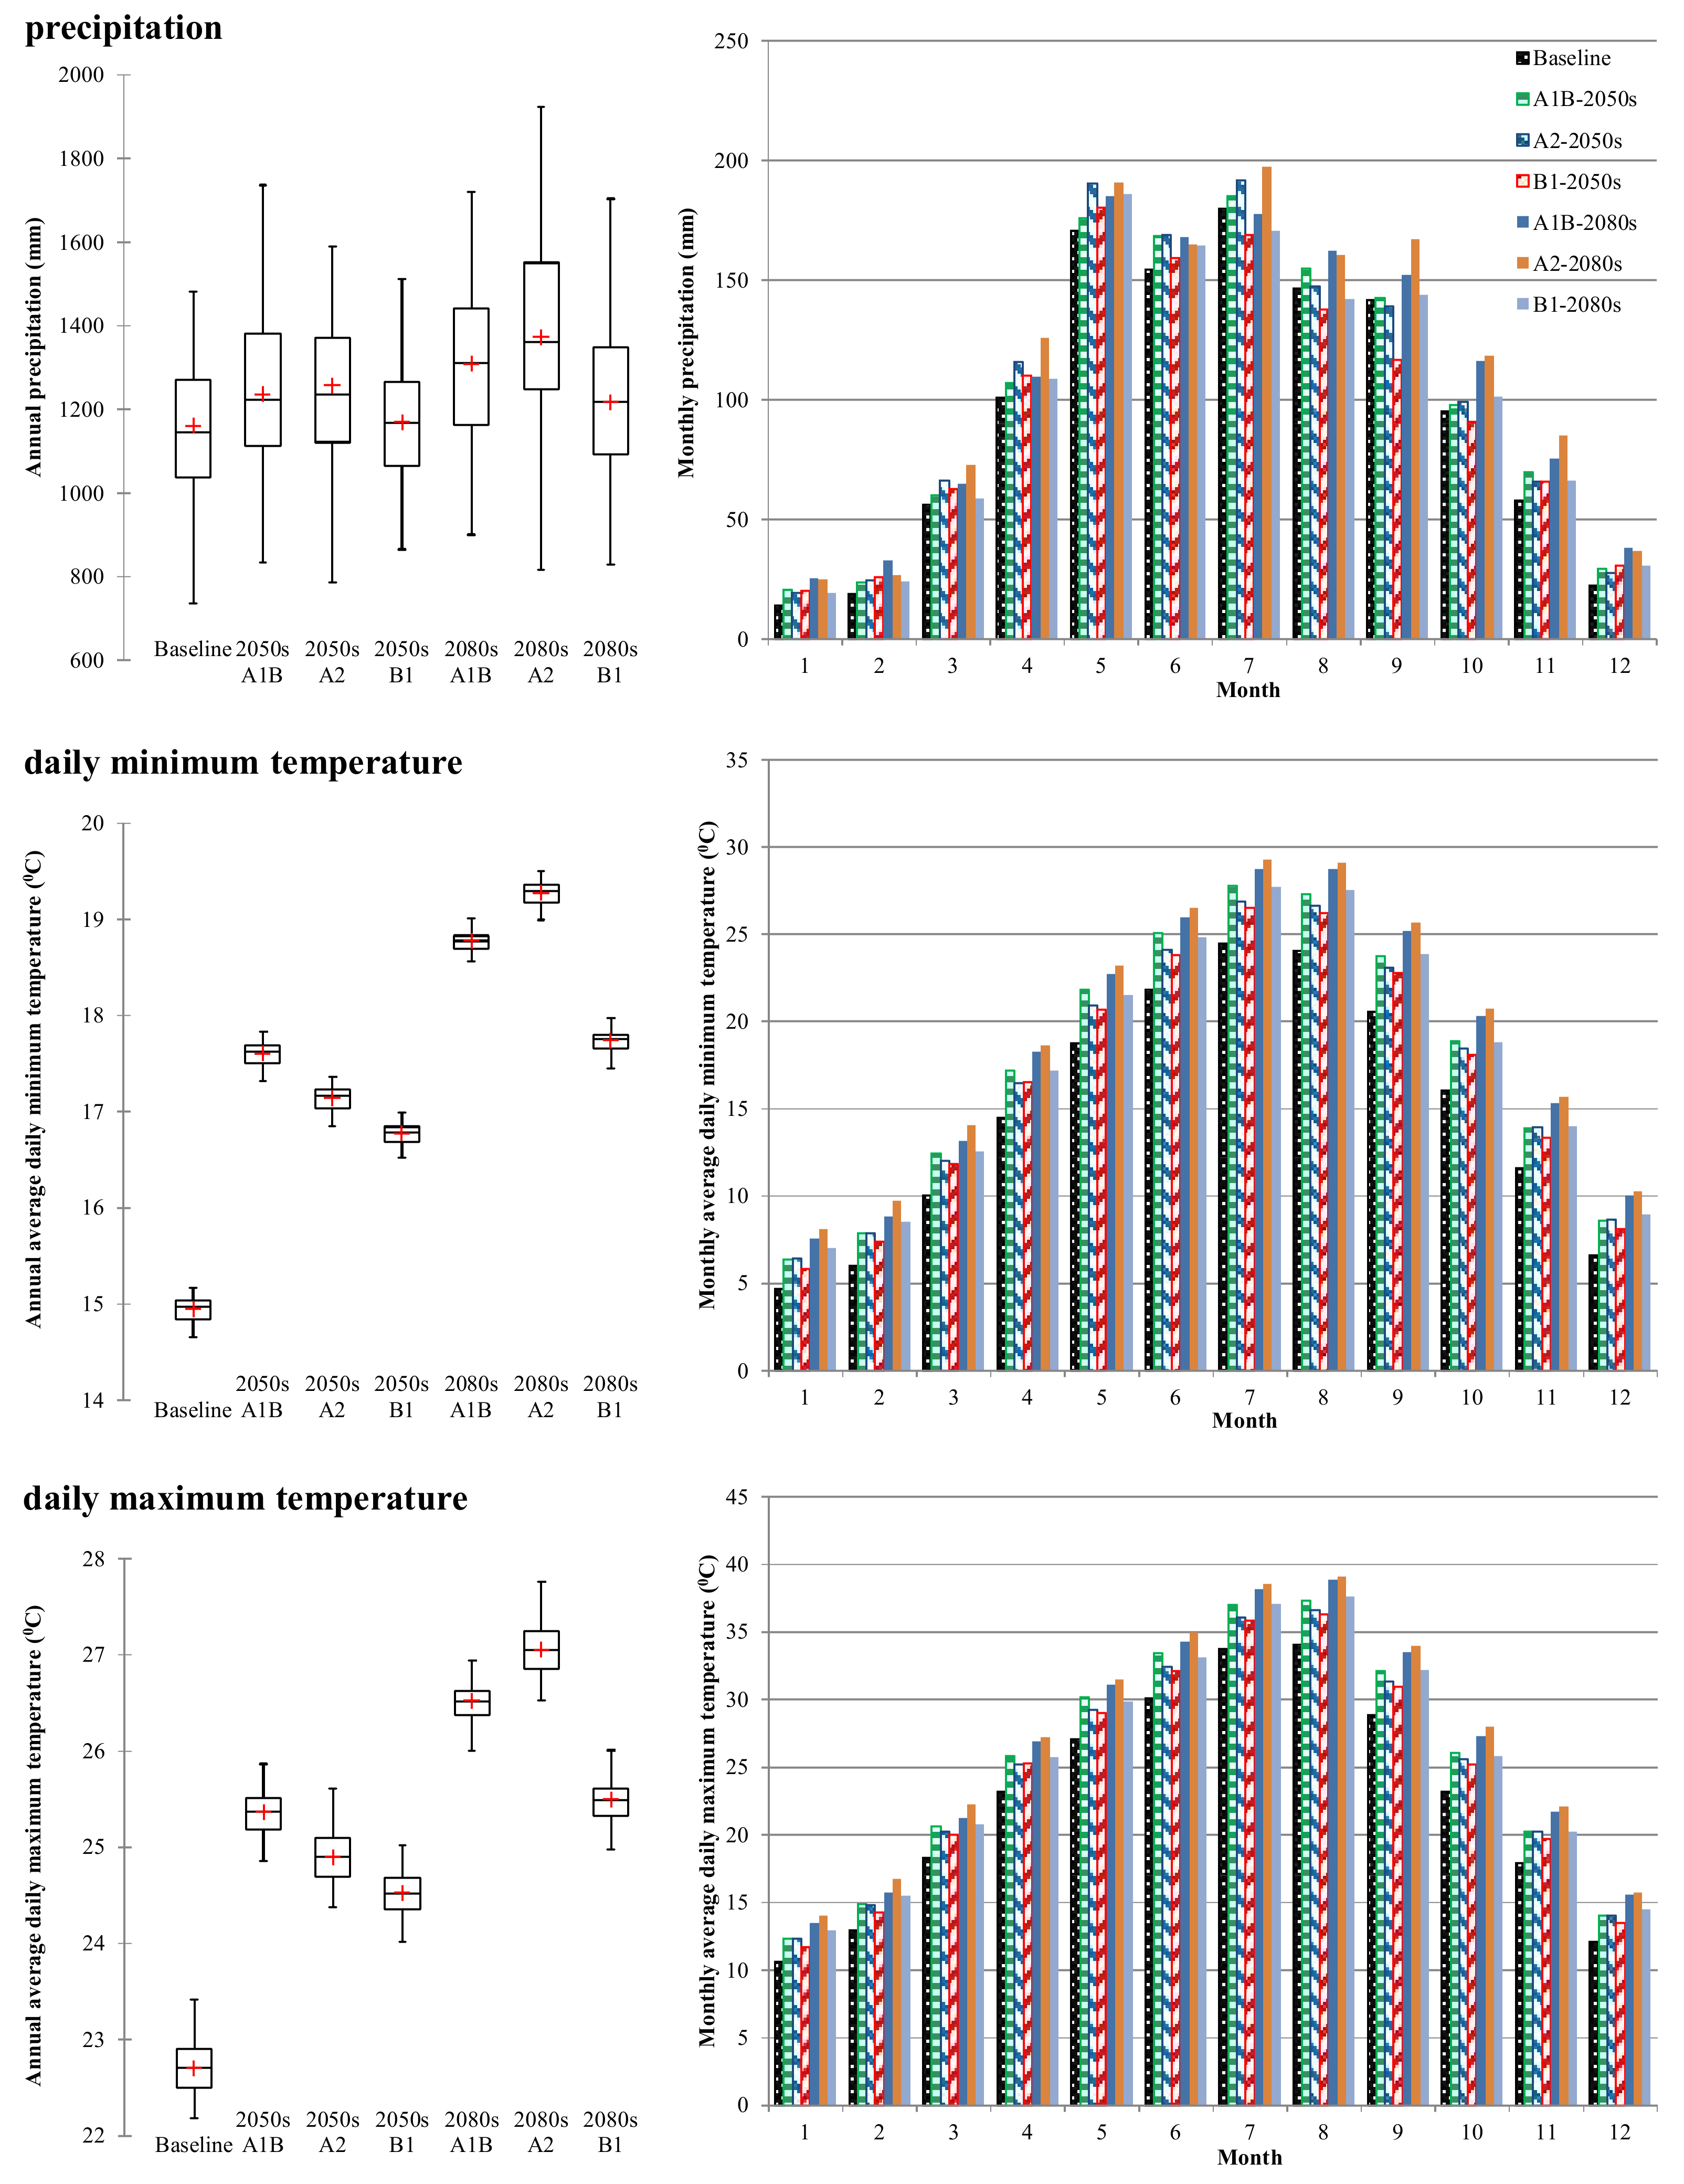
3.1.1. LARS-WG Model
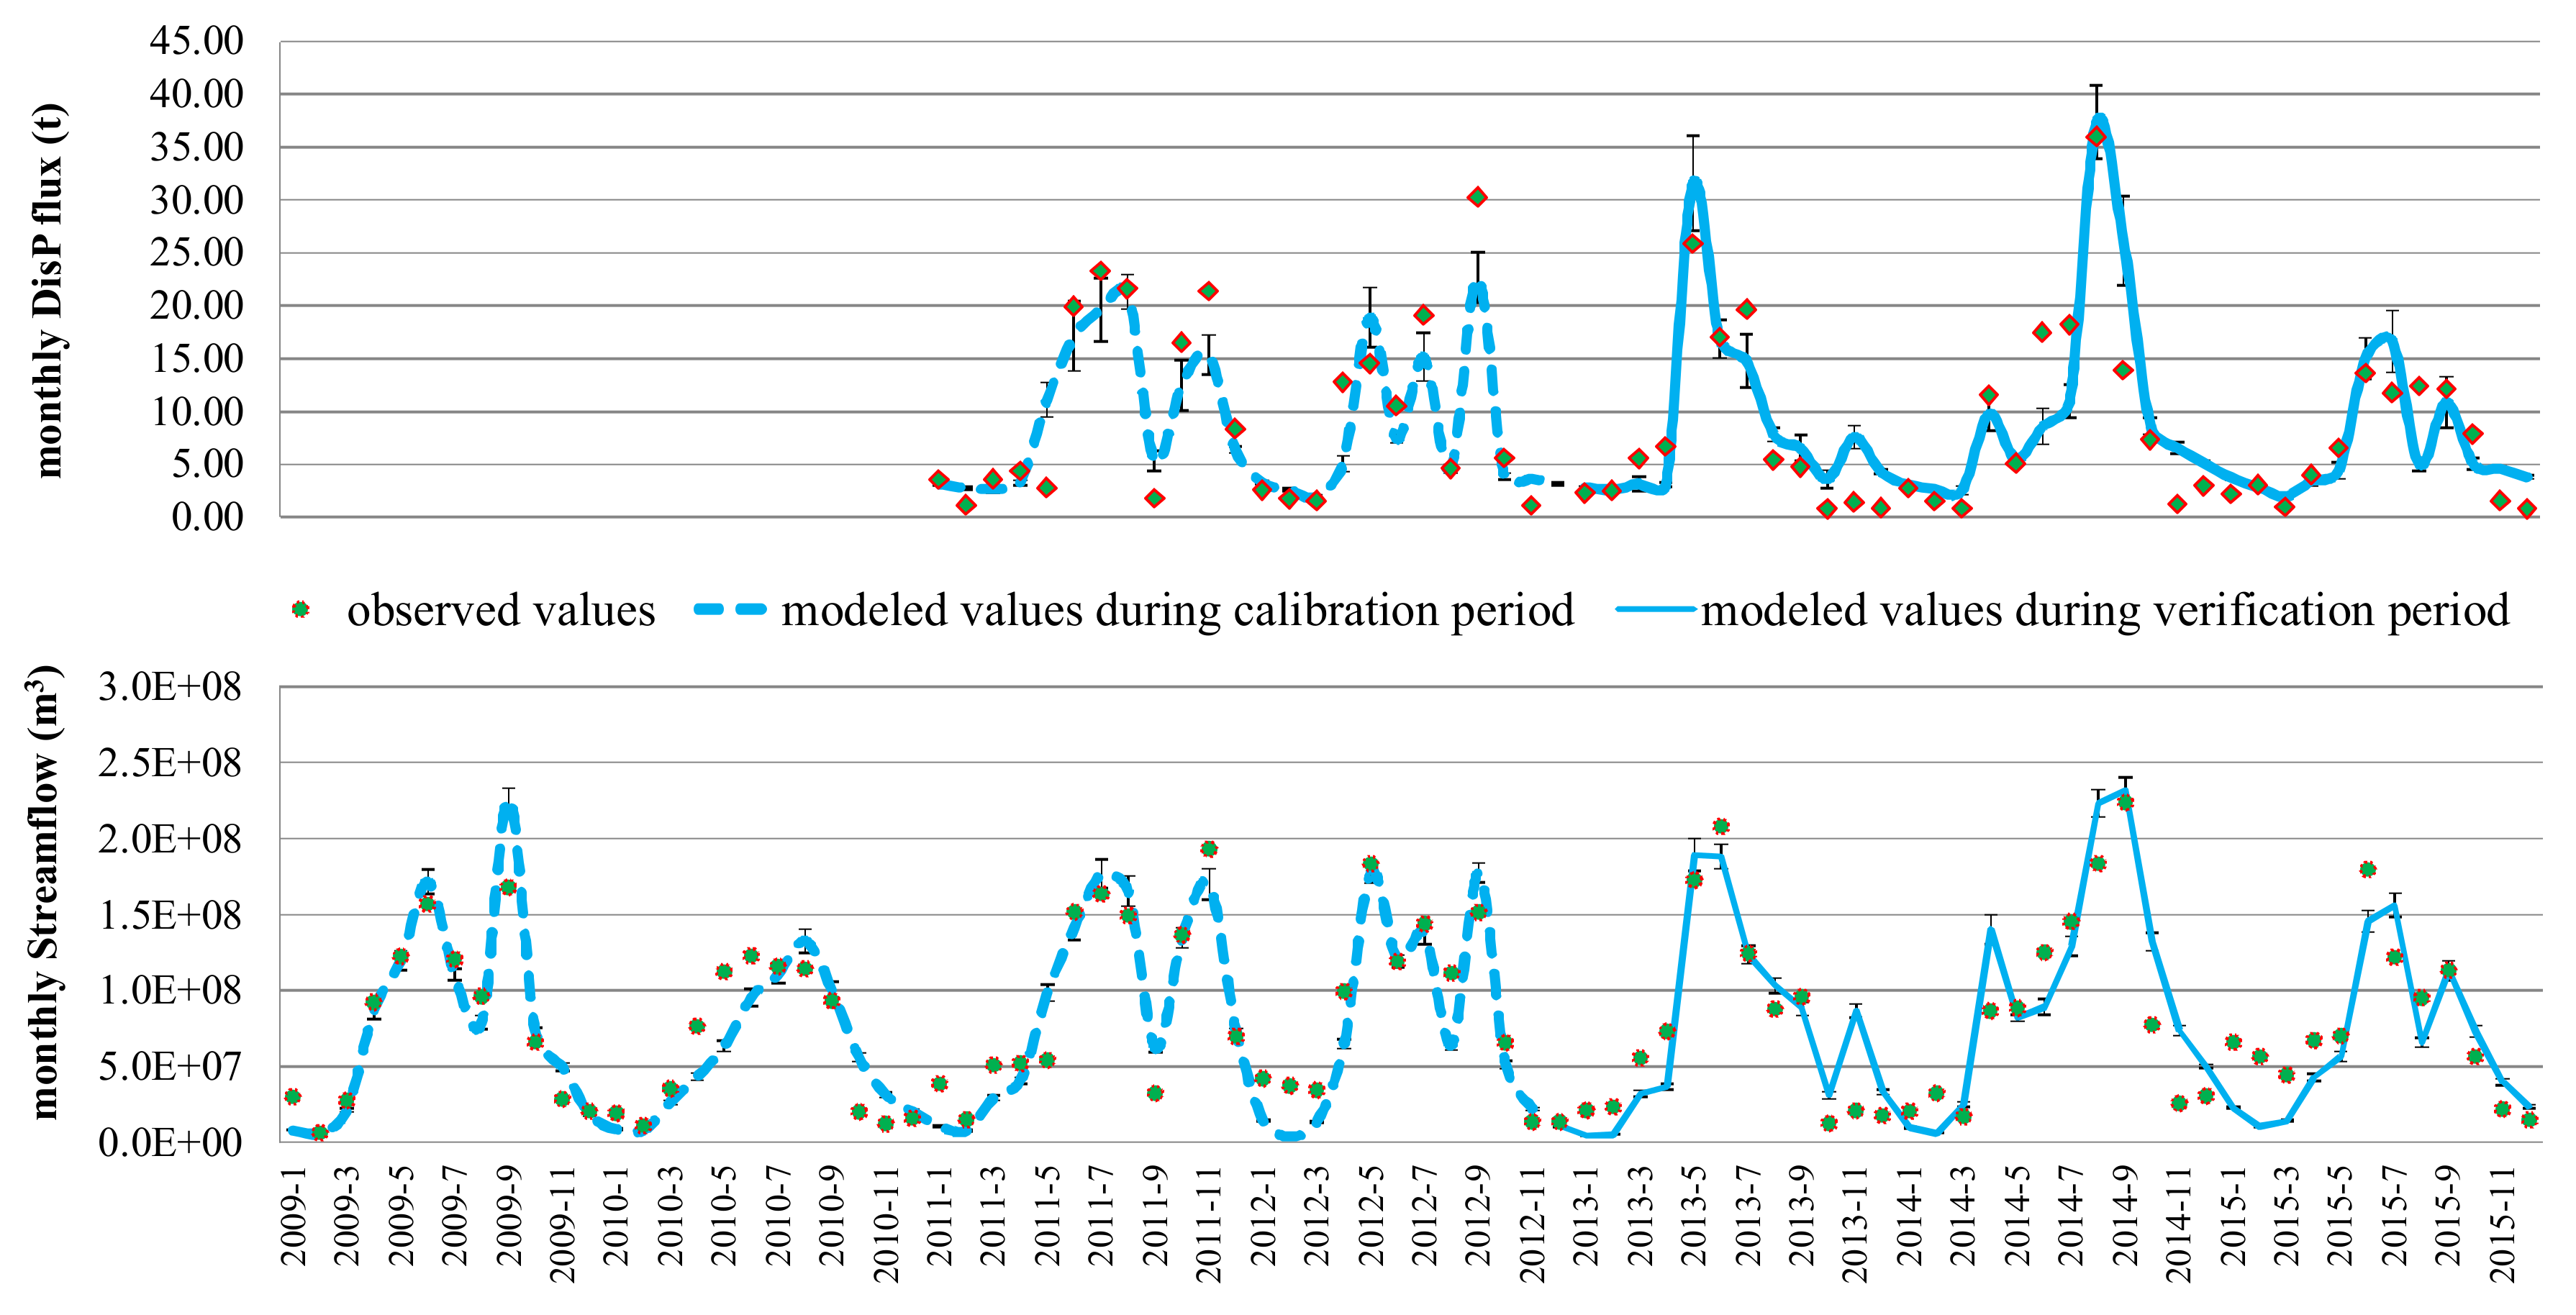
The parameter set of the LARS-WG model suitable for the current climate status of this studied area was carried out based on sixty years of observed daily weather records, which were further updated using the HADCM3 outputs to represent the future climate status of various scenarios and periods. The climate change scenarios A1B, A2 and B1 in the periods 2046–2065 (Period A, PA) and 2080–2099 (Period B, PB) were estimated with the random seed number of 1223 to generate the synthetic daily weather series. Six groups of sixty years of daily precipitation and daily maximum and minimum temperatures were generated based on various groups of updated model parameters, the results of which are plotted in Figure 2. The length of the box represents the distance between the 1st quartile (25th percentiles) and 3rd quartile (75th percentiles), and the line and cross in the box interior represented the median and mean values in the group, respectively. The ends of the “whiskers” are the minimum and maximum values of the group. The results showed that the statistical characteristics of the synthetic series from LARS-WG were in accordance with the GCM results for wetter and warmer trends of climate change in the future. In another view, the ratios of significantly different results between the observed and synthetic weather data are listed in Table 2. We could determine that most weather items had no significant differences between the observed and modeled datasets, indicating a high modeling precision. There were significantly different results for TminM in March and September, indicating a relatively poor modeling ability in these months. For March, the observed series had a mean value of 9.70 °C and a standard deviation of 1.038 °C, while the modeled series had a mean value of 10.06 °C and a standard deviation of 0.578 °C. We could determine that the estimation of mean value was generally acceptable with slight overestimation and an error of 3.7%, but the error in the standard deviation was significant. Similarly, in September, the error in the mean values between the observed and modeled series was only 1.2%, but the difference in standard deviations was large. The standard deviation of the modeled series was 0.455 °C, much lower than the value for the observed series of 0.833 °C. The model precision here was acceptable overall within the same level as other model applications [42,43,44], thus indicating the dependability of LARS-WG in downscaling analysis to this study area. These series of synthetic daily weather data were then used as input data for the verified ReNuMa to estimate further changes in the watershed hydrochemical processes, as described in detail in Section 3.3. All model parameters and outputs of LARS-WG are provided in the Supplementary Materials.

3.1.2. ReNuMa Model

The transport parameters of the ReNuMa model used to describe the watershed hydrological processes were first calibrated based on the observed monthly streamflow, with which the monthly streamflow could be modeled. The modeled monthly streamflows based on the calibrated transport parameters of the ReNuMa model were used to compare with the observed records to estimate the model performance. The results showed that between the modeled and observed monthly streamflows during the calibration period (2009–2012), the R2NS was 0.83, and the r2 was 0.86. For the verification years (2013–2015), the R2NS was 0.75, and the r2 was 0.79. We found that there were several overestimations in winter and spring in the verification period. However, both the R2NS and r2 were higher than 0.80 in the calibration period and that both statistics declined slightly in the verification period but neither was below 0.75. Such statistics were in accordance with the standard level of watershed model applications for the estimation of the monthly hydrological process [45,46], and all the calibrated transport parameter values could make sense within reasonable physical range, which indicated that the calibrated ReNuMa model could provide reliable modeling of the watershed hydrological processes, based on which the nutrient parameters of ReNuMa could be estimated for Dis-P modeling.
With the determined transport parameter set, the nutrient parameters of the ReNuMa model were calibrated in sequence based on observed monthly watershed dissolved (Dis-P) fluxes, which could be used to estimate the watershed dissolved phosphorus process and model the watershed monthly Dis-P fluxes. All the calibrated nutrient parameters had physically reasonable values and the modeled and observed data were compared to estimate the model accuracy for Dis-P fluxes estimation. We found that, for the calibration period (2011 and 2012), the R2NS was 0.81 and the r2 was 0.83, and that, for the period of verification (2013–2015), the R2NS was 0.75 and the r2 was 0.77. Several overestimations existed in winter and spring and underestimations happened in summer. The results showed that the accuracy of the Dis-P flux estimations was acceptable but lower than that of streamflow estimations. The model performance for Dis-P estimations had a slight decline in the verification period compared with the calibration period, similar to the model performance for streamflow estimations.
The parameter uncertainty analysis feature of ReNuMa was operated based on 5% perturbation of normal distribution for all calibrated parameters with 250 iterations [18,34], which could permits relatively quantitative analysis of the effect of parameter uncertainty on simulation uncertainty. The time series of observed and modeled monthly streamflow and Dis-P fluxes, as well as their uncertainties, during the research period are given in Figure 3. The calibrated parameter set of the ReNuMa, including both transport and nutrient parameters, is summarized in the Supplementary Materials.

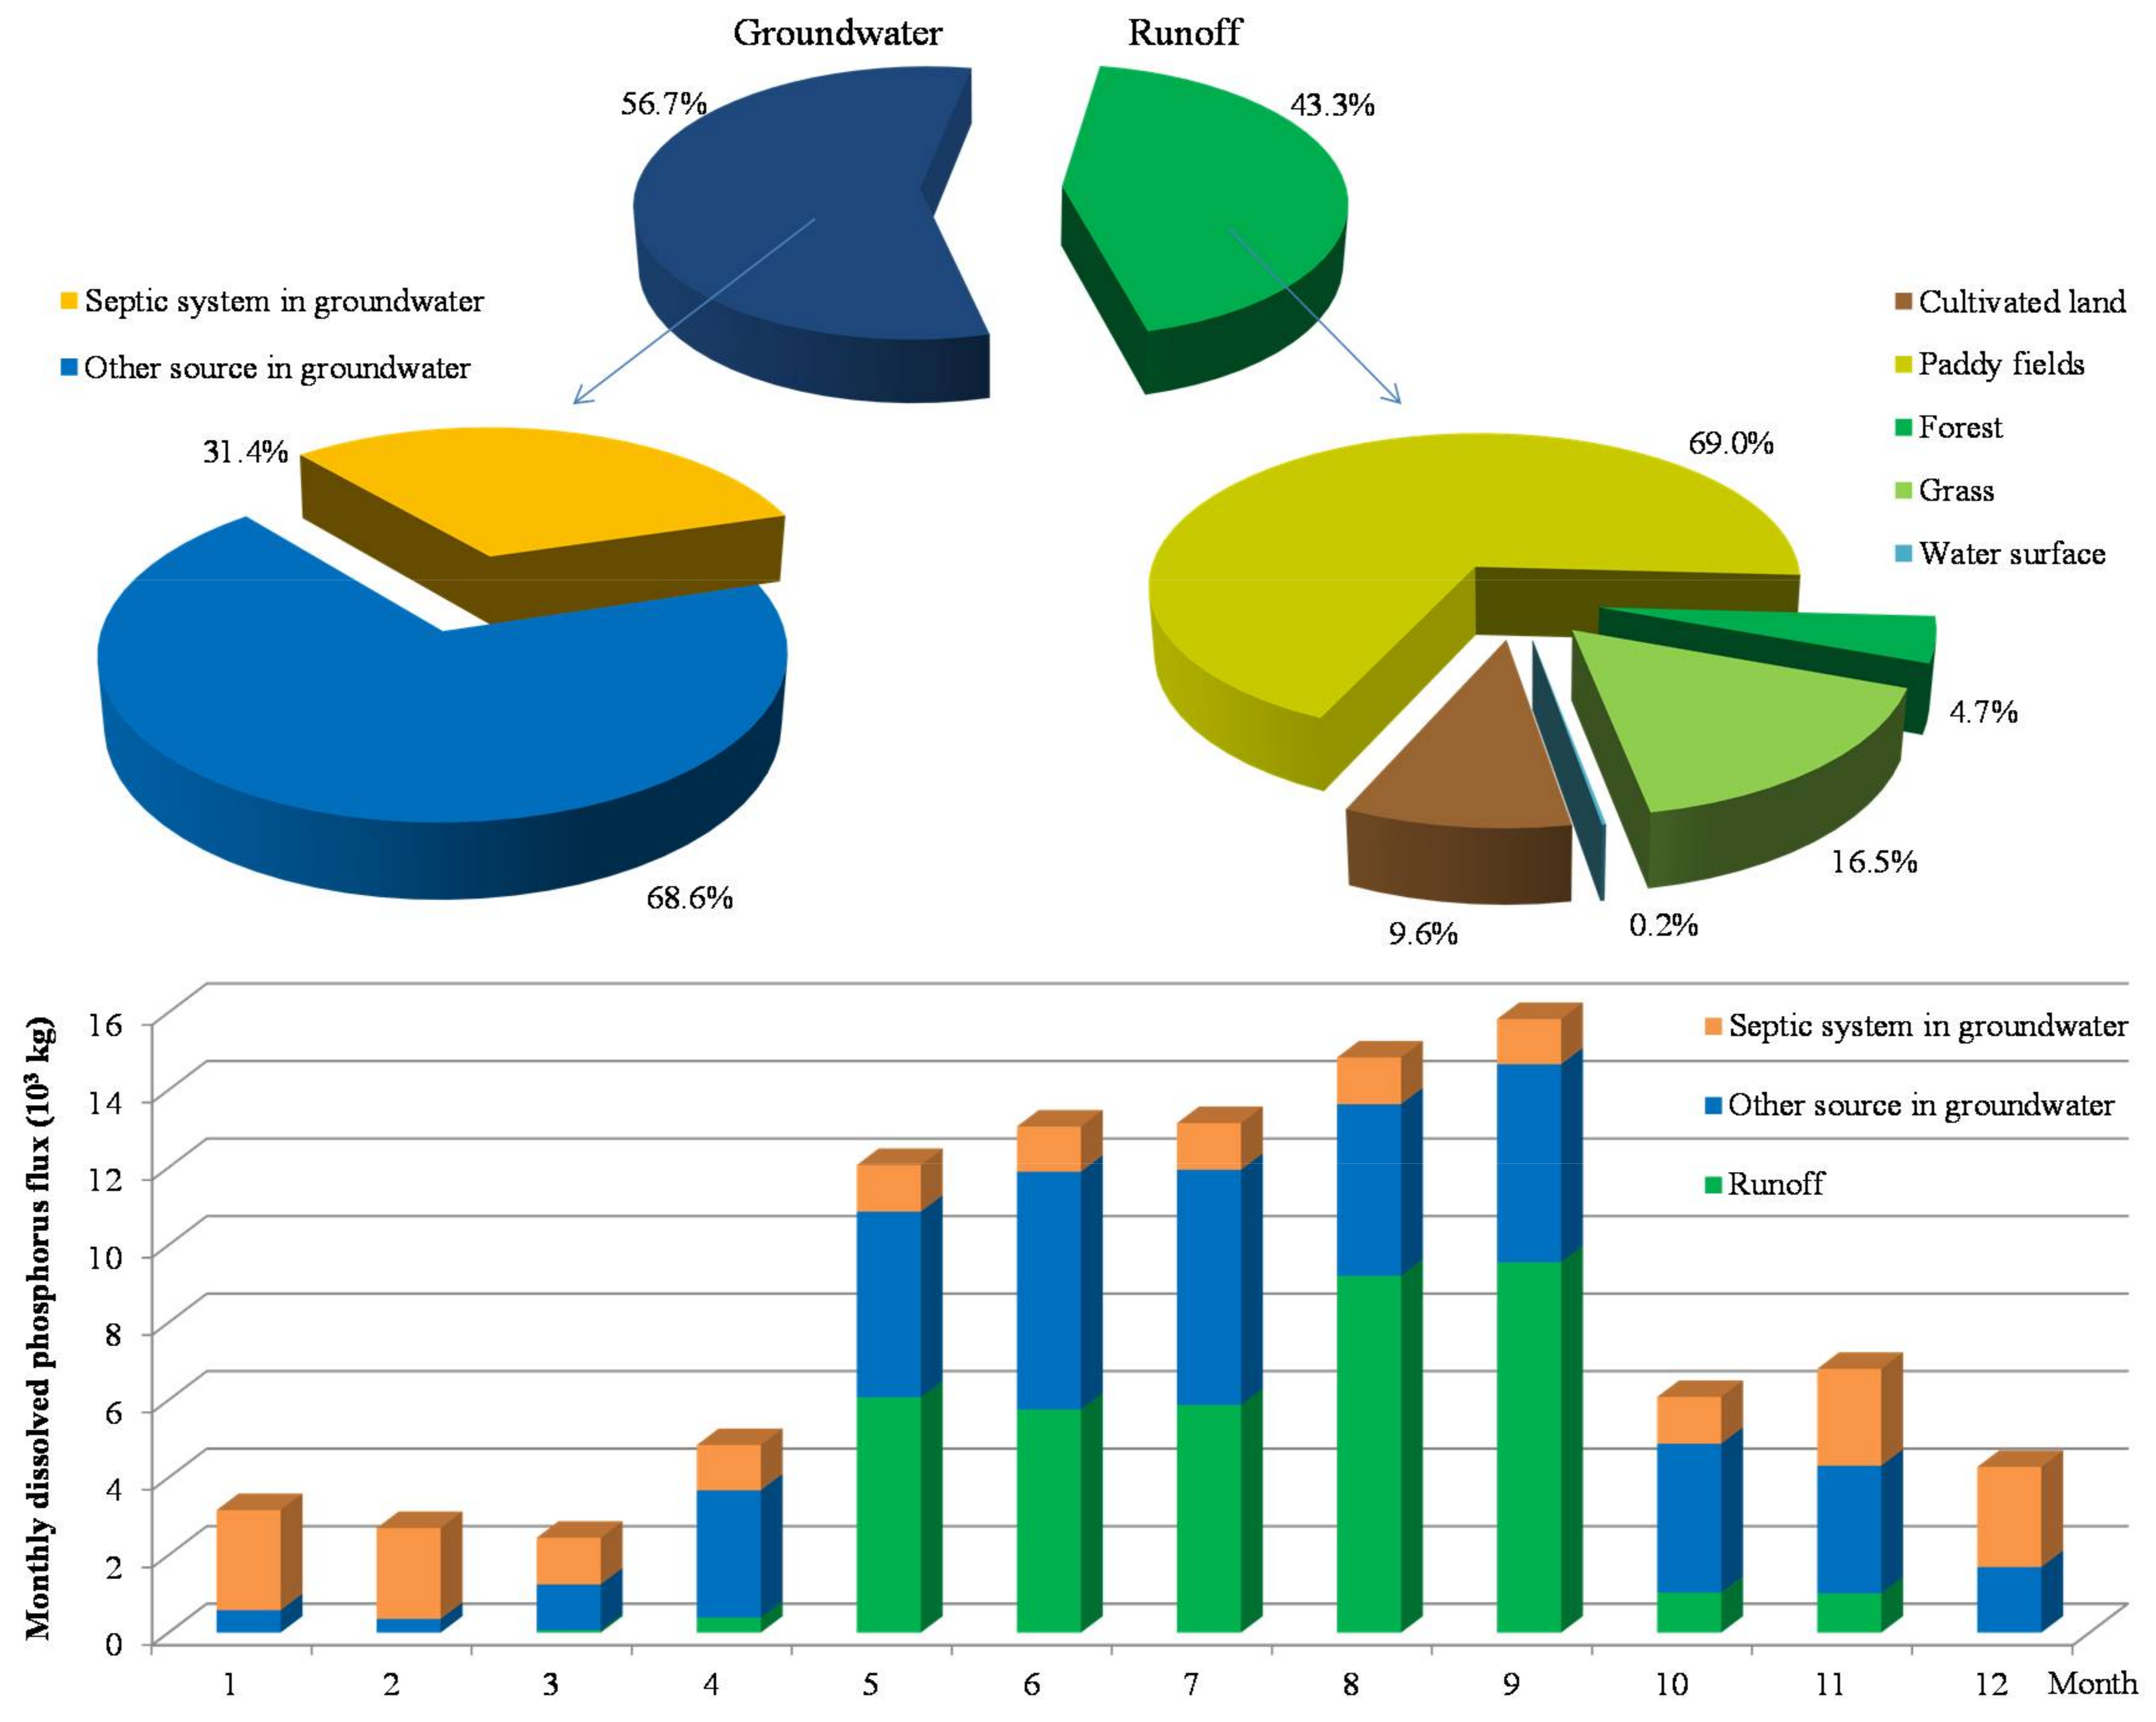
3.2. Current Watershed Phosphorus Source Apportionment

Based on the validated parameter set of ReNuMa, the current fluxes and source apportionment of Dis-P and its responses to future climate changes in the study area were estimated by linking to the LARS-WG outputs. The current Dis-P load in the Mo-Dao-Xi watershed was estimated by the ReNuMa model, the results of which are summarized in Figure 4. There were two main routes as sinks for Dis-P loading in the watershed, which included runoff and groundwater. The model results showed that, according to the average annual flux over the research period, the contributions of Dis-P from runoff and groundwater accounted for 43.3% and 57.6%, respectively, of the whole flux. For the Dis-P flux in groundwater, 31.4% came from the septic systems of human dwellings. Using the independent module in the framework of ReNuMa, the septic systems were separately considered to obtain a clear insight into the origin of the pollution source. However, as ReNuMa used lumped algorithms for groundwater flow estimation, other pollution sources in the groundwater that were mixed accounted for 68.6% of the Dis-P flux in groundwater. These pollution sources could not be separately estimated and mainly included the Dis-P loads in infiltration water from various land use areas and the solution during its transport in the soil. For the Dis-P flux in runoff, approximately 78% of the runoff Dis-P flux load came from agricultural land, whereas natural lands, including forest and grass, contributed more than 21%. For the agricultural Dis-P load, the cultivated land accounted for 87.8% as the dominant input source, and the paddy fields accounted for the remaining 12.2%. The grassland accounted for 77.3% of the Dis-P loads contributions from natural lands, and the forestland accounted for 21.9%; less than 1% of the load from natural land was contributed by the surface water via deposition.
Additionally, the fluxes and source apportionments of Dis-P were variable in different months. The average monthly Dis-P fluxes were different in different months, and the high fluxes were mainly distributed from May to September. In addition, runoff was the primary route for Dis-P contribution during high-flux months with high streamflow yields. For the other months, the groundwater was generally the primary pollution route, among which the contribution from septic systems was the primary source in the low-flow period of December–February and the contribution from other groundwater flow was dominant in the normal-flow periods. In summary, the outputs of the ReNuMa model showed that the current Dis-P fluxes of the study watershed came mainly from non-point sources of planting and rural living that were sensitive to the regional weather and hydrological conditions. It was thus possible to obtain a series of reliable estimates for fluxes and source apportionment responses to various future weather statuses, which are further estimated and compared below.

3.3. Responses of Watershed Phosphorus to Future Climate Changes

The changes in the watershed Dis-P flux and source apportionments were estimated based on the linkage applications of LARS-WG and ReNuMa. For each emission scenario and future period, sixty years of synthetic daily weather data were generated by the LARS-WG model. As the LARS-WG had several weaknesses to reproduce the current weather status for some items in some months (Section 3.1.1 and Table 2), the differences between current observed weather data and future modeled weather data were not only caused by projected parameter scenarios but also unexpected model uncertainties. In addition, there would be considerable uncertainties if we used both observed and modeled weather data for Dis-P response estimations. To avoid such issue, sixty years of synthetic daily weather data that represented the current climate status were generated and used instead of the observed weather data for current watershed hydrochemical process estimations. Seven groups of sixty years of synthetic daily weather data representing current and various future climate statuses from the LARS-WG model outputs were used as the GWLF model inputs to estimate the responses of Dis-P fluxes and source apportionments in scenario analyses, the results of which are illustrated in Figure 5.
The results showed that there would be a generally increasing trend for watershed Dis-P flux due to changed weather conditions in the future. The A1B and A2 scenarios showed continual positive impacts. The mean annual Dis-P flux would increase by 5.34% in the 2050s and by 14.0% in the 2080s under scenario A1B, and more intensive increases would occur under scenario A2 with increases of 9.6% in the 2050s and of 21.1% in the 2080s. Conversely, the changes in the mean annual Dis-P flux under scenario B1 showed a V-type trend and would decrease by 3.9% initially in the 2050s but increase thereafter, with a small increase of 4.1% by the 2080s. Furthermore, the changes in climate status would convert the initial source apportionments of watershed Dis-P contributions. We could determine that the contributions of runoff from both farmland and natural land would increase in the 2050s and 2080s under scenarios A1B and A2, whereas a V-type trend would occur under scenario B1 that was similar to that of the annual flux response. The percent of Dis-P flux through runoff in the 2050s would increase by 2.4% for scenario A1B and 3.0% for scenario A2. A greater percentage contribution through runoff would occur in the 2080s with increases of 5.0% for scenario A1B and 5.6% for scenario A2. The percentage contribution through runoff under scenario B1 would decrease by 0.8% in the 2050s and then increase by 2.5% in the 2080s. Conversely, the changes in the contributions in the 2050s and 2080s from septic systems and other sources in ground water showed a decreasing trend under scenarios A1B and A2 and an inverted V-type trend under scenario B1. The percentage contributions from other sources in groundwater under both scenarios A1B and A2 would decrease by 1.3% in the 2050s. In the 2080s, these percentages would decrease by 2.4% for scenario A1B and 2.2% for scenario A2. For scenario B1, the percentage of other sources in the groundwater contribution would increase by 0.5% initially in the 2050s and then decrease by 1.6% in the 2080s. Similarly, the changes in the percentage contribution from septic systems in groundwater would be negative, except in scenario B1 in the 2050s. There were 1.1% and 1.7% decreases from septic systems in the 2050s for scenarios A1B and A2, respectively, and a 0.4% increase from septic systems for scenario B1 in the 2050s. The percentages from septic systems would all decrease in the 2080s by 2.6% for A1B, 3.4% for A2, and 0.8% for B1. In summary, under the projected future climate statuses, there would be more Dis-P fluxes in the study watershed that were contributed more through the route of runoff.
In addition, The Dis-P fluxes, together with streamflow yields, in extreme years under projected future climate scenarios were examined. The mean values of the top 10% highest and bottom 10% lowest annual streamflow and Dis-P fluxes for each scenario and the baseline level were compared with the all-years mean values, the results of which are illustrated in Figure 6. We could determine that the streamflow and Dis-P fluxes had similar trends; the changing trends under the two extreme conditions were similar to that of the mean value but that there would be more increases in streamflow and Dis-P fluxes in the original low-flux years but fewer increases in the original high-flux years. These results implied more Dis-P flux risks during low-flow year periods in the future, which should be of great concern for local water environmental management decision-makers facing concentration control.

4. Discussion

4.1. Estimations of Model Reliability

The model reliability of LARS-WG was generally reliable for this study area. There were no significant differences between the observed and modeled values for most weather items except TminM, which had 16.67% significantly different results in March and September. The errors in estimation of standard deviation were big and, with such an underestimated standard deviation for the modeled series, there would be potential risk in ignoring the appearance of extreme events in synthetic weather data. However, this issue was common in LARS-WG applications. Up to 33.33% significantly different results in PMV estimation were produced for eleven weather stations in Sudan and South Sudan where most weather items had significantly different results except for TminD [27]. Similarly, significantly different results for most weather items except for TminD and TmaxD at three arid sites in India were reported [44]. The LARS-WG model was valid in these former studies in generating future weather data and the model accuracy here should also be reliable within the same or even better level to them. In addition, the estimation of TminD was perfect (Table 2), which would be more important in this project as the ReNuMa model used daily weather data, not monthly weather data. Such groups of synthetic daily weather data should be qualified for supporting further scenario analysis.
For ReNuMa, the model capability represented minor flaws in the accuracy during the low-flow periods. There were several overestimations of streamflow in winter and spring in the verification period. These overestimations probably resulted from the overestimations of groundwater in these periods, which were mainly caused by excessive water storage in saturated zone in autumn. In addition, there were also continual overestimated results for Dis-P estimations during the low-flow periods in September 2013 to March 2014 and November 2014 to March 2015 in the verification periods. We could discuss this issue in two aspects. For the last several months in 2013 and 2014, the model values of monthly streamflow were also overestimated. The overestimation of streamflow yield would lead to the overestimation of Dis-P as the observed values of Dis-P were based on the observed values of streamflow that were lower than the estimated values. On the other hand, for the first several months in 2014 and 2015, the Dis-P values from septic systems in groundwater were higher than the values during other months, indicating potential overestimations of septic systems fluxes that resulted in the overprediction of Dis-P in these months. As no similar continual overestimations occurred in the calibration period, this issue was probably affected by the limitations of the modest complexity of the model algorithms and the available data size for the parameter calibrations. However, it is a common compromise way for balancing the cost and output to achieve acceptable model applications in a watershed with insufficient data availability but heavy demands for pollution source apportionment. In addition, the modeling results of ReNuMa in Dis-P estimations for the study watershed should still be reliable as none of the statistics of r2 and R2NS were lower than 0.75 for model verification, which was within the general precision for watershed model applications [47,48]. In addition, the current and future watershed Dis-P fluxes and source apportionments were all modeled based on the same parameter set and model framework, and the changes would be estimated relatively by comparing the different groups of model outputs to avoid disturbance from the model limitations. Generally, the ReNuMa model revealed a reliable ability to model the watershed hydrochemical processes of the study area, based on which the property of watershed Dis-P and its responses to future climate changes would be qualified for estimation by the linkage of LARS-WG results in decision-making support for regional management, as discussed in the following text.

4.2. Property of Phosphorus Apportionment and Potential Contribution to Management

Based on the outputs of the model applications, the non-point sources from farmland discharge through runoff and septic systems discharge through groundwater were detected as the current main contributing sources of Dis-P in studied watershed. The fluxes and source apportionments of Dis-P were variable in different months, in accordance with previous studies [34,46,47,49]. Furthermore, the changes in climate status would generally increase the Dis-P fluxes and convert the initial source apportionments of watershed Dis-P contributions that were critical for local pollution source management.
In addition, the modeling results showed that runoff would contribute more to the Dis-P flux under the projected future climate statuses, indicating that more practices concerning runoff pollution control should be implemented in future local watershed management. As the Dis-P loading through runoff mainly occurred during the high-flow period from May to September, various management measures concerning runoff control would be significant. Nutrient management was one of the most effective aspects in agricultural regions [50]. The improvement would be remarkable as the fertilizing behaviors were originally concentrated in the summer months in the study area. The optimizations of the amount of fertilizer and the use of manure for fertilization could decrease the pollution concentration in the runoff and potentially reduce the contribution from groundwater with lower concentrations in the infiltration water; such methods have been implemented in many areas for best management practice [51]. In addition, planting vegetated buffers was another potential effective measure. Buffers around farmland and along the riverside could hold back part of the pollution from runoff [52]. On the other hand, it would of course be beneficial to regional Dis-P pollution control to convert the treatment strategy of rural human living outputs. The initial septic systems could be replaced by piped collection systems for centralized sewage treatment as was successfully demonstrated in the downstream region of the Yangtze River [3,53].

5. Conclusions

This work estimated the responses of watershed hydrochemical processes to projected future climate scenarios. The following three main conclusions can be drawn from the results of the present study:
(1)
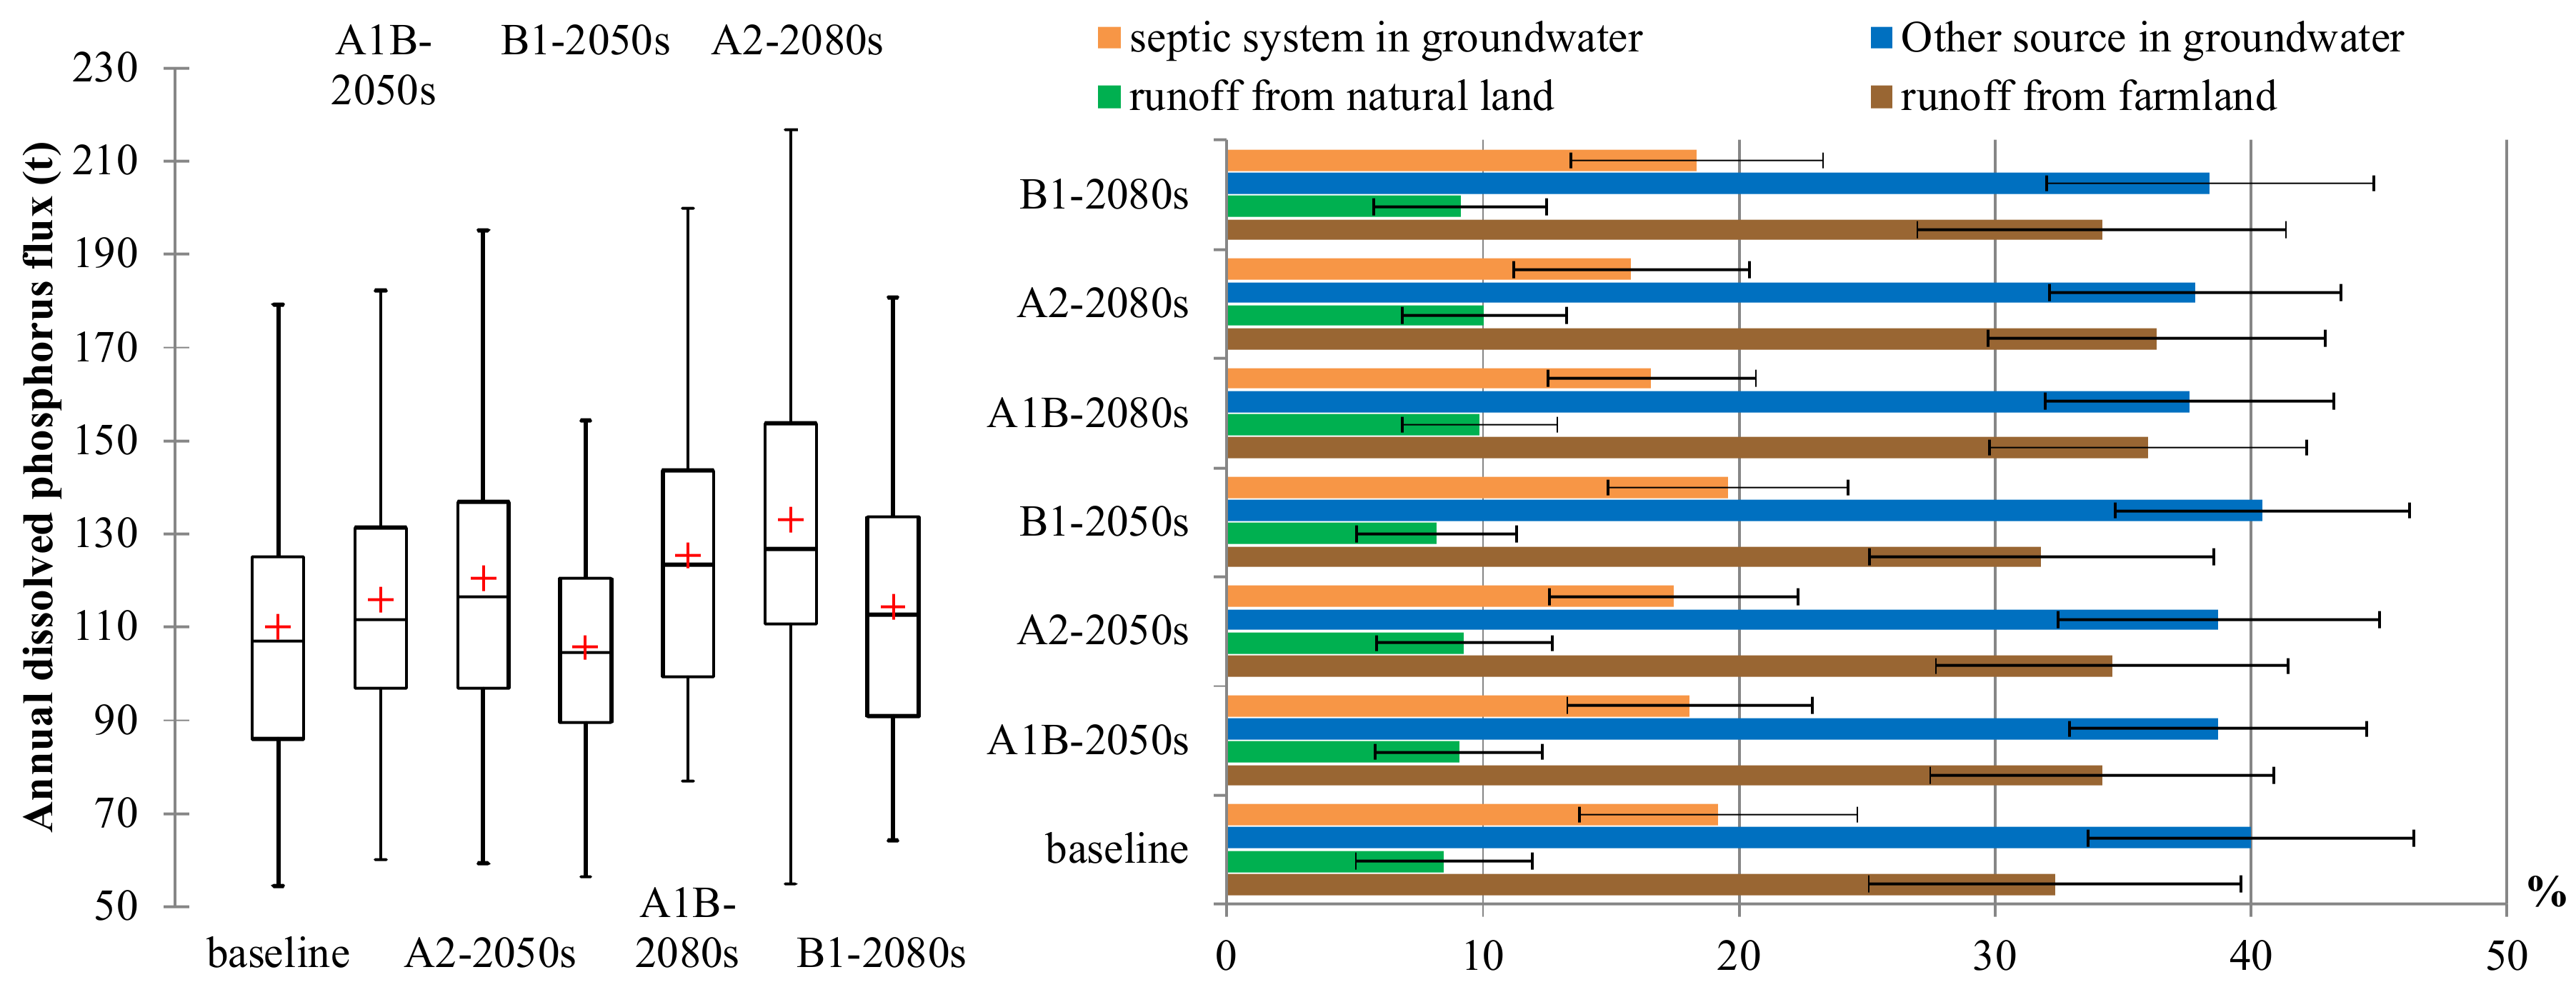
The current Dis-P fluxes of the study watershed came mainly from non-point sources involved in planting and rural living. The fluxes and source apportionments of Dis-P were variable in different months. High fluxes were mainly distributed from May to September with runoff as the primary contribution source. Although not remarkable on the annual scale, the contribution from septic systems was the primary source in December, January and February. The fluxes and source apportionments of Dis-P were sensitive to the regional weather and hydrological conditions, which were significant for response estimations.
(2)
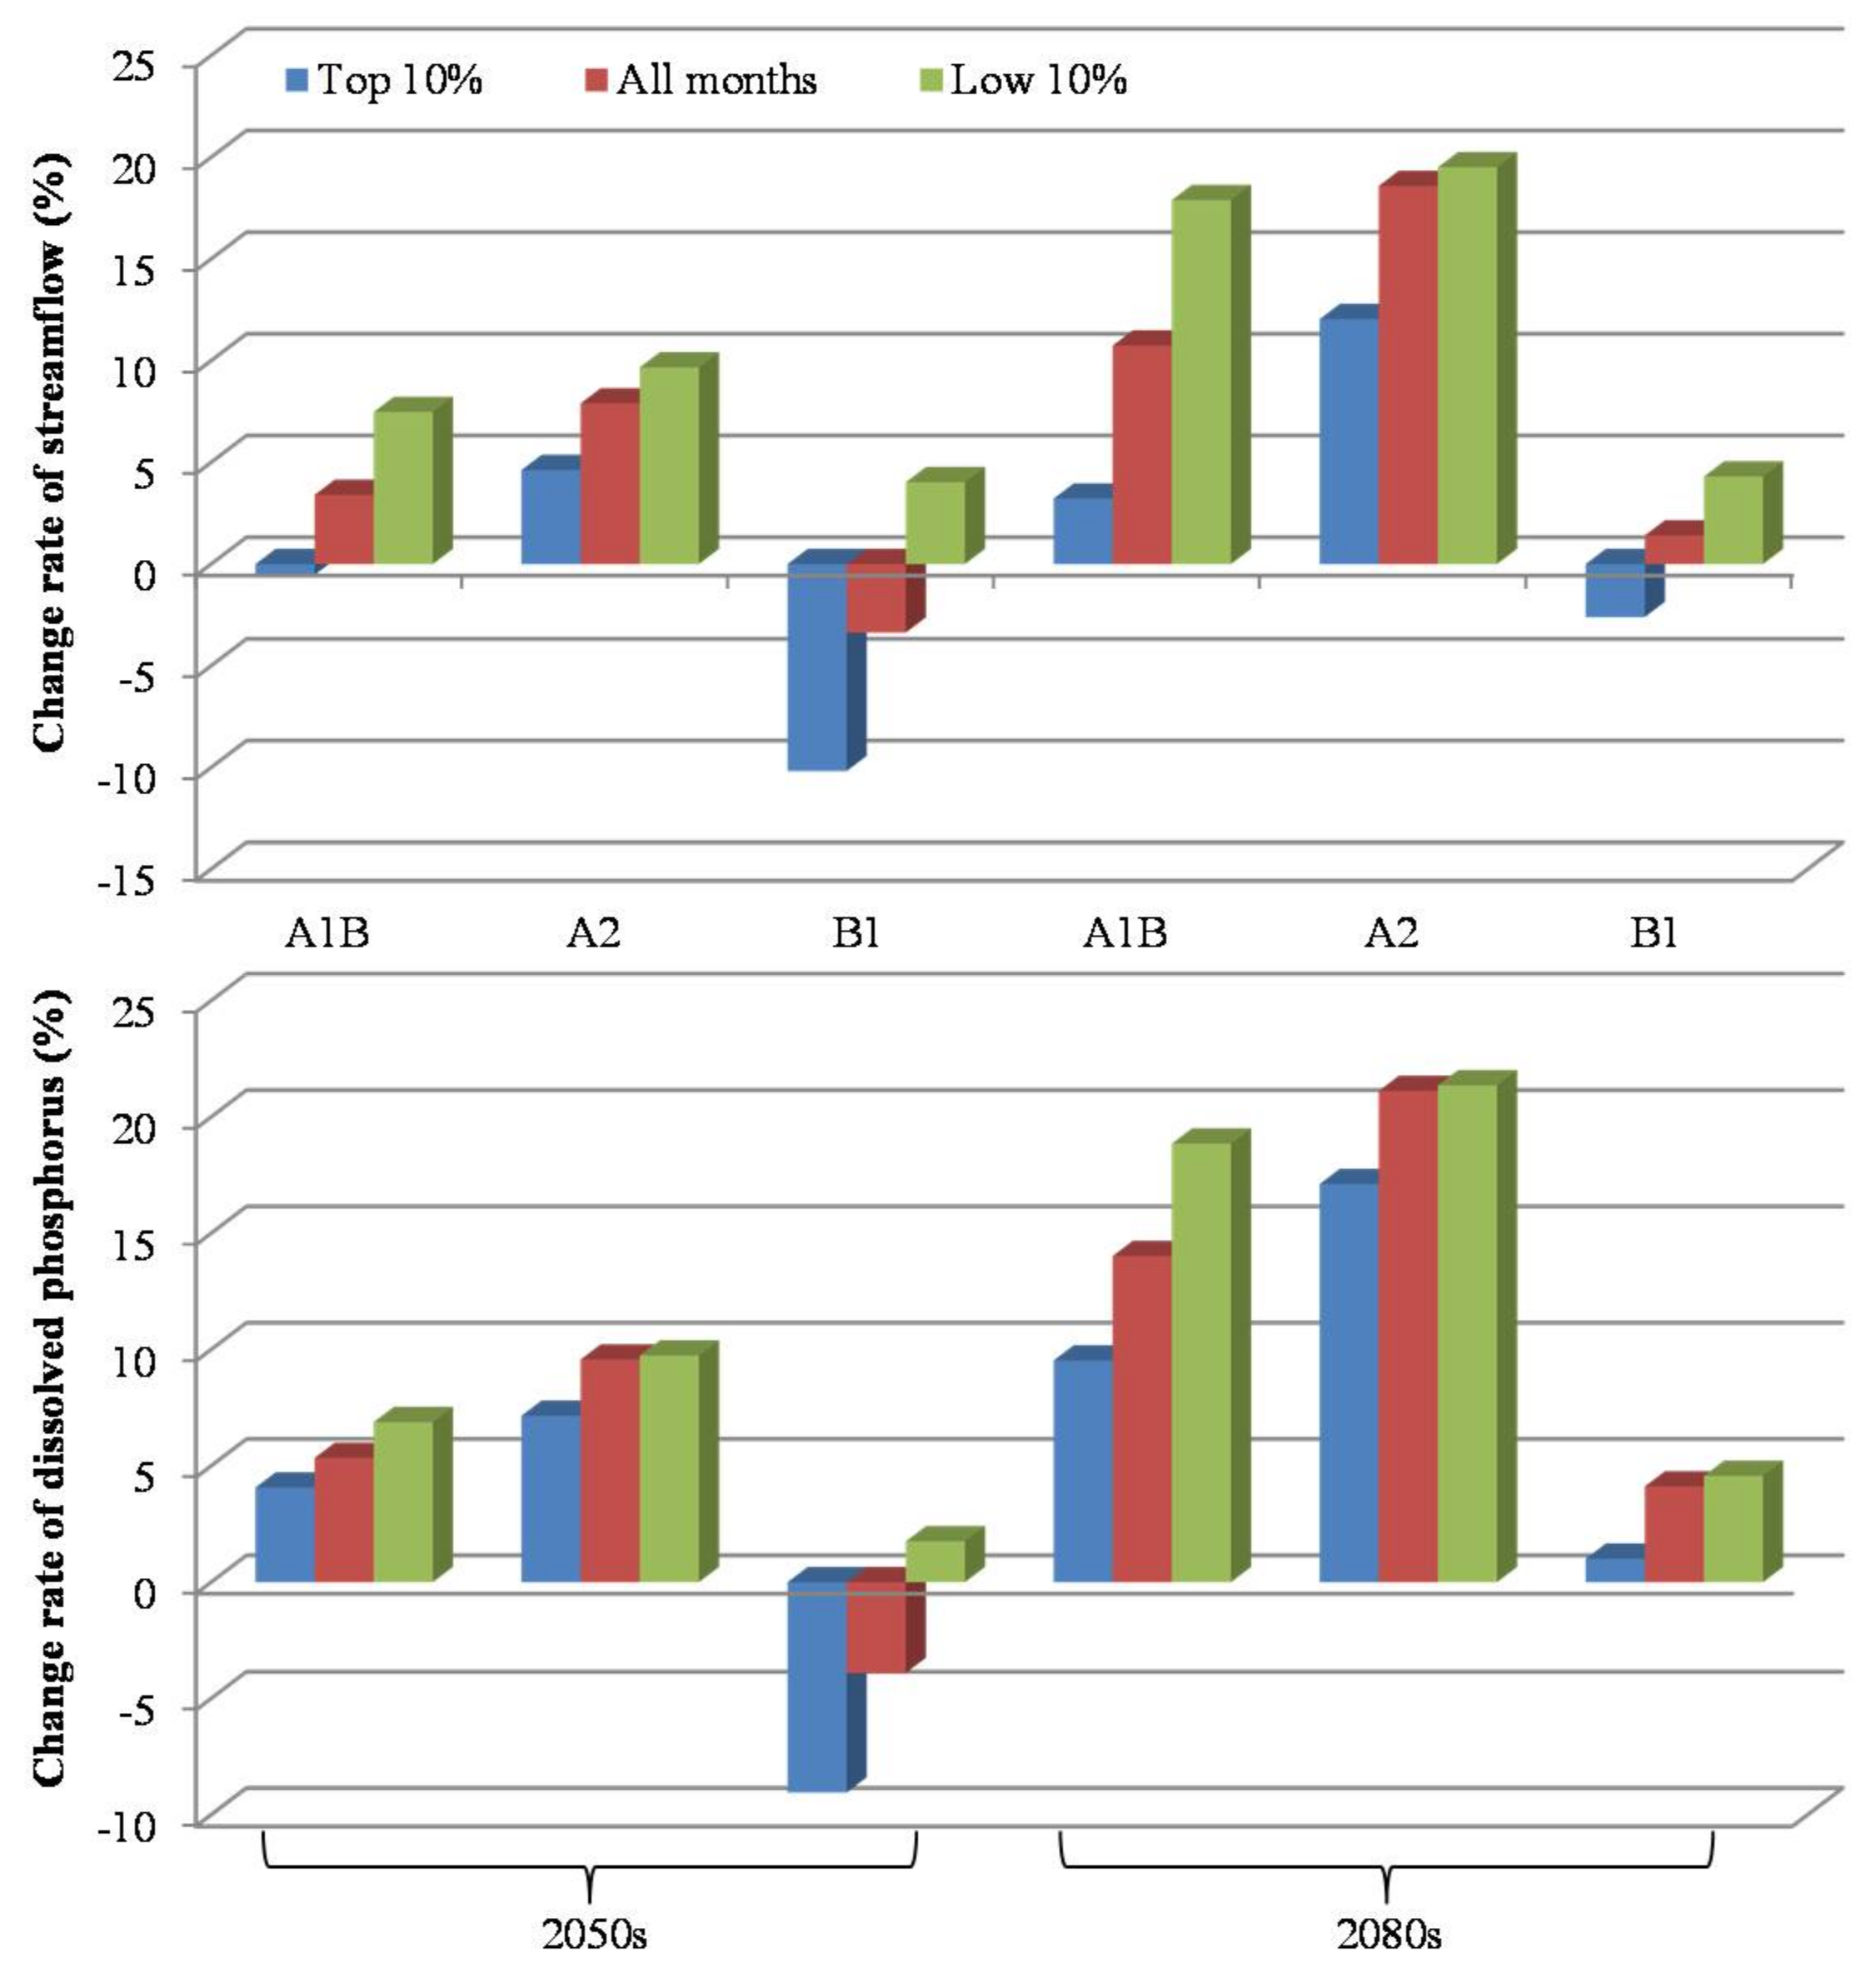
The hotter and wetter climate trends in the future would have generally positive impacts on the watershed Dis-P yields. A continuously increasing trend would occur for scenarios A1B and A2, and a V-type trend would occur for scenario B1 with more intensive increases in the annual Dis-P fluxes in extreme low-flux years. In addition, future climate changes would increase the proportion of the Dis-P contribution from runoff, leading to heavier demands for runoff pollution control in future local watershed management.
(3)
The coupled modeling application of LARS-WG and GWLF could achieve quantitative estimations of future watershed hydrological processes under changed climate statuses, and the linkage of model applications in this paper could be used as a reference for watershed management in similar areas.

Supplementary Materials

The model parameters of ReNuMa and LARS-WG applied in this paper are available in the Supplementary Materials (online at https://www.mdpi.com/2073-4441/10/4/468/s1) and could be used to replicate this work.

Acknowledgments

The authors would like to acknowledge the three anonymous reviewers. This work was supported by the Opening Fund of the Tianjin Key Laboratory of Water Resources and Environment (117-YF11700102), the Doctoral Fund of Tianjin Normal University (52XB1516), the Tianjin Education Committee (TD12-5037), and the National Natural Science Foundation of China (No. 41372373). The dataset was provided by the Climatic Data Center, National Meteorological Information Center, China Meteorological Administration (http://data.cma.cn), the Geospatial Data Cloud site, Computer Network Information Center, Chinese Academy of Sciences (http://www.gscloud.cn), the Loess Plateau Data Center, National Earth System Science Data Sharing Infrastructure, National Science & Technology Infrastructure of China (http://www.geodata.cn & http://loess.geodata.cn) and the Data Center for Resources and Environmental Sciences, Chinese Academy of Sciences (RESDC) (http://www.resdc.cn). The authors acknowledge the developer of the ReNuMa and LARS-WG models for free access to software and codes and for license agreements. Additionally, the authors would like to acknowledge Prof. Yuqiu Wang and his research team at Nankai University for their previous contributions concerning GWLF.

Author Contributions

This study was designed by Jian Sha and Zhong-Liang Wang. The data were prepared by Rui Lu, Yue Zhao, and Yun-Tao Shang. The model applications were operated by Jian Sha. The analyses of results were achieved by Jian Sha and Yue Zhao. The manuscript was written by Jian Sha and revised by Jian Sha and Xue Li. Rui Lu and Zhong-Liang Wang provided the financial support.

Conflicts of Interest

The authors declare no conflict of interest.

References

  1. Powers, S.M.; Bruulsema, T.W.; Burt, T.P.; Chan, N.I.; Elser, J.J.; Haygarth, P.M.; Howden, N.J.K.; Jarvie, H.P.; Lyu, Y.; Peterson, H.M.; et al. Long-term accumulation and transport of anthropogenic phosphorus in three river basins. Nat. Geosci. 2016, 9, 353. [Google Scholar] [CrossRef] [Green Version]
  2. Dai, Z.; Du, J.; Zhang, X.; Su, N.; Li, J. Variation of riverine material loads and environmental consequences on the Changjiang (Yangtze) Estuary in recent decades (1955−2008). Environ. Sci. Technol. 2011, 45, 223–227. [Google Scholar] [CrossRef] [PubMed]
  3. Tong, Y.; Bu, X.; Chen, J.; Zhou, F.; Chen, L.; Liu, M.; Tan, X.; Yu, T.; Zhang, W.; Mi, Z.; et al. Estimation of nutrient discharge from the Yangtze River to the East China Sea and the identification of nutrient sources. J. Hazard. Mater. 2017, 321, 728–736. [Google Scholar] [CrossRef] [PubMed]
  4. Ma, X.; Li, Y.; Li, B.; Han, W.; Liu, D.; Gan, X. Nitrogen and phosphorus losses by runoff erosion: Field data monitored under natural rainfall in Three Gorges Reservoir Area, China. Catena 2016, 147, 797–808. [Google Scholar] [CrossRef]
  5. Zhou, J.; Zhang, M.; Lu, P. The effect of dams on phosphorus in the middle and lower Yangtze river. Water Resour. Res. 2013, 49, 3659–3669. [Google Scholar] [CrossRef]
  6. Zhou, J.; Zhang, M.; Lin, B.; Lu, P. Lowland fluvial phosphorus altered by dams. Water Resour. Res. 2015, 51, 2211–2226. [Google Scholar] [CrossRef]
  7. Shen, Z.; Zhong, Y.; Huang, Q.; Chen, L. Identifying non-point source priority management areas in watersheds with multiple functional zones. Water Res. 2015, 68, 563–571. [Google Scholar] [CrossRef] [PubMed]
  8. Giri, S.; Nejadhashemi, A.P.; Woznicki, S.A. Evaluation of targeting methods for implementation of best management practices in the saginaw river watershed. J. Environ. Manag. 2012, 103, 24–40. [Google Scholar] [CrossRef] [PubMed]
  9. Shen, Z.; Chen, L.; Ding, X.; Hong, Q.; Liu, R. Long-term variation (1960–2003) and causal factors of non-point-source nitrogen and phosphorus in the upper reach of the Yangtze River. J. Hazard. Mater. 2013, 252, 45–56. [Google Scholar] [CrossRef] [PubMed]
  10. Ding, X.; Xue, Y.; Lin, M.; Liu, Y. Effects of precipitation and topography on total phosphorus loss from purple soil. Water 2017, 9, 315. [Google Scholar] [CrossRef]
  11. Daggupati, P.; Yen, H.; White, M.J.; Srinivasan, R.; Arnold, J.G.; Keitzer, C.S.; Sowa, S.P. Impact of model development, calibration and validation decisions on hydrological simulations in West Lake Erie Basin. Hydrol. Process. 2015, 29, 5307–5320. [Google Scholar] [CrossRef]
  12. Keitzer, S.C.; Ludsin, S.A.; Sowa, S.P.; Annis, G.; Arnold, J.G.; Daggupati, P.; Froehlich, A.M.; Herbert, M.E.; Johnson, M.-V.V.; Sasson, A.M.; et al. Thinking outside of the lake: Can controls on nutrient inputs into lake erie benefit stream conservation in its watershed? J. Great Lakes Res. 2016, 42, 1322–1331. [Google Scholar] [CrossRef]
  13. White, M.; Gambone, M.; Yen, H.; Daggupati, P.; Bieger, K.; Deb, D.; Arnold, J. Development of a cropland management dataset to support US SWAT assessments. J. Am. Water Resour. Assoc. 2016, 52, 269–274. [Google Scholar] [CrossRef]
  14. Gill, L.W.; Mockler, E.M. Modeling the pathways and attenuation of nutrients from domestic wastewater treatment systems at a catchment scale. Environ. Model. Softw. 2016, 84, 363–377. [Google Scholar] [CrossRef]
  15. Arnold, J.G.; Youssef, M.A.; Yen, H.; White, M.J.; Sheshukov, A.Y.; Sadeghi, A.M.; Moriasi, D.N.; Steiner, J.L.; Amatya, D.M.; Skaggs, R.W.; et al. Hydrological processes and model representation: Impact of soft data on calibration. Trans. ASABE 2015, 58, 1637–1660. [Google Scholar]
  16. Krysanova, V.; Srinivasan, R. Assessment of climate and land use change impacts with SWAT. Reg. Environ. Chang. 2015, 15, 431–434. [Google Scholar] [CrossRef]
  17. Hua, X.; Claudia, R. Agricultural nutrient loadings to the freshwater environment: The role of climate change and socioeconomic change. Environ. Res. Lett. 2017, 12, 104008. [Google Scholar]
  18. Hong, B.; Limburg, K.E.; Hall, M.H.; Mountrakis, G.; Groffman, P.M.; Hyde, K.; Luo, L.; Kelly, V.R.; Myers, S.J. An integrated monitoring/modeling framework for assessing human–nature interactions in urbanizing watersheds: Wappinger and Onondaga Creek watersheds, New York, USA. Environ. Model. Softw. 2012, 32, 1–15. [Google Scholar] [CrossRef]
  19. Haith, D.A.; Shoemaker, L.L. Generalized watershed loading functions for stream flow nutrients. J. Am. Water Resour. Assoc. 1987, 23, 471–478. [Google Scholar] [CrossRef]
  20. Sha, J.; Liu, M.; Wang, D.; Swaney, D.P.; Wang, Y. Application of the ReNuMa model in the Sha He river watershed: Tools for watershed environmental management. J. Environ. Manag. 2013, 124, 40–50. [Google Scholar] [CrossRef] [PubMed]
  21. Du, X.; Su, J.; Li, X.; Zhang, W. Modeling and evaluating of non-point source pollution in a semi-arid watershed: Implications for watershed management. CLEAN-Soil Air Water 2016, 44, 247–255. [Google Scholar] [CrossRef]
  22. Sharifi, A.; Yen, H.; Boomer, K.M.B.; Kalin, L.; Li, X.; Weller, D.E. Using multiple watershed models to assess the water quality impacts of alternate land development scenarios for a small community. Catena 2017, 150, 87–99. [Google Scholar] [CrossRef]
  23. Wu, J.; Franzén, D.; Malmström, M.E. Nutrient flows following changes in source strengths, land use and climate in an urban catchment, Råcksta Träsk in Stockholm, Sweden. Ecol. Model. 2016, 338, 69–77. [Google Scholar] [CrossRef]
  24. Ayele, H.S.; Li, M.H.; Tung, C.P.; Liu, T.M. Assessing Climate Change Impact on Gilgel Abbay and Gumara Watershed Hydrology, the Upper Blue Nile Basin, Ethiopia. Terr. Atmos. Ocean. Sci. 2016, 27, 1005–1018. [Google Scholar] [CrossRef]
  25. Wang, Y.; Bian, J.; Zhao, Y.; Tang, J.; Jia, Z. Assessment of future climate change impacts on nonpoint source pollution in snowmelt period for a cold area using SWAT. Sci. Rep. 2018, 8, 2402. [Google Scholar] [CrossRef] [PubMed]
  26. Hanel, M.; Kožín, R.; Heřmanovský, M.; Roub, R. An R package for assessment of statistical downscaling methods for hydrological climate change impact studies. Environ. Model. Softw. 2017, 95, 22–28. [Google Scholar] [CrossRef]
  27. Chen, H.; Guo, J.; Zhang, Z.; Xu, C.-Y. Prediction of temperature and precipitation in Sudan and South Sudan by using LARS-WG in future. Theor. Appl. Climatol. 2013, 113, 363–375. [Google Scholar] [CrossRef]
  28. Naderi, M.; Raeisi, E. Climate change in a region with altitude differences and with precipitation from various sources, South-Central Iran. Theor. Appl. Climatol. 2016, 124, 529–540. [Google Scholar] [CrossRef]
  29. Mahat, V.; Anderson, A. Impacts of climate and catastrophic forest changes on streamflow and water balance in a mountainous headwater stream in Southern Alberta. Hydrol. Earth Syst. Sci. 2013, 17, 4941–4956. [Google Scholar] [CrossRef]
  30. Le, T.; Sharif, H. Modeling the projected changes of river flow in central vietnam under different climate change scenarios. Water 2015, 7, 3579–3598. [Google Scholar] [CrossRef]
  31. Jayakody, P.; Parajuli, P.B.; Cathcart, T.P. Impacts of climate variability on water quality with best management practices in sub-tropical climate of USA. Hydrol. Process. 2014, 28, 5776–5790. [Google Scholar] [CrossRef]
  32. Yang, X.; Warren, R.; He, Y.; Ye, J.; Li, Q.; Wang, G. Impacts of climate change on tn load and its control in a river basin with complex pollution sources. Sci. Total Environ. 2018, 615, 1155–1163. [Google Scholar] [CrossRef]
  33. Qin, X.S.; Lu, Y. Study of climate change impact on flood frequencies: A combined weather generator and hydrological modeling approach. J. Hydrometeorol. 2014, 15, 1205–1219. [Google Scholar] [CrossRef]
  34. Li, Z.L.; Liu, M.H.; Zhao, Y.; Liang, T.; Sha, J.; Wang, Y.Q. Application of regional nutrient management model in tunxi catchment: In support of the trans-boundary eco-compensation in Eastern China. Clean-Soil Air Water 2014, 42, 1729–1739. [Google Scholar] [CrossRef]
  35. Hu, M.; Liu, Y.; Wang, J.; Dahlgren, R.A.; Chen, D. A modification of the regional nutrient management model (ReNuMa) to identify long-term changes in riverine nitrogen sources. J. Hydrol. 2018, 561, 31–42. [Google Scholar] [CrossRef]
  36. Schneiderman, E.M.; Pierson, D.C.; Lounsbury, D.G.; Zion, M.S. Modeling the hydrochemistry of the cannonsville watershed with generalized watershed loading functions (GWLF). J. Am. Water Resour. Assoc. 2002, 38, 1323–1347. [Google Scholar] [CrossRef]
  37. Sha, J.; Swaney, D.P.; Hong, B.; Wang, J.; Wang, Y.; Wang, Z.-L. Estimation of watershed hydrologic processes in arid conditions with a modified watershed model. J. Hydrol. 2014, 519, 3550–3556. [Google Scholar] [CrossRef]
  38. Rouholahnejad Freund, E.; Abbaspour, K.; Lehmann, A. Water Resources of the Black Sea Catchment under Future Climate and Landuse Change Projections. Water 2017, 9, 598. [Google Scholar] [CrossRef]
  39. Zhai, M.; Lin, Q.; Huang, G.; Zhu, L.; An, K.; Li, G.; Huang, Y. Adaptation of Cascade Hydropower Station Scheduling on a Headwater Stream of the Yangtze River under Changing Climate Conditions. Water 2017, 9, 293. [Google Scholar] [CrossRef]
  40. Mahmood, R.; Jia, S. Assessment of impacts of climate change on the water resources of the transboundary Jhelum River basin of Pakistan and India. Water 2016, 8, 246. [Google Scholar] [CrossRef]
  41. Duan, J.G.; Bai, Y.; Dominguez, F.; Rivera, E.; Meixner, T. Framework for incorporating climate change on flood magnitude and frequency analysis in the upper Santa Cruz River. J. Hydrol. 2017, 549, 194–207. [Google Scholar] [CrossRef]
  42. Kumar, D.; Arya, D.S.; Murumkar, A.R.; Rahman, M.M. Impact of climate change on rainfall in northwestern Bangladesh using multi-GCM ensembles. Int. J. Climatol. 2014, 34, 1395–1404. [Google Scholar] [CrossRef]
  43. Reddy, K.S.; Kumar, M.; Maruthi, V.; Umesha, B.; Vijayalaxmi; Rao, C. Climate change analysis in southern Telangana region, Andhra Pradesh using LARS-WG model. Curr. Sci. 2014, 107, 54–62. [Google Scholar]
  44. Sarkar, J.; Chicholikar, J.R.; Rathore, L.S. Predicting future changes in temperature and precipitation in arid climate of Kutch, Gujarat: Analyses based on LARS-WG model. Curr. Sci. 2015, 109, 2084–2093. [Google Scholar] [CrossRef]
  45. Wu, Y.; Shi, X.; Li, C.; Zhao, S.; Pen, F.; Green, T. Simulation of hydrology and nutrient transport in the Hetao Irrigation District, Inner Mongolia, China. Water 2017, 9, 169. [Google Scholar] [CrossRef]
  46. Qi, Z.; Kang, G.; Chu, C.; Qiu, Y.; Xu, Z.; Wang, Y. Comparison of SWAT and GWLF Model Simulation Performance in Humid South and Semi-Arid North of China. Water 2017, 9, 567. [Google Scholar] [CrossRef]
  47. Du, X.; Li, X.; Zhang, W.; Wang, H. Variations in source apportionments of nutrient load among seasons and hydrological years in a semi-arid watershed: GWLF model results. Environ. Sci. Pollut. Res. 2014, 21, 6506–6515. [Google Scholar] [CrossRef] [PubMed]
  48. Lee, T.; Wang, X.; White, M.; Tuppad, P.; Srinivasan, R.; Narasimhan, B.; Andrews, D. Modeling Water-Quality Loads to the Reservoirs of the Upper Trinity River Basin, Texas, USA. Water 2015, 7, 5689–5704. [Google Scholar] [CrossRef]
  49. Sha, J.; Li, Z.; Swaney, D.P.; Hong, B.; Wang, W.; Wang, Y. Application of a Bayesian watershed model linking multivariate statistical analysis to support watershed-scale nitrogen management in China. Water Resour. Manag. 2014, 28, 3681–3695. [Google Scholar] [CrossRef]
  50. Ross, J.A.; Herbert, M.E.; Sowa, S.P.; Frankenberger, J.R.; King, K.W.; Christopher, S.F.; Tank, J.L.; Arnold, J.G.; White, M.J.; Yen, H. A synthesis and comparative evaluation of factors influencing the effectiveness of drainage water management. Agric. Water Manag. 2016, 178, 366–376. [Google Scholar] [CrossRef]
  51. Yen, H.; White, M.J.; Arnold, J.G.; Keitzer, S.C.; Johnson, M.-V.V.; Atwood, J.D.; Daggupati, P.; Herbert, M.E.; Sowa, S.P.; Ludsin, S.A.; et al. Western Lake Erie Basin: Soft-data-constrained, NHDPlus resolution watershed modeling and exploration of applicable conservation scenarios. Sci. Total Environ. 2016, 569–570, 1265–1281. [Google Scholar] [CrossRef] [PubMed]
  52. Scavia, D.; Kalcic, M.; Muenich, R.L.; Read, J.; Aloysius, N.; Bertani, I.; Boles, C.; Confesor, R.; DePinto, J.; Gildow, M.; et al. Multiple models guide strategies for agricultural nutrient reductions. Front. Ecol. Environ. 2017, 15, 126–132. [Google Scholar] [CrossRef]
  53. Tong, Y.; Zhang, W.; Wang, X.; Couture, R.-M.; Larssen, T.; Zhao, Y.; Li, J.; Liang, H.; Liu, X.; Bu, X.; et al. Decline in Chinese lake phosphorus concentration accompanied by shift in sources since 2006. Nat. Geosci. 2017, 10, 507–511. [Google Scholar] [CrossRef]
Figure 1. Geographical location and spatial attributes of the study area.
Water 10 00468 g001
Figure 2. Future precipitation and temperature estimates from the LARS-WG model.
Water 10 00468 g002
Figure 3. Comparison of observed and modeled monthly streamflows and Dis-P fluxes during the research period. The error bars were the uncertainties in model outputs.
Water 10 00468 g003
Figure 4. Fluxes and source apportionments of dissolved phosphorus in the study area.
Water 10 00468 g004
Figure 5. The responses of watershed dissolved phosphorus flux and source apportionment to future climate changes.
Water 10 00468 g005
Figure 6. The changes in the Dis-P fluxes in extreme years under projected future climate scenarios.
Water 10 00468 g006
Table 1. Summary of original input data sources used in this study.
NameSourceResolutionRemark
Digital Elevation ModelGeospatial Data Cloud site, Computer Network Information Center, Chinese Academy of Sciences. (http://www.gscloud.cn)90 m × 90 m rasterSRTM 3
Land Use Cover MapsData Center for Resources and Environmental Sciences, Chinese Academy of Sciences (RESDC) (http://www.resdc.cn)1 km raster with percentages for each land use type2010
Weather DataClimatic Data Center, National Meteorological Information Center, China Meteorological Administration (http://data.cma.cn)Daily temperature and precipitation1955–2015
Hydrological RecordsAnnual Hydrological Report P. R. China (National Library of China)Monthly streamflow2009–2015
Dissolved Phosphorus RecordsChina National Environmental Monitoring CentreMonthly concentration2011–2015
Table 2. Results of the statistical tests comparing the observed and synthetic data generated by the Long Ashton Research Station Weather Generator (LARS-WG), with the number of tests revealing significantly different results at the 5% significance level.
ItemsTotal TestsNumber of Significant DifferencesPercentage of Significant Differences (%)Whether a Month Had Significantly Different Results
Jan.Feb.Mar.Apr.MayJuneJulyAug.Sep.Oct.Nov.Dec.
WDSeries 1800.0YYYYYYYYYYYY
PrecD 21200.0YYYYYYYYYYYY
PMM 31200.0YYYYYYYYYYYY
PMV 41200.0YYYYYYYYYYYY
TminD 51200.0YYYYYYYYYYYY
TminM 612216.67YYNYYYYYNYYY
TmaxD 71200.0YYYYYYYYYYYY
TmaxM 81200.0YYYYYYYYYYYY
Notes: 1 Indicates seasonal wet/dry series distributions; 2 indicates daily precipitation distributions; 3 indicates monthly means of precipitation; 4 indicates monthly variances of precipitation; 5 indicates daily minimum temperature distributions; 6 indicates monthly mean of daily minimum temperatures; 7 indicates daily maximum temperature distributions; 8 indicates monthly means of daily maximum temperature.

