Climate Change Impacts on Nutrient Losses of Two Watersheds in the Great Lakes Region


1
Department of Agricultural & Biological Engineering, Purdue University, 225 South University Street, West Lafayette, IN 47907, USA
2
Key Laboratory of Water Cycle and Related Land Surface Processes, Institute of Geographic Sciences and Natural Resources Research, Chinese Academy of Sciences, Beijing 100101, China
3
National Soil Erosion Research Laboratory, USDA-Agricultural Research Service, West Lafayette, IN 47907, USA
*
Authors to whom correspondence should be addressed.
Water 2018, 10(4), 442; https://doi.org/10.3390/w10040442
Submission received: 5 January 2018
/
Revised: 26 March 2018
/
Accepted: 27 March 2018
/
Published: 8 April 2018
(This article belongs to the Section Hydrology)
Abstract
:Non-point sources (NPS) of agricultural chemical pollution are one major reason for the water quality degradation of the Great Lakes, which impacts millions of residents in the states and provinces that are bordering them. Future climate change will further impact water quality in both direct and indirect ways by influencing the hydrological cycle and processes of nutrient transportation and transformation, but studies are still rare. This study focuses on quantifying the impacts of climate change on nutrient (Nitrogen and Phosphorus) losses from the two small watersheds (Walworth watershed and Green Lake watershed) within the Great Lakes region. Analysis focused on changes through this century (comparing the nutrient loss prediction of three future periods from 2015 to 2099 with 30 years for each period against the historical nutrient estimation data from 1985 to 2008). The effects on total phosphorus and nitrate-nitrogen losses due to changes in precipitation quantity, intensity, and frequency, as well as air temperature, are evaluated for the two small watersheds, under three special report emission scenarios (SRES A2, A1B, B1). The newly developed Water Erosion Prediction Project-Water Quality (WEPP-WQ) model is utilized to simulate nutrient losses with downscaled and bias corrected future climate forcing from two General Circulation Models (GFDL, HadCM3). For each watershed, the observed runoff and nutrient loads are used to calibrate and validate the model before the application of the WEPP-WQ model to examine potential impacts from future climate change. Total phosphorus loss is projected to increase by 28% to 89% for the Green Lake watershed and 25% to 108% for the Walworth watershed mainly due to the combined effects of increase of precipitation quantity, extreme storm events in intensity and frequency, and air temperature. Nitrate-nitrogen losses are projected to increase by 1.1% to 38% for the Green Lake watershed and 8% to 95% for the Walworth watershed with the different major influencing factors in each future periods.
1. Introduction
Water quality of the Great Lakes is a critical concern of millions of residents that are living in the surrounding states, as the algal blooms and disease outbreaks have caused the water quality degradation of the five lakes with different degrees. Due to the mitigation of the point source pollution that is led by the enforcement of total maximum daily load (TMDL) levels, non-point sources (NPS), like agricultural systems have become the primary contributors of pollutants, mainly through the application of fertilizers in excess of crop demands [1,2,3]. Particularly, the record breaking algal blooms that were experienced by Lake Erie in 2011 are primarily due to the eutrophication that was caused by poor fertilizer management practices and extreme precipitation events [2].
The Great Lakes region is projected to experience an increase up to 20% in precipitation and air temperature is projected to increase by 2.2 °C to 5.8 °C by the end of 21st century. Precipitation will increase in both winter and spring, and while summer precipitation is projected to stay or decrease across the region with an increase in the frequency of heavy storm events by the end of this century [4,5,6]. Annual streamflow is projected to increase in all rivers of the Michigan Lake in the century period from 2070 to 2099, with a significant increase in winter and spring flows, and a decrease in flows of summer seasons [7]. Future cold season process changes mainly in the northern part of the Great Lakes region with increased freeze-thaw (FT cycles, the number of times soil temperature changes between frozen and thawed states in a year) , decreased soil frost days and frost soil depth, and decreased snow melt equivalent, however, the increased number of freeze-thaw cycles in the south-central Wisconsin is detected by up to three cycles together with the duration of soil frost decreased by between two weeks and nearly two months during 2070–2099, with respect to the base period from 1977 to 2006 [4]. Increased precipitation elevates the soil loss risks, as O’Neal et al. [8] find soil loss is projected to increase of 33 to 274% in the middle century period in 10 of 11 regions in the Midwestern United States (U.S.) based on the runoff increase by 10 to 310%, and the increased precipitation and decreasing canopy cover from temperature-stressed maize are identified as important controlling factors. The increased flow and soil loss enhance the transport of soluble Nitrogen and Phosphorus and the flushness of organic matters [8,9,10]. Increased air temperature contributes to the increased streamflow and soil loss with more snow falling in the rain format in winter, increased numbers of FT cycles, and decreased soil frost days [5,11]. More runoff is generated in winter months of the Maumee River watershed in the Great Lakes region around 25 to 125 m3 s−1, due to the winter precipitation increase with decreased snowfall [12]. The increased number of FT cycles increases soil loss risks through elevating the soil erodibility by weakening the original soil structure, based on which the prediction of soil loss increase in south-central Wisconsin is predicted by Sinha and Cherkauer [13]. Observations of the soil frost contribution to the soil erosion have been made in the northwestern U.S., and much of the total annual runoff and soil loss from agricultural land occurs as a result of rain and snowmelt on frozen and thawing soil [14,15]. Increased air temperature elevates the rate of decomposition, mineralization, and nitrification processes through activating microbial activities, as more nitrates and soluble phosphorus are found to be available to increase the concentration in surface runoff by Gu and Riley [10] through analyzing the increase in annual total phosphorus loads that are attributable to climate change greater than that from population or land use change. Therefore, future climate variability poses a significant threat to degrade the water quality in the Great Lakes region by increasing nutrient losses, as it influences the nutrient transportation processes by affecting the hydrological cycling characteristics, soil loss, and the nutrient transformation process among different pools in soil layers [2,7,16,17].
Many studies have been conducted about the future changes of non-point source pollutant losses under the climate change impacts that are aiming at providing guidance to the future nutrient loss mitigation strategies within the Great Lakes region [1,2,7,16,17,18]. Verma et al. [12] studies the impacts of climate change on flow, sediment, and nutrient losses of a Maumee River watershed within the Great Lakes region under A1B scenario, and found that by the middle of this century annual streamflow, sediments loading, total phosphorus (TP), and nitrate-nitrogen (NO3-N) will reduce by 8.5%, 10.4%, 8.5%, and 9.9%, respectively. This region is projected to experience precipitation decreases by 3.2% and a 2.9 °C rise in air temperature. Streamflow, sediments, TP, and NO3-N decrease in the summer and fall as a result of decreased precipitation, while they increase in spring and winter due to the precipitation increase. Cousino et al. [16] obtain the same finding in both the middle and the late century period of the same watershed. Michalak et al. [2] study the reasons for the Erie Lake’s algal bloom in 2011 and find that the increase of precipitation extreme events in intensity and frequency in 2046–2065 and 2080–2099 relative to the base period 1986–2005 in the western Lake Erie basin will increase the dissolved reactive Phosphorus yields and enable an algal bloom 2011 to be the future eutrophication harbinger. Although this paper is concerned with the Great Lakes region, the results may be applicable to other cold climate regions with similar hydro-meteorological conditions. The slightest of the altercations of climatic variables, especially temperature, on such snow-dominated watersheds will have profound effects, such as earlier spring freshet [19,20], favorable vegetation growth due to less temperature stress on the plants, and less surface runoff in summer [21,22]. Outside the Great Lakes region, Shrestha and Wang [23] study the climate change impacts on soil loss of the Athabasca River Basin (ARB), Canada, and conclude that the soil loss of ARB regions dominated by summer annual sediment yield decreases due to the summer precipitation decrease. Soil loss of ARB regions with the spring dominated annual sediment yield budget increases due to the spring precipitation increase and early freshet. Marcinkowski et al. [18] find that the monthly changes of TN and NO3-N losses have a strong positive relationship with runoff and achieve the highest values in winter and lowest in summer of two watersheds in Poland based on the observational dataset analysis as a result of the nitrogen transportation physics within the catchment like high mobility of nitrate. Annual TN will increase over four seasons with the highest increase in winter season in the far future due to the increase of the percolation and baseflow in winter as a result of the increase in the precipitation and air temperature. Annual TP increases in the two watersheds with an increase in summers and decrease in winter of one catchment and increase in winter of the other catchment. TP loading decreases in spring due to the substantial reduction of snowmelt and surface runoff in spite of the increased precipitation and baseflow [18].
Though the future climate change impacts on the nutrient losses have been studied in some watersheds of the Great Lakes region, many watersheds in the Great Lakes region are still blind about the future nutrient losses changing trends under climate change. Besides, existing studies of the Great Lakes region or outside of the Great Lake region are merely focused on the changes of precipitation quantity and its impacts on nutrient losses, and have ignored the identification of the dominant influencing factors in the future periods, much less the consideration of the quantified extreme storm events in intensity and frequency in the analysis of nutrient loss changes. These disadvantages limit their services in guiding the selection and conduction of the best management practices (BMPs) for the pollutant mitigation of the individual watersheds to adopt the climate change. Therefore, this study selects two watersheds in the Great Lakes region that are based on the availability of the observational datasets of nutrient losses, and investigates the impacts of future precipitation and air temperature on the losses of TP and NO3-N at annual and seasonal time steps with the involvement of quantified extreme storm events and FT cycles, and identified the major influencing factor in each future period under three climate change scenarios of three future periods.
2. Methods
2.1. Model Introduction
The Water Erosion Prediction Project-Water Quality (WEPP-WQ) model is a coupled water quality model to estimate the nutrient losses of hillslopes. Details of the coupled model can be found in Wang et al. [24]. For clarity, a brief introduction about the model is provided here. The WEPP model is a soil erosion model for simulating soil loss processes at hillslope scale [25,26,27]. The water quality module is extracted from the Soil and Water Assessment Tool (SWAT) [28]. It describes the transportation processes of nitrogen and phosphorus with overland flow and infiltrated water, the transformation processes between different status pools, and the nutrient uptake processes by crops, which is a major pathway leaving the agricultural system for both the nitrogen and phosphorus to leave the agricultural system. The WEPP-WQ model is an intensively coupled model with the WEPP model providing hydrological inputs and sediments to the water quality model. The water quality model returns nutrient stresses to the WEPP model and estimates nutrient concentration in surface runoff, infiltrated flow, tile drainage, and base flow.
The WEPP-WQ model is applied to estimate the total phosphorus and NO3-N losses of the watershed through estimating nutrient losses of each hill slope within the watershed. It is time consuming to run the WEPP-WQ model through all of the hillslopes within the watershed, so a stratified random sampling method [29] is applied to select the representative hillslopes and land covers within a watershed during the simulation process. Hillslopes of 30 m length are extracted from 30 × 30 m digital elevation map (DEM) and the slopes are categorized into five groups that are based on the distribution of hillslope gradients. The representative hillslopes are selected for each group based on the proportion of watershed hillslope taken by each group, and then WEPP-WQ model estimate the nutrient losses of each group by running over the representative hillslopes in that group. Finally, the sum of the nutrient losses is calculated based on the weight of each group.
where N is the nutrient losses of the watershed; n is the maximum number of hillslope groups; e is the weight obtained through dividing the number of hillslopes within the watershed by the number of hillslopes of each group; and, is the nutrient losses of each group.
2.2. Study Area
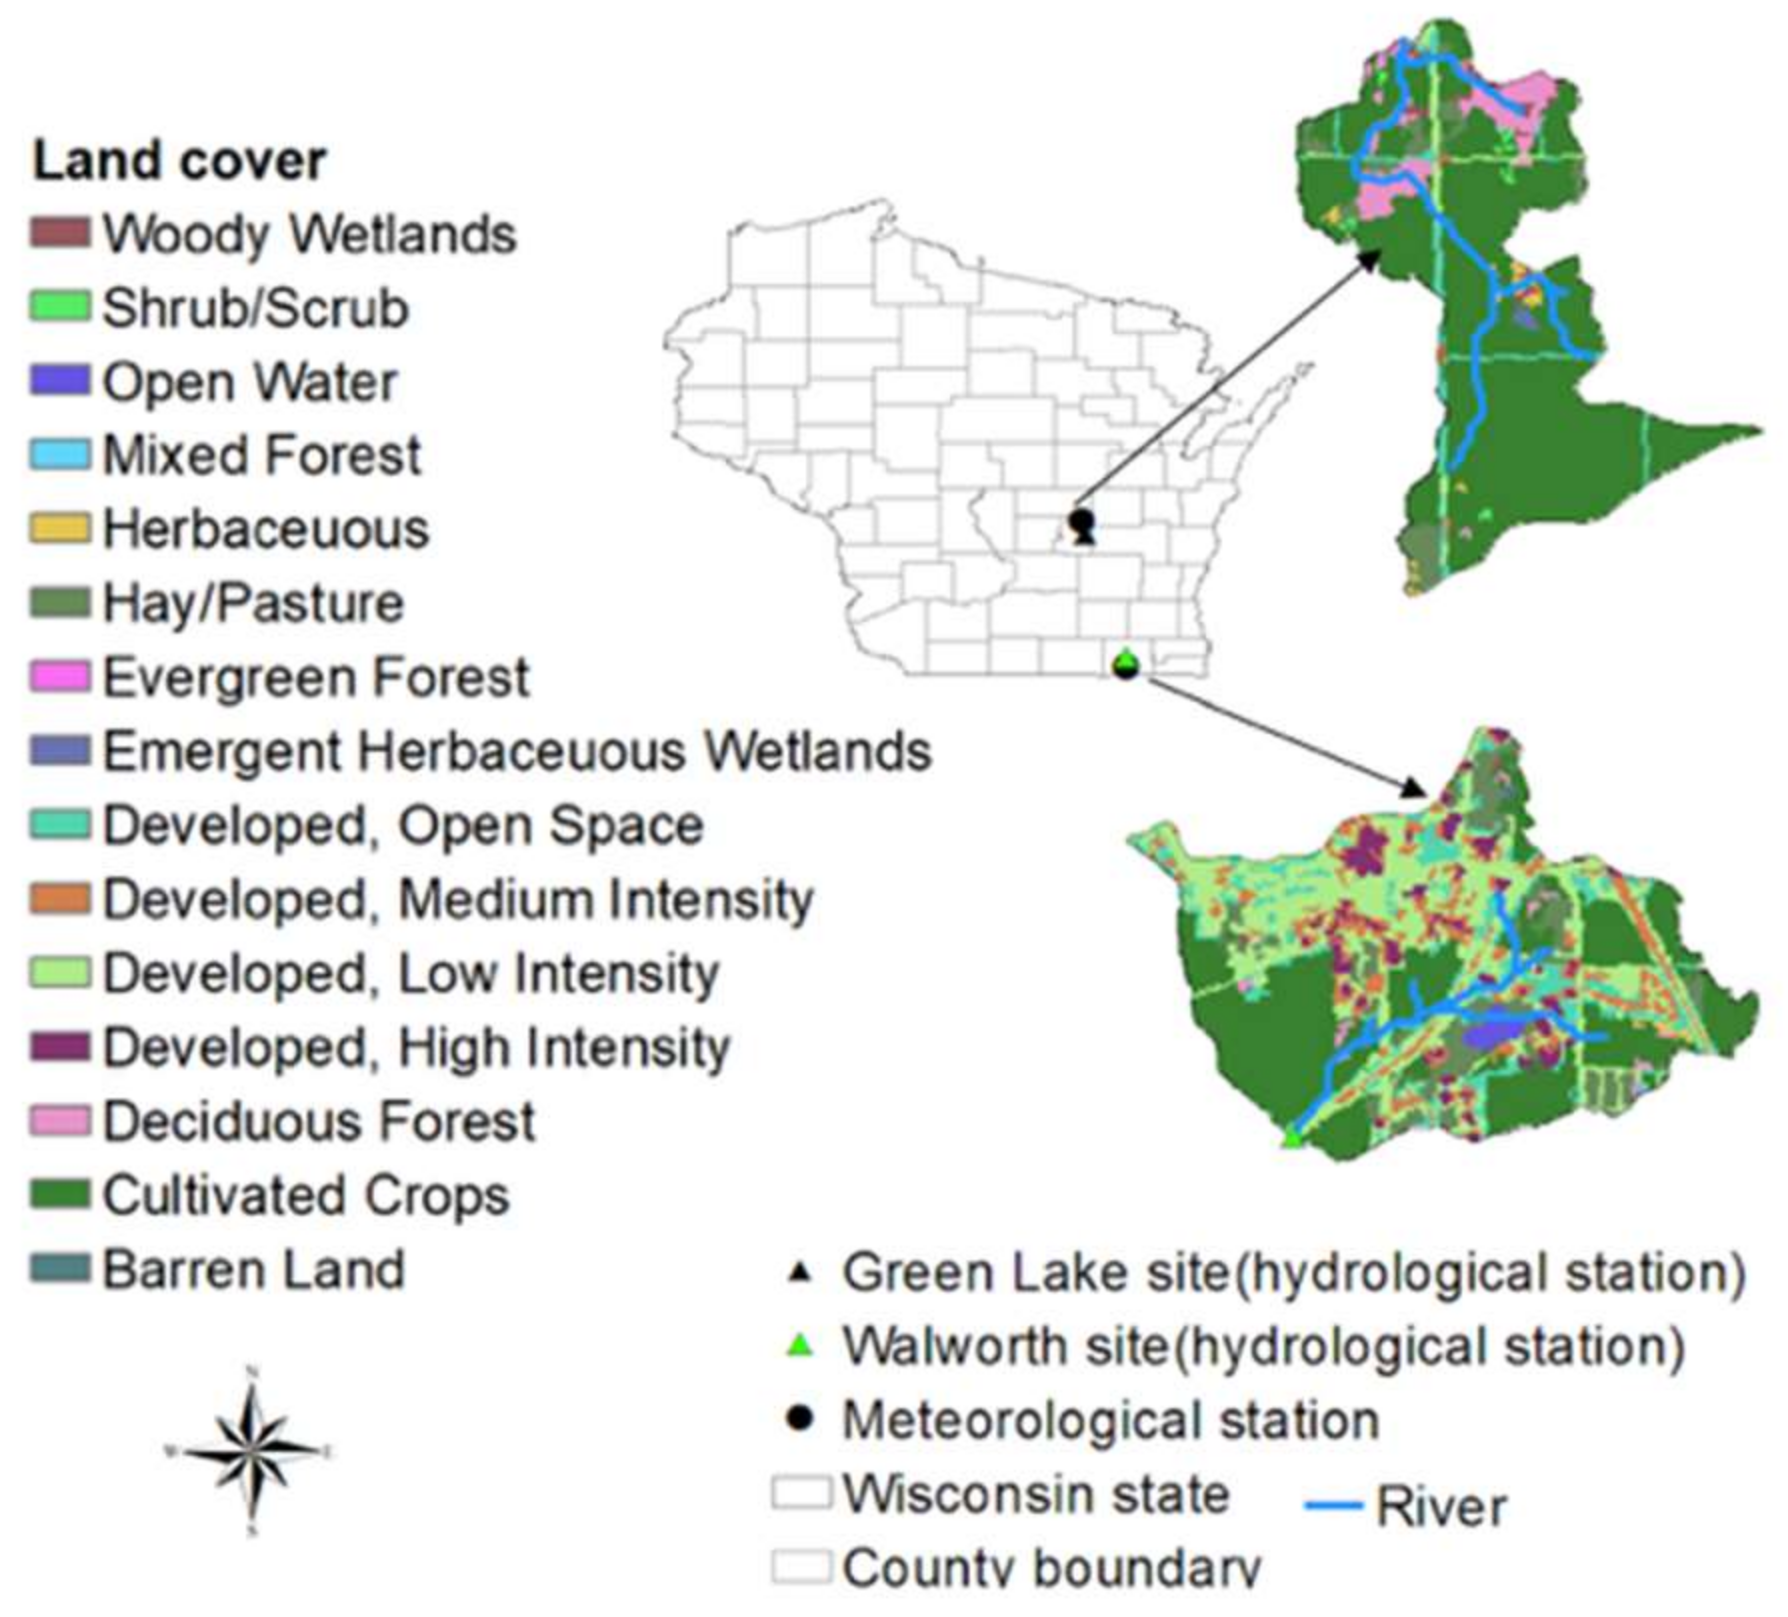
There are few sites with long-term observations of phosphorus and nitrogen, particularly, nitrogen loss. Based on the availability of observed phosphorus loading at an annual time step for over 15 years, two sites of Wisconsin, U.S. are identified for model utilization. The drainage areas for the two sites are delineated with ArcGIS 10.0 [30] and the watersheds are referred to as the Green Lake watershed and the Walworth watershed (Figure 1). The Green Lake watershed (LAT: 43°48′58″, LON: 88°55′42″) is located in the Big Green Creek watershed (HUC 040302010902). It is 790 ha with 76% cropland, 15% grassland, and 9% forest, with an outlet elevation of 243.84 m above sea level. The average annual precipitation is 874 mm and air temperature is 6 °C. Observed streamflow and total phosphorus from 1994 to 2012 are available and are used as base for comparisons with future estimation besides model calibration and validation. The Walworth watershed (LAT: 42°39′03″, LON: 88°33′03″) is located in the Jackson Creek watershed (HUC 070900021401) with Jackson creek and Bear creek. Outlet elevation is at 132.28 m, and it had a drainage area of 1124 ha with 42% cropland, 10% grass land, and 48% urban area. The average annual precipitation is 897 mm, and average air temperature is 8 °C.
2.3. Selection of GCMs and GHG Scenarios
Future climate projections used for this study are based on the Coupled Model Intercomparison Project 3 (CMIP3), the reason is the failure of the CMIP5 data to capture increased intensity, duration, and frequency of precipitation extremes in the Midwestern U.S. described by Wuebbles et al. [31] and confirmed in the Champlain Lake Basin by Mohammed et al. [32], highlighting the inadequate representation of variability in the precipitation process. However, runoff generation and erosion processes are strongly affected by the intensity and duration of precipitation [33]. Besides, a large proportion of the annual soil loss and nutrient losses are generated by the extreme storm events that generally happen in short times [16,17,18,34]. Particularly, the changes of extreme storm events are one of the key study targets in this paper.
Three climate change scenarios (A2, A1B, and B1) are selected based on the special report emission scenarios (SRES), according to the developing styles of population, technology, and economics, resulting in projections of changes to CO2 emissions. There are two GCMs running under each scenario, as projected climate dataset from multiple model ensembles have been found to diminish the spatial biases from individual GCMs [35]. The GFDL-CM2 (Geophysical Fluid Dynamics Laboratory Version 1.1) [11,36], and HADCM3 (Hadley Centre climate model Version 3.1) model [37] are selected based on their sensitivities to GHG emissions from high to low.
Further process of climate dataset includes downscaling and basis correction. Downscaling of climate datasets is done by Sinha and Cherkauer [13], from monthly to daily with the support of historical PDFs (Probability Distribution Functions). In this study, the daily precipitation dataset is disaggregated into an hourly time step to better account for the shorter duration bursts of intense rainfall with the CLIGEN model and DISAG sub-routine used within the WEPP model. Basis correction is conducted in this study for three SRES scenarios (A2, A1B, B1) of two GCMs by comparing the observed and bias corrected simulation in the base period. The base period from 1996 to 2012 is defined as the baseline for both the Green Lake watershed and the Walworth watershed. From 2015 to 2099, three periods are defined: early century period is from 2015 to 2045; middle century from 2046 to 2075; and, a late century period from 2076 to 2099. Four standard seasons are defined: spring is from March to May, summer is from June to August, fall is from September to November, and winter is from December to February.
2.4. Data Introduction
The climate datasets used for model calibration and validation of the two watersheds are downloaded from the National Climatic Data Center from 1984 to 2009 for the Green Lake watershed and 1986 to 2007 for the Walworth watershed at daily time step. Other climate parameters, including wind speed, wind direction, solar radiation, and dew point temperature are generated with CLIGEN [32] based on the monthly statistical parameters that are derived from the same two stations. The climate datasets of two watersheds are processed into hourly time step with the application of CLIGEN model and DISAG sub-routine. DEM with resolution of 30 m by 30 m is downloaded from the United States Geological Survey (USGS) seamless data server, together with the land cover maps of 2001 with the same resolution. Crop management in the base period, including planting and harvest dates, tillage dates and method, fertilizer application dates, rate, and method are from farm survey management information from the agricultural departments of Walworth County and Green Lake County (Table 1), the database of WEPP field management, and the water quality conservation report of 2012. Crop management is assumed to be a two-years rotation of corn and soybean, as suggested for the region. Tillage for the Walworth County watershed is assigned as chisel plowing two weeks before field cultivation for cropping. Future field management is kept the same with historical management to clarify the climate change effects. Soil data for these two watersheds are obtained from Mao et al. [38], with the spatial resolution of 1/8 degree latitude and longitude, which is originally from the Soil Survey Geographic Database (SSURGO). The dominant soil types of the Walworth watershed are Pella silt loam and Elburn silt loam, and the primary soil types of Green Lake drainage area are Plano silt loam and Medota silt loam. The observed climate datasets from 1994 to 1996 and from 1986 to 1987 are used as the forcing data for the model warming up for the Green lake watershed and Walworth watershed, respectively. For the Green Lake watershed, the climate datasets from 1997 to 2004 and from 2005 to 2011 are used for the model setup in calibration and validation processes, and for the Walworth watershed, climate datasets from 1988 to 1998 and from 1999 to 2008 are used in the calibration and validation processes. Land cover, digital elevation map (DEM), and soil data are not changed between calibration and validation, and the same calibrated parameter sets are used for historical and future climate simulations for the two watersheds. Observed streamflow and TP datasets are downloaded from the USGS with the site number of 04073462 for the Green Lake watershed and 054310157 for the Walworth watershed. For the Green Lake watershed, the streamflow and total phosphorus from 1996 to 2012 are available at daily and annual time steps, respectively, and are used for model calibration and validation, and as a base to compare against future periods. For the Walworth watershed, the observed dataset from 1987 to 2008 is available for streamflow at daily time step, and for phosphorus at annual time step, which are used for model calibration and validation, and are used as the base for comparison with future estimates.
Given that there is no observed Nitrogen dataset for the two watersheds, the nitrogen parameters for the WEPP-WQ model are taken from Wang et al. [24], which is calibrated to estimate NO3-N loading in runoff for storm events in site of Throckmorton Purdue Agricultural Center (TPAC), Indiana. We assume that the parameter transfer will result in suitable model performance due to the similarity of soil properties and climate between the Indiana calibration sites and the Wisconsin field sites.
Statistical parameters are used to evaluate the model performance in simulating runoff and total phosphorus following the methods of Moriasi et al. [39] with Nash-Sutcliffe Coefficient (NSE), RSR, and PBIAS. If NSE was very close to 1, the simulating accuracy was high; if NSE was close to 0, then the simulation performance was not good. The model performance was regarded as satisfactory when the RSR is smaller than 0.6, PBIAS was in the range of ±25% for the streamflow simulation; and, between ±40% and ±70% for pollutant (N and P) losses [32]. Parameters’ uncertainty analysis is conducted with the General Likelihood Uncertainty Estimation (GLUE) approach [40], with Monte Carlo simulation to quantify the WEPP-WQ model uncertainty in estimating streamflow and TP losses at the Green Lake and Walworth watersheds. The Monte Carole sampling from the space with normal distribution is done for seven parameters, as recommended by Wang et al. [24]. The parameter Nash-Sutcliffe Coefficient (NSE) is used as the likelihood function and 0.5 as the threshold that had been designed subjectively for the selection of behavioral parameter settings. After that, three steps are done, including the calculation of likelihood values of behavioral parameter sets, rescaling these values to formulate a cumulative distribution, and the derivation of quintiles of uncertainty from the cumulative distribution.
Annual analysis is done through comparisons between the base and future simulations about precipitation, air temperature, TP, and NO3-N losses to clarify the climate change impacts on nutrient losses and the dominant influencing factor of each future period is identified among air temperature, precipitation quantity, and extreme precipitation events with the linear least squares regression method. Seasonal analysis is done to indicate the changing percentage with box plots of precipitation, air temperature, streamflow, TP, and NO3-N loadings for further showing the changes of TP and NO3-N losses under future climate change scenarios.
3. Results
3.1. Model Calibration and Validation
Streamflow of the two watersheds is estimated using the sum of surface runoff, lateral flow, and baseflow from the hillslopes of the two watersheds. Total phosphorus (TP) includes both soluble and insoluble phosphorus in surface runoff, and NO3-N loss includes the loadings from surface flow, lateral flow, and baseflow. The simulating parameters about streamflow equations, soil erosion, and water quality of the WEPP-WQ model are recommended by Wang et al. [24] for the model calibration process, including the critical shear stress, effective hydraulic conductivity, interrill erodibility, and rill erodibility for the streamflow and soil loss, the nitrogen percolation coefficient, denitrification threshold water content, phosphorus percolation coefficient, phosphorus soil partitioning coefficient, and phosphorus sorption coefficient for the NO3-N and TP losses. The parameter definition, acceptable ranges, and calibrated values for the Green Lake and Walworth watersheds in estimating the streamflow and TP losses are listed in Table S3. Calibrated and validated simulations for the Green Lake and Walworth watersheds are found to be satisfactory for both streamflow and total phosphorus at an annual time step (with the NSE > 0.5, PBIAS < ±40% and ±70% for NO3-N and TP, the PBIAS < ±25%, and R2 > 0.6 for the streamflow (Table 2).
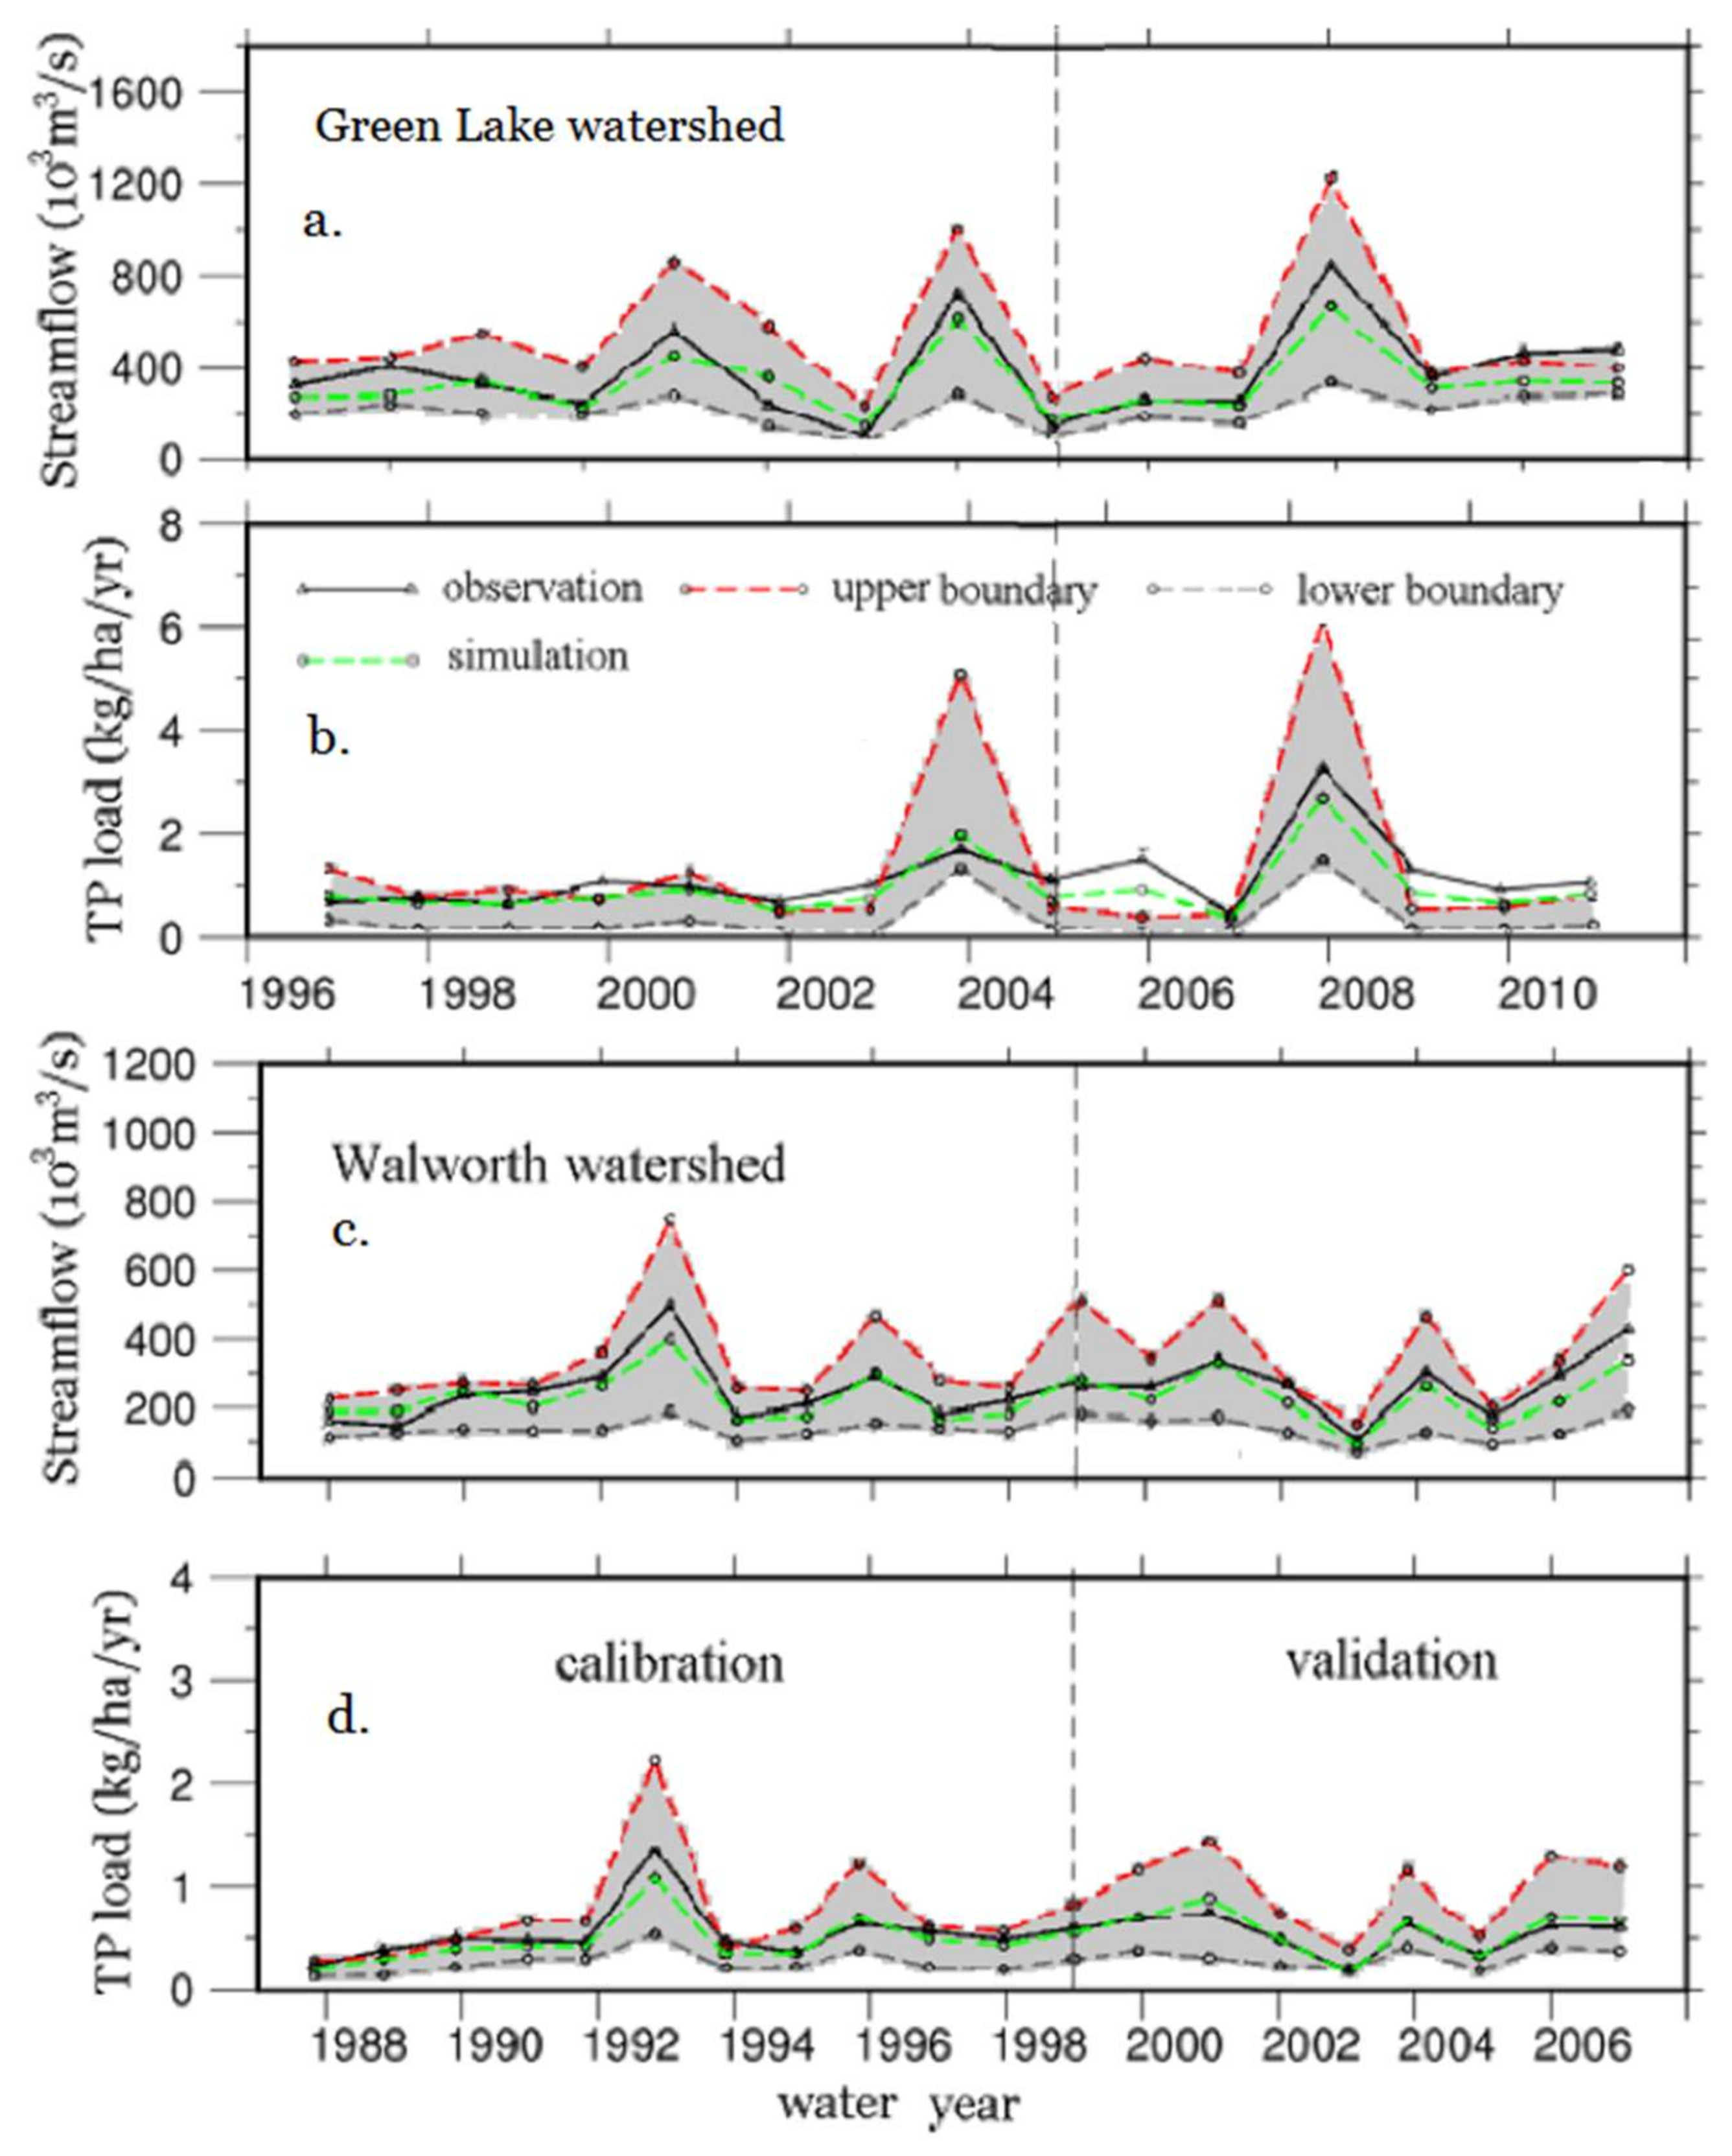
Parameter uncertainty analysis is done with the seven parameters for the two watersheds to ensure the effectiveness of the model simulation. Posterior distributions of the seven parameters are obtained through analyzing the behavioral parameter sets and are shown in Table S4. Effective hydraulic conductivity, rill erodibility, and phosphorous percolation coefficient are well identifiable parameters with less parameter uncertainty due to the small values of variances, while the other four parameters with larger variance values indicate more scatter and larger parameter uncertainty. The 95% confidence intervals are indicated in Figure 2, and they highlight the uncertainty range between simulated variables. Observations for most years fall within the uncertainty bounds, with the exception of TP in the Green Lake watershed, where the simulated range is low as compared to the observations. Model uncertainty is greatest in 2004 and 2008 in the Green Lake watershed and 1993 in the Walworth watershed, with the highest observed streamflow. The evaluation results demonstrate that the parameter settings for the WEPP-WQ model produce reasonable estimates of streamflow, total phosphorus, and nitrogen losses for the two watersheds, and can be used in analyzing the impact of the future climate changes on the total phosphorous and nitrate loading of streamflow.
3.2. Climate Change within the Two Watersheds
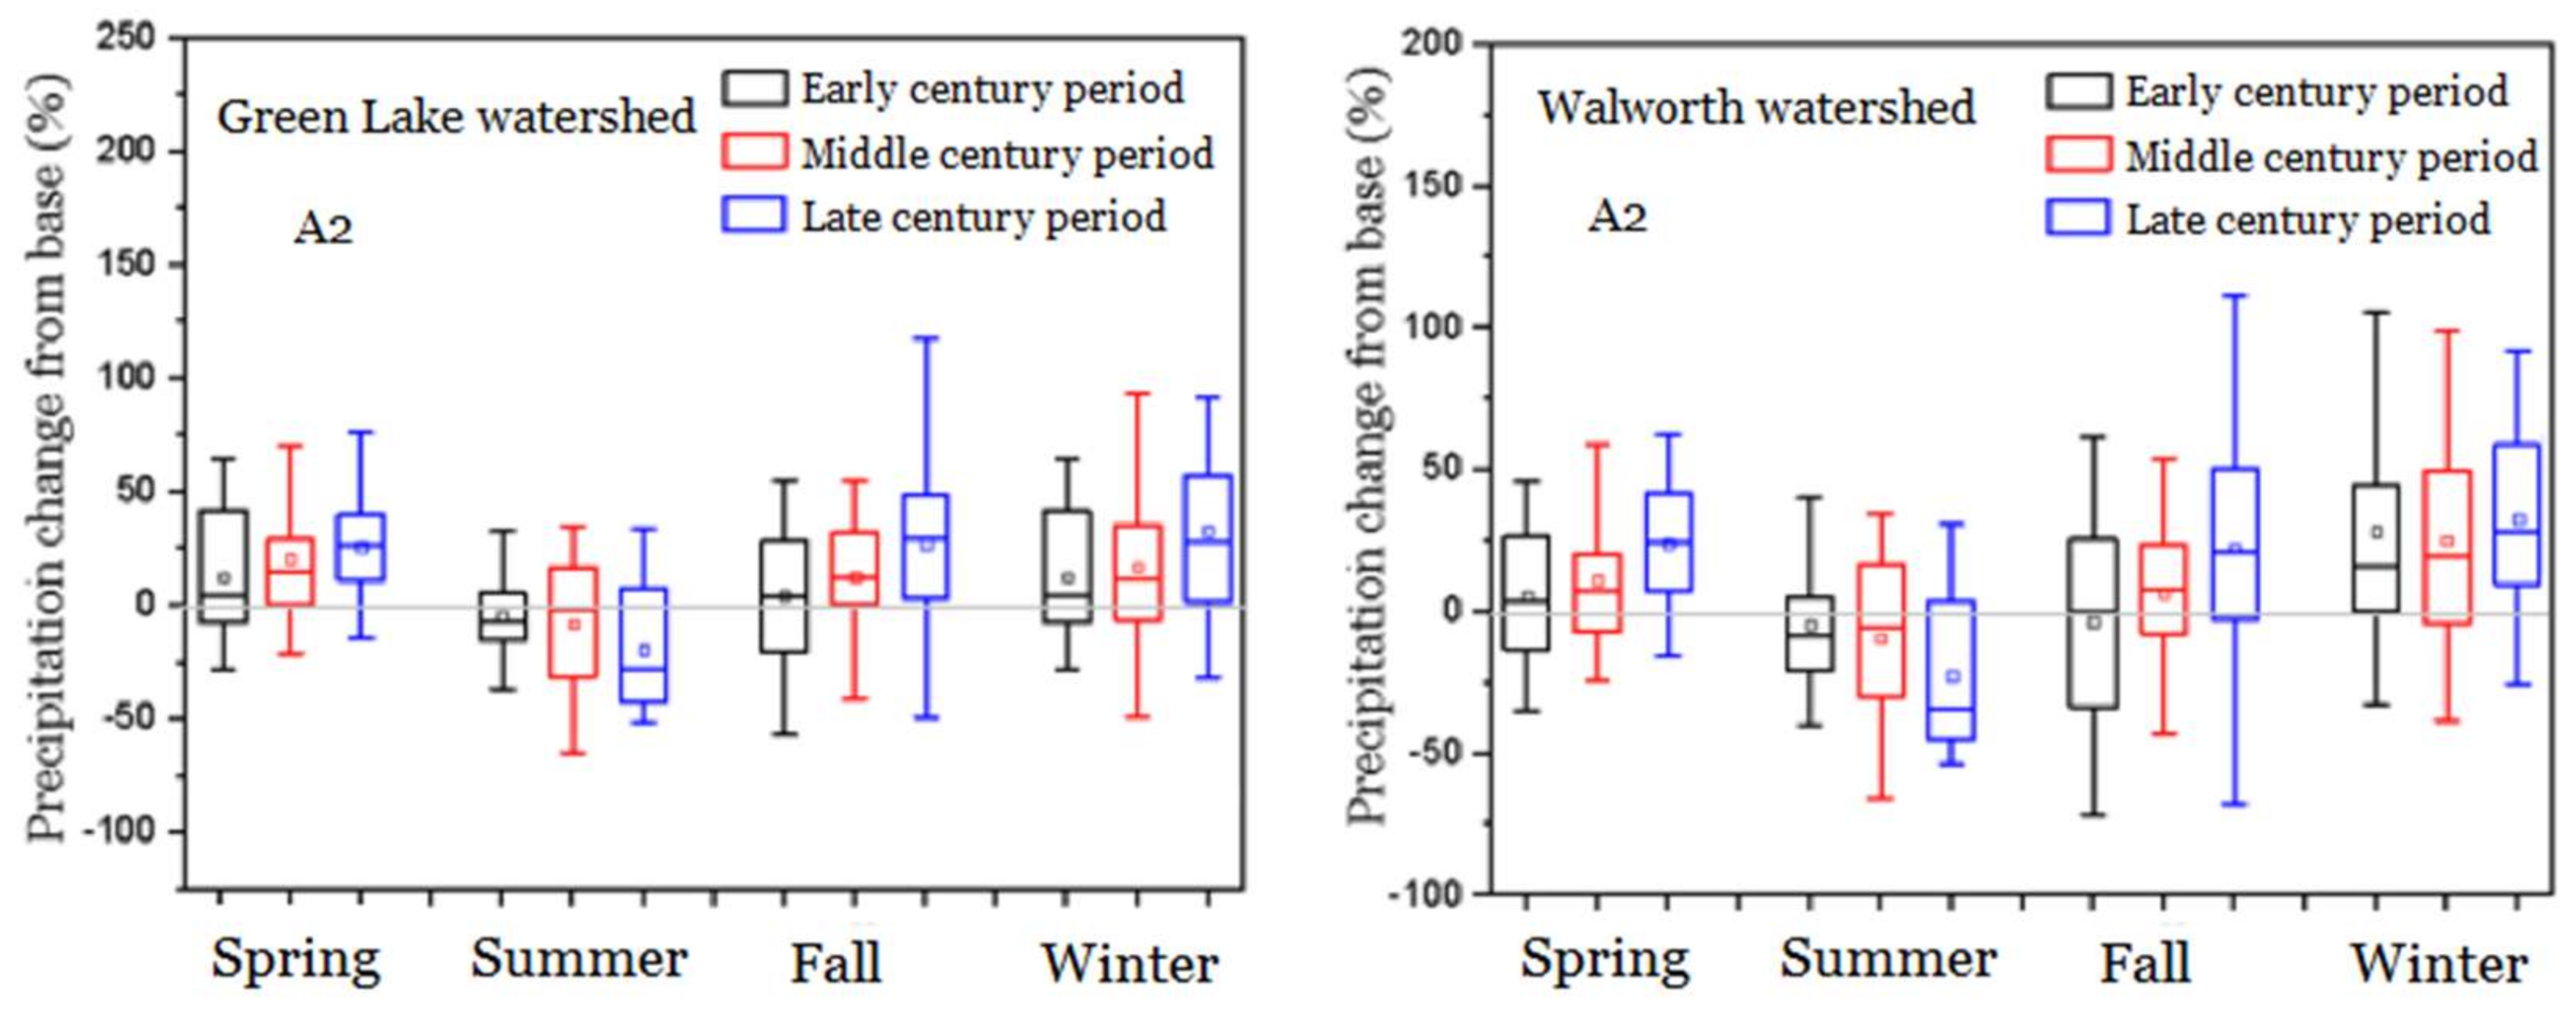
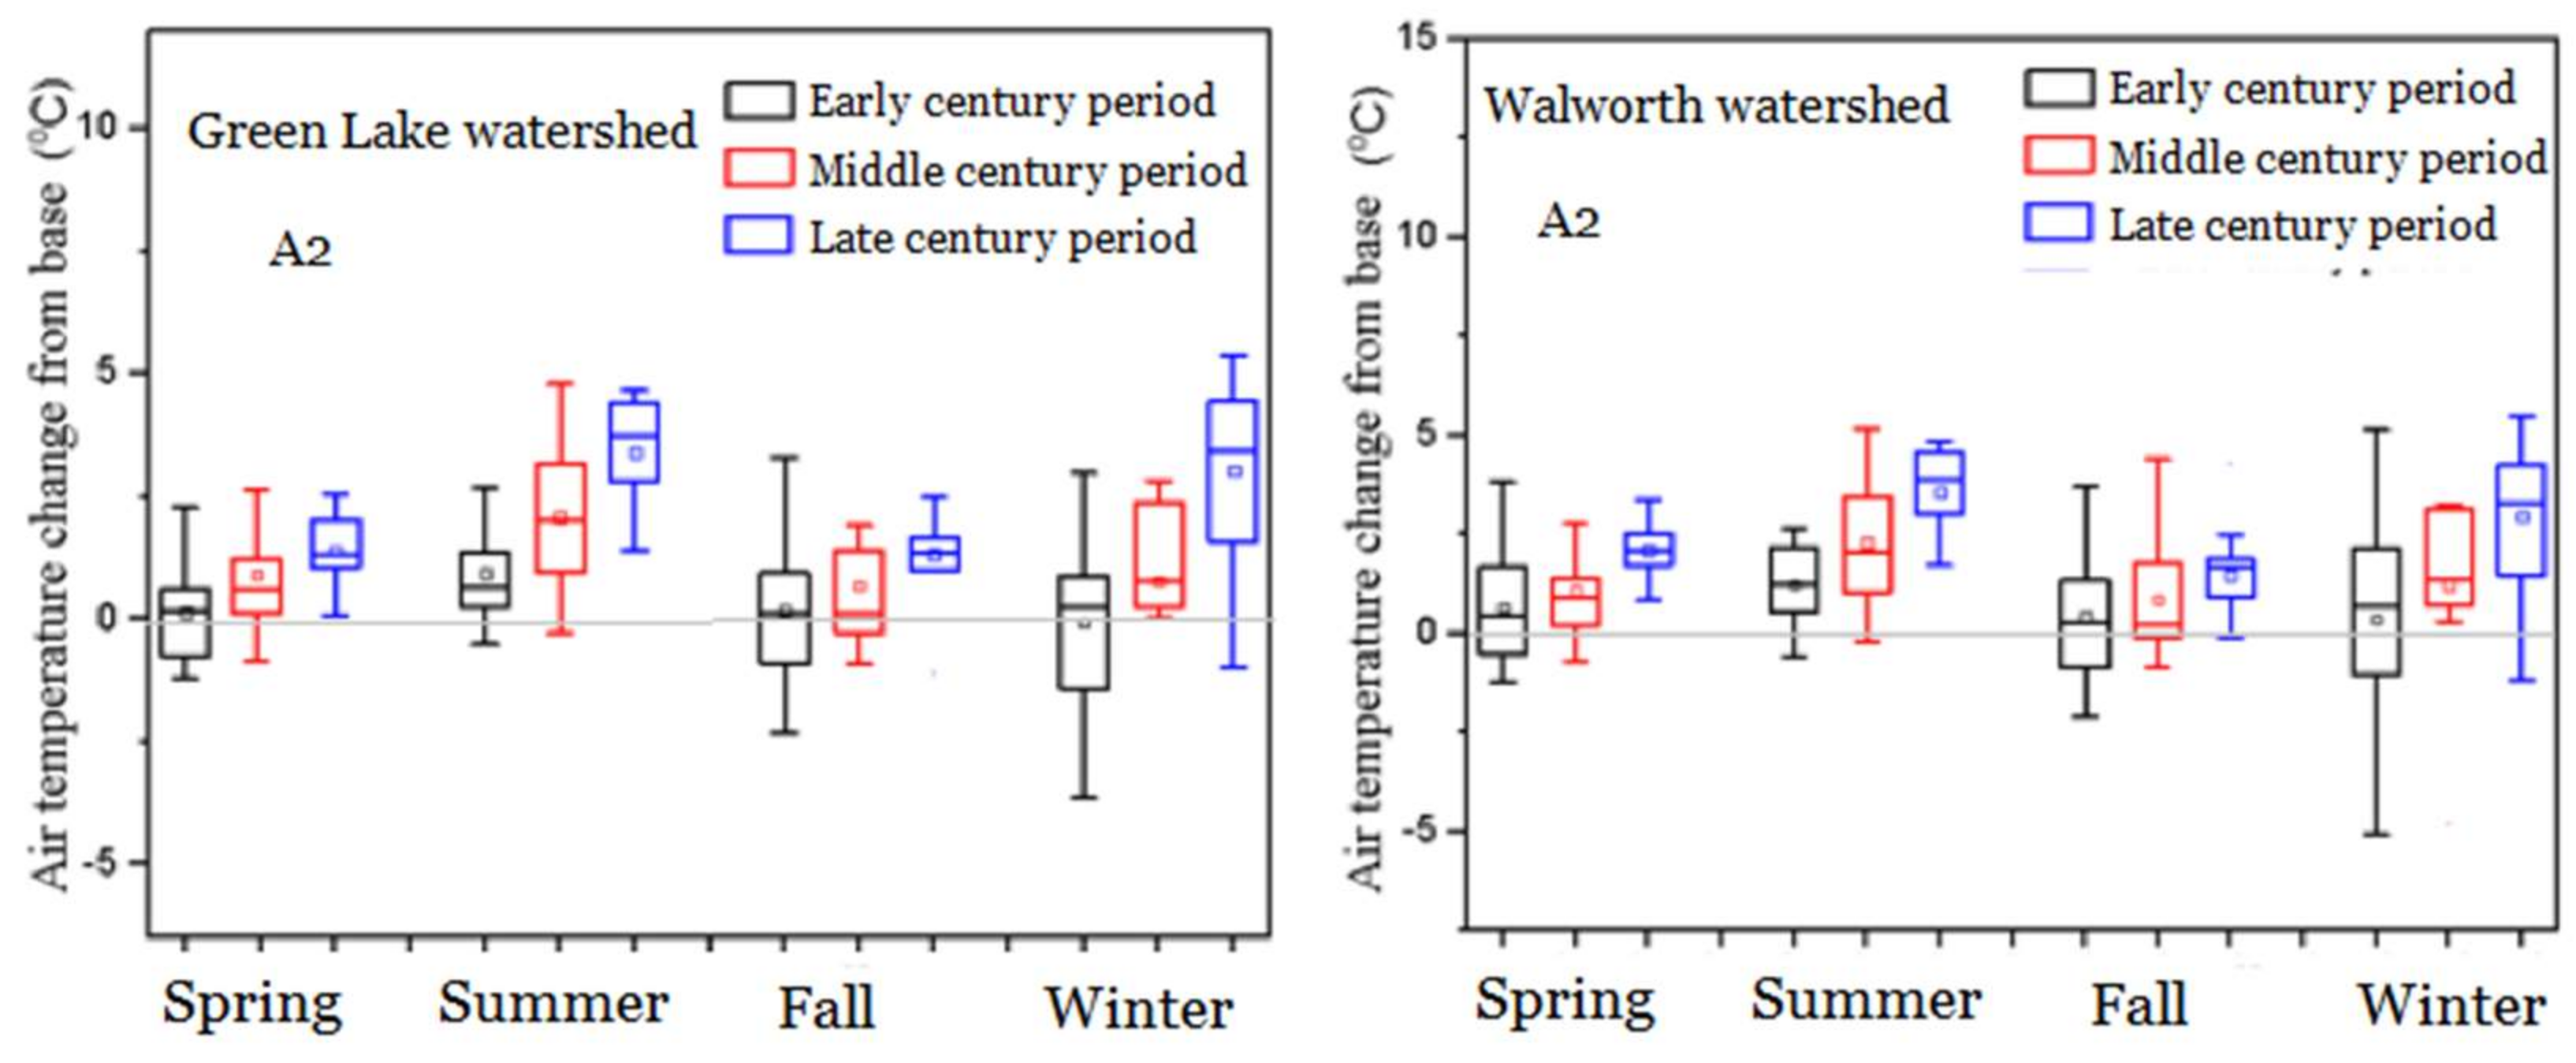
In the Green Lake watershed, the projected annual precipitation increases by 8.4% to 40.1% over three future periods, with the greatest increase under the A2 scenario (Table 3). It has the highest increase in the early century period and the lowest in the late century period. Precipitation increases in fall and winter over three future periods, and decreases in the summer of the late century period (Figure 3). This is similar to trends in precipitation that were found by Shrestha and Wang [23] in the exploration of the climate change impacts on the soil loss of the Athabasca River Basin in Canada. Air temperature increases by 1.2 °C to 4.1 °C with the greatest increase under the A2 scenario among the three SRES scenarios over three future periods (Table 3). Cold season temperatures (from December to May) are projected to increase by 3.6 °C to 4.5 °C in the late century period (2070–2099), relative to the historical period (1977 to 2006), as indicated by Sinha and Cherkauer [13]. Air temperature increases over four seasons throughout the three future periods with the greatest air temperature increase in summer followed by the spring and winter in the late century periods (Figure 4 and Figure S2).
Extreme storm events in future periods are defined as precipitation events with intensities that are greater than or equal to the average intensity of top 5% of daily precipitation events within one water year. The intensity of extreme storm events of each future period is the average intensity of extreme storm events within the period. It is found to increase consistently with the maximum change under the A2 scenario of 13.5% to 22.8% over three future periods (Table 4). The frequency of extreme storm events increases in the three future periods by 10.53% to 26.32%. Similar changes to the occurrences of heavy storms in the future have been found by previous studies for the Great Lakes region [5,11,17]. Air temperature rise also impacts the number of Freeze and thaw cycles from October to March. Increases of 3.74% to 8.84% regarding the number of FT cycles are found in the early and middle century periods under the A2 and B1 scenarios (Table 5). The result is similar to that obtained by Sinha and Cherkauer [13] about the increase of FT cycles in southern Wisconsin due to the increase of air temperature and the decrease of the snow in the future period from 2010 to 2099 relative to the base period from 1977 to 2006.
In the Walworth watershed, annual precipitation is projected to increase by 8.4% to 40.1%, except the middle century period under B1 scenario with a 0.14% decrease. Annual precipitation has a greater increase in the early century period than the rest two future periods under both the A2 and A1B scenarios. Seasonally, precipitation is projected to increase in spring, fall, and winter, with the highest increasing percentages in spring and fall of the middle and late century periods under the three SRES scenarios (Figure 3 and Figure S1). Extreme storm intensity increases over three future periods with the highest increase under the A2 scenario of 12.52% to 21.17%, and lowest under the B1 scenario of 3.56% to 9.86%. This follows the observation that the largest percentage changes in precipitation are in the fall under the A2 scenario (Figure 3), and in fall and summer under the A1B scenario (Figure S1). Air temperature increases throughout the three future periods with the greatest increase under the A2 scenario by 0.2 to 4.16 °C (Table 3). FT cycles increase consistently throughout the study period under both A2 and A1B scenarios, with the greatest increase in the middle century period and the lowest increase in the early century period (Table 5). The air temperature changes within a smaller range in the middle century period under the B1 scenario, which does not cause the changes of the soil moisture status (Figure S2), therefore, FT cycles in middle century period decreases relative to that of the base period, even though the annual air temperature increases.
3.3. Streamflow and Sediments Response to Climate Change
Streamflow transports sediments, TP, and NO3-N to the watershed outlet from the hillslopes. For the Green Lake watershed, the annual streamflow is around 190 mm and sediment is around 1.1 ton/ha in the base period (Table S1). The streamflow is projected to increase constantly throughout three future periods, with the greatest increase of 53.9% in the late century period (Table 6). The streamflow increase is likely caused by the increase of precipitation quantity and extreme storm events in the frequency and intensity. The result is higher than the streamflow increase of the four watersheds around Lake Erie, which is about 6% and 12% in the moderate and pronounced scenario based on the precipitation increase by 14% and 35% found by Bosch et al. [41]. Seasonally, streamflow has the greatest percentage increase in winters over the three future periods. Streamflow increases in springs and falls as well, while it decreases in summers under the three SRES scenarios (Figure 5 and Figure S3). The summer streamflow decrease is mainly caused by the precipitation quantity reduction and evaporation increase with the greatest air temperature elevation in summers (Figure 3, Figure 4 and Figure 5). Fall streamflow increase is probably due to the increase of precipitation quantity and extreme storm events. Winter streamflow increases by 40% to 60%, and are likely due to the winter precipitation increase and the air temperature elevation, which increases the precipitation in rainfall format. The streamflow increase in spring is mainly due to the increase of precipitation quantity, though the increasing percentage is small as a result of the increased evaporation that is caused by the air temperature rise and the decreases of spring freshet led by reduced winter snow. It makes sense, as snow is predicted to decrease around 31.4% to 44.7% by Bosch et al. [41] of four watersheds around Erie Lake in early and middle century periods.
Annual sediment loss increases constantly over three future periods, with the greatest increase in the late century periods (Table 6). This is attributed to the combined effects of the increase about precipitation quantity, extreme storm events in intensity and frequency, and air temperature which increases the number of FT cycles. The increase in sediment losses is similar to that of the streamflow over the three future periods which is supported by the positive relationship found by Luo et al. [42], with their statistical analysis of the observed sediments from 1992 to 2005 at 92 river basins. An increased number of FT cycles may increase the risk of soil erosion by weakening soil structure and enhancing soil erodibility [13]. Soil loss increases are found in spring, fall, and winter and increases with time moving through the three future periods. Decreased summer soil loss is due to the projected streamflow reduction. A similar increase in soil loss during winter is predicted by Sinha and Cherkauer [13] who find increased numbers of FT cycles in the southern Wisconsin.
For the Walworth watershed, annual streamflow and sediments are around 140 mm and 2.1 ton/ha in base period, respectively. Annual streamflow increases over three future periods by 24.3% to 44.74%, with the greatest increase in the middle century period and the lowest increase in the early century under the A2 scenario (Table 6). The combined impacts of increase extreme storm events and precipitation quantity are the major reason of the greatest streamflow of the middle century period, as the extreme storm events get the surface flow increased and the precipitation get both the flows of surface and subsurface increased. The streamflow increases of the early and late century periods are accompanied with the greatest increase of precipitation quantity and extreme storm events, respectively. Seasonal streamflow increases in four seasons, but summers with a greater increase in falls and winters over the early and middle century periods under the three SRES scenarios (Figure 5 and Figure S3). The precipitation quantity reduction is the main reason for the streamflow decrease in summer (Figure 3 and Figure 5). This finding is similar to Leong and Donner [43], with a streamflow increase in winters and a decrease in summers in the Athabasca River Basin of Canada, even though the summer streamflow reduction is attributed to the increased frequency of low streamflow by the end of 21st century. Sediments are projected to increase over three future periods, with the greatest increase by 54.4% to 52.1% in the late century period and lowest in the early century period by 35.0% to 41.2%. This is similar to the result of Bosch et al. [41] which found that soil loss will increase by 20% to 49% in four watersheds around Lake Erie.
3.4. TP Losses Response to Climate Change
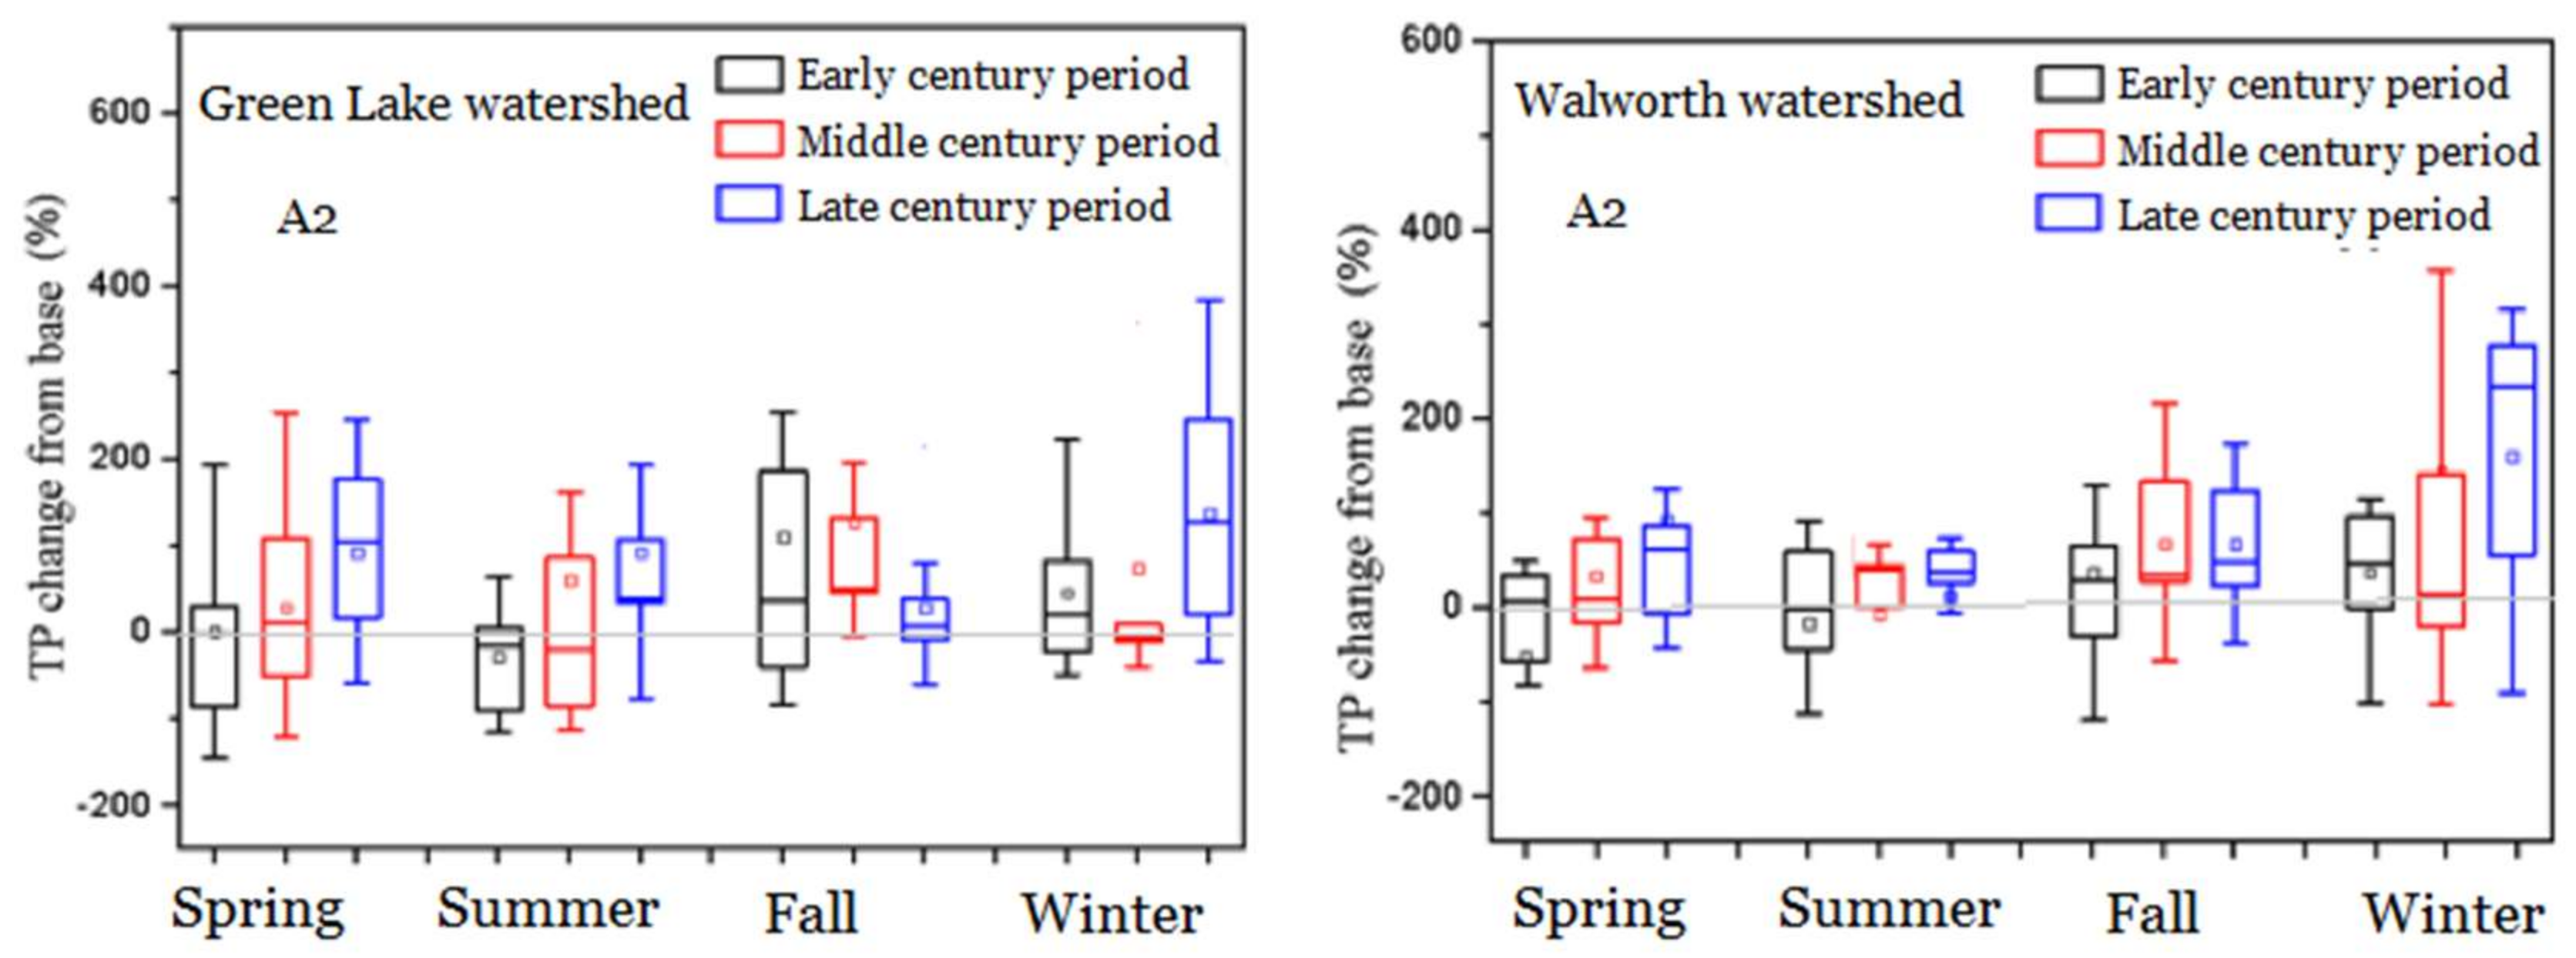
In the Green Lake watershed, annual TP loss is 1.1 kg/ha in base period and increases consistently by 28% to 89% over the three future periods, with the highest increase in late century period and the lowest increase in the early century period under A2 and B1 scenarios (Table 7 and Table S1). This changing trend is consistent with that of precipitation, the extreme events in intensity and frequency, streamflow, and sediments under the same SRES scenarios (Table 3, Table 4, and Table 6). The identified major influencing factors of TP increase in each future period are listed in Table 8, among the precipitation, extreme storm events, and air temperature. TP increasing trend is similar to that of the streamflow and sediments, as the streamflow and soil loss are the carriers of the soluble and insoluble phosphorus, respectively. It makes sense that the greatest TP increase of late century period is attributed to the influence of extreme storm events [44], as soil loss that is generated by the extreme storms accounts for a large percentage of annual soil loss [37,42,44,45,46], so is the insoluble phosphorus attached to the sediments. Seasonally, TP increases over three seasons, with the highest increasing percentages in the winters of middle and late century periods, followed by spring and fall, and decreases in summers (Figure 5 and Figure S4). The winter TP loading increase is due to the increase of precipitation quantity and FT cycles, as more streamflow is generated with increased precipitation and more soil loss is produced with the enhanced soil erodibility that is caused by the increase in the number of FT cycles through weakening the soil’s original structures (Table 5 and Table 7). The spring TP increase is probably due to the increase of precipitation and the conduction of fertilizer application, which enables available TP to be transported by the streamflow (Table 1 and Table 7). Fall TP loading increase is primarily attributed to the precipitation quantity increase over the three future periods. Fall TP increasing percentages are less than that in springs due to the TP availability in the fall seasons, even though fall streamflow increases greatly in the early century period and middle century period under A1B and B1 scenarios.
In the Walworth watershed, annual TP loss is 3.3 kg/ha in the base period and is projected to increase constantly by 24.96% to 108.9%, with the greatest increase in the late century period and the lowest increase in the early century period. In the early century period, the TP loss increase is attributed to the increase of precipitation quantity as the TP loss is accompanied with the greatest precipitation increase over three future periods (Table 7 and Table 8). In the middle century period, the TP loss increase is primarily due to the extreme storm events and FT cycles, which has the greatest increase in this period. In the late century period, TP loss reaches the highest increase by 96.4% to 108.9% over the study period due to the combined effects of precipitation quantity, extreme storm events, and FT cycles (Table 7 and Table 8). Seasonally, TP has the highest increase in the spring and winter of late century periods under all three SRES scenarios, followed by summer and fall (Figure 6 and Figure S4). Summer TP increases, which is attribute to the increase of extreme storm events in intensity and frequency. Though the change percentages of TP loss in summers and falls are lower than these in winters and spring, annual TP loss indicates an increase trends among three future periods due to the constantly increasing trend over four seasons. It is similar to Marcinkuwski et al. [18] with TP increase over four seasons and the greatest increase in springs and winters, in both the near and far futures of two watersheds in Poland.
3.5. Nitrate Losses Response to Climate Change
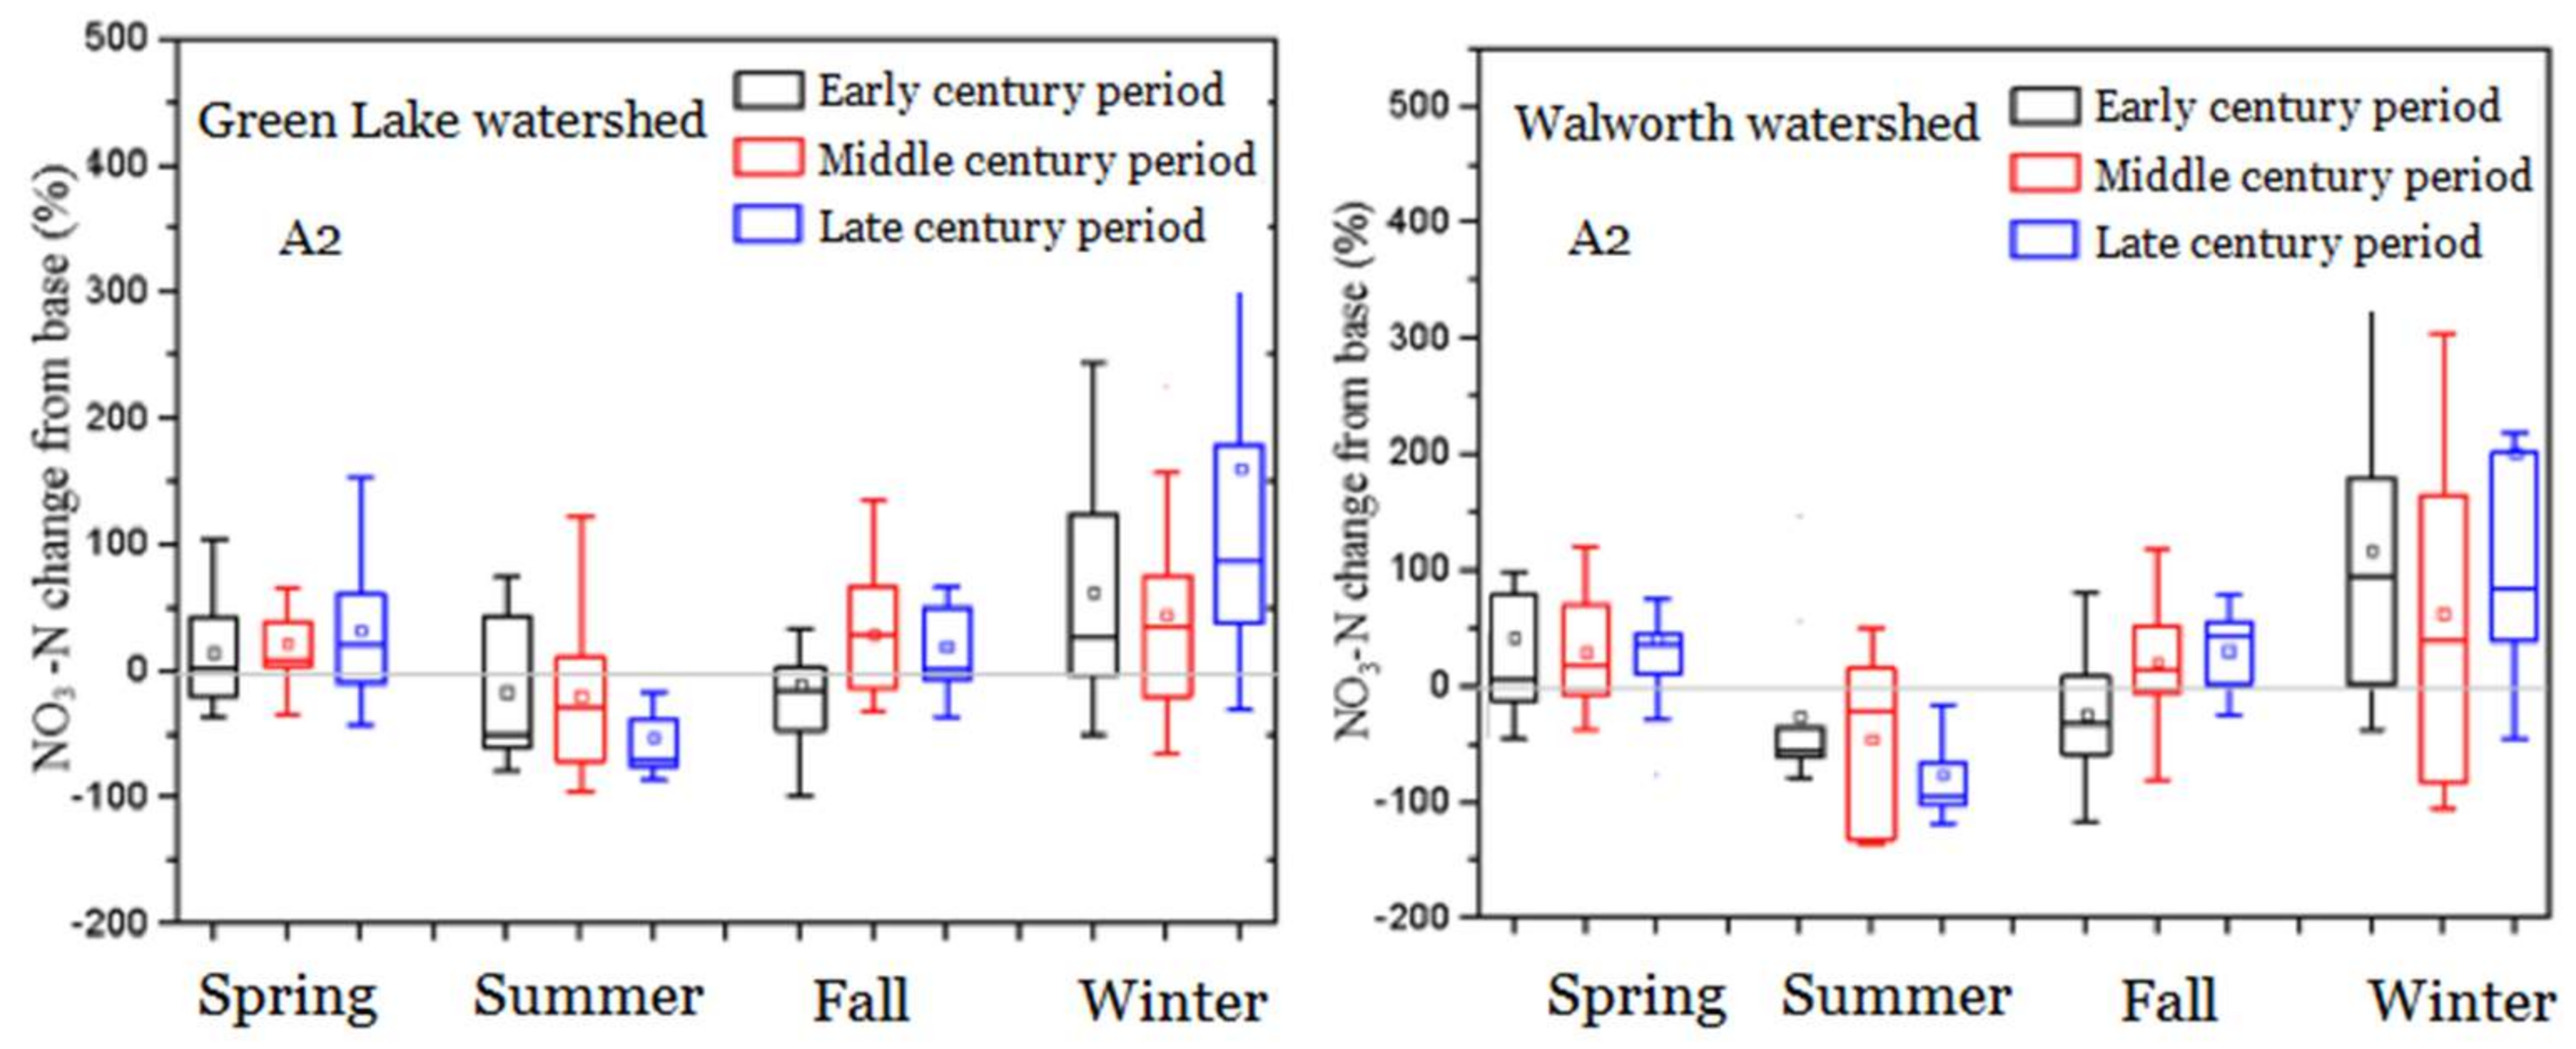
In the Green Lake watershed, the annual nitrate loading of streamflow increases constantly by 1.1% to 29.8% over the three future periods with the greatest increase in the middle century period and the lowest increase in the early century period (Table 7 and Table S1). In the middle century period, the combined effects generate the greatest NO3-N loss, which is accompanied by the increase of precipitation quantity, air temperature, and extreme storm events of intensity and frequency (Table 7 and Table 8). In the late century period, NO3-N loss is mainly caused by the extreme storm events that generate the increase of surface flow with low NO3-N concentration. The air temperature increase is a reason throughout three future periods for the increase of NO3-N losses by accelerating the mineralization and nitrification process [45], which in turn, makes more NO3-N available to be transported out of the field. The seasonal changing trends of NO3-N losses are very close to those of the streamflow over the three future periods for all three SRES scenarios, particularly the A2 scenario (Figure 5, Figure 7, Figure S3 and Figure S5). NO3-N loadings increase in spring, winters, and fall throughout the three future periods with the greatest increasing percentages in winters under three SRES scenarios (Figure 7 and Figure S5). NO3-N losses increases in winter and spring are probably due to the increase of precipitation and air temperature, which cause increases in both surface and subsurface flows, as it found by Marcinkowski et al. [18]. NO3-N loadings decrease in summers are mainly due to the precipitation reduction over three future periods under three scenarios (Figure 5, Figure 7, and Figure S4). The increased air temperature in summer accelerates the ammonia volatilization and denitrification processes, with the average air temperature being higher than 5 °C [18], however, the increased nitrogen quantity is exceeded by the NO3-N loading reduction due to the decrease of precipitation, and the nitrate losses in the active processes of mineralization and nitrification in summers.
In the Walworth watershed, annual NO3-N losses increase throughout the three future periods by 40.6% to 95.5%, with the highest increase in the early century period and the lowest in the middle century period around 8.0% to 44.5% under three SRES scenarios (Table 8). In the early century period, NO3-N loading of streamflow is accompanied by the greatest increase in precipitation quantity, which increases both the surface and the subsurface flows. In the middle century period, NO3-N loading experiences the smallest increase, even though it is accompanied by the highest increase of streamflow. It is likely due to an increase of surface flow with low NO3-N concentration being generated by the increased extreme storm events. Seasonally, nitrate loading increases over four seasons but summers throughout the three future periods with the greatest increase in winters under A2 and B1 scenarios. The winter NO3-N increase is likely due to the precipitation quantity increase that is caused by the increases of both the surface and subsurface flows. The nitrate increase in winter is greater than that in spring and fall in the middle and late century periods under A2 and B1 scenarios (Figure 7 and Figure S5). The NO3-N increase in falls are probably due to the increased streamflow that is led by the increase in precipitation quantity and extreme storm events over three future periods (Figure 3 and Figure 7, Table 4). Greater increase in the number of FT cycles accompanies the greatest increase of NO3-N loss in this study, even though current literature is unclear about the influence of FT cycles on NO3-N loading.
4. Discussion
The projected changes to climate indicate increases in precipitation, air temperature, and extreme storm events over three future periods, in both the Green Lake watershed and the Walworth watershed. Annual streamflow increases by 10.0% to 53.9% in corresponding to the precipitation increase by 4.4% to 20.7% over three future periods under three SRES scenarios of the Green Lake watershed; increases by 24.3% to 44.7% that are based on the precipitation increase by 2.6% to 43.1% in the Walworth watershed. This should contribute to the close geographical locations to each other and the similarity about agricultural-land areas and silt loam soil types of the two watersheds. This finding is similar to Lee et al. [47], who find an increase in runoff of 37% to 40% based on a 20% increase in precipitation for the U.S. Corn Belt and Cherkauer et al. [4] finding of the streamflow increase by 9.7% to 22.3% due to the precipitation increase of 5% to 10% by the end of this century in the Michigan Lake region.
The two watersheds have increased NO3-N and TP losses that are based on the increase of streamflow and soil loss in response to the climate change annually and seasonally over three future periods. TP loss increases constantly over three future periods from 28.3% to 89.0% due to the increase of precipitation and extreme storm events in the Green Lake watershed, and 25.0% to 108.9% in the Walworth watershed. This increasing trend is similar to that found by Walker et al. [48], which showed the TP increase by 25% to 35% from 2030s to 2090s in the Bay of Quinte, and by Bosch et al. [40], the TP increase by 23% from 2010 to 2069 in the four watersheds around Lake Erie accompanied by the 6% precipitation increase and 0.3% to 11% surface flow increase. TP losses increase in spring, fall, and winters over three future periods for the two watersheds, and decrease in summer in the Green Lake watershed, due to the reduction in precipitation quantity. TP loading increases in summer in the Walworth watershed, which is mainly due to the increase of extreme storm events. The seasonal changing trend is close to that found by Verma et al. [12] with increasing TP losses from December to May and October to November in the Maumee River watershed lying in the Lake Erie basin, and Marcinkowski et al. [18] with increased seasonal TP in spring, fall, and summers, due to the increase surface runoff for both of the two watersheds in Poland. NO3-N loss increases by 17.5% to 27.8% over three future periods in Green Lake watershed, and 8.0% to 95.5% in the Walworth watershed. It is consistent with Wang et al. [49] that the Nitrogen loss increases by 33.7% of Iowa State under future climate from 2045 to 2064. Seasonal NO3-N losses from the two watersheds increase over four seasons, but summers with the greatest increase percentage in winters due to the precipitation quantity increases that increase surface and subsurface flows of with increased air temperature. NO3-N losses have similar changing trends to those of the streamflow with greater increasing percentages in winters than spring and falls as a result of the precipitation increase. NO3-N losses of the Walworth watershed do not increase in summers like the TP loading does, as the extreme storm events mainly increased the surface flow with low NO3-N concentrations.
The major influencing factors of the NO3-N and TP losses are different in each future period for the two watersheds. The combined effects of precipitation quantity, extreme storm events, air temperature play the dominant role on TP losses in the Green Lake watershed over three future periods, while the major influencing factors are precipitation, extreme storm events, and the combined effects in the early, middle, and late century periods for the Walworth watershed, correspondingly. For the NO3-N loss, the major influencing factors are precipitation, combined effects, and extreme storm events in each of the three future periods in the Green Lake watershed, while they are precipitation, extreme storm events, and the combined effects in the Walworth watershed of three future periods. Increased extreme storm events elevated the probability of NO3-N and TP losses directly through increasing the surface runoff [50], and increased precipitation quantity elevated the NO3-N losses through both surface and subsurface flows. The combined effects of precipitation, extreme storm events, and air temperature are more influential to the NO3-N losses than the single factors, particularly in the Green Lake watershed of middle century period with the greatest NO3-N loss increase.
Uncertainties exist in this study about the land uses and field managements of the two watersheds, as they are kept the same in this study of the future and base periods to isolate the climate change impacts on nutrient losses. The fertilizer management about of fertilizer types, fertilizer application dates, rate, and method may change in the future instead of being fixed in this study due to the theory exploration of non-point source pollution [8]. It has been found that manure might be more environmentally sustainable than inorganic fertilizers provided that runoff events do not occur soon after application [50], and a shift of earlier crop planting dates will leave the field protected from runoff by crop canopy cover about soil erosion in the spring with projected rainfall increase. Agricultural area is the major source of the nutrient losses, it is uncertain that the area percentages will not change and the crop types of corn and soybean will not be substituted with new ones in correspondence to the future economy development [8]. Uncertainties coming from the WEPP-WQ model application about the model structure, inputs, and parameters are also contained in the estimation of TP/NO3-N losses [24,51]. In addition, uncertainties also come from the climate model results used to make the prediction, and the assumption about the NO3-N loss prediction in this study.
5. Conclusions
The newly developed process based water quality model WEPP-WQ is used to study the climate change impacts on the nutrient losses of the two watersheds located in the Great Lakes region. Annual and seasonal changes of the TP and NO3-N losses are analyzed throughout three future periods of the 21st century, together with the precipitation, air temperature, streamflow, and soil loss. The major influencing factors are identified among the precipitation, extreme storm events, and the air temperature about impacting the nutrient losses under A2, A1B, B1 scenarios for each future period.
In the Green Lake watershed, TP and NO3-N losses increase by 28.3% to 89.0% and 17.5% to 27.8%, respectively, in response to the precipitation increase of 4.4% to 20.7% and the streamflow increase of 10.0% to 53.9%. The combined effects of precipitation, extreme storm events, and air temperature lead the TP loss increase constantly over three future periods, with the greatest increase in the late century period by 71.5% to 89.0% in the late century period. Seasonally, TP and NO3-N losses increase over four seasons, but summers due to summer precipitation decreases. Similar to that of the seasonal changes of streamflow, winter TP and NO3-N losses have the greater increasing percentages than those in spring and fall due to the increase of precipitation and air temperature. NO3-N loss has the greatest increase by 26.5% to 38.1% due to the combined effects in the middle century period and the second largest increase in the late century period due to the impacts of extreme storm events.
In the Walworth watersheds, NO3-N and TP loadings increase over three future periods by 8.0% to 95.5% and 25.0% to 108.9%, respectively, based on the precipitation increase by 0.1% to 43.1% and the streamflow increase by 24.3% to 44.7%. NO3-N has the greatest increases of 40.6% to 95.5% in corresponding to 38.8% to 43.1% of precipitation increase in the early century period. In the late century period, TP has the greatest increase by 96.4% to 108.9% due to the combined effects from precipitation, the extreme storm events, and air temperature. In the middle century period, extreme storm events play the dominant role in influencing the nutrient losses. TP increase over four seasons with greater TP losses increase in winters and springs, while NO3-N losses has the similar seasonal changes of precipitation and streamflow, which decrease in summers and increase in spring, winter, and falls.
In future investigations, it is necessary to account for the potential impacts of field management changes on the nutrient loss under climate change scenarios using more likely changes in future nutrient management practices. In addition, the WEPP-WQ model that is applied in this study is a hillslope version with single overland flow elements (OFE) that cannot estimate the spatial distributions of nutrient losses, realize the evaluation of BMPs, and be used to provide specific management suggestions. It is therefore necessary to improve the WEPP-WQ model by testing hillslopes represented with multiple OFEs to represent complex hillslope management strategies. Additionally, channel routing processes must be added to further clarify the response of nutrient loss response to climate change. Finally, the simulation of climate adaptation strategies to counteract climate change impacts on BMP effectiveness may reveal differences in projected pollutant load reductions as indicated by Chaubey et al. [44].
Supplementary Materials
The following are available online at https://www.mdpi.com/2073-4441/10/4/442/s1, Figure S1: Seasonal changes of precipitation in the Green Lake watershed (left) and Walworth watershed (right) under the A1B and B1 scenarios, Figure S2: Seasonal changes of air temperature in the Green Lake watershed (left) and Walworth watershed (right) under the A1B and B1 scenarios, Figure S3: Seasonal changes of streamflow in the Green Lake watershed (left) and Walworth watershed (right) under the A1B and B1 scenarios, Figure S4: Seasonal changes of TP losses in the Green Lake watershed (left) and Walworth watershed (right) under the A1B and B1 scenarios, Figure S5: Seasonal changes of NO3-N losses in the Green Lake watershed (left) and Walworth watershed (right) under the A1B and B1 scenarios, Table S1: Annual average streamflow, soil loss, nitrate-nitrogen, and TP of the base period for the two watersheds, Table S2: Comparison between the datasets of observation, CMIP3, and CMIP5 about extreme storm events, Table S3: Parameters calibrated in the WEPP-WQ model and model settings for the Green Lake and Walworth watersheds, Table S4: The statistical parameters for the behavioral parameter sets in the parameters uncertainty analysis, Table S5: The statistical parameters of the uncertainty band about the streamflow and TP estimations for the two watersheds.
Acknowledgments
This study was financially supported by project 41271048.
Author Contributions
Lili Wang and Keith A. Cherkauer conceived and designed the experiments; Lili Wang performed the experiments with input from Keith A. Cherkauer and Dennis C. Flanagan; Lili Wang and Zhonggen Wang analyzed the data; Dennis C. Flanagan contributed the datasets used to test and evaluate the model; Lili Wang wrote the paper.
Conflicts of Interest
The authors declare no conflict of interest.
References
- Watson, S.B.; Ridal, J.; Boyer, G.L. Taste and odour and cyanobacterial toxins: Impairment, prediction, and management in the Great Lakes. Can. J. Fish. Aquat. Sci. 2008, 65, 1779–1796. [Google Scholar] [CrossRef]
- Michalak, A.M.; Anderson, E.J.; Beletsky, D.; Boland, S.; Bosch, N.S.; Bridgeman, T.B.; Chaffin, J.D.; Cho, K.; Confesor, R.; Daloglu, I.; et al. Record-setting algal bloom in Lake Erie caused by agricultural and meteorological trends consistent with expected future conditions. Proc. Natl. Acad. Sci. USA 2013, 110, 6448–6452. [Google Scholar] [CrossRef] [PubMed]
- Seilheimer, T.S.; Zimmerman, P.L.; Stueve, K.M.; Perry, C.H. Landscape-scale modeling of water quality in Lake Superior and Lake Michigan watersheds: How useful are forest-based indicators? J. Great Lakes Res. 2013, 39, 211–223. [Google Scholar] [CrossRef]
- Cherkauer, K.A.; Sinha, T. Hydrologic impacts of projected future climate change in the Lake Michigan region. J. Great Lakes Res. 2010, 36, 33–50. [Google Scholar] [CrossRef]
- Trapp, R.J.; Diffenbaugh, N.S.; Brooks, H.E.; Baldwin, M.E.; Robinson, E.D.; Pal, J.S. Changes in severe thunderstorm environment frequency during the 21st century caused by anthropogenically enhanced global radiative forcing. Proc. Natl. Acad. Sci. USA 2007, 104, 19719–19723. [Google Scholar] [CrossRef]
- Hayhoe, K.; VanDorn, J.; Croley II, T.; Schlegal, N.; Wuebbles, D. Regional climate change projections for Chicago and the US Great Lakes. J. Great Lakes Res. 2010, 36, 7–21. [Google Scholar] [CrossRef]
- Jennings, E.; Allott, N.; Pierson, D.C.; Schneiderman, E.M.; Lenihan, D.; Samuelsson, P.; Taylor, D. Impacts of climate change on phosphorus loading from a grassland catchment: Implications for future management. Water Res. 2009, 43, 4316–4326. [Google Scholar] [CrossRef] [PubMed]
- O’Neal, M.R.; Nearing, M.A.; Vining, R.C.; Southworth, J.; Pfeifer, R.A. Climate change impacts on soil erosion in Midwest United States with changes in crop management. Catena 2005, 61, 165–184. [Google Scholar] [CrossRef]
- Kling, G.W.; Hayhoe, K.; Johnson, L.B.; Magnuson, J.J.; Polasky, S.; Robinson, S.K.; Shuter, B.J.; Wander, M.M.; Wuebbles, D.J.; Zak, D.R. (Eds.) Confronting Climate Change in the Great Lakes Region: Impacts on Our Communities and Ecosystems; UCS Publications: Cambridge, MA, USA, 2003. [Google Scholar]
- Gu, C.; Riley, W.J. Combined effects of short term rainfall patterns and soil texture on soil nitrogen cycling-a modeling analysis. J. Contam. Hydrol. 2010, 112, 141–154. [Google Scholar] [CrossRef] [PubMed]
- Stouffer, R.J.; Broccoli, A.J.; Delworth, T.L.; Dixon, K.W.; Gudgel, R.; Held, I.; Hemler, R.; Knutson, T.; Lee, H.-C.; Schwarzkopf, M.D.; et al. GFDL’s CM2 global coupled climate models. Part IV: Idealized climate response. J. Clim. 2006, 19, 723–740. [Google Scholar] [CrossRef]
- Verma, S.; Bhattarai, R.; Bosch, N.S.; Cooke, R.C.; Kalita, P.K.; Markus, M. Climate change impacts on flow, sediments and nutrient export in a Great Lakes watershed using SWAT. Clean Soil Air Water 2015, 11, 1464–1474. [Google Scholar] [CrossRef]
- Sinha, T.; Cherkauer, K.A. Impacts of future climate change on soil frost in the Midwestern United States. J. Geophys. Res. 2010, 115, 1–16. [Google Scholar] [CrossRef]
- McCool, D.K.; Pannkuk, C.D.; Saxton, K.E.; Kalita, P.K. Winter runoff and erosion on Northwestern USA cropland. Int. J. Sediment Res. 2000, 15, 149–161. [Google Scholar]
- Blackburn, W.H.; Pierson, F.B.; Seyfried, M.S. Spatial and temporal influence of soil frost on infiltration and erosion of Sagebrush rangelands. Water Resour. Bull. 1990, 26, 991–997. [Google Scholar] [CrossRef]
- Cousino, L.K.; Becker, R.H.; Zmijewski, K.A. Modeling the effects of climate change on water, sediment, and nutrient yields from the Maumee River watershed. J. Hydrol. Reg. Stud. 2015, 4, 762–775. [Google Scholar] [CrossRef]
- Crossman, J.; Futter, M.N.; Oni, S.K.; Whitehead, P.G.; Jin, L.; Butterfield, D.; Baulch, H.M.; Dillon, P.J. Impacts of climate change on hydrology and water quality: Future proofing management strategies in the Lake Simcoe watershed, Canada. J. Great Lakes Res. 2013, 39, 19–32. [Google Scholar] [CrossRef]
- Marcinkowski, P.; Piniewski, M.; Kardel, I.; Szcesniak, M.; Benestad, R.; Srinivasan, R.; Ignar, S.; Okruszko, T. Effects of climate change on hydrology, sediment and nutrient losses in two lowland catchments in Poland. Water 2017, 9, 156. [Google Scholar] [CrossRef]
- Kerkhoven, E.; Gan, T.Y. Differences and sensitivities in potential hydrologic impact of climate change to regional-scale Athabasca and Fraser River basins of the leeward and windward sides of the Canadian Rocky Mountains respectively. Clim. Chang. 2011, 106, 583–607. [Google Scholar] [CrossRef]
- Shrestha, N.K.; Du, X.; Wang, J. Assessing climate change impacts on fresh water resources of the Athabasca River Basin, Canada. Sci. Total Environ. 2017, 601, 425–440. [Google Scholar] [CrossRef] [PubMed]
- Dadson, S.; Irvine, B.; Kirkby, M. Effects of climate change on soil erosion: Estimates using newly-available regional climate model data at a pan-European scale. Geophy Res. Abstr. 2010, 12, 7047. [Google Scholar]
- Eum, H.I.; Dibike, Y.; Prowse, T. Climate induced alteration of hydrologic indicators in the Athabasca River Basin, Alberta, Canada. J. Hydrol. 2017, 544, 327–342. [Google Scholar] [CrossRef]
- Shrestha, N.K.; Wang, J.Y. Predicting sediment yield and transport dynamics of a cold climate region watershed in changing climate. Sci. Total Environ. 2018, 625, 1030–1045. [Google Scholar] [CrossRef]
- Wang, L.; Flanagan, D.C.; Cherkauer, K.A. Development of a coupled water quality model. Trans. ASABE 2017, 60, 1153–1170. [Google Scholar] [CrossRef]
- Flanagan, D.C.; Nearing, M.A. (Eds.) USDA—Water Erosion Prediction Project Hillslope Profile and Watershed Model Documentation; NSERL Report No. 10; USDA-ARS National Soil Erosion Research Laboratory: West Lafayette, IN, USA, 1995.
- Flanagan, D.C.; Gilley, J.E.; Franti, T.G. Water Erosion Prediction Project (WEPP): Development history, model capabilities, and future enhancements. Trans. Am. Soc. Agric. Biol. Eng. 2007, 50, 1603–1612. [Google Scholar] [CrossRef]
- Nicks, A.D.; Lane, L.J. Weather generator. In USDA-Water Erosion Prediction Project: Hillslope Profile Model Documentation; NSERL Report No. 2; Lane, L.J., Nearing, M.A., Eds.; USDA-ARS, National Soil Erosion Research Laboratory: West Lafayette, IN, USA, 1989. [Google Scholar]
- Arnold, J.G.; Kiniry, J.R.; Srinivasan, R.; Williams, J.R.; Haney, E.B.; Neitsch, S.; Soil, L. Water Assessment Tool Input/Output File Document Version 2009; Tech. Report No 365; Texas Water Resources Institute: College Station, TX, USA, 2011. [Google Scholar]
- Särndal, C.-E. Stratified Sampling. In Model Assisted Survey Sampling; Springer: New York, NY, USA, 2003; pp. 100–109. ISBN 0-387-40620-4. [Google Scholar]
- Guerra, L. Now that ArcGIS 10.1 is Shipping. ArcGIS Resource Center Blog. ESRI. Retrieved 25 June 2012. Available online: https://blogs.esri.com/esri/arcgis/2012/06/19/now-that-arcgis-10-1-is-shipping/ (accessed on 3 April 2018).
- Wuebbles, D.; Meehl, G.; Hayhoe, K.; Karl, T.R.; Kunkel, K.; Santer, B.; Wehner, M.; Colle, B.; Fischer, E.M.; Fu, R.; et al. CMIP5 climate model analyses: Climate extremes in the United States. In Climate Change 2013: The Physical Science Basis. Working Group 1 (WG1) Contribution to the Intergovernmental Panel on Climate Change (IPCC); 5th Assessment Report (AR5); Stocker, T.F., Qin, D., Plattner, G.-K., Tignor, M.M.B., Allen, S.K., Boschung, J., Nauels, A., Xia, Y., Bex, V., Midgley, P.M., Eds.; Cambridge University: Cambridge, UK, 2013. [Google Scholar]
- Mohammed, I.N.; Bomblies, A.; Wemple, B.C. The use of CMIP5 data to simulate climate change impacts on flow regime within the Lake Champlain Basin. J. Hydrol. Reg. Stud. 2015, 3, 160–186. [Google Scholar] [CrossRef]
- Duan, W.L.; He, B.; Takara, K.; Luo, P.; Nover, D.; Netranada, S.; Yamashaki, Y. Spatiotemporal evaluation of water quality incidents in Japan between 1996 and 2007. Chemosphere 2013, 93, 946–953. [Google Scholar] [CrossRef] [PubMed]
- Wang, L.; Cherkauer, K.A.; Flanagan, D.C. Impacts of climate change on soil erosion in the Great Lakes region. Water 2018. in review. [Google Scholar]
- Bhat, K.B.; Haran, M.; Terando, A.; Keller, K. Climate projections using Bayesian model averaging and space-time dependence. J. Agric. Biol. Environ. Stat. 2011, 16, 606–628. [Google Scholar] [CrossRef]
- Delworth, T.L.; Broccoli, A.J.; Rosati, A.; Stouffer, R.J.; Balaji, V.; Beesley, J.A.; Cooke, W.F.; Dixon, K.W.; Dunne, J.; Dunne, K.A.; et al. GFDL’s CM2global coupled climate models. Part I: Formulation and simulation characteristics. J. Clim. 2006, 19, 643–674. [Google Scholar] [CrossRef]
- Pope, V.D.; Gallani, M.L.; Rowntree, P.R.; Stratton, R.A. The impact of new physical parameterizations in the Hadley Centre climate model: HadAM3. Clim. Dyn. 2000, 16, 123–146. [Google Scholar] [CrossRef]
- Mao, D.Z.; Cherkauer, K.A. Impacts of land—Use change on hydrologic responses in the Great Lakes region. J. Great Lakes Res. 2009, 374, 71–82. [Google Scholar] [CrossRef]
- Moriasi, D.N.; Arnold, J.G.; Van Liew, M.W.; Bingner, R.L.; Harmel, R.D.; Veith, T.L. Model evaluation guidelines for systematic quantification of accuracy in watershed simulations. Trans. ASABE 2007, 50, 885–900. [Google Scholar] [CrossRef]
- Beven, K.J.; Binley, A. The future of distributed hydrological models: Model calibration and uncertainty prediction. Hydrol. Process. 1992, 6, 279–298. [Google Scholar] [CrossRef]
- Bosch, N.S.; Evans, M.A.; Scavia, D.; Allan, J.D. Interacting effects of climate change and agricultural BMPs on nutrient runoff. J. Great Lakes Res. 2014, 40, 581–589. [Google Scholar] [CrossRef]
- Luo, P.; He, B.; Chaff, P.L.B.; Nover, D.; Takara, K.; Rozainy, M.M. Statistical analysis and estimation of annual suspended sediments of major rivers in Japan. Environ. Sci. Proc. Impacts 2015, 15, 1052–1061. [Google Scholar] [CrossRef] [PubMed]
- Leong, D.N.S.; Donner, S.D. Climate change impacts on streamflow availability for the Athabasca Oil Sands. Clim. Chang. 2015, 13, 651–663. [Google Scholar] [CrossRef]
- Chaubey, I.; Chiange, L.; Gitau, M.W.; Mohamed, S. Effectiveness of best management practices in improving water quality in a pasture-dominated watershed. J. Soil Water Conserv. 2010, 65, 424–437. [Google Scholar] [CrossRef]
- Robertson, D.M.; Saad, D.A.; Christiansen, D.E.; Lorenz, D.J. Simulated impacts of climate change on phosphorus loading to Lake Michigan. J. Great Lakes Res. 2016, 42, 536–548. [Google Scholar] [CrossRef]
- Mannaert, C.M.; Gabriels, D. A probabilistic approach for predicting rainfall soil erosion losses in semiarid areas. Catena 2000, 40, 403–420. [Google Scholar] [CrossRef]
- Lee, J.L.; Phillips, D.L.; Dodson, R.F. Sensitivity of the US Corn Belt to climate change and elevated CO2: II. Soil erosion and organic carbon. Agric. Syst. 1996, 52, 503–521. [Google Scholar] [CrossRef]
- Walker, R.R. Climate change assessment at a watershed scale. In Proceedings of the Water and Environment Association of Ontario Conference, Toronto, ON, Canada, 12 April 2001. [Google Scholar]
- Wang, Z.; Qi, Z.M.; Xue, L.; Bukovsky, M.S.; Helmers, M.J. Modeling the impacts of climate change on nitrogen losses and crop yield in a subsurface drained field. Clim. Chang. 2015, 129, 323–335. [Google Scholar] [CrossRef]
- Kandel, D.D.; Western, A.W.; Grayson, R.B.; Turral, H.N. Process parameterization and temporal scaling in surface runoff and erosion modeling. Hydrol. Process. 2004, 18, 1423–1446. [Google Scholar] [CrossRef]
- Smith, D.R.; Owens, P.R.; Leytem, A.B.; Warnemuende, E.A. Nutrient losses from manure and fertilizer applications as impacted by time to first runoff event. Environ. Pollut. 2007, 147, 131–137. [Google Scholar] [CrossRef] [PubMed]
Figure 1.
Drainage areas for the two sites in Wisconsin and the land uses of the two watersheds.

Figure 2.
Parameter uncertainty of WEPP-WQ model in Walworth watershed and Green Lake watershed with the upper and lower boundaries. (a) streamflow of Green Lake watershed; (b) TP loss of Green Lake watershed; (c) streamflow of Walworth watershed; (d) TP losses of Walworth watershed.
Figure 2.
Parameter uncertainty of WEPP-WQ model in Walworth watershed and Green Lake watershed with the upper and lower boundaries. (a) streamflow of Green Lake watershed; (b) TP loss of Green Lake watershed; (c) streamflow of Walworth watershed; (d) TP losses of Walworth watershed.

Figure 3.
Seasonal precipitation changes at the Green Lake watershed and Walworth watershed under the A2 scenarios. Boxes show median with the line within the box, the average with a square within the box, and the 25th percentile and 75th percentiles with the lines at the top and bottom of the box. Percent change is relative to the base period, with positive values indicating an increase. (left): Green Lake watershed, (right): Walworth watershed.

Figure 4.
Seasonal changes of air temperature at the Green Lake watershed and Walworth watershed under the A2 scenarios. (left): Green Lake watershed, (right): Walworth watershed.
Figure 4.
Seasonal changes of air temperature at the Green Lake watershed and Walworth watershed under the A2 scenarios. (left): Green Lake watershed, (right): Walworth watershed.

Figure 5.
Seasonal changes of streamflow at the Green Lake watershed and Walworth watershed under the A2 scenarios. (left): Green Lake watershed, (right): Walworth watershed.
Figure 5.
Seasonal changes of streamflow at the Green Lake watershed and Walworth watershed under the A2 scenarios. (left): Green Lake watershed, (right): Walworth watershed.

Figure 6.
Seasonal changes of TP losses at the Green Lake watershed and Walworth watershed under the A2 scenarios. (left): Green Lake watershed, (right): Walworth watershed.
Figure 6.
Seasonal changes of TP losses at the Green Lake watershed and Walworth watershed under the A2 scenarios. (left): Green Lake watershed, (right): Walworth watershed.

Figure 7.
Seasonal changes of nitrate-nitrogen (NO3-N) losses of the Green Lake watershed and the Walworth watershed under A2 scenario. (left): Green Lake watershed, (right): Walworth watershed.
Figure 7.
Seasonal changes of nitrate-nitrogen (NO3-N) losses of the Green Lake watershed and the Walworth watershed under A2 scenario. (left): Green Lake watershed, (right): Walworth watershed.


Table 1.
Cropland management in the Green Lake watershed and Walworth watershed. Includes dates of planting and harvesting, types of tillage, and the application of fertilizers.
Table 1.
Cropland management in the Green Lake watershed and Walworth watershed. Includes dates of planting and harvesting, types of tillage, and the application of fertilizers.
| Field Management | Green Lake Watershed | Walworth Watershed | ||
|---|---|---|---|---|
| Crop | Corn | Soybeans | Corn | Soybeans |
| Planting | 10 May | 25 May | 10 May | 25 May |
| Harvesting | 10 October | 30 Septmber | 6 October | 7 October |
| Tillage | Chisel plow 25 April | No till at planting | Chisel plow 25 April | No till at planting |
| Offset disk plow at planting 9 May | Offset disk plow at planting 9 May | |||
| Fertilizer Application | Green Lake Watershed | Walworth Watershed | ||
| Nitrogen fertilizer | Urea 46%(165 kg/ha)/Spring corn | Urea 46%(165 kg/ha)/Spring corn | ||
| Phosphorus Fertilizer | P2O5 (67 kg/ha)---corn P2O5 (56 kg/ha)---soy bean Fall applied | P2O5 (67 kg/ha)---corn P2O5 (56 kg/ha)---soy bean Fall applied | ||
Table 2.
Simulation performance metrics for streamflow, and total phosphorus for the Water Erosion Prediction Project-Water Quality (WEPP-WQ) model calibration.
Table 2.
Simulation performance metrics for streamflow, and total phosphorus for the Water Erosion Prediction Project-Water Quality (WEPP-WQ) model calibration.
| Green Lake Watershed | Calibration | Validation | ||||
| R2 | NSE | PBIAS | R2 | NSE | PBIAS | |
| Streamflow | 0.63 | 0.55 | 19.67% | 0.95 | 0.66 | 14.27% |
| TP | 0.66 | 0.50 | 2.97% | 0.82 | 0.69 | −18.12% |
| NO3-N | 0.98 | 0.72 | 1% | 0.98 | 0.77 | 6% |
| Walworth Watershed | Calibration | Validation | ||||
| R2 | NSE | PBIAS | R2 | NSE | PBIAS | |
| Streamflow | 0.73 | 0.57 | 7.50% | 0.73 | 0.57 | 6.0% |
| TP | 0.75 | 0.66 | 17.79% | 0.79 | 0.54 | 16.29% |
| NO3-N | 0.98 | 0.72 | 1% | 0.98 | 0.77 | 6% |
Table 3.
Annual average change in precipitation (percent change) and air temperature (°C) from the base (1996–2012) period for the Green Lake and Walworth watersheds for the three special report emission scenarios (SRES) scenarios: A2, A1B, and B1.
Table 3.
Annual average change in precipitation (percent change) and air temperature (°C) from the base (1996–2012) period for the Green Lake and Walworth watersheds for the three special report emission scenarios (SRES) scenarios: A2, A1B, and B1.
| Green Lake Watershed | Δ Annual Precipitation (%) | Δ Air Temperature (°C) | ||||
| A2 | A1B | B1 | A2 | A1B | B1 | |
| Early century | 9.3 | 4.0 | 6.9 | 1.2 | 0.9 | 0.8 |
| Middle century | 18.1 | 9.7 | 4.4 | 2.8 | 3.0 | 2.5 |
| Late century | 20.7 | 11.2 | 11.6 | 4.1 | 3.5 | 2.5 |
| Walworth Watershed | Δ Annual Precipitation (%) | Δ Air Temperature (°C) | ||||
| A2 | A1B | B1 | A2 | A1B | B1 | |
| Early century | 40.1 | 38.3 | 43.1 | 0.2 | 0.4 | −0.1 |
| Middle century | 8.4 | 0.1 | −2.6 | 1.8 | 1.1 | 1.2 |
| Late century | 12.4 | 2.6 | 5.2 | 4.2 | 3.4 | 1.9 |
Table 4.
Percent change of extreme precipitation intensity and frequency from the base period for the three future climate scenarios.
Table 4.
Percent change of extreme precipitation intensity and frequency from the base period for the three future climate scenarios.
| Green Lake Watershed | Δ Extreme Precipitation Intensity (%) | Δ Extreme Precipitation Frequency (%) | ||||
| A2 | A1B | B1 | A2 | A1B | B1 | |
| Early century | 13.5 | 5.6 | 8.1 | 10.5 | 5.5 | 7.9 |
| Middle century | 19.0 | 4.2 | 3.6 | 18.4 | 7.9 | 0.00 |
| Late century | 22.8 | 13.5 | 10.2 | 26.3 | 15.8 | 10.5 |
| Walworth Watershed | Δ Extreme Precipitation Intensity (%) | Δ Extreme Precipitation Frequency (%) | ||||
| A2 | A1B | B1 | A2 | A1B | B1 | |
| Early century | 12.5 | 11.4 | 9.9 | 14.2 | 14.3 | 12.0 |
| Middle century | 15.1 | 8.1 | 3.6 | 17.7 | 13.4 | 4.7 |
| Late century | 21.2 | 15.8 | 8.5 | 21.1 | 17.1 | 16.4 |
Table 5.
Percent change in the number of soil freeze and thaw cycles from the base period for three future climate scenarios.
Table 5.
Percent change in the number of soil freeze and thaw cycles from the base period for three future climate scenarios.
| Δ FT Cycles (%) | Green Lake Watershed | Walworth Watershed | ||||
|---|---|---|---|---|---|---|
| A2 | A1B | B1 | A2 | A1B | B1 | |
| Early century | 3.7 | −49.5 | 1.6 | 7.5 | 2.2 | 8.1 |
| Middle century | 8.8 | −32.6 | 2.0 | 29.4 | 27.8 | −13.6 |
| Late century | −0.7 | 0.00 | 0.5 | 8.5 | 12.7 | 36.7 |
Table 6.
Change percentage in annual streamflow (as a depth) and soil loss relative to the base period for three future climate scenarios.
Table 6.
Change percentage in annual streamflow (as a depth) and soil loss relative to the base period for three future climate scenarios.
| Green Lake Watershed | A2 | A1B | B1 | |||
|---|---|---|---|---|---|---|
| Δ Streamflow | mm | % | mm | % | mm | % |
| Early century | 20.5 | 10.0 | 25.9 | 13.3 | 28.6 | 14.9 |
| Middle century | 79.7 | 39.1 | 80.0 | 41.0 | 64.6 | 33.7 |
| Late century | 102.3 | 50.2 | 105.0 | 53.9 | 92.8 | 48.3 |
| Δ Soil loss | ton/ha | % | ton/ha | % | ton/ha | % |
| Early century | 0.7 | 54.7 | 0.3 | 20.6 | 0.4 | 43.4 |
| Middle century | 0.9 | 69.9 | 0.6 | 45.1 | 0.6 | 57.8 |
| Late century | 1.3 | 103.3 | 0.9 | 74.3 | 0.9 | 92.2 |
| Walworth Watershed | A2 | A1B | B1 | |||
| Δ Streamflow | mm | % | mm | % | mm | % |
| Early century | 54.9 | 40.7 | 33.8 | 24.3 | 43.7 | 31.2 |
| Middle century | 60.2 | 44.7 | 45.0 | 31.9 | 47.2 | 33.7 |
| Late century | 55.9 | 41.5 | 47.5 | 33.7 | 47.0 | 33.6 |
| Δ Soil loss | ton/ha | % | ton/ha | % | ton/ha | % |
| Early century | 1.0 | 41.2 | 0.8 | 36.6 | 0.8 | 35.0 |
| Middle century | 1.1 | 45.7 | 1.0 | 49.3 | 0.9 | 40.0 |
| Late century | 1.3 | 54.4 | 0.7 | 35.2 | 1.2 | 52.1 |
Table 7.
Change percentage in annual total phosphorus and NO3-N losses relative to the base period for three future climate scenarios.
Table 7.
Change percentage in annual total phosphorus and NO3-N losses relative to the base period for three future climate scenarios.
| Green Lake Watershed | A2 | A1B | B1 | |||
|---|---|---|---|---|---|---|
| ΔTP | kg/ha | % | kg/ha | % | kg/ha | % |
| Early century | 0.5 | 42.3 | 0.3 | 28.3 | 0.4 | 38.4 |
| Middle century | 0.6 | 53.9 | 0.5 | 44.1 | 0.5 | 41.1 |
| Late century | 1.0 | 89.0 | 0.8 | 75.2 | 0.8 | 71.5 |
| ΔNO3-N | kg/ha | % | kg/ha | % | kg/ha | % |
| Early century | 0.1 | 5.1 | 0.1 | 3.9 | 0.1 | 4.6 |
| Middle century | 0.7 | 26.5 | 1.0 | 38.1 | 0.8 | 29.8 |
| Late century | 0.5 | 17.5 | 0.03 | 1.1 | 0.7 | 27.8 |
| Walworth Watershed | A2 | A1B | B1 | |||
| ΔTP | kg/ha | % | kg/ha | % | kg/ha | % |
| Early century | 1.2 | 31.1 | 1.0 | 27.2 | 1.0 | 25.0 |
| Middle century | 3.1 | 81.1 | 3.3 | 87.5 | 2.8 | 71.8 |
| Late century | 4.2 | 108.9 | 3.7 | 96.4 | 4.2 | 105.9 |
| ΔNO3-N | kg/ha | % | kg/ha | % | kg/ha | % |
| Early century | 0.7 | 40.6 | 1.2 | 95.5 | 1.2 | 70.8 |
| Middle century | 0.2 | 12.4 | 0.6 | 44.5 | 0.1 | 8.0 |
| Late century | 0.7 | 40.6 | 0.7 | 52.5 | 1.2 | 68.2 |
Table 8.
The major influencing factors of NO3-N and total phosphorus (TP) losses.
| Green Lake Watershed | TP | NO3-N | ||||
|---|---|---|---|---|---|---|
| A2 | A1B | B1 | A2 | A1B | B1 | |
| Early century | C. * | C. | C. | P. * | P. | P. |
| Middle century | C. | C. | C. | C. | C. | C. |
| Late century | C. | C. | C. | E. * | E. | E. |
| Walworth Watershed | TP | NO3-N | ||||
| A2 | A1B | B1 | A2 | A1B | B1 | |
| Early century | P. | P. | P. | P. | P. | P. |
| Middle century | E. | E. | E. | E. | E. | E. |
| Late century | C. | C. | C. | C. | C. | C. |
Note: C*. denotes the combined effects of precipitation, extreme storm events, and air temperature; E. denotes the effects of extreme storm events; P*. denote the effects of precipitation quantity.
© 2018 by the authors. Licensee MDPI, Basel, Switzerland. This article is an open access article distributed under the terms and conditions of the Creative Commons Attribution (CC BY) license (http://creativecommons.org/licenses/by/4.0/).
Share and Cite
MDPI and ACS Style
Wang, L.; Flanagan, D.C.; Wang, Z.; Cherkauer, K.A. Climate Change Impacts on Nutrient Losses of Two Watersheds in the Great Lakes Region. Water 2018, 10, 442. https://doi.org/10.3390/w10040442
AMA Style
Wang L, Flanagan DC, Wang Z, Cherkauer KA. Climate Change Impacts on Nutrient Losses of Two Watersheds in the Great Lakes Region. Water. 2018; 10(4):442. https://doi.org/10.3390/w10040442
Chicago/Turabian StyleWang, Lili, Dennis C. Flanagan, Zhonggen Wang, and Keith A. Cherkauer. 2018. "Climate Change Impacts on Nutrient Losses of Two Watersheds in the Great Lakes Region" Water 10, no. 4: 442. https://doi.org/10.3390/w10040442
Note that from the first issue of 2016, this journal uses article numbers instead of page numbers. See further details here.