Analysis of Hydrochemical Characteristics and Three-Dimensional Fluorescence Spectra in the Semi-Arid Ebinur Lake Watershed, Xinjiang, China


1
Key Laboratory of Xinjiang Wisdom City and Environment Modelling, College of Resources and Environment Science, Xinjiang University, Urumqi 830046, China
2
Key Laboratory of Oasis Ecology, Xinjiang University, Urumqi 830046, China
*
Author to whom correspondence should be addressed.
Water 2018, 10(4), 426; https://doi.org/10.3390/w10040426
Submission received: 19 February 2018
/
Revised: 22 March 2018
/
Accepted: 29 March 2018
/
Published: 4 April 2018
Abstract
:Hydrochemical characteristics and three-dimensional fluorescence spectra for Lake Ebinur and its major inflow tributaries have been analyzed. The results indicate that Jing and Bortala River ions differ very little. Anions are composed of HCO3− > SO42− > Cl−, while cations have the following composition: Ca2+ > Mg2+ > Na+ > K+. The Jing and Bortala Rivers include mainly SO42− and HCO3− anions; these cations are primarily Ca2+. Hydrochemical components of the Jing and Bortala Rivers are of the HCO3−-Ca2+ type. Ion compositions of the Jing and Bortala Rivers are derived primarily from the weathering of rocks. In addition, a parallel factor method (PARAFAC) analysis of three-dimensional fluorescence spectra (EEM) of the Jing and Bortala Rivers shows that all the sampled water bodies contain C1 (260/420 nm) humic organic matter, C2 (240, 240/490 nm), C3 (220/280, 300/450 nm) protein-like C4 (260, 270/530 nm), and humic substances. To further understand characteristics of dissolved organic matter (DOM) components, we base our research on regional standards related to water quality and fluorescence. A fluorescence regional integration (FRI) analysis of the Jing and Bortala Rivers shows that protein organic matter levels are the highest, whereas fulvic acid levels are the lowest. Of the correlation coefficients of hydrochemical factors and fluorescence indices, the biological index (BIX), TDS, HCO3−, and K+ are stronger in major inflow tributaries of Ebinur Lake with correlation coefficients of 0.577, 0.708, and 0.764, respectively, at the p < 0.01 significance level; correlations between the humification index (HIX) and HCO3− concentrations amount to 0.568 at the p < 0.05 significance level. Hydrochemical factors and fluorescence indices show the presence of three fitting relationships. While the HIX and HCO3− fitting effect is strongest with a correlation coefficient of 0.789, the second strongest is that of BIX and K+ with a correlation coefficient of 0.814. The results of this work offer scientific support for water quality monitoring and restoration in arid regions of Central Asia.
1. Introduction
Rivers serve as the first sources of water resources for cultivated land. With economic development, rivers decrease in size because of farmland irrigation. In addition, the productivity of farm crops is related to water quality levels. Generally, the investigation of river water quality levels considers salt content, sodium ions, alkalinity levels, anions, and other elements. Every year, the salinization of soil across the globe leads to losses of soil fertility [1,2]. It is important to understand the classification and formation of chemical compositions of water and to evaluate water quality levels by analyzing salt content and changes in anions and cations in river water. Hydrochemistry is the science of studying the chemical compositions and internal chemical changes of natural water bodies [3]. A river, as a channel that connects land to the sea, is an important source of material and energy cycling. A river’s water chemistry composition characteristics are influenced by geological characteristics, climatic characteristics, human activities, biogeochemical behaviors of elements, etc. [4,5,6]. In turn, water chemistry characteristics can also affect the economic and social development of a basin through the water–environment–food-grain–health transfer chain [7]. Foreign scholars started to conduct systematic research on the chemical characteristics of surface water earlier on. In 1970, Gibbs [8] adopted total dissolved solids (TDS) and the relationship between cations and the cation concentration ratio. He also systematically described differences in water chemistry characteristics of the world's major watersheds resulting from precipitation, rock weathering, and evaporation–crystallization processes. Water fluorescence is also central to understanding water environments. Understanding the structure of dissolved organic matter (DOM) in water is central to understanding the water environment. At present, the fluorescence spectra of different rivers can be analyzed by fluorescence spectroscopy. Fluorescence spectrometry is efficient, is highly sensitive, offers a low detection limit, can be applied to small samples, and does not damage sample structures [9].
In recent years, with the development of fluorescence spectrum technologies, the synchronous rapid scanning of excitation and emission wavelengths has been discovered, and a three-dimensional excitation-emission fluorescence spectrum has been produced. Three-dimensional fluorescence spectroscopy presents potential applications for the water quality monitoring of large lakes and rivers. Related research was performed abroad early on and has undergone rapid development and application. The fluorescence spectrum technique can be used to quickly analyze water quality levels in a timely fashion. In addition, it can achieve good results, such as those of [10], revealing DOM characteristics of rivers, lakes, groundwater, seas and sewage and in evaluating and estimating surface water quality levels [11,12,13,14]. Several scholars have identified five fluorescence feature peaks for characterizing DOM structures in water bodies. In recent years, many researchers have used conventional methods such as regional integrals, parallel factors, and self-organizing neural networks to characterize the structure of DOM. However, hydrochemical characteristics of water directly reflect the water salinization; the salt cations are the main chemicals that characterize the salinization, and they lead to the salinization of water; thus, studying the anions and cations with fluorescence index is the novelty of this study.
The Ebinur Lake Watershed is located at the lowest elevation point of the Junggar Basin of the Xinjiang Uyghur Autonomous Region in China. The lake is a terminal lake fed by the Bortala, Akeqisu, Jing, Tuotuo, and Daheyanzi Rivers, which present water ecological safety problems. The region is a typical arid area of Central Asia. The ecological environment has been extremely fragile in arid areas of Northwest China in recent years. With the increasing intensity and range of human activities, the discharge of anthropogenic pollutants has been increasing the pollution of oasis rivers and sediments [15]. Because of the water reduction of Boltara River, Jing River, and other rivers, the area of Ebinur Lake declined substantially, the water level decreased, the water became salty, the water quality was polluted, and the average mineralization degree was high, which significantly affected the ecological environment, water quality salinization, and lake degradation. However, the Bortala and Jing Rivers are the most important Major Inflow Tributaries of Ebinur Lake in the Ebinur Lake Watershed. The two rivers not only play an important role in the ecological environment of the Ebinur Lake National Nature Reserve but also provide agricultural water to surrounding areas such as the Bole and Jinghe counties, which play a decisive role in the development of oasis agricultural systems. Therefore, current and future conditions, surface river pollution identification, river water pollution monitoring, basic research, surface water resource regeneration, and sustainable resource use have important implications for the improvement of ecological river environments and for maintaining the structure and function of this ecosystem.
Thus, in this study, we examine the Central Asian arid area of the Bortala and Jing Rivers through multiple analyses and by applying the Gibbs method combined with the three-dimensional fluorescence technique. The objectives of this study are as follows: (1) to analyze the hydrochemical characteristics in the Jing and Bortala Rivers, (2) to perform an analysis of fluorescence components using the parallel factor method and using the EEM Regional integration to quantify spectra for DOM, and (3) to discuss relationships between water chemical factors and fluorescence indices. This study not only explores the hydrochemical and three-dimensional fluorescence characteristics of surface water of Ebinur Lake but may also be applied to measure water quality levels and resources of other surface rivers in arid regions of Central Asia.
2. Materials and Methods
2.1. Description of the Study Area
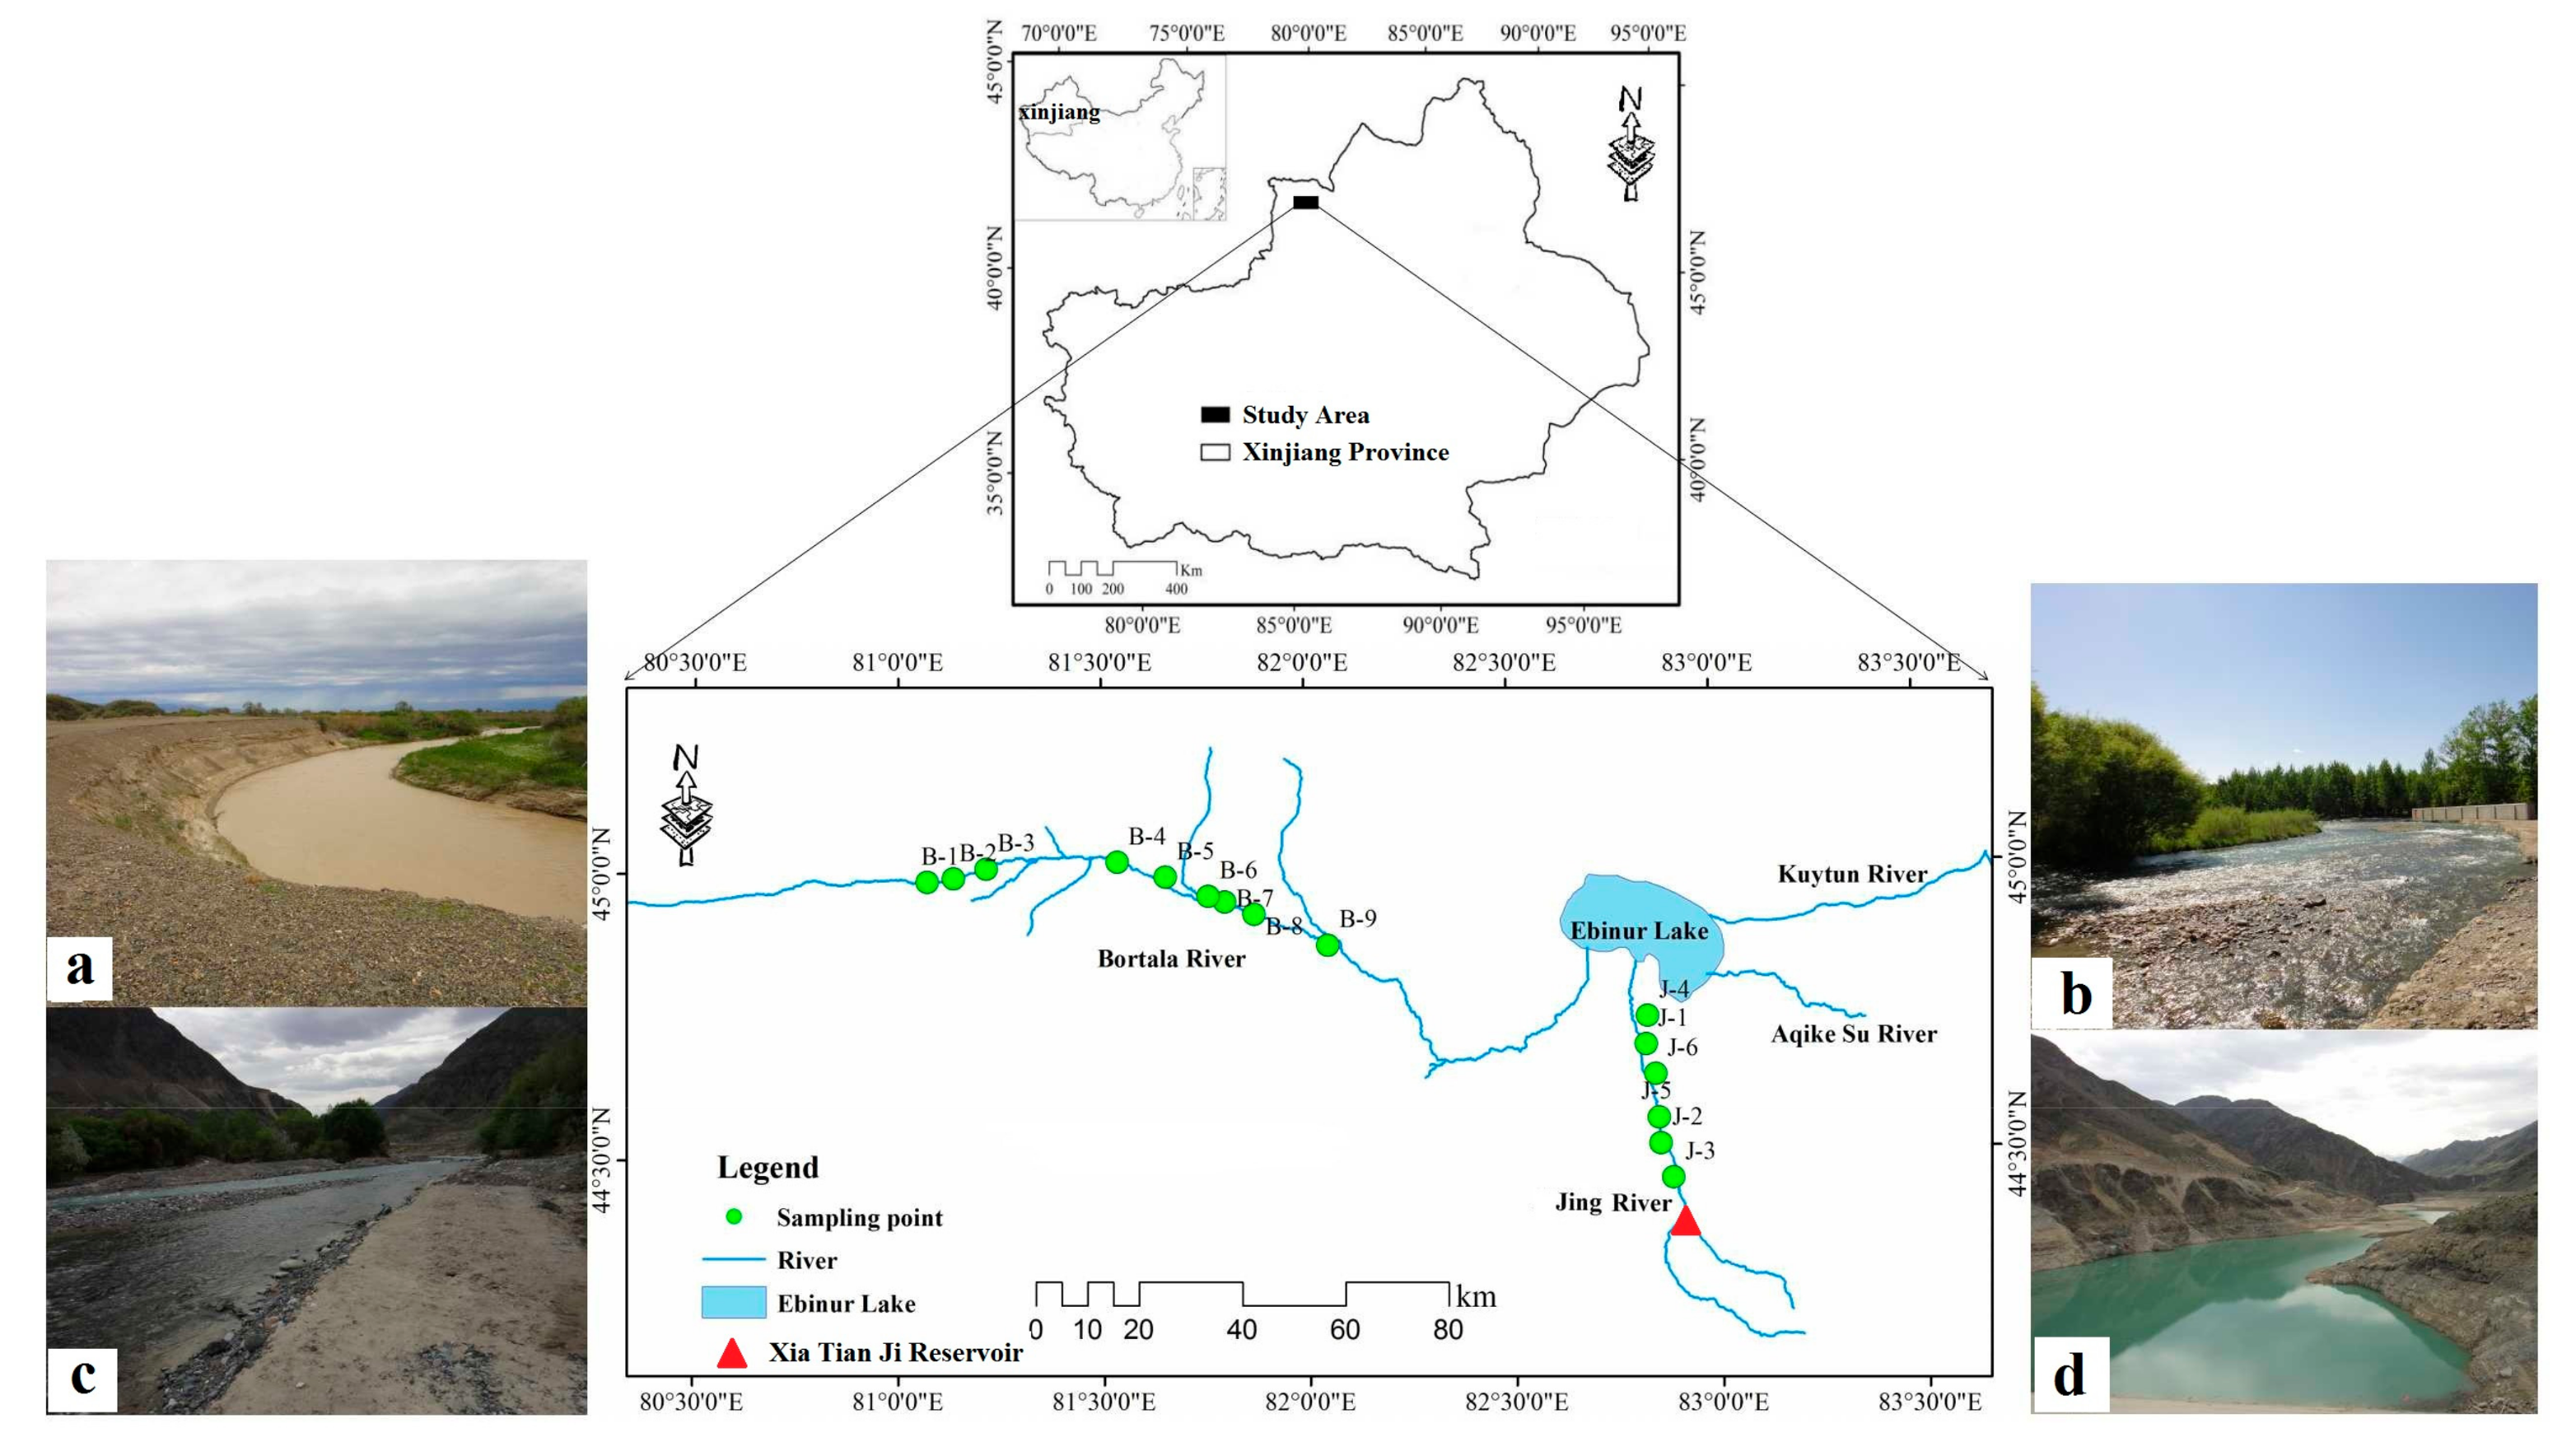
Ebinur Lake is the largest saltwater lake in Xinjiang. The lake is located at the center of the Junggar Basin far from the sea, and water vapor reaches the lake with difficulty, as the water source for the study area is positioned far from the Atlantic Ocean [16]. Ebinur Lake receives water from the Kuytun, Aqike Su, Jing, Dayanzi, and Bortala Rivers. Due to changes in the local climate in recent decades, inflows of river runoff into the lake have declined each year. Annual runoff from the Kuytun, Aqike Su, and Dayanzi Rivers has been decreasing each year; however, as the main rivers enter the lake, the annual runoff of the Jing and Bortala Rivers varies only slightly. Therefore, the Jing and Bortala Rivers were selected as our research objects. As is shown in Figure 1, the Bortala and Jing River Basins are located along the southwest edge of the Junggar Basin, which is in the Bortala Autonomous Prefecture of Mongolia between 79°53′–83°53′ E and 44°00′–45°23′ N. The eastern part is positioned adjacent to Ta Cheng Prefecture, and the southern part is positioned adjacent to the city of Yining. The Bortala and Jing River Basins are surrounded by mountains to the west, south, and north; in the center is a narrow valley with an eastern edge connected to the Junggar Basin. The area includes mountains, valleys, basins, and three other landform units. The altitude of the basin gradually decreases to approximately 196–300 m at the surface of Ebinur Lake. The basin consists of piedmont alluvial and transition zones, a central lacustrine plain, and a lake.
2.2. Data Collection
Water samples were collected from the Jing and Bortala Rivers in the Ebinur Lake Watershed on 29 March 2016, and the longitude and latitude coordinates of each sample were recorded synchronously by GPS. Locations of all sampling points referred to in this study are shown on the map in Figure 1. Sampling points were usually selected to be as close as practicable to the foot of each tributary’s catchment. The Boltara River and Jing River sampling sites were chosen to be roughly equidistant down the river. In all cases, care was taken to collect samples from the free flowing river rather. All water samples were collected at 0–15 cm depth of river surface [15]. Water samples were refrigerated at a temperature of less than 4 °C. TDS, HCO3−, Cl−, SO42−, Mg2+, Ca2+, K+, and Na+ hydrochemical factors were measured immediately in the laboratory (Table 1).
2.3. Fluorescence Spectra
All water samples were filtered through cellulose acetate fiber filters (Millipore, 0.22-micron membrane, (Aqucell Membrane Technology Company, WuHan, China) to reduce the effects of ionic strength on fluorescence intensity levels. Fluorescence spectra were acquired using a Hitachi fluorescence spectrophotometer (F-7000, Hitachi High-Technology Corp, Tokyo, Japan). The fluorescence spectrophotometer was equipped with a 150-W xenon arc lamp (Hitachi High-Technology Corp, Tokyo, Japan) as a light source and with two grating monochromators coupled with a slit as EEM wavelength selectors. The scanning speed was set to 60,000 nm/min. Therefore, each measurement period was 2 min in duration. EEMs were measured every 10 nm over an excitation range of 200–450 nm and with an emission range of 200–550 nm. MilliQ water EEMs were used as blanks and were subtracted from each sample EEM. Emission and excitation correction files generated by the Fluoromax manufacturer were applied to each MilliQ-subtracted sample EEM. Intensities were standardized to a Raman emission peak at 395 nm following a suggestion made by Cui et al. [17]. All the spectra were corrected using blank space.
2.4. Analysis Methods
2.4.1. The Parallel Factor Method
The parallel factor method (PARAFAC) [18,19] is based on the three-linear decomposition theory, an iterative three-dimensional array decomposition algorithm using alternating least squares; a three-dimensional array X consisting of multiple EEM data is decomposed into three load matrices, and the three-dimensional fluorescence spectra of DOM are resolved into three linear models as follows:
where Xijk is the intensity of the three-way data array for the ith sample at the emission wavelength j and excitation wavelength k, aif is directly proportional to the concentration of the f three-way data array of the I sample (defined as scores), bjf and ckf are estimates of the three-way data, F represents the number of components in the model, and εijk is the residual element representing variability not accounted for by the model [20].
2.4.2. The Fluorescence Regional Integration Method
The fluorescence regional integration (FRI) approach involves calculating the specific volume (Φi,n) and whole area standard volume (ΦT,n) by determining the specific area standard volume and reflecting the content and relative content of fluorescent substances with specific structures in the corresponding area [21,22].
where ∆λex is the excitation wavelength interval, ∆λem is the emission wavelength interval, I(λex, λem) is the intensity of fluorescence corresponding to excitation and emission wavelengths, respectively, and Pi,n is the relative content of fluorescent substances.
MFi is the multiplying factor: Domain I: 20.4; Domain II: 16.4; Domain III: 4.81; Domain IV: 8.76; Domain V: 1.76.
2.5. Data Analysis and Processing
The sample test indicators include TDS, HCO3−, Cl−, SO42−, Mg2+, Ca2+, K+, and Na+. These were measured using the national standard method. Origin8.0 (OriginLab Corporation, Hampton, NH, USA) software was used to analyze hydrochemical characteristics. We analyzed three-dimensional fluorescence via the PARAFAC and FRI methods using MATLAB 2012a (Mathworks, Natick, MA, USA) equipped with the DOMFluor toolbox (http://www.models.life.ku.dk).
3. Results and Analysis
3.1. Hydrochemical Characteristic Analysis
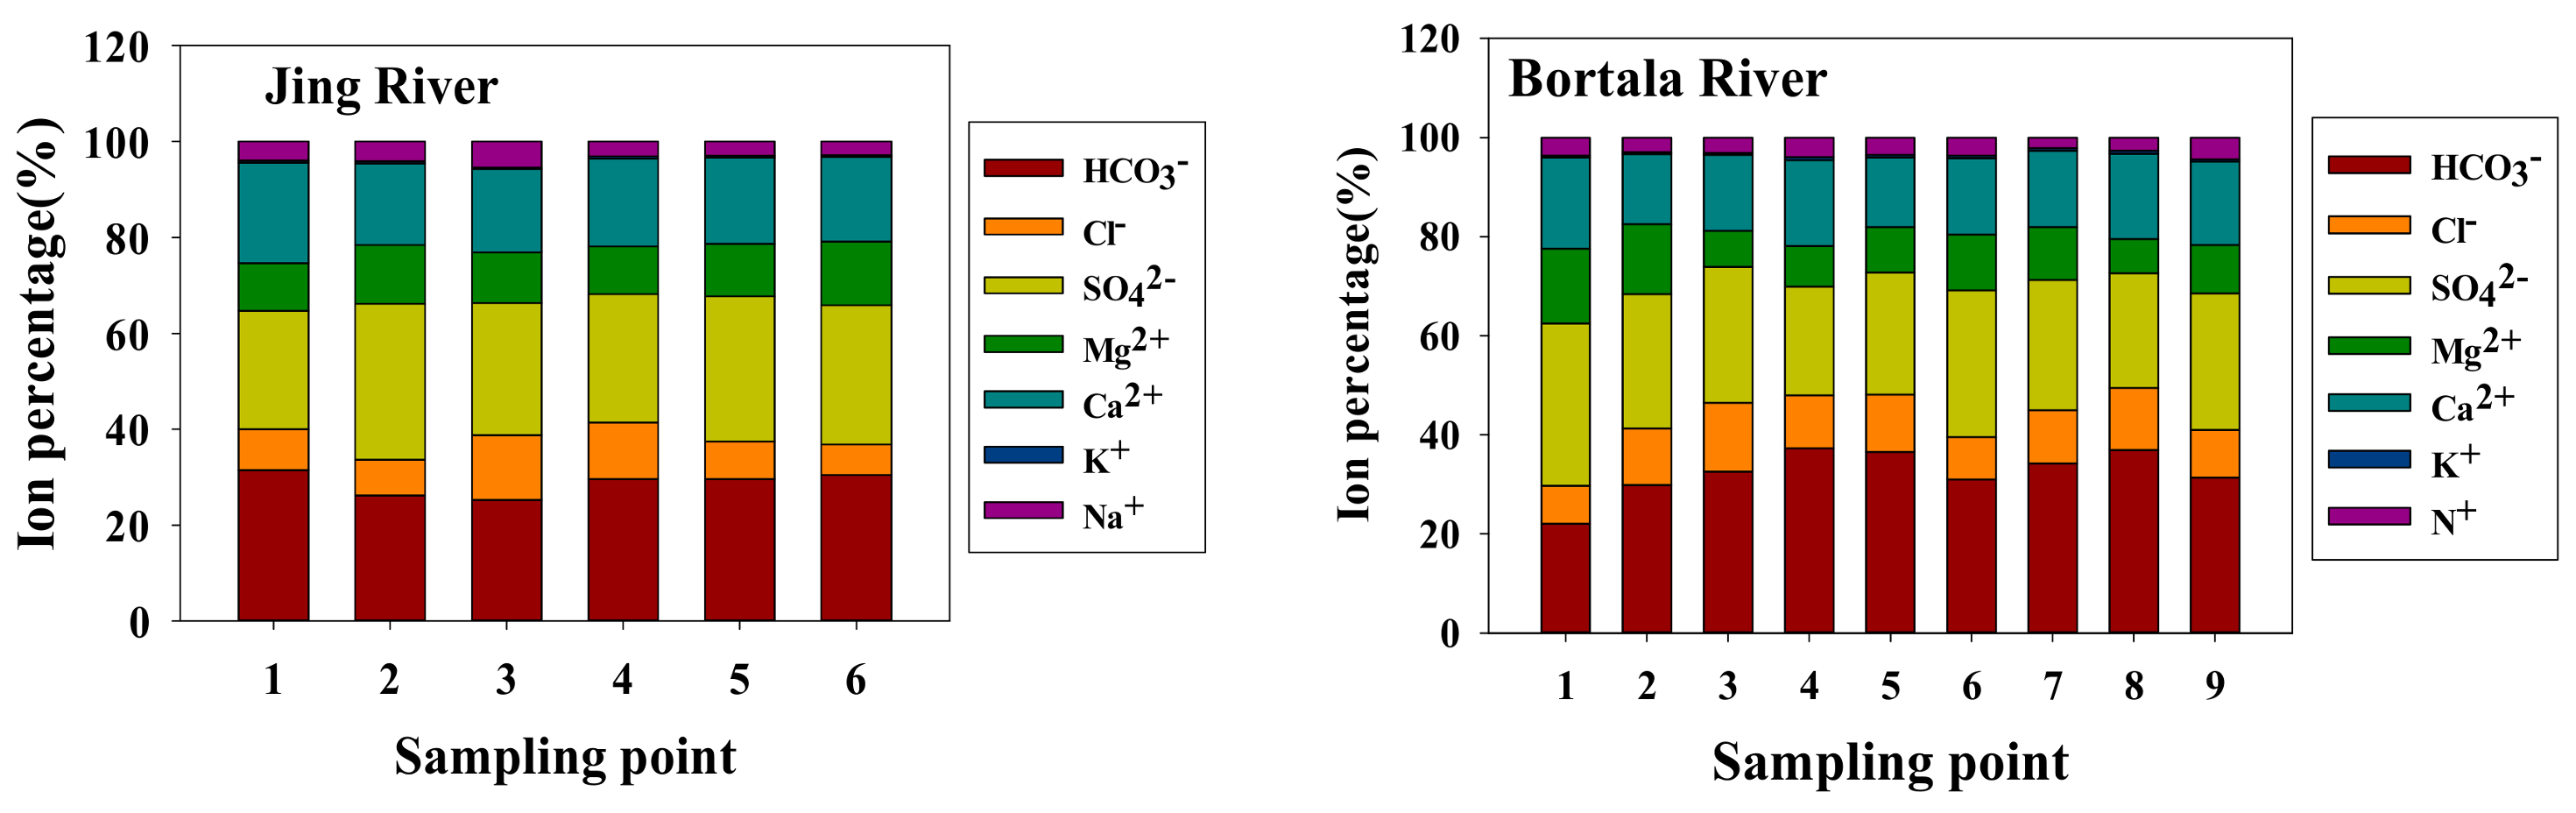
Average values of TDS for the Jing and Bortala Rivers are 518.88 mg/L and 516.66 mg/L, respectively. According to the range of TDS values, water can be divided into fresh water (0–1000 mg/L), slightly saline water (1000–3000 mg/L), moderately saline water (3000–10,000 mg/L), saline water (10,000–35,000 mg/L), and salt brine water (more than 35,000 mg/L) [23,24]. According to the river water data, the Bortala and Jing Rivers contain fresh water. The results of anion and cation concentration analyses of the Jing and Bortala Rivers are shown in Table 2 and Figure 2. As is shown in Table 1, anion contents of the Jing and Bortala Rivers include [HCO3−] > [SO42−] > [Cl−], and cation contents include [Ca2+] > [Mg2+] > [Na+] > [K+]. As is shown in Figure 2, the main anions found in the Bortala River are SO42− and HCO3−. Of these, HCO3− is the main anion in the Bortala River, accounting for approximately 40% of the total anion molar number, followed by SO42−, with Cl− content levels being the lowest (average value of only approximately 10%). The main cations of Bortala River water are Ca2+, which accounts for more than 45% of the total molar number of cations. The range of change is 45–60% followed by Mg2+ ions at approximately 30%. K+ content levels are low, ranging from approximately 0.9–2%, as the river water mostly contains material weathered from rocks on both sides of the river. Annual erosion results in an increase in Ca2+ and Mg2+ content levels in the river water. The water supply source of the Bortala and Jing Rivers is snowmelt from the Tian Shan. Snowmelt serves as an ample fresh water supply source for the Bortala and Jing Rivers, meaning that water salinity levels do not rise easily, and K+ and Na+ content levels are low.
3.1.1. Analysis of Water Chemistry Characteristics and Ion Combination Ratios
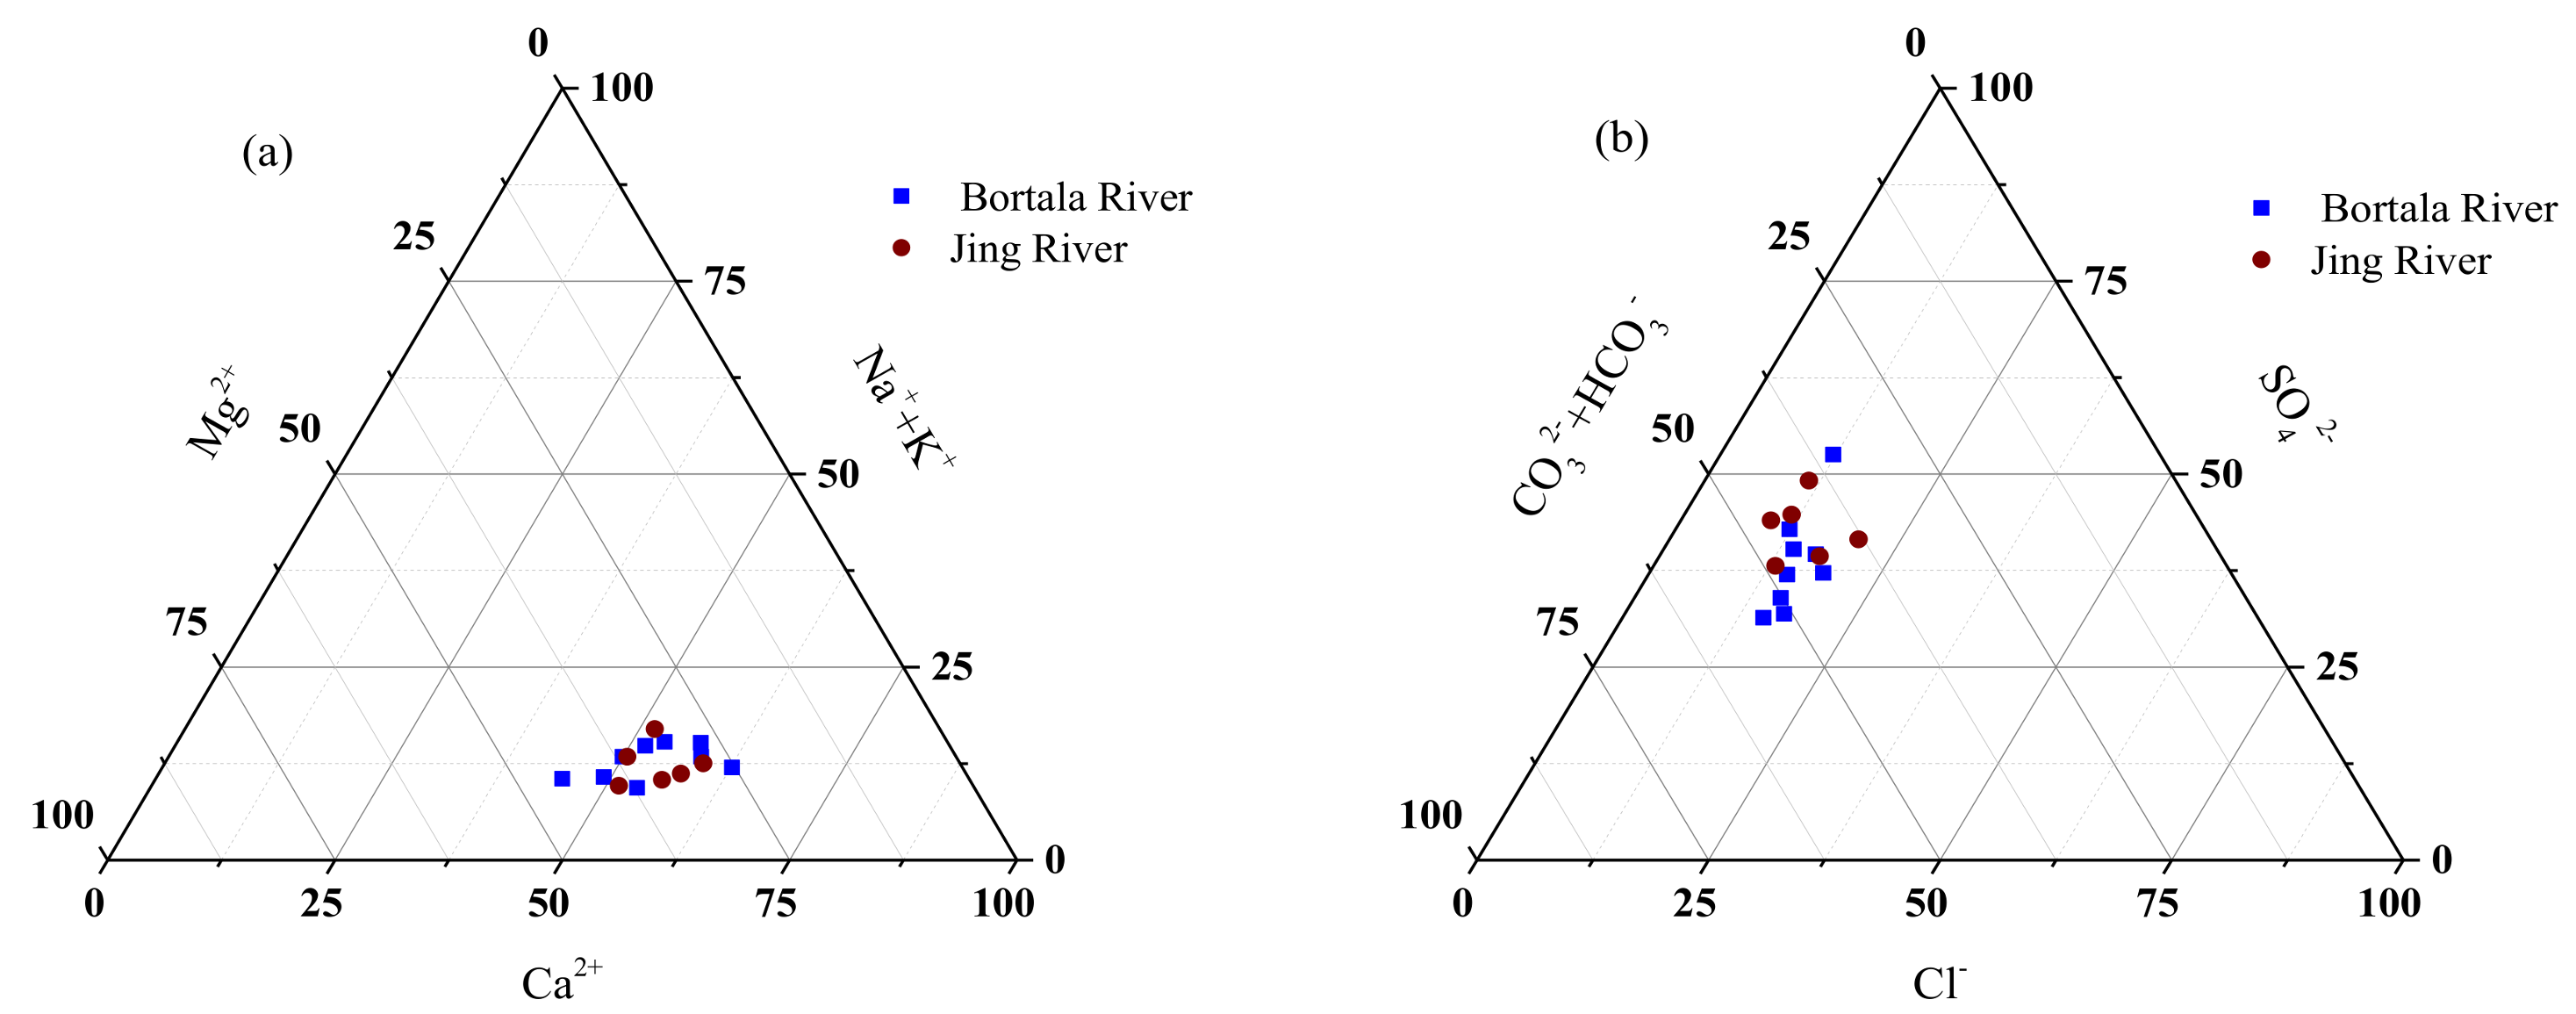
Anion and cation triangle diagrams directly reflect the relative content and distribution of major ions in water and thereby divide water bodies of hydrochemical types [25]. Figure 3 shows that anions in the water samples are mainly distributed in the middle of CO32− + HCO3−. HCO3− content in the Bortala and Jing Rivers accounts for 37.5–62.5% and 43.75–56.25% of all anions, respectively. Cations are mainly located to the middle left of the Ca2+ side (Figure 3). Ca2+ content in the Bortala and Jing Rivers accounts for 37.5–62.5% and 50–68.75% of all cations, respectively. Anions in the Bortala and Jing Rivers fall to one end of the CO32− + HCO3− side, while cationic components fall to one end of the Ca2+ side. The chemical composition of water in the rivers is mainly affected by the weathering of carbonate rocks; HCO3− is generally supplied by the atmosphere, through the weathering of CO2 silicates in soil, or by dissolved carbonates. This result may be related to the weathering of carbonate rocks along hills in the northwest of Bortala, CO2 produced by anthropogenic factors is related to precipitation entering the channel. The order of anion content in the study area is [HCO3−] > [SO42−] > [Cl−], and cation content is [Ca2+] > [Mg2+] > [Na+] > [K+]. On a hydrochemical level, the Bortala and Jing Rivers are both characterized by the HCO3−-Ca2+ type. Figure 3a,b show cations and anions of the Jing and Bortala Rivers, respectively.
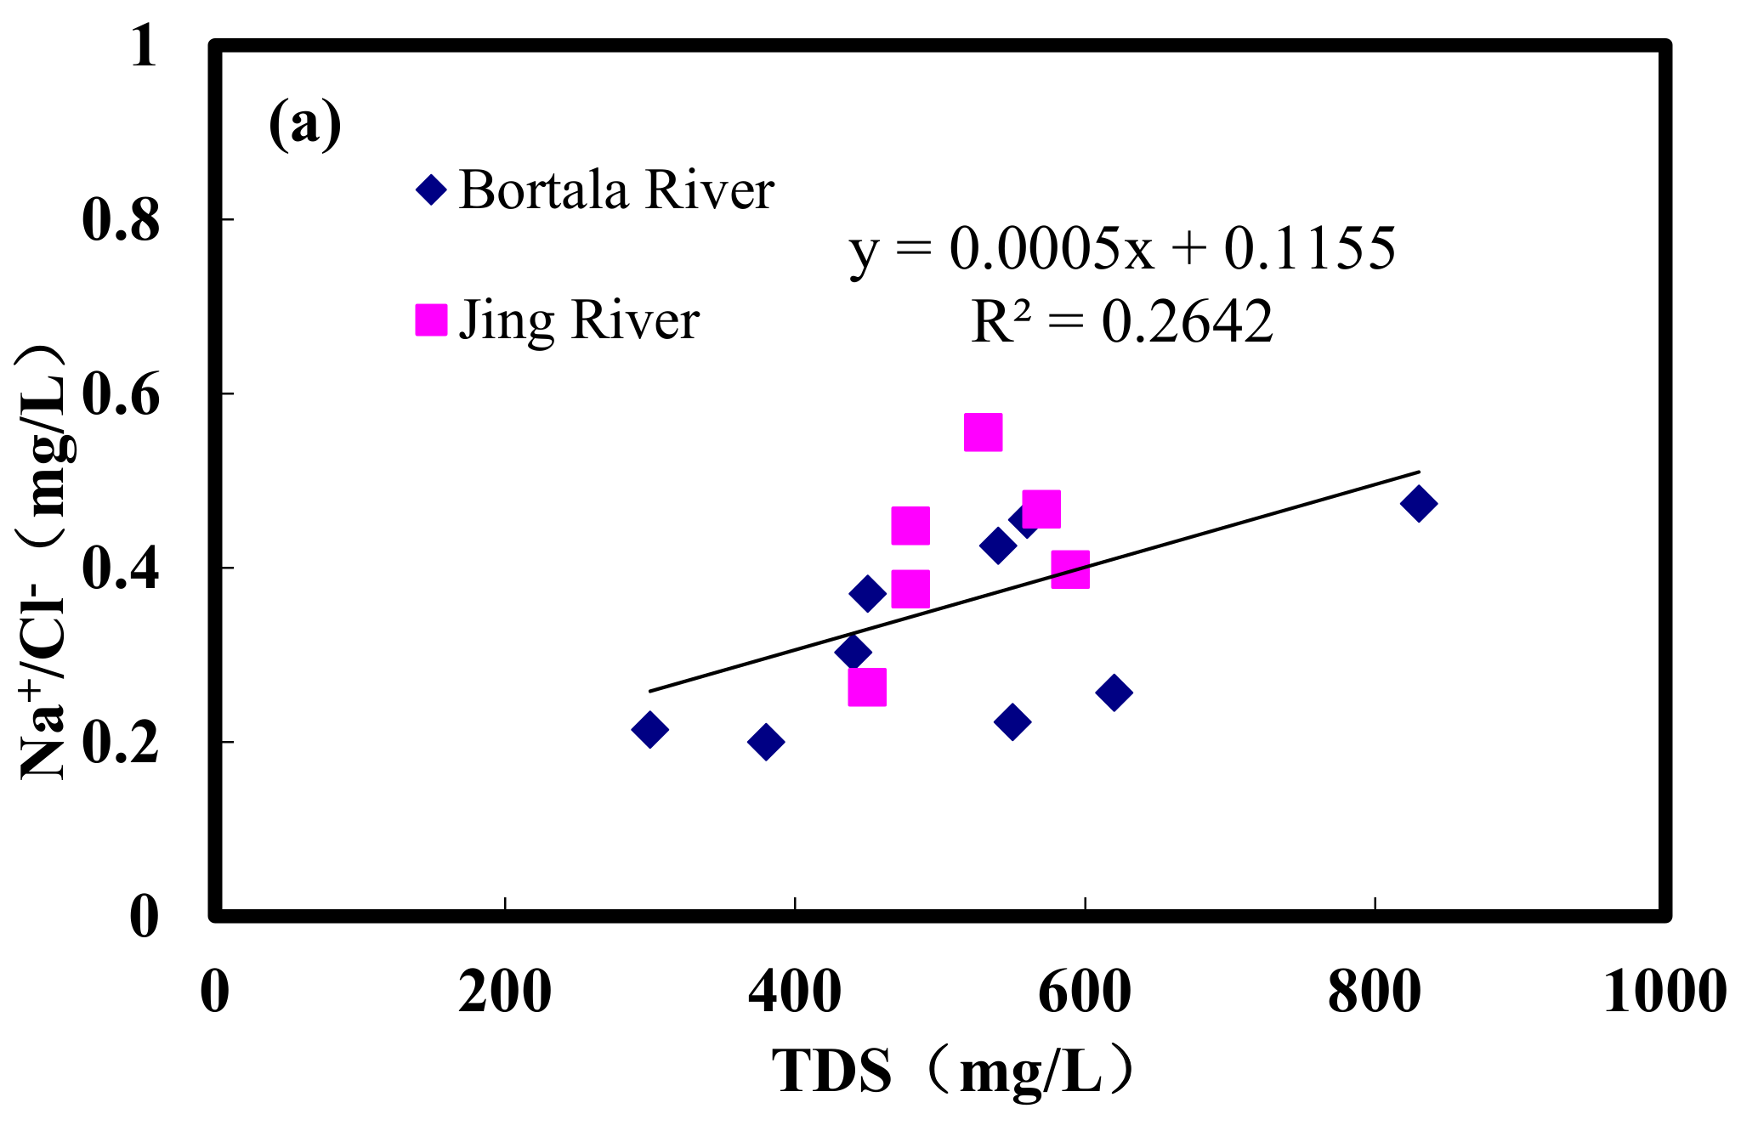
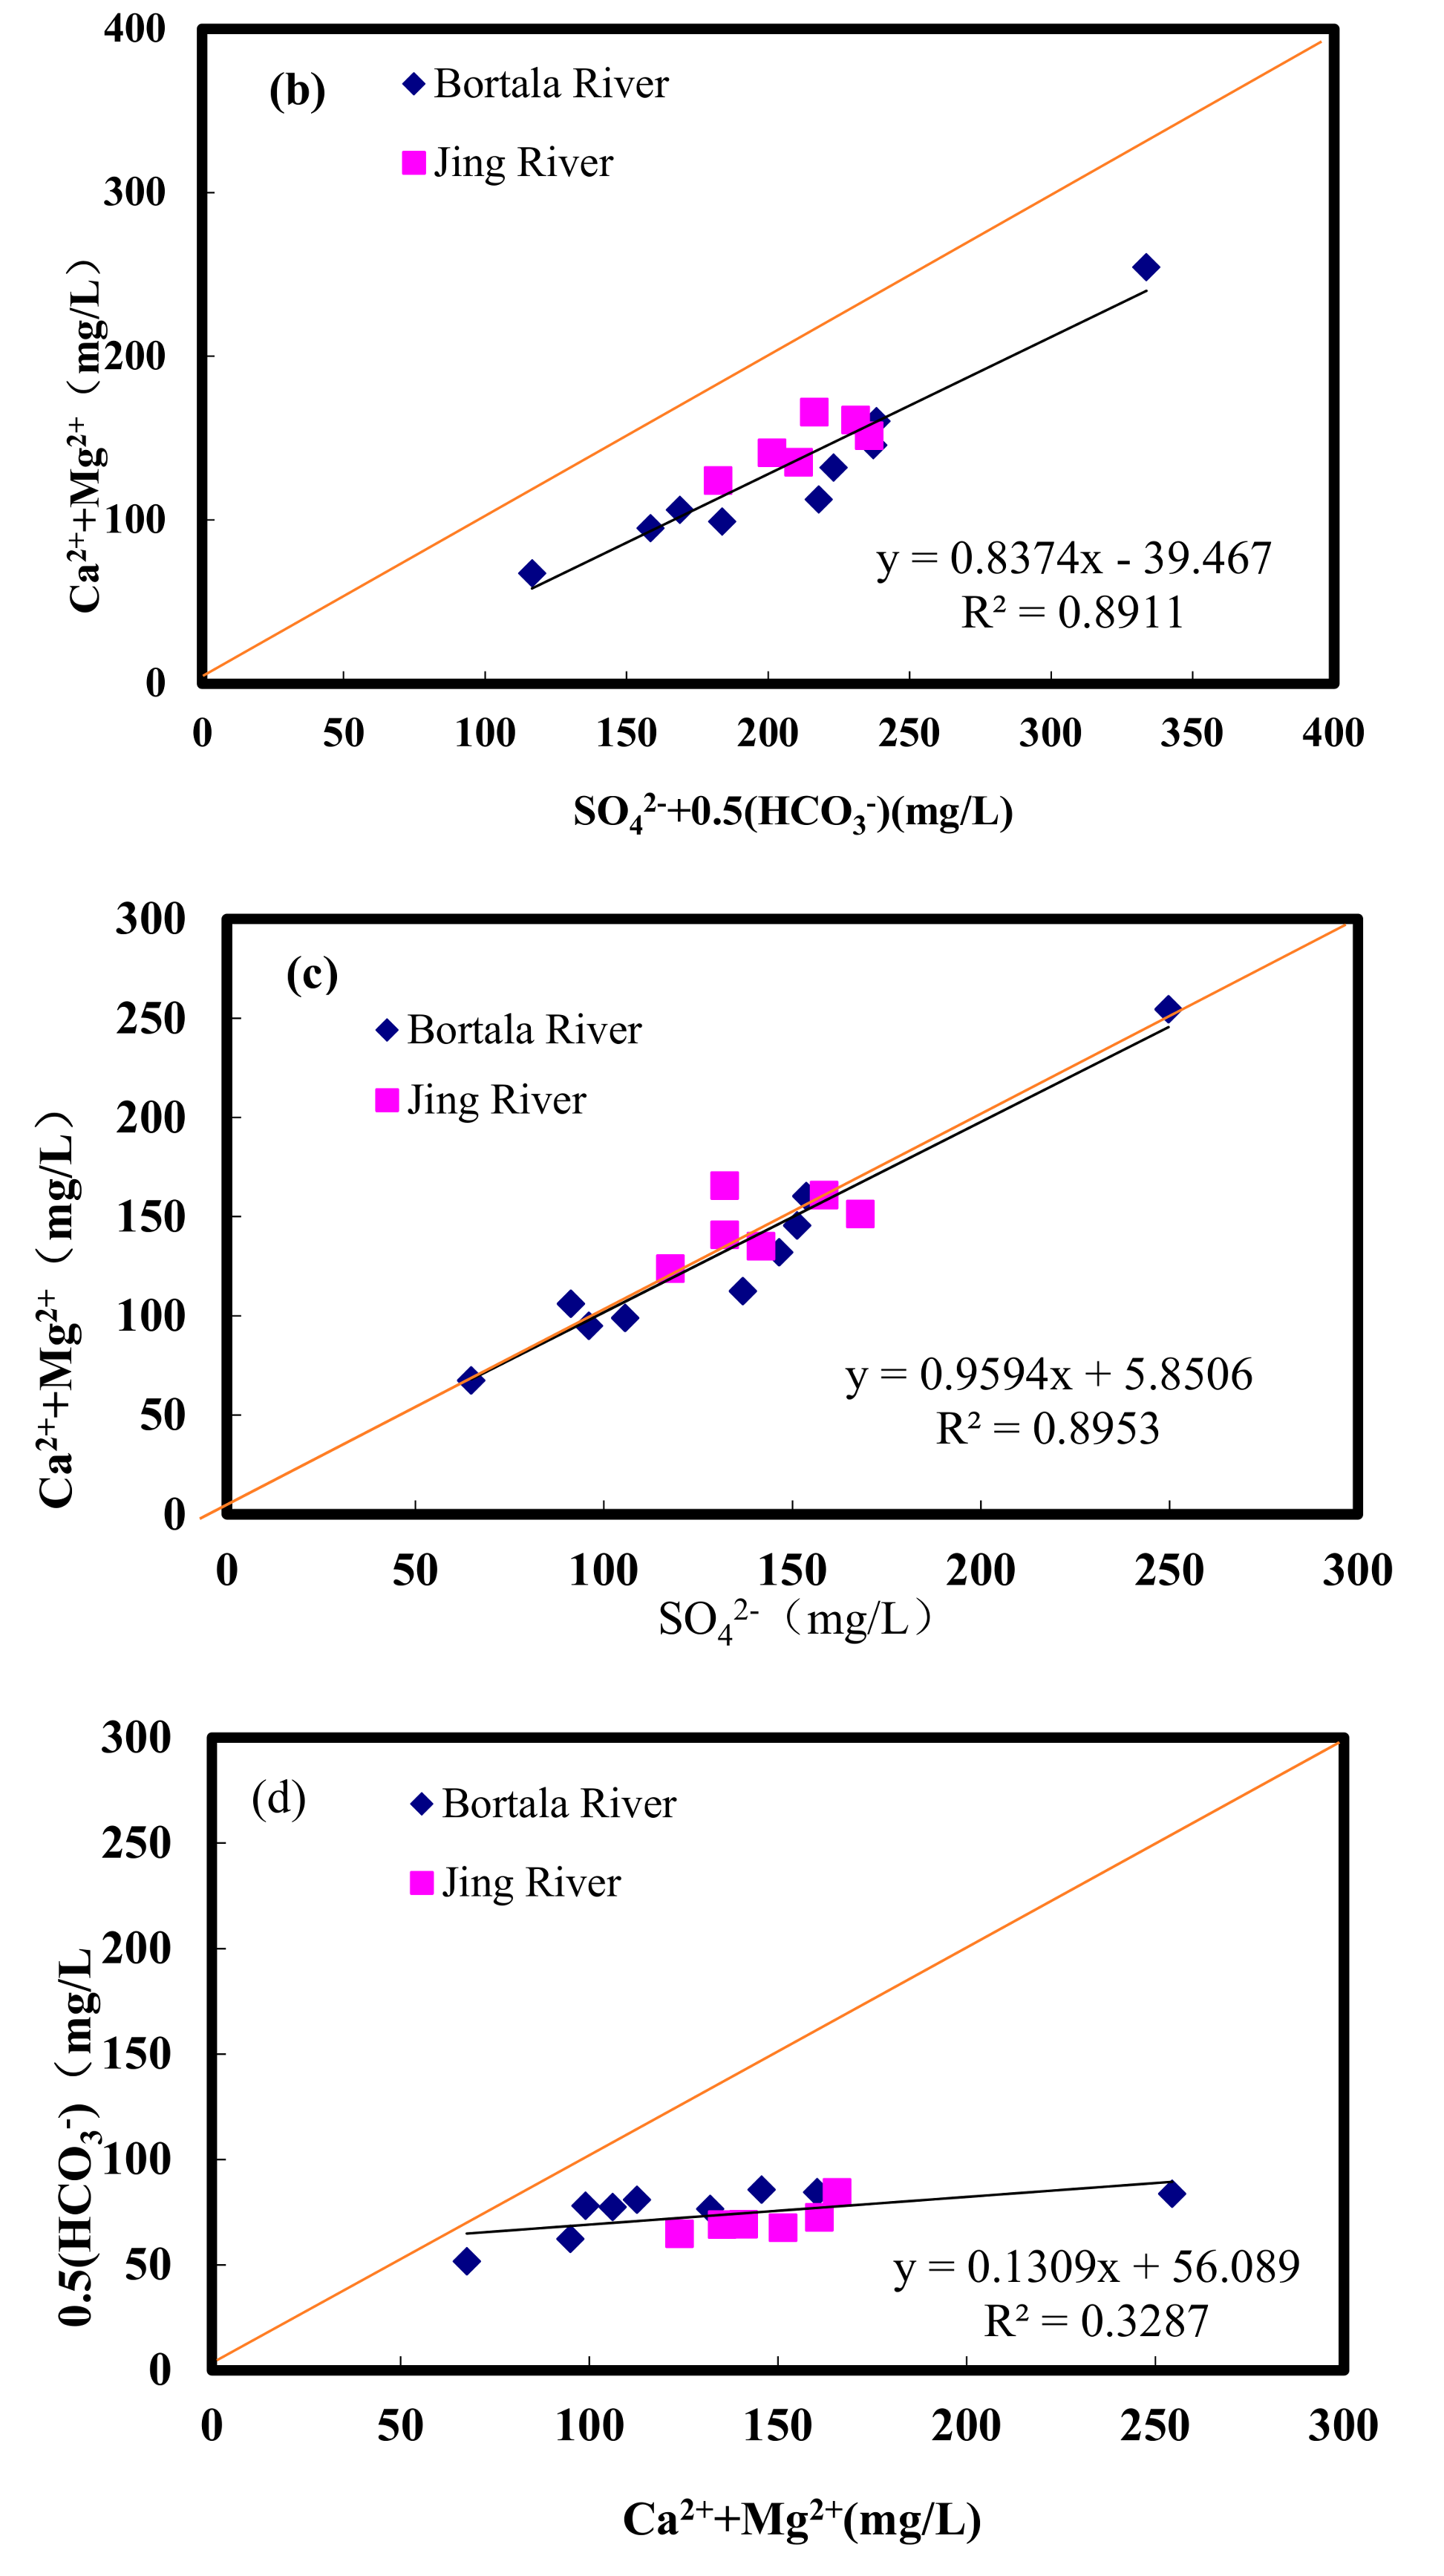
The ion combination ratio can be used to investigate the formation of water chemistry, the formation of ions, and the source of ions [26]. Cl− is relatively stable in underground water, and ρ(Na+)/ρ(Cl−) is used to reveal the source of Na+; when ρ(Na+)/ρ(Cl−) = 1, Na+ and K+ are generated from rock salt dissolution. Figure 4a shows that, with an increase in TDS levels, Bortala and Jing River ρ(Na+)/ρ(Cl−) ratios increase but remain less than 1, while Na+ is the only product of dissolved salt rock for the Bortala and Jing Rivers. If [ρ(Ca2+) + ρ(Mg2+)]/[ρ(SO42−) + 0.5ρ(HCO3−)] < 1, then Ca2+ and Mg2+ in groundwater are derived primarily from carbonate and sulfate dissolution, and there are other sources [26]. Figure 4b shows that the Bortala and Jing River samples fall below the [ρ(Ca2+) + ρ(Mg2+)]/[ρ(SO42−) + 0.5ρ(HCO3−)] = 1 line level. The dissolution of carbonate and sulfate is not the only source of Ca2+ and Mg2+ in the Bortala and Jing Rivers, thus denoting the alternate adsorption of these cations. When the [ρ(Ca2+) + ρ(Mg2+)]/ρ(SO42−) ratio is less than 1, Ca2+, Mg2+, and SO42− originate from the dissolution of sulfate. From Figure 4c, it can be observed that, in the Bortala and Jing Rivers, relatively more water falls along the [ρ(Ca2+) + ρ(Mg2+)]/ρ(SO42−) = 1 line and in its vicinity. This result shows that the dissolution of sulfate is not the only source of surface water Ca2+, Mg2+, and SO42− in the Bortala and Jing Rivers. When [ρ(Ca2+) + ρ(Mg2+)]/ρ(SO42−) > 1, there are other sources of Ca2+ and Mg2+ such as the dissolution of carbonate. When [ρ(Ca2+) + ρ(Mg2+)]/ρ(SO42−) < 1, there are other sources of SO42− such as pyrite oxidation. When [ρ(Ca2+) + ρ(Mg2+)]/0.5ρ(HCO3−) = 1, Ca2+, Mg2+, and HCO3− originate mainly from carbonate dissolution [26]. Figure 4d shows that the Bortala and Jing River surface water samples [ρ(Ca2+) + ρ(Mg2+)]/0.5ρ(HCO3−) have values of less than 1. The dissolution of carbonate is not the only source of surface water Ca2+, Mg2+, and HCO3− in the Bortala and Jing Rivers; HCO3− has other sources such as the removal of sulfuric acid.
According to the typical ion combination ratio analysis, the chemical environment of surface water in the Bortala and Jing Rivers is relatively complex due to being affected by conditions of regional geology. The formation of chemical constituents of surface water of the Bortala and Jing Rivers mainly originates from pyrite oxidation, carbonate and sulfate dissolution, cation alternate adsorption, and sulfuric acid removal.
3.1.2. Analysis of Water Chemical Compositions by Rock End Element Control
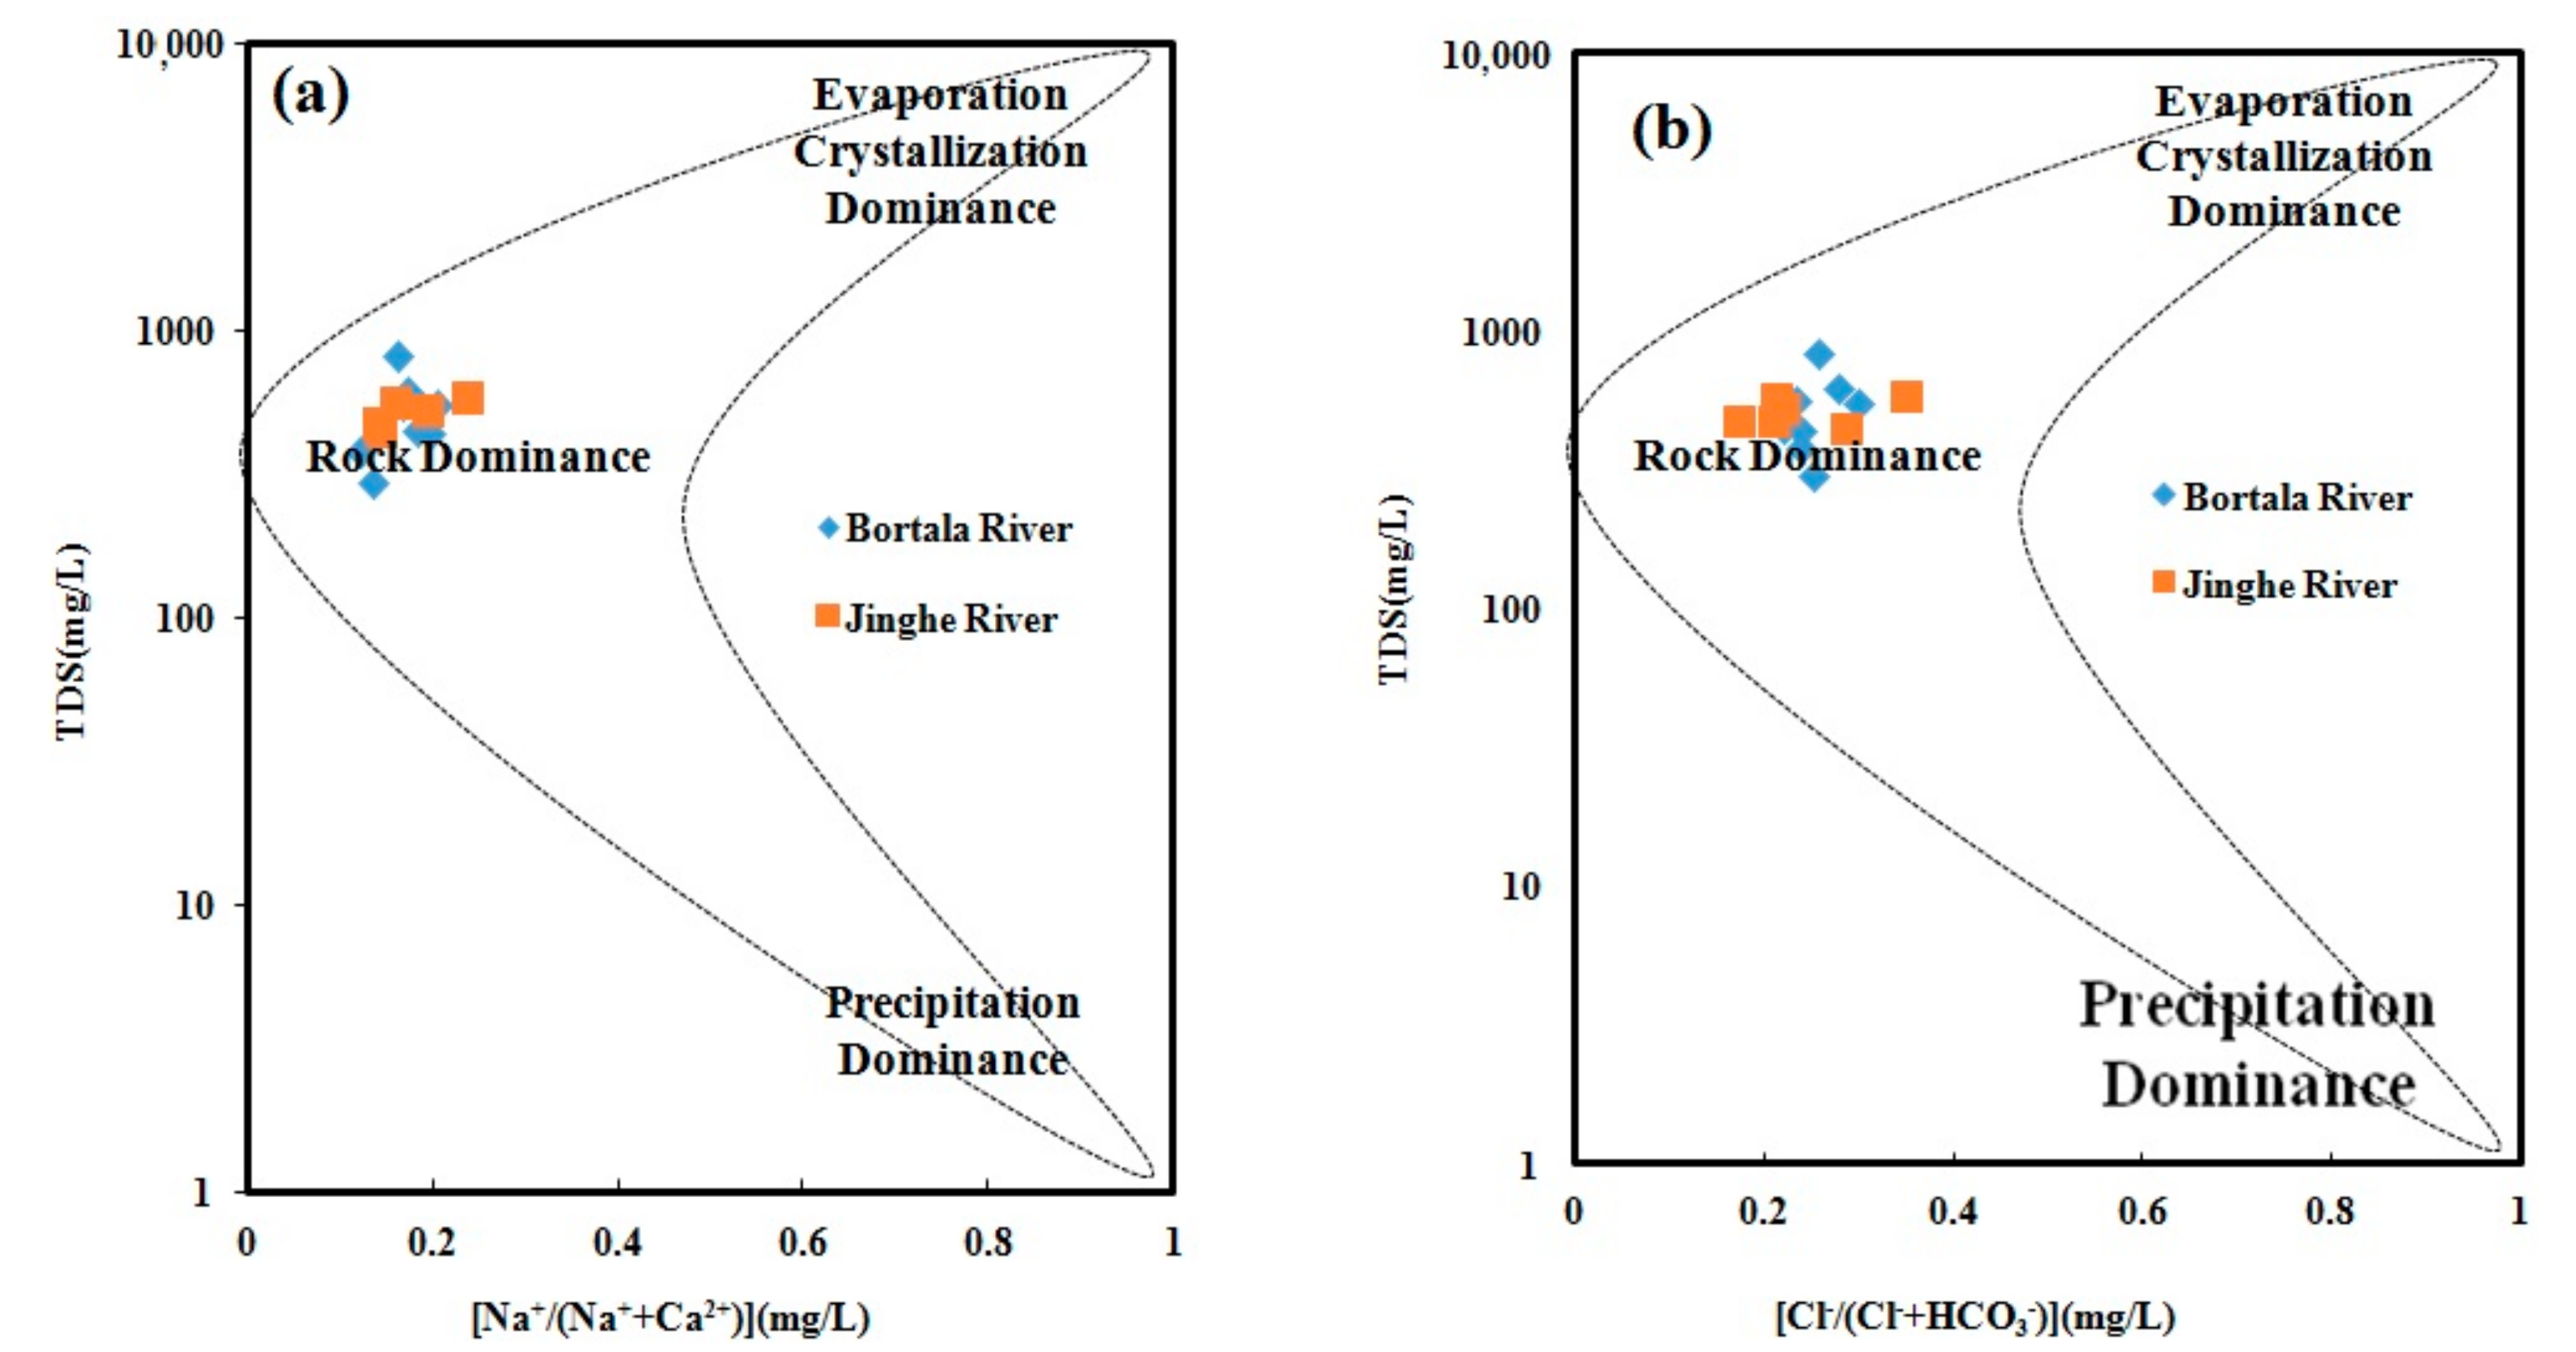
Hydrochemical types of rivers are determined by the distribution of major anions and cations, while the content of anions and cations is controlled by various solute input elements. Therefore, solute input elements determine the hydrochemical composition of a river. The model of water quality developed by Gibbs can effectively show the main control processes shaping water chemical compositions in the basin [27]. According to the model using the TDS and Na+/(Na+ + Ca2+) and Cl−/(Cl− + HCO3−) diagrams, hydrochemical compositions are divided into four types: seawater, evaporation and crystallization, rock weathering, and atmospheric precipitation (Figure 5). Almost all ratios of ionic components of the world's major rivers, lakes, and marine water bodies fall between the dotted lines in the figure.
Hydrochemical data for the Bortala and Jing River sampling points are plotted in the Gibbs diagram. Figure 5 shows that most of the water samples drawn from the Bortala River and Jinghe fall within a Cl−/(Cl− + HCO3−) range of 0.1–0.4. The figure shows that ion composition is mainly derived from rock weathering but does not exclude a certain proportion from derived from evaporation and crystallization control. This result is consistent with reports on rivers such as the Wujiang River in Southern China. However, for slightly different rivers in the northwestern arid area of the Tarim River Basin and Daihai Lake, the river is controlled by evaporation and crystallization to a certain extent [28] Na+/(Na+ + Ca2+) ratios of water samples drawn from the Bortala River are very similar to those of the Jing River, and corresponding hydrochemical characteristics are similar to those of Dongjiang, which is related to the lithology of the two flowing areas. To summarize, the dominant mechanism of the natural origins of ions in the Bortala and Jing Rivers is affected by evaporation, crystallization, and rock weathering, and inputs from atmospheric precipitation are very weak.
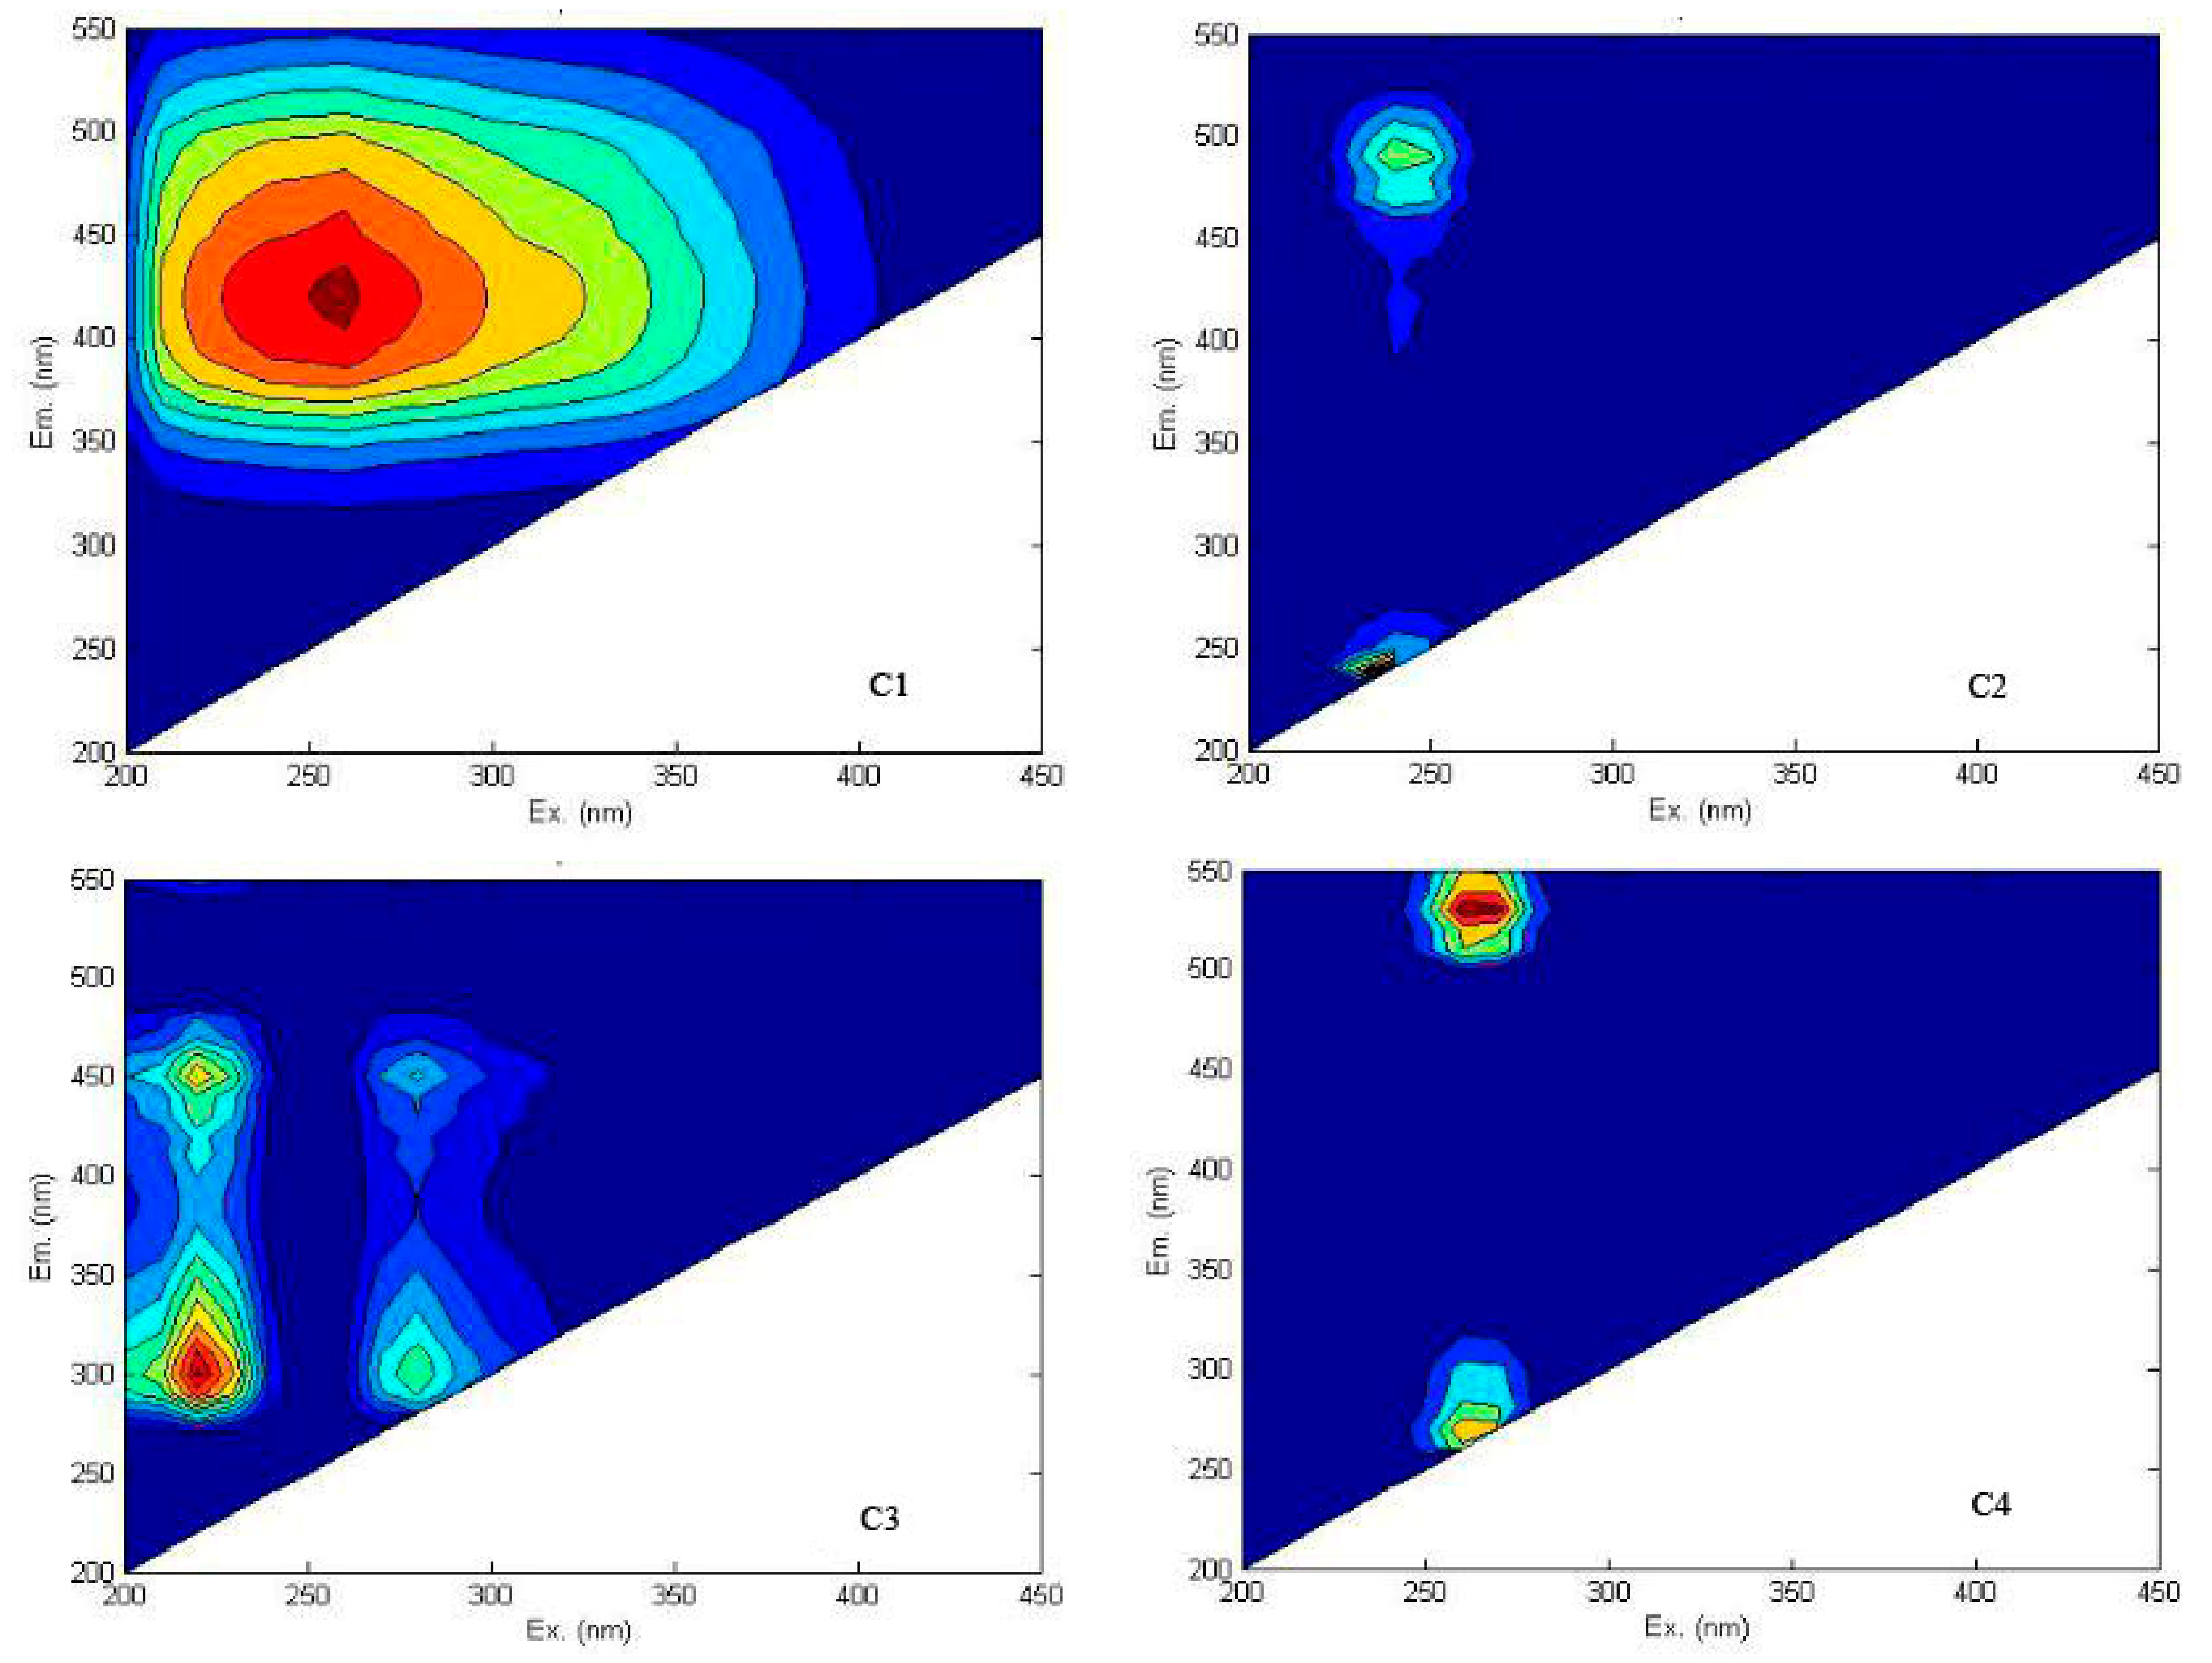
In this study, the PARAFAC is used to address the three-dimensional fluorescence spectra of the Jing and Bortala Rivers. The results show that the four components of the PARAFAC model can be deconstructed into a set of model analyses of all the fluorescence EEM data. Figure 6 shows each contour profile of the three PARAFAC components: “microbial humic-like” (C1 260/420 nm) [28,29], “terrestrial humic-like organic substances” (C2(240/240, 240/490 nm) [30], C4(260/270, 260/530 nm)) [30], and “protein-like organic substances” (C3(220/300, 220/450, 280/300, 280/450 nm)) [31,32]. As is shown in Table 3, the fluorescence peak (C1) of the parallel factor model at (Ex/Em) = 260/420 nm is equivalent to Peak A of the traditional fluorescence model. The C2 show two peaks at (Ex/Em) = 240/490 nm and (Ex/Em) = 280/300 nm. C3 shows four peaks at (Ex/Em) = 220/300 nm, (Ex/Em) = 240/240 nm, (Ex/Em) = 220/450 nm, and (Ex/Em) = 280/450 nm. According to this analysis, the number of fluorescence peaks found in the Jing and Bortala Rivers is the same, and there are certain similarities.
Although our research is similar to that of Wang et al. [14], we found the peaks (Ex/Em-240/240; 260/270) to be arid characteristic fluorescence peaks and that similar fluorescence peaks have not been found, denoting a close relationship between water environments in arid areas.
3.2. Distribution of EEM Regional Integration to Quantify Spectra for DOM
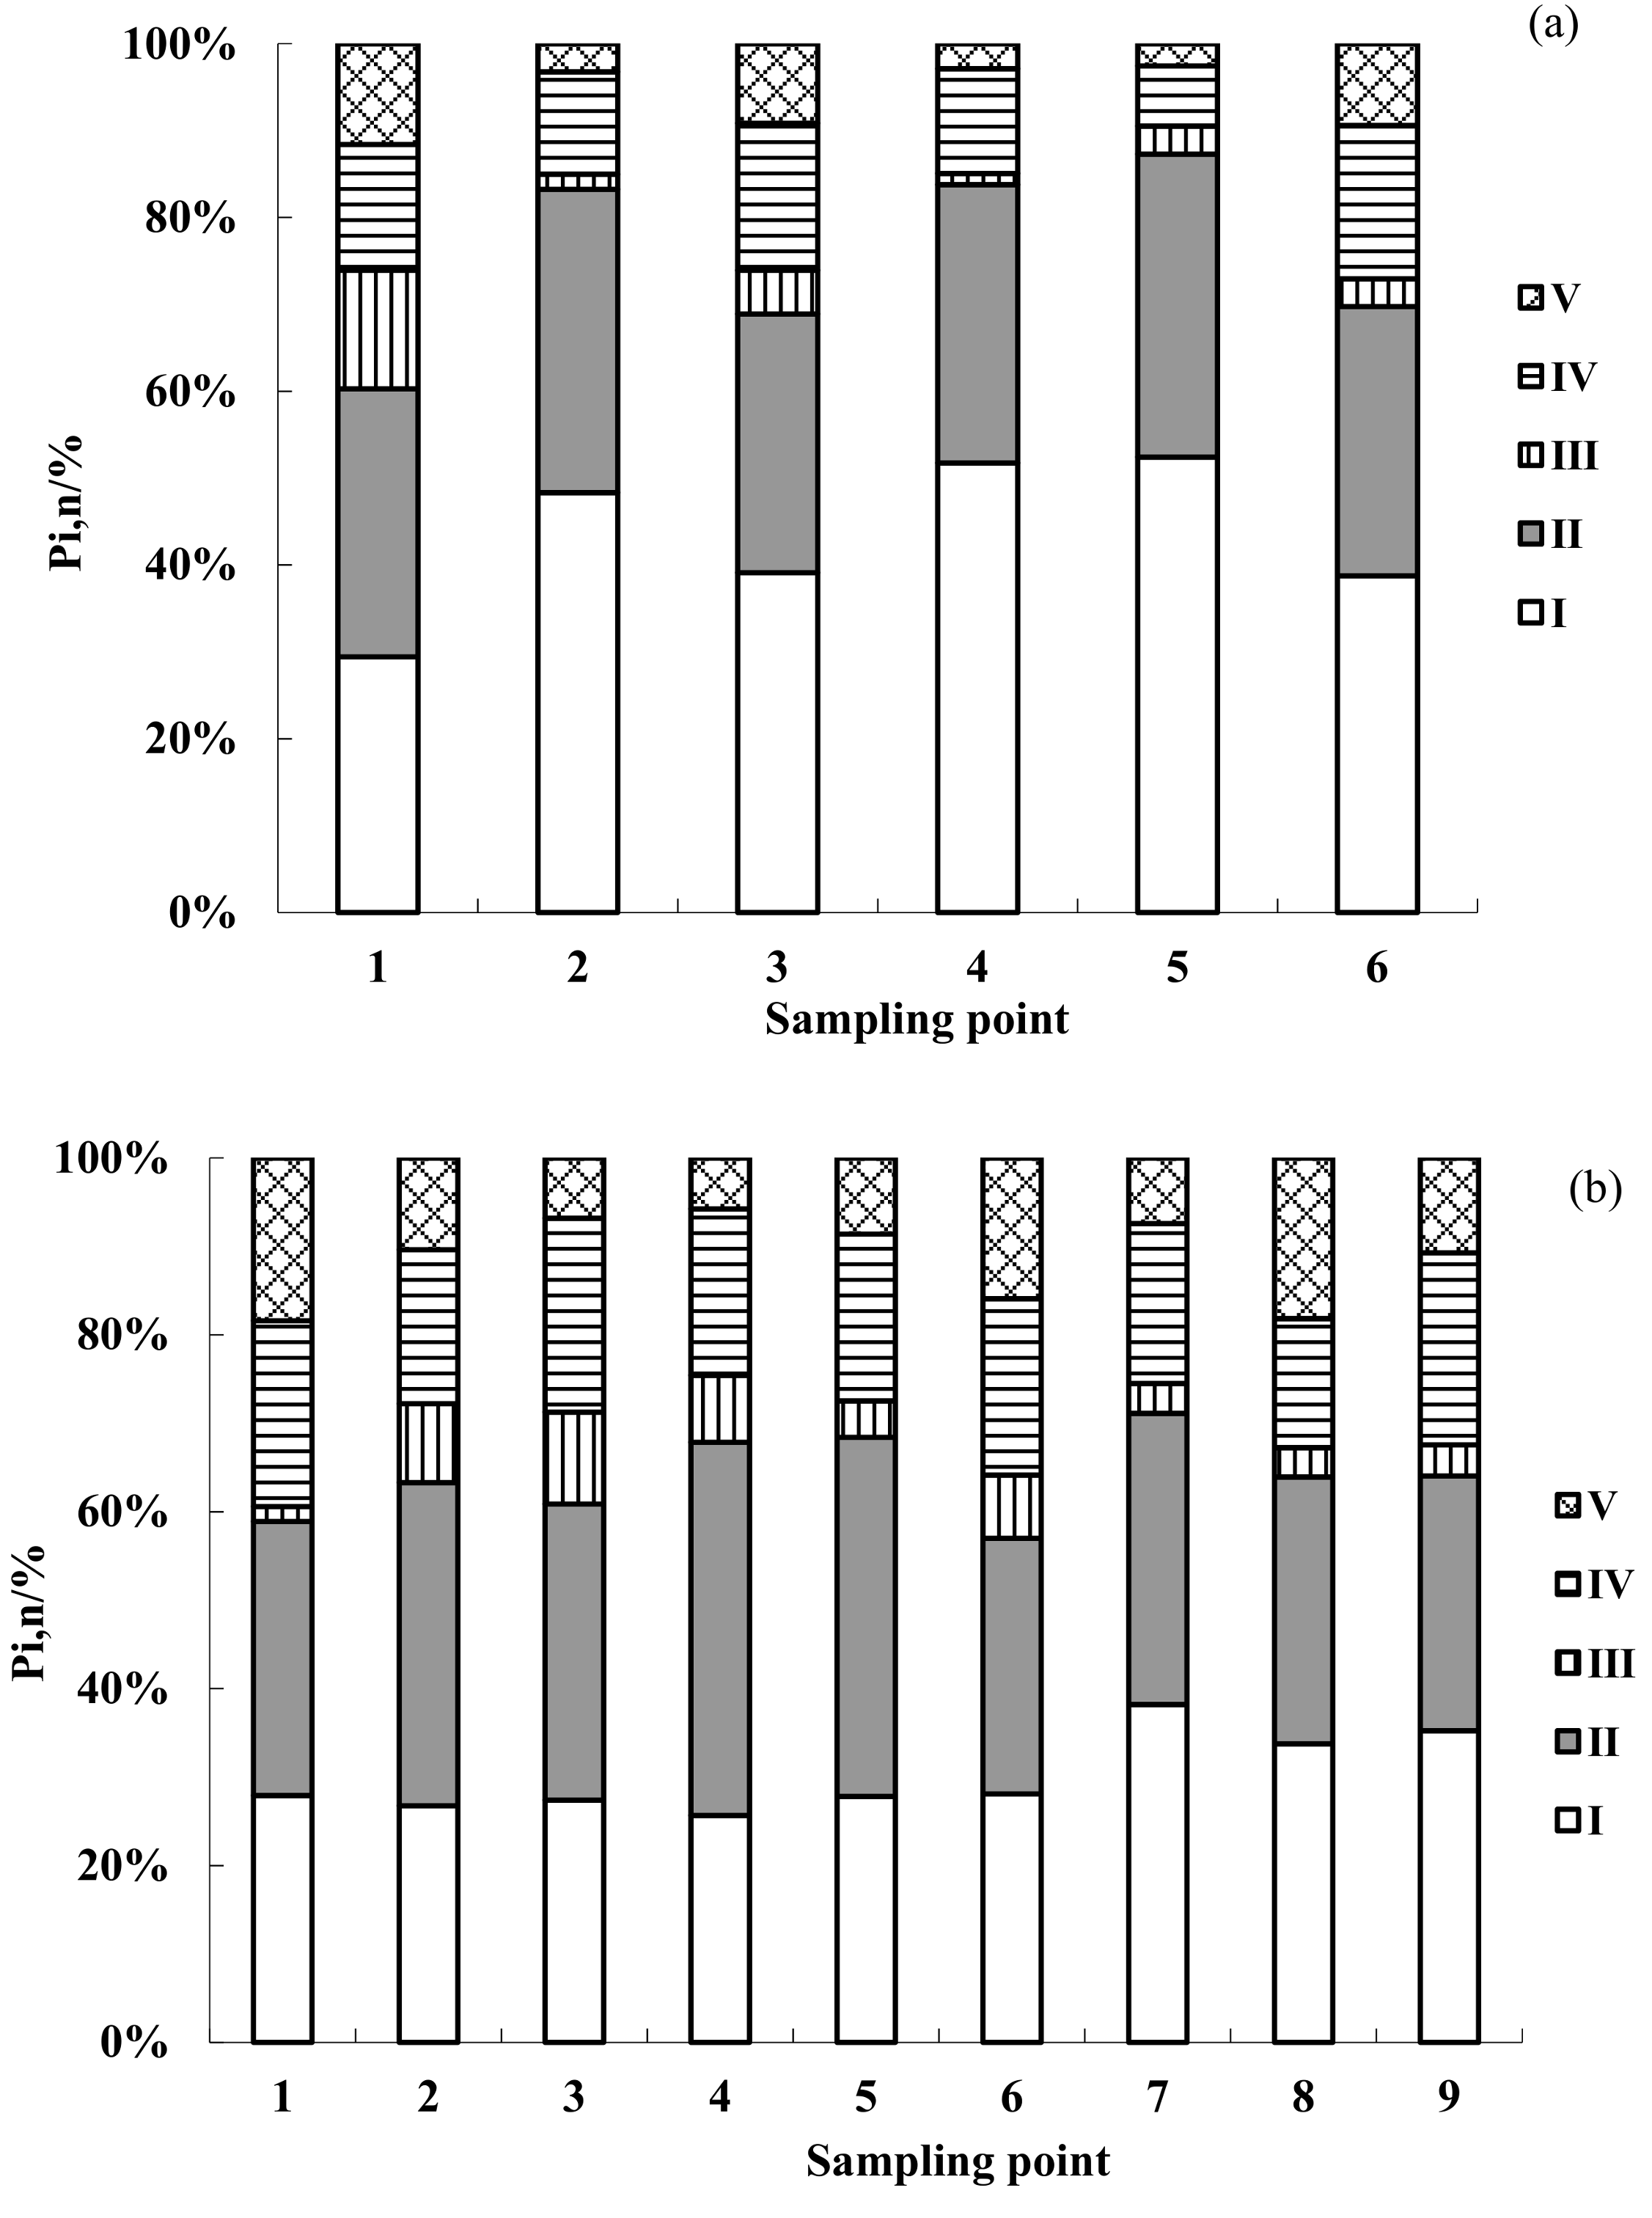
To obtain a stronger understanding of the fluorescence characteristics of DOM, the regional volume integral method was used to quantitatively analyze the fluorescence components of DOM, and the three-dimensional fluorescence spectra were divided into five regions by continuous excitation and using emission wavelengths [18]. Region I (Ex/Em = 220−250/280−330 nm) is an amino acid protein; Region II (Ex/Em = 220−250/330−380 nm) is a tryptophan protein; Region III (Ex/Em = 220−250/380−550 nm) is a fulvic acid; Region IV (Ex/Em = 250−400/280−380 nm) includes soluble microbial metabolites; Region V (Ex/Em = 250−400/380−550 nm) is humic-like. By calculating the ratio of spectral integration for a region to the volume of an integral region, the content and relative content of a specific structure of fluorescent material in the corresponding region are determined, as shown in Figure 7.
We obtained Water Sample #1 from Jing River located in Jinghe County, #3 from the upper reaches of the Xia Tian Ji Reservoir, and #6 from the middle of the county and from the Xia Tian Ji Reservoir. The Bortala River sample #1 was from the Hot Springs County, close to #6 in the middle of the village and in the vicinity of the city of Bole near #9. Figure 7a shows that Jing River complex amino acid protein P1,n represents a relatively large proportion of tryptophan proteins of between 29.438 and 39.099%, while P2,n levels account for between 29.773 and 31.0134%, fulvic acid P3,n levels account for 3.189–13.6534%, soluble microbial metabolite P4,n levels account for 14.4638–17.645%, and humic acid P5,n levels account for between 9.154 and 11.6048%. As is illustrated in Figure 7a, the main components of DOM in Jing River are proteins, tryptophan, and proteins of tryptophan. Amino acid protein content levels are the highest in Water Sample #3, and fulvic acid content levels (3.183%) in the upstream sample is the lowest. The relative content of soluble microbial metabolites in Water Sample #6 is higher than that in #3. Generally, proteins in Jing river water bodies form the main components of DOM.
As is illustrated in Figure 7b, the Bortala River tryptophan protein P1,n accounts for a relatively large percentage of between 27.937 and 35.239%; tryptophan protein P2,n levels vary from 28.807 to 30.962%; fulvic acid P3,n forms a relatively small percentage at between 1.689 and 7.159%; soluble microbial product P4,n levels range between 19.949 and 21.72%; humic acid P5,n levels range from 10.708 to 18.398%.Tryptophan protein form the main components of the DOM structure of the Bortala River. In summary, the main components of DOM in the Jing River and Bortala Rivers are proteins, organic matter, and dissolved microbial metabolites. In the DOM component of the two rivers, the relative content of each component varies, but differences are not significant. These results show that the three-dimensional fluorescence characteristics of the Jing and Bortala Rivers are similar.
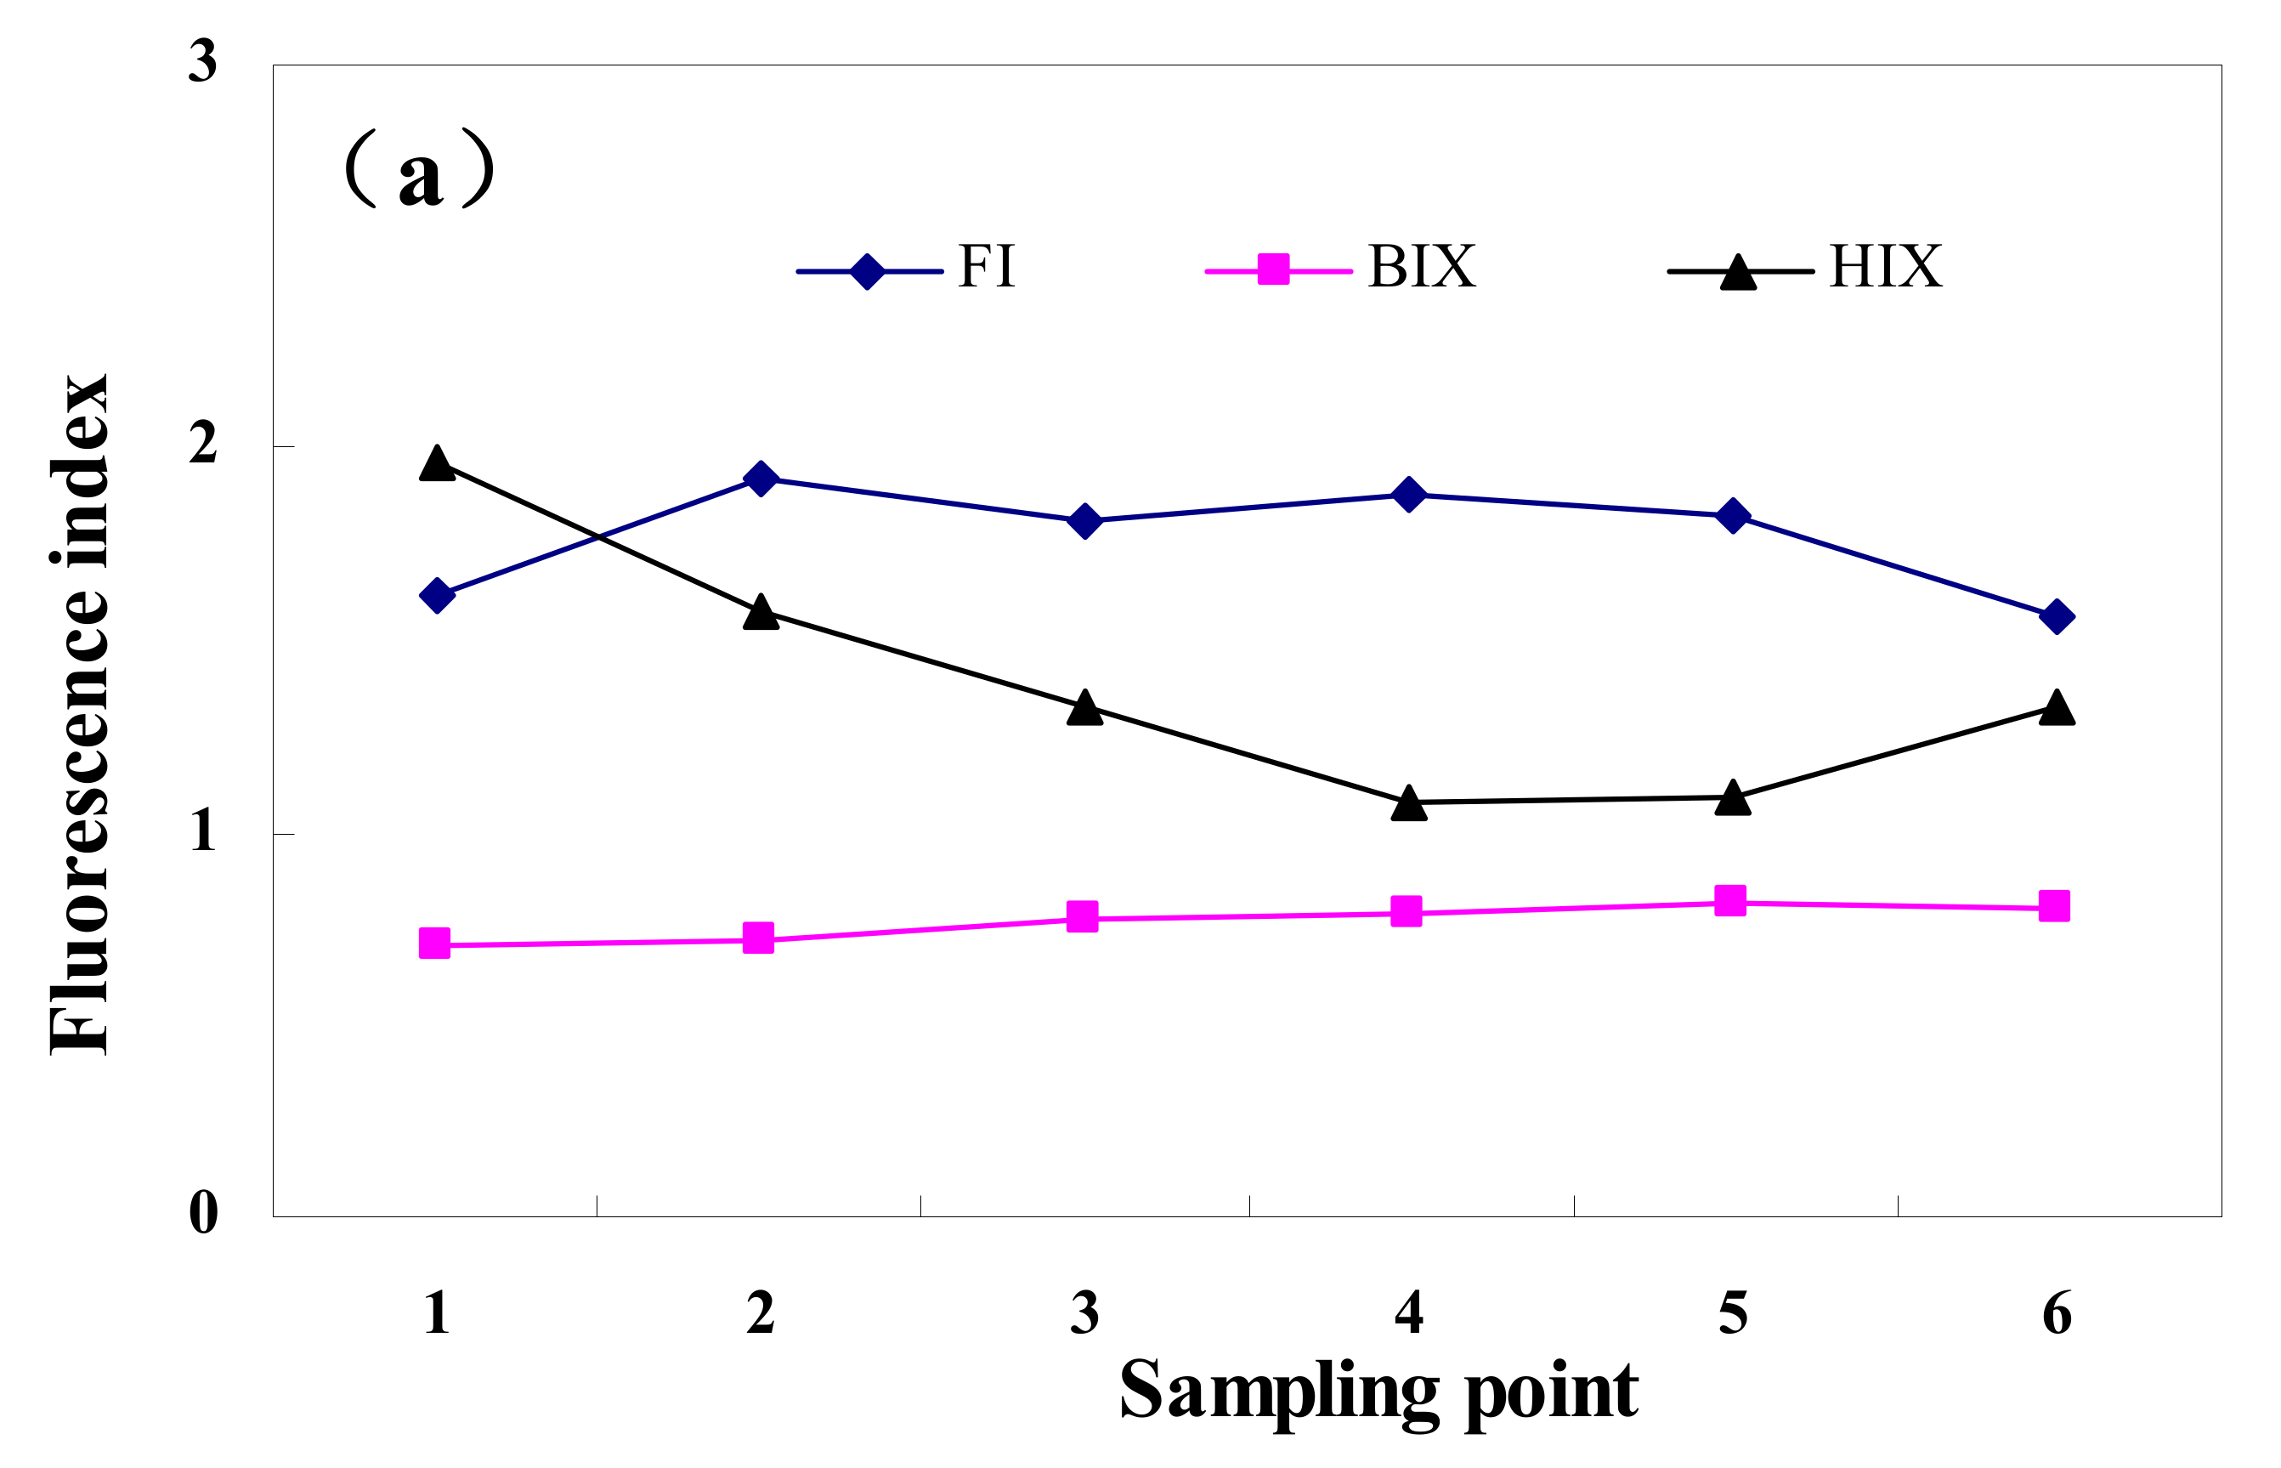
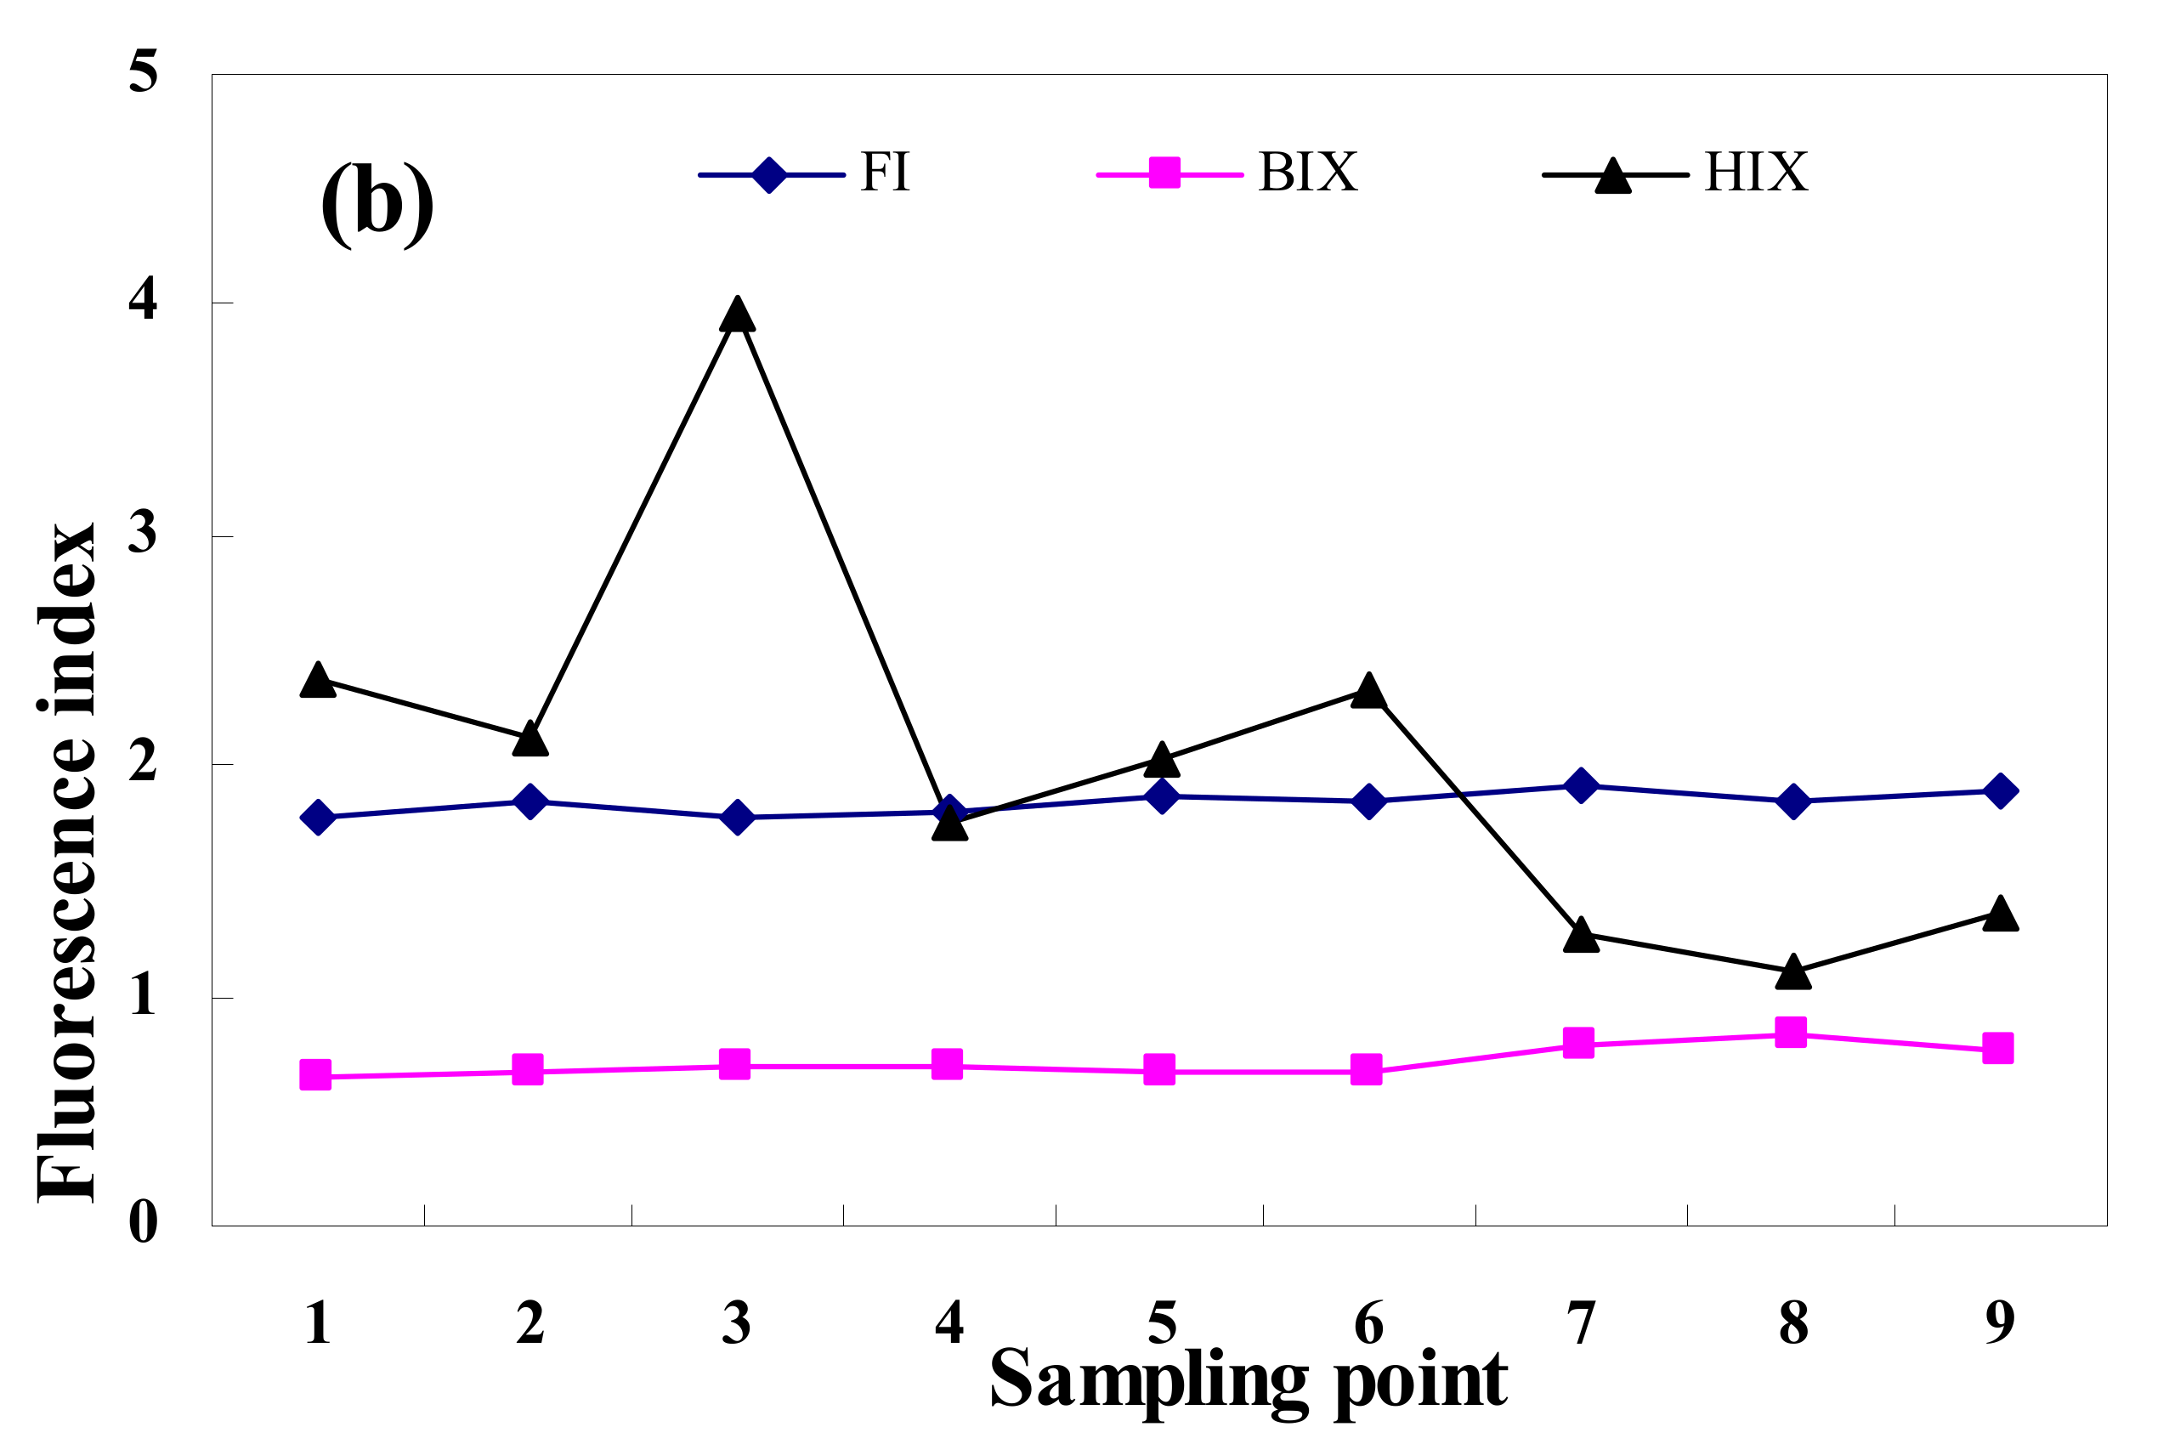
3.3. Fluorescence Index Analysis
The fluorescence index has been widely used to provide effective information on the composition and properties of DOM. In this paper, some conventional fluorescence indices are used to describe the fluorescence index of water. Results are calculated from three-dimensional fluorescence data as shown in Figure 8. The fluorescence index (FI = f470/520) is defined as a 370 nm wavelength excitation and fluorescence intensity ratios at 470 and 520 nm in emission wavelengths. These values are measured at approximately 1.4 for land or soil source inputs and at approximately 1.9 for spontaneous sources of microbial activity, and these are used to distinguish between different sources of DOM [33]. The Jing River fluorescence index (FI) varies between 1.6 and 2.0. The fluorescence index of the Bortala River is lower and assumes a horizontal linear trend. The fluorescence index values of the two rivers fluctuate at approximately 1.8. These results show that microbial activity is the main driving force DOM component transformation in the two rivers.
The biological index (BIX = f380/430) is defined as 254 nm wavelength excitation and as fluorescence intensity ratios at 380 and 430 nm in emission wavelengths. When the BIX value is greater than 1, it represents a biological source of bacteria. Meanwhile, when it ranges between 0.6 and 0.7, BIX represents the input of terrestrial sources or is greatly influenced by human activities, which reflects the proportion of DOM self-contribution [34]. Indices of water quality for the Jing and Bortala Rivers range between 0.6 and 0.8. These results show that humus sources of the river water are affected primarily by human activities such as farming, fertilization, and irrigation.
The humification index (HIX = f435−480 nm/300−345 nm) is defined as 254 nm wavelength excitation and as the ratio of the average fluorescence intensity of the emission wavelength in the 435−480 nm and 300−345 nm bands. When HIX is less than 4, the humification degree of DOM is weak, but when it reaches 10−16, DOM has significant humus characteristics [35]. The humification index of the Bortala River water varies greatly, but it is less than 4 overall; the humification index for Jing River water is less than 4, indicating that the humification degree of DOM components in the Jing and Bortala Rivers is weak. To summarize, the water quality of the Jing and Bortala Rivers is affected primarily by human and microbial activities.
3.4. Analysis of the Relationship between Hydrochemical Factors and Fluorescence Indices
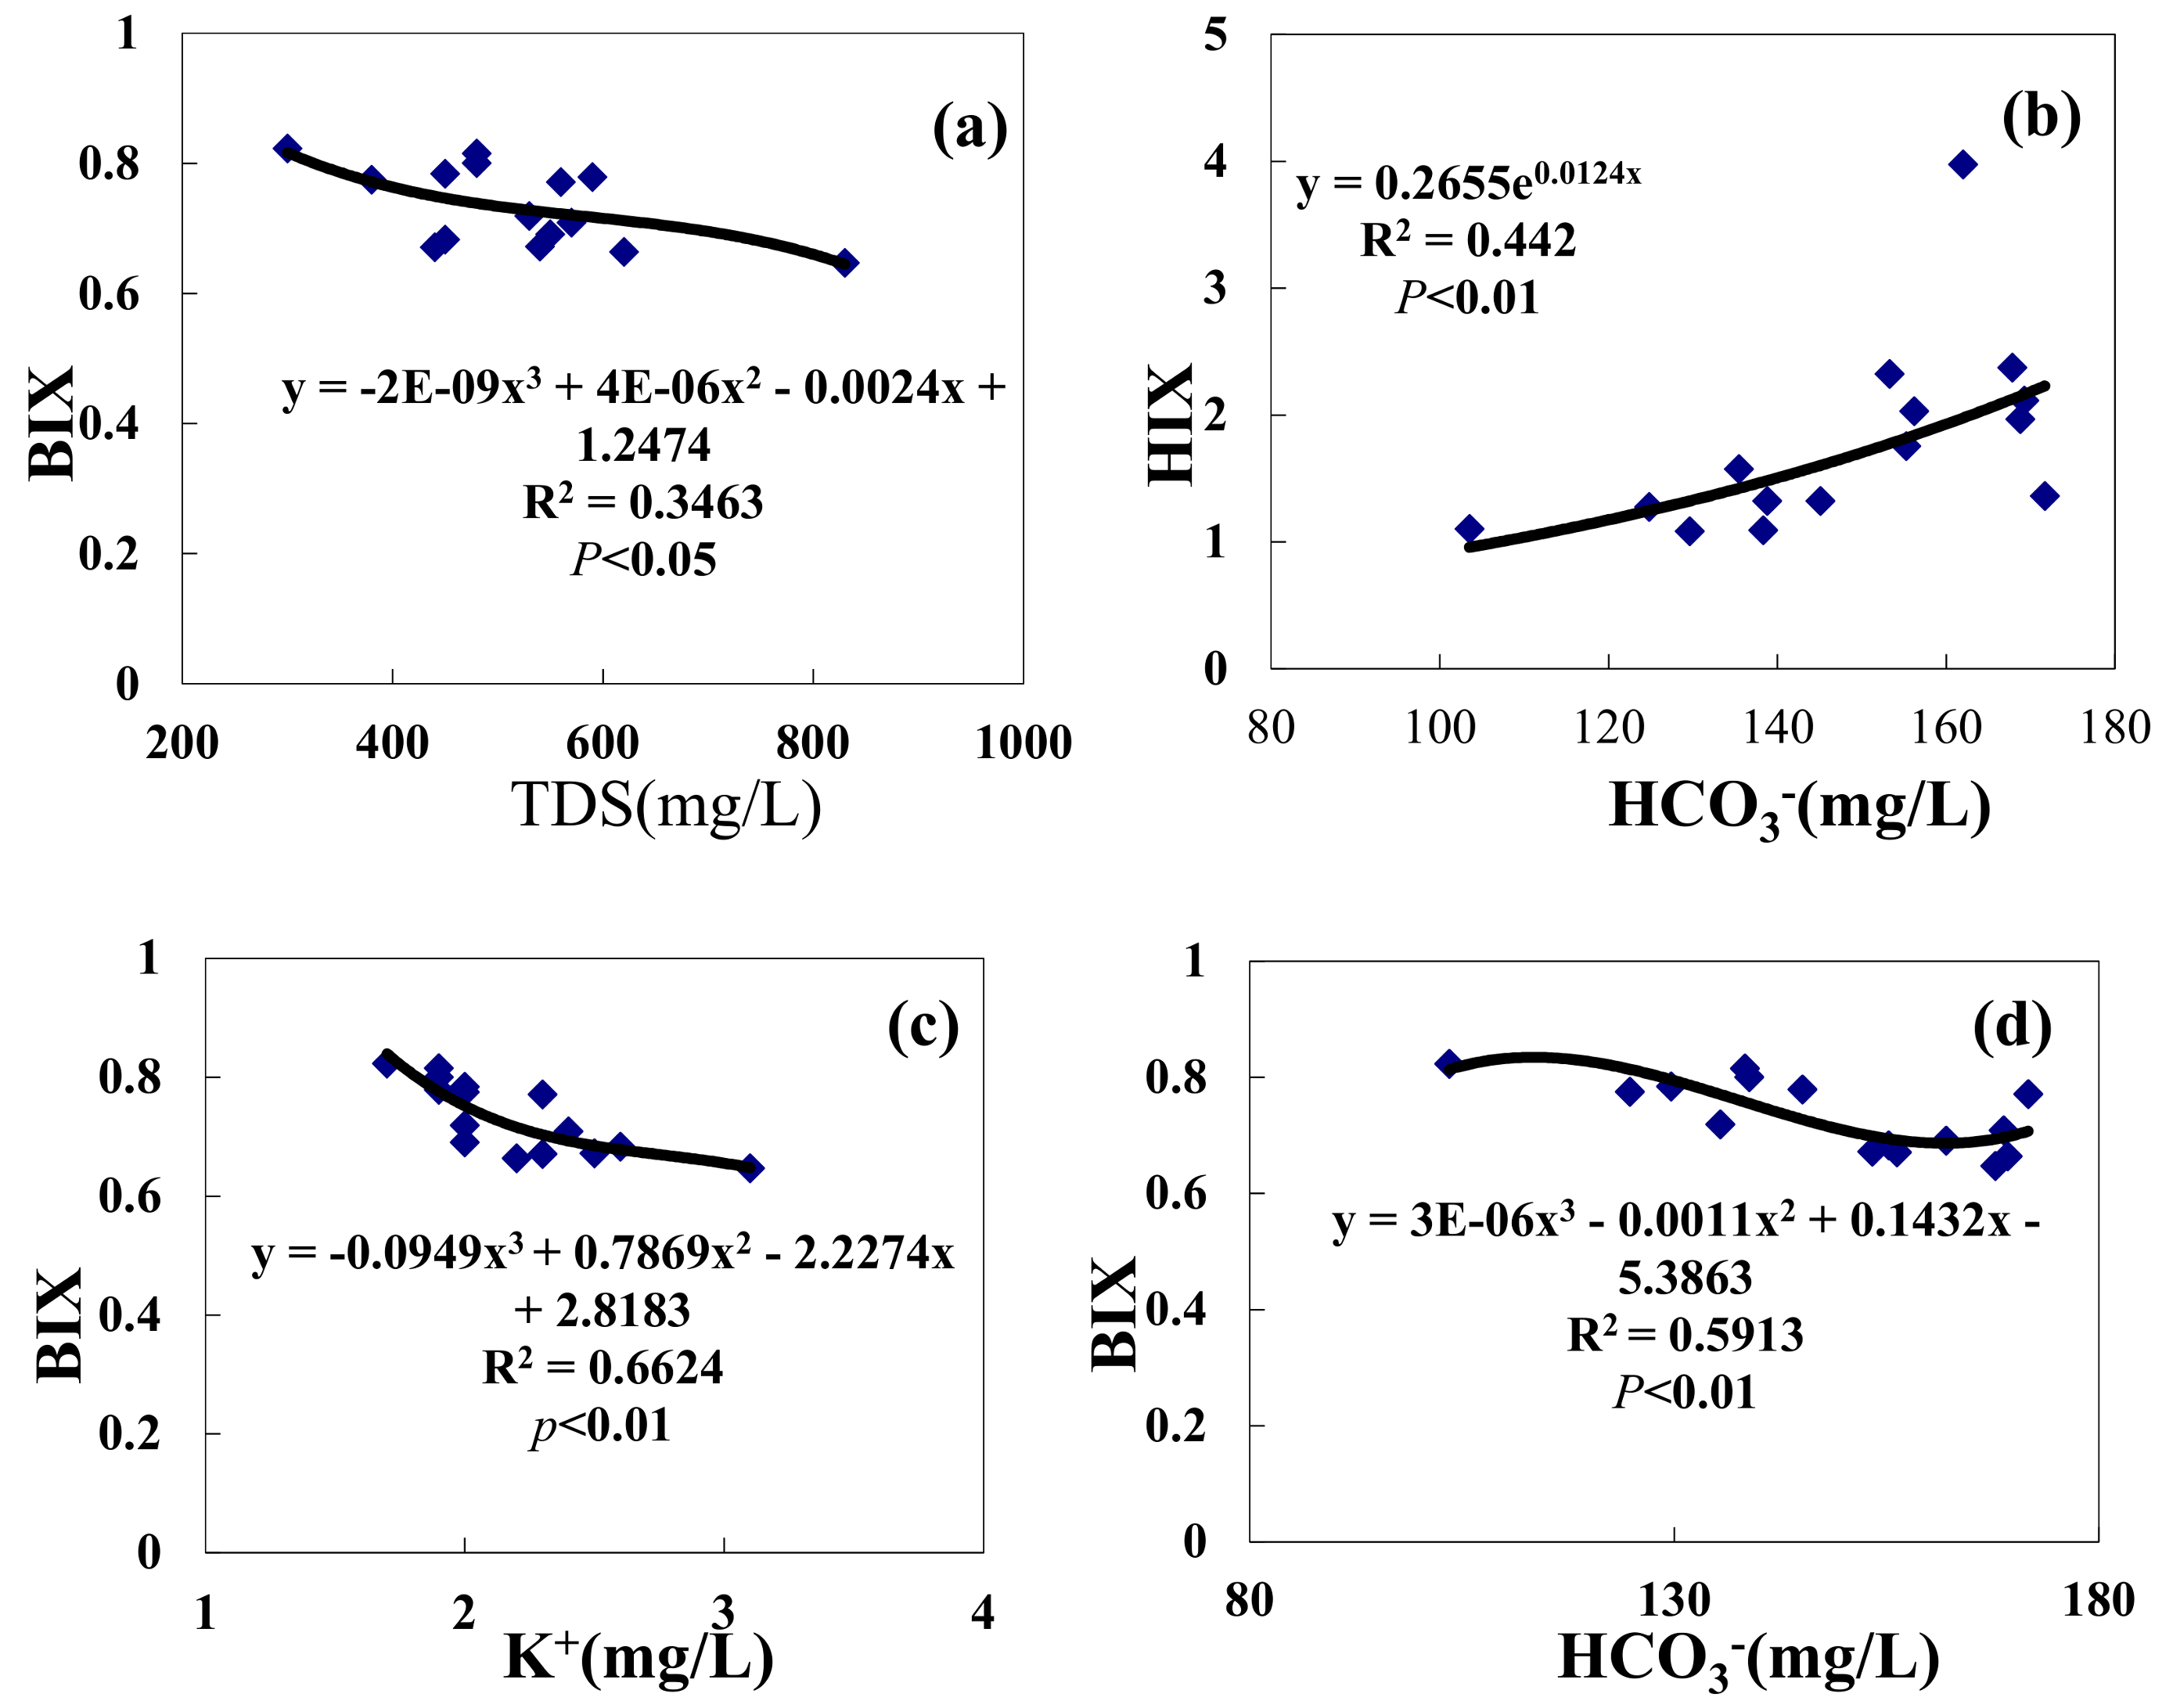
To investigate the relationship between water chemistry factors and fluorescence indices, the correlation between water chemical factors and fluorescence indices for major lakes, rivers, and the Jing and Bortala Rivers was analyzed. As is shown in Table 4, water chemistry factors of the main lakes and rivers are closely related to fluorescence indices HCO3−-BIX and K+-BIX. Correlation coefficients are valued at 0.708 and 0.764, respectively, with a significant correlation (p < 0.01). The correlation coefficient of TDS-BIX is 0.577, and the correlation coefficient of HCO3−-HIX is 0.568, showing a significant correlation (p < 0.05). Among these, the endogenous index (BIX) is negatively related to water chemical factors (TDS, HCO3−, Cl−, SO42−, Mg2+, Ca2+, K+, and Na+). Only TDS, HCO3−, and K+ are significantly related to BIX. The self-derived index (BIX) reflects sources of DOM humus associated with human activity. However, TDS, HCO3−, and K+ show significantly negative correlations with BIX. Hence, human activities are related to river concentrations of TDS, HCO3−, and K+, and there is a certain relationship between the acidity and alkalinity of river water. There is a positive relationship between the humification index (HIX) and water chemical factors. Only HCO3− is significantly related to HIX. The humification index (HIX) reflects the degree of DOM component humification, and HCO3− and TN are positively correlated with HIX. This result shows that the water quality and pH of a river are directly proportional to the humification of organic matter in the river.
In Table 4, water chemistry factors and fluorescence indices have significant correlations. First, water chemistry factors, which are significantly related to the fluorescence index, are selected. Next, the fluorescence index is fitted to the respective water chemical factor. The relationship between the humification (HIX) and HCO3− indices is the strongest and that the correlation coefficient is significant. The correlation coefficient is R2 = 0.442 (p < 0.01). Second, relationships between the BIX and TDS, HCO3−, and K+ fitted by the three functions are negatively correlated. The correlation coefficients are R2 = 0.3463 (p < 0.05), R2 = 0.5913, and R2 = 0.6624 (p < 0.01), respectively. Among them, the humification index (HIX) and K+ fit the best, and HIX and HCO3− fit the second best (Figure 9).
4. Discussion
It is generally believed that organic pollution in surface water is related to human activities such as livestock farming as well as agricultural chemical fertilizer and pesticide use [36,37]. The fluorescence index reveals the sources of organic pollution in rivers [38]. This paper is the first to present an investigation of the relationship between fluorescence indices and hydrochemical factors. We find three types of fluorescence indices in rivers. There is a significantly negative correlation between the index of self-enrolment (BIX) and the humification index (HIX). BIX is a source of humic organic matter in DOM. HIX reflects the degree of humification. Therefore, the source of humus in DOM is not directly related to the humification degree of DOM. The FI is used to denote the source of humus in DOM. As is shown in Figure 8, the FI value of main rivers entering the lake is approximately 1.8. This value indicates that the humus of DOM in the river is mainly derived from microbial activity; values of BIX are less than 1, indicating that the source of humus in the main inflow lakes is affected by human activities. In the spring, before the start of spring ploughing and when human activity is limited, the Bortala and Jing Rivers BIX indices are relatively stable.
However, the fluorescence index (FI) is not related to BIX and HIX, indicating that the activity of microorganisms in rivers is not related to the humification of DOM components or directly related to human activities. The positive correlation found between HIX and HCO3− shows that the degree of humification is closely related to the degree of water acidity and alkalinity. Perhaps due to low spring temperatures, river water levels are high, and photosynthesis is limited; pH released from the algae and microorganism breeding period consumes large proportions of dissolved oxygen, and river rock weathering is limited, leaving less HCO3− in the water and resulting in low alkalinity levels. BIX is negatively correlated with TDS, HCO3−, and K+, indicating that the river’s acidity and alkalinity are not the same as factors affecting humus and revealing three function relations. However, Lidén A research reveals a significant relationship between the fluorescence index and TOC [39]; Zhao Xue et al. [40] found significant relationships between TDS, pH, and TOC; therefore, there is a significant relationship between the fluorescence index and HCO3−, which is consistent with the results of this study. Relevant studies were consulted to understand that related research is limited. However, principles between fluorescence indices and hydrochemical factors for arid areas are not analyzed in this paper. Due to the river water in arid areas presents unique fluorescence feature, which has been rarely found in previous studies, experiments must be conducted to analyze the relationships between fluorescence and hydrochemical factors in arid rivers.
In the spring, and especially in March, which is characterized by dry climatic patterns, low rainfall levels, and low evaporation levels due to seasonal restrictions, water quality monitoring data yield only 15 points. However, it should be noted that various river basins are represented within the sample. We believe that, for a similar climate, hydrology landscapes may serve as a foundation for arid areas [41].
In summary, there is a certain relationship between fluorescence indices and hydrochemical factors for major inflow tributaries of Ebinur Lake. This paper examines three types of fluorescence indices and hydrochemical factors. While a single relationship was found, this work cannot fully explain the relationships of fluorescence indices and hydrochemical factors; thus, further studies must be conducted.
5. Conclusions
This paper examines the relationship between hydrochemical factors and fluorescence indices, as the creation of real-time monitoring tools that measure water quality levels and resources by better assessing water quality in arid regions of Central Asia is central to efficient water management. Our main conclusions are as follows.
- (1)
- Jing and Bortala River ions differ little. Anion contents are composed of [HCO3−] > [SO42−] > [Cl−], and cation contents are composed of [Ca2+] > [Mg2+] > [Na+] > [K+]. The Bortala and Jing Rivers include mainly SO42− and HCO3− anions. Cations are composed primarily of Ca2+. HCO3−-Ca2+ is the most common hydrochemical found in the Bortala and Jing Rivers. The ion composition of the Bortala and Jing Rivers is derived primarily from the weathering of rocks.
- (2)
- Both the Jing and Bortala Rivers contain the four components of humic acid and other organic matter (C1), UVC class humus (C2), protein organic matter (C3), and class humus (C4). Each component of DOM in the Jing River has the largest proportions of tryptophan and protein. The soluble zone includes the lowest levels of fulvic acid. The DOM of the Bortala River is similar to that of the Jing River. Proportions of protein-like organic matter are the largest here. The soluble zone includes the lowest levels of fulvic acid. For the two rivers, similar proteins, organic matter levels, and microbial metabolites account for dominant values of DOM components.
- (3)
- A correlation analysis of hydrochemical factors and fluorescence indices of main inflow lakes, BIX, HCO3−, and K+ shows that three-function fitting is the best approach. Fitting coefficients are valued at R = 0.789 and R = 0.8146 at the p < 0.01 level.
Acknowledgments
This research was carried out with financial support provided by the Scientific and Technological Talent Training Program of Xinjiang Uygur Autonomous Region (Grant No. QN2016JQ0041) and by the Xinjiang Local Outstanding Young Talent Cultivation Project of National Natural Science Foundation of China (U1503302). The authors would like to thank Yun Chen of CSIRO Land and Water for checking this manuscript. The authors wish to thank the referees for their helpful suggestions, which have improved this manuscript.
Author Contributions
Fei Zhang conceived and designed the experiments; Haiwei Zhang and Jia Song performed the experiments; Haiwei Zhang analyzed the data and wrote the paper.
Conflicts of Interest
The authors declare no conflict of interest.
References
- Nishanthiny, S.C.; Thushyanthy, M.; Barathithasan, T.; Saravanan, S. Irrigation water quality based on hydro chemical analysis, Jaffna, Sri Lanka. Am-Eurasian J. Agric. Environ. Sci. 2010, 7, 100–102. [Google Scholar]
- Muthanna, M. Quality assessment of Tigris River by using water quality index for irrigation purpose. Eur. J. Sci. Res. 2011, 57, 15–28. [Google Scholar]
- Yidana, S.M.; Banoeng-Yakubo, B.; Sakyi, P.A. Identifying key processes in the hydrochemistry of a basin through the combined use of factor and regression models. J. Earth Syst. Sci. 2012, 121, 491–507. [Google Scholar] [CrossRef]
- Grosbois, C.; Negrel, P.; Grimaud, D.; Fouillac, C. An overview of dissolved and suspended matter fluxes in the Loire River basin: Naturaland anthropogenic inputs. Aquat. Geochem. 2001, 7, 81–105. [Google Scholar] [CrossRef]
- Re, V.; Sacchi, E.; Mas-Pla, J.; Menció, A.; El, A.N. Identifying the effects of human pressure on groundwater quality to support water management strategies in coastal regions: A multi-tracer and statistical approach (Bou-Areg region, Morocco). Sci. Total Environ. 2014, 500–501, 211–223. [Google Scholar] [CrossRef] [PubMed]
- Huang, G.X.; Sun, J.C.; Zhang, Y.; Chen, Z.; Liu, F. Impact of anthropogenic and natural processes on the evolution of groundwater chemistry in a rapidly urbanized coastal area, South China. Sci. Total Environ. 2013, 463, 209–221. [Google Scholar] [CrossRef] [PubMed]
- Gibbs, R.J. Mechanisms controlling world water chemistry. Science 1970, 170, 1088–1090. [Google Scholar] [CrossRef] [PubMed]
- Wu, J.; Pons, M.N.; Potier, O. Waste water fingerprinting by UV-visible and synchronous fluorescence spectroscopy. Water Sci. Technol. 2006, 53, 449–456. [Google Scholar] [CrossRef] [PubMed]
- Baker, A.; Inverarity, R.; Charlton, M.; Richmond, S. Detecting River Pollution Using Fluorescence Spectrophotometry: Case Studies from the Ousebum NE England. Environ. Pollut. 2003, 124, 57–70. [Google Scholar] [CrossRef]
- Baker, A. Fluorescence Properties of Some Farm Wastes: Implications for Water Quality Monitoring. Water Res. 2002, 36, 189–195. [Google Scholar] [CrossRef]
- Zhang, Y.; Yin, Y.; Feng, L.; Zhu, G.; Shi, Z.; Liu, X.; Zhang, Y.Z. Characterizing chromophoric dissolved organic matter in Lake Tianmuhu and its catchment basin using excitation-emission matrix fluorescence and parallel factor analysis. Water Res. 2011, 45, 5110–5122. [Google Scholar] [CrossRef] [PubMed]
- Goldman, J.H.; Rounds, S.A.; Needoba, J.A. Applications of fluorescence spectroscopy for predicting percent wastewater in an urban stream. Environ. Sci. Technol. 2012, 46, 4374–4381. [Google Scholar] [CrossRef] [PubMed]
- Yu, H.; Song, Y.; Xiang, T.; Du, E.; Liu, R.; Peng, J. Assessing removal efficiency of dissolved organic matter in wastewater treatment using fluorescence excitation emission matrices with parallel factor analysis and second derivative synchronous fluorescence. Bioresour. Technol. 2013, 144, 595–601. [Google Scholar] [CrossRef] [PubMed]
- Wang, Q.L.; Jiang, T.; Zhao, Z.; Liang, J.; Mu, Z.J. Spectral Characteristics of Dissolved Organic Matter (DOM) in Waters of Typical Agricultural Watershed of Three Gorges Reservoir Areas. Environ. Sci. 2016, 37, 2082–2092. (In Chinese) [Google Scholar]
- Zhang, Z.Y.; Jilili, A.; Jiang, F.Q. Pollution and Potential Ecology Risk Evaluation of Heavy Metals in River Water, Top Sediments on Bed and Soils Along Banks of Bortala River, Northwest China. Environ. Sci. 2015, 36, 2422–2429. (In Chinese) [Google Scholar]
- Zhang, F.; Tiyip, T.; Johnson, V.C.; Kung, H.; Ding, J.; Zhou, M. Evaluation of land desertification from 1990 to 2010 and its causes in Ebinur lake region, Xinjiang China. Environ. Earth Sci. 2015, 73, 5731–5745. [Google Scholar] [CrossRef]
- Cui, Y.R.; Wu, Q.; Yang, M.S. Three-dimensional excitation-emission matrix fluorescence spectroscopy and fractions of dissolved organic matter change in landfill leachate by biological treatment. Environ. Sci. Pollut. Res. 2016, 23, 793–799. [Google Scholar] [CrossRef] [PubMed]
- Wang, S.H.; Wang, W.W.; Jiang, X.; Zhao, L.; Zhang, B. Distribution of chromophoric dissolved organic matter in Li hu Lake using excitation-emission matrix fluorescence and parallel factor analysis. China Environ. Sci. 2016, 36, 517–524. (In Chinese) [Google Scholar]
- Stedmon, C.A.; Bro, R. Characterizing dissolved organic matter fluorescence with parallel factor analysis: A tutorial. Limnol. Oceanogr. Methods 2008, 6, 572–579. [Google Scholar] [CrossRef]
- Maqbool, T.; Quang, V.L.; Cho, J.; Hur, J. Characterizing fluorescent dissolved organic matter in a membrane bioreactor via excitation-emission matrix combined with parallel factor analysis. Bioresour. Technol. 2016, 209, 31–39. [Google Scholar] [CrossRef] [PubMed]
- Huguet, A.; Vacher, L.; Relexans, S.; Saubusse, S.; Froidefond, J.M.; Parlanti, E. Properties of fluorescent dissolved organic matter in the Gironde Estuary. Org. Geochem. 2009, 40, 706–719. [Google Scholar] [CrossRef]
- Chen, W.; Westerhoff, P.; Leenheer, J.A.; Booksh, K. Fluorescence excitation–emission matrix regional integration to quantify spectra for dissolved organic matter. Environ. Sci. Technol. 2003, 37, 5701–5710. [Google Scholar] [CrossRef] [PubMed]
- Avid, R.M. Handbook of Hydrology; McGraw-Hill: New York, NY, USA, 1992. [Google Scholar]
- Sun, R.; Zhang, X.Q.; Wu, Y.H. Major Ion chemistry of water and its controlling factors in the Yamzhog Yumco Basin, South Tibet. J. Lake Sci. 2012, 24, 600–608. (In Chinese) [Google Scholar]
- Piper, A.M. A graphic procedure in the geochemical interpretation of water-analyses. Neurochem. Int. 1984, 6, 27–39. [Google Scholar] [CrossRef]
- Sheikhy, N.T.; Ramli, M.F.; Aris, A.Z.; Sulaiman, W.N.; Juahir, H.; Fakharian, K. Identification of the hydrogeochemical processes in groundwater using classic integrated geochemical methods and geostatistical techniques, in Amolbabol Plain, Iran. Sci. World J. 2014, 983–990. [Google Scholar] [CrossRef]
- Han, G.L.; Liu, C. Water geochemistry controlled by carbonate dissolution: A study of the River waters draining karst-dominated terrain, Guizhou Province, China. Chem. Geol. 2004, 204, 1–21. [Google Scholar] [CrossRef]
- Chen, J.S.; Wang, F.Y.; He, D.W. Geochemistry of water quality of the Yellow River basin. Earth Sci. Front. 2006, 13, 58–73. (In Chinese) [Google Scholar]
- Jin, H.; Cho, J. Prediction of BOD, COD, and Total Nitrogen Concentrations in a Typical Urban River Using a Fluorescence Excitation-Emission Matrix with PARAFAC and UV Absorption Indices. Sensors 2012, 12, 972–986. [Google Scholar]
- Feng, W.Y.; Wang, S.R.; Zhang, S. Effect of p H on the fluorescence characteristics of dissolved organic matter in the sediment and overlying water from Erhai Lake. Environ. Chem. 2014, 33, 229–235. (In Chinese) [Google Scholar]
- Cheng, Q.L.; Zheng, B.H.; Wang, S.R.; Jiao, L.X.; Huang, M.S. Optical signatures of Chromophoric dissolved organic matter in water body of Tien Lake. Spectrosc. Spectr. Anal. 2014, 34, 698–703. (In Chinese) [Google Scholar]
- Ma, L.N.; Zhang, H.; Tan, W.B.; Yu, M.D.; Huang, Z.G.; Gao, R.T. Evolution of dissolved organic matter properties in a constructed wetland of xiao River, Hebei. Spectrosc. Spectr. Anal. 2016, 36, 206–212. (In Chinese) [Google Scholar]
- Vodacek, A.; Hogel, F.E.; Swift, R.N.; Yungel, J.K.; Peltzer, E.T.; Blough, N.V. The in situ and airborne fluorescence measurements to determine UV absorption coefficients and DOC concentrations in surface waters. Limnol. Oceanogr. 1995, 40, 411–415. [Google Scholar] [CrossRef]
- Cory, R.M.; McKnight, D.M. Fluorescence spectroscopy reveals biquitous presence of oxidized and reduced quinones in dissolved organic matter. Environ. Sci. Technol. 2005, 39, 8142–8149. [Google Scholar] [CrossRef] [PubMed]
- Wang, Z.; Wu, Z.; Tang, S. Characterization of dissolved organic matter in a submerged membrane bioreactor by using three-dimensional excitation and emission matrix fluorescence spectroscopy. Water Res. 2009, 43, 1533–1540. [Google Scholar] [CrossRef] [PubMed]
- Matteo, B.; Pierre, B.; Philippe, C.; Ole, M.E.; Alessandro, G.; Alexandra, G.; Melike, G.; Bjørn, K.; Zoran, N.; Elena, P.; et al. Groundwater Pollution and Quality Monitoring Approaches at the European Level. Crit. Rev. Environ. Sci. Technol. 2012, 43, 323–408. [Google Scholar]
- Lapworth, D.J.; Baran, N.; Stuart, M.E.; Ward, R.S. Emerging organic contaminants in groundwater: A review of sources, fate and occurrence. Environ. Pollut. 2012, 163, 287–303. [Google Scholar] [CrossRef] [PubMed] [Green Version]
- Birdwell, J.E.; Engel, A.S. Characterization of dissolved organic matter in cave and spring waters using UV–Vis absorbance and fluorescence spectroscopy. Org. Geochem. 2010, 41, 270–280. [Google Scholar] [CrossRef]
- Lidén, A.; Keucken, A.; Persson, K.M. Uses of fluorescence excitation-emissions indices in predicting water treatment efficiency. J. Water Process Eng. 2017, 16, 249–257. [Google Scholar] [CrossRef]
- Zhao, X.; Zhang, Z.F.; Zhu, F.J. Pollution Characteristics of Parabens in Typical Sewage Wastewater. Environ. Sci. 2017. [Google Scholar] [CrossRef]
- Wang, X.P.; Zhang, F.; Kung, H.T.; Abduwasit, G.; Adam, L.; Trumbo, F.; Yang, J.Y.; Ren, Y.; Jing, Y.Q. Evaluation and estimation of surface water quality in an arid region based on EEM-PARAFAC and 3D fluorescence spectral index: A case study of the Ebinur Lake Watershed, China. Catena 2017, 155, 62–74. [Google Scholar] [CrossRef]
Figure 1.
Map of the study area. (a) The Bortala River entering the lake; (b) the Bortala River; (c) the Jing River; (d) the Xia Tian Ji Reservoir.
Figure 1.
Map of the study area. (a) The Bortala River entering the lake; (b) the Bortala River; (c) the Jing River; (d) the Xia Tian Ji Reservoir.

Figure 2.
Ion percentages of water in the Bortala and Jing Rivers.

Figure 3.
Piper charts for the Bortala and Jing Rivers. (a) Cation triangulation; (b) Anion triangulation.
Figure 3.
Piper charts for the Bortala and Jing Rivers. (a) Cation triangulation; (b) Anion triangulation.

Figure 4.
Correlations of major ions in groundwater from the Bortala and Jing Rivers (red lines denote a 1:1 ratio). (a) Source analysis of Na+; (b) Source analysis of Ca2+ and Mg2+; (c) Source analysis of Ca2+, Mg2+ and SO42−; (d) Source analysis of Ca2+, Mg2+ and HCO3−.
Figure 4.
Correlations of major ions in groundwater from the Bortala and Jing Rivers (red lines denote a 1:1 ratio). (a) Source analysis of Na+; (b) Source analysis of Ca2+ and Mg2+; (c) Source analysis of Ca2+, Mg2+ and SO42−; (d) Source analysis of Ca2+, Mg2+ and HCO3−.


Figure 5.
Gibbs charts for anions and cations in the Bortala and Jing Rivers. (a) Gibbs charts for Cation; (b) Gibbs charts for Anion.
Figure 5.
Gibbs charts for anions and cations in the Bortala and Jing Rivers. (a) Gibbs charts for Cation; (b) Gibbs charts for Anion.

Figure 6.
Fluorescence components identified by the PARAFAC model for the main tributary rivers. (C1) Humic-like graph; (C2) UVC humus graph; (C3) protein-like organic substances graph; (C4) Tryptophan-like graph.
Figure 6.
Fluorescence components identified by the PARAFAC model for the main tributary rivers. (C1) Humic-like graph; (C2) UVC humus graph; (C3) protein-like organic substances graph; (C4) Tryptophan-like graph.

Figure 7.
Distributions of the volume of DOM components in the Bortala and Jing Rivers. (a) Jing River Water Sample Quantify Spectra for DOM; (b) Bortala River Water Sample Quantify Spectra for DOM.
Figure 7.
Distributions of the volume of DOM components in the Bortala and Jing Rivers. (a) Jing River Water Sample Quantify Spectra for DOM; (b) Bortala River Water Sample Quantify Spectra for DOM.

Figure 8.
Change trends of the fluorescence index of water samples drawn from the Jing and Bortala Rivers. (a) Jing River fluorescence index; (b) Bortala River fluorescence index.
Figure 8.
Change trends of the fluorescence index of water samples drawn from the Jing and Bortala Rivers. (a) Jing River fluorescence index; (b) Bortala River fluorescence index.


Figure 9.
Relationships between hydrochemical factors and fluorescence indices. (a) Relationship Model between BIX and TDS; (b) Relationship Model between HIX and HCO3−; (c) Relationship Model between BIX and K+; (d) Relationship Model between BIX and HCO3−.
Figure 9.
Relationships between hydrochemical factors and fluorescence indices. (a) Relationship Model between BIX and TDS; (b) Relationship Model between HIX and HCO3−; (c) Relationship Model between BIX and K+; (d) Relationship Model between BIX and HCO3−.


Table 1.
Hydrochemical factors and instrument.
| Hydrochemical Factors | Instrument | Measurement Accuracy |
|---|---|---|
| Mg2+, Ca2+, K+, Na+ | Diane ICS1500 ion chromatograph analysis | 0.01 mg/L |
| TDS, HCO3−, Cl−, SO42− | Wantong MIC ion chromatograph analysis | 0.01 mg/L |
Table 2.
Statistical hydrochemical ion analysis of the Jing and Bortala Rivers.
| River | Hydrochemical Ions | Min | Mean | Median | Mode | Std. Dev. | Variance | Skewness | Kurtosis |
|---|---|---|---|---|---|---|---|---|---|
| Jing River | TDS (mg/L) | 450.00 | 516.666 | 505.00 | 480 | 55.738 | 3106.667 | 0.266 | −1.868 |
| HCO3− (mg/L) | 129.60 | 142.657 | 138.5467 | 129.60 | 13.746 | 188.953 | 1.741 | 3.503 | |
| Cl− (mg/L) | 29.25 | 46.675 | 42.0969 | 29.25 | 17.181 | 295.22 | 1.422 | 2.332 | |
| SO42− (mg/L) | 117.67 | 141.688 | 136.8855 | 132.08 | 18.663 | 348.339 | 0.349 | −0.963 | |
| Mg2+ (mg/L) | 43.74 | 55.485 | 57.105 | 60.75 | 7.437 | 55.309 | −0.707 | −0.648 | |
| Ca2+ (mg/L) | 80.16 | 90.848 | 86.172 | 80.16 | 12.842 | 164.924 | 1.109 | 0.044 | |
| K+ (mg/L) | 1.90 | 2.0167 | 1.95 | 1.9 | 0.194 | 0.038 | 2.116 | 4.678 | |
| Na+ (mg/L) | 13.10 | 19.033 | 17.55 | 13.10 | 7.015 | 49.211 | 1.065 | 0.521 | |
| Bortala River | TDS (mg/L) | 300.00 | 518.888 | 540.00 | 300.00 | 153.414 | 23,536.11 | 0.769 | 1.331 |
| HCO3− (mg/L) | 103.49 | 151.522 | 156.19 | 103.49 | 22.796 | 519.68 | −1.501 | 1.562 | |
| Cl− (mg/L) | 35.01 | 50.5162 | 49.186 | 35.01 | 11.759 | 138.286 | 0.387 | −1.057 | |
| SO42− (mg/L) | 64.84 | 132.883 | 136.88 | 64.84 | 53.726 | 2886.485 | 1.199 | 2.3 | |
| Mg2+ (mg/L) | 19.44 | 52.38 | 43.740 | 38.88 | 28.831 | 831.279 | 1.388 | 1.877 | |
| Ca2+ (mg/L) | 48.1 | 77.933 | 74.816 | 76.15 | 26.969 | 727.345 | 1.659 | 3.667 | |
| K+ (mg/L) | 1.70 | 2.30 | 2.267 | 2.00 | 0.406 | 0.165 | 0.662 | 0.989 | |
| Na+ (mg/L) | 7.50 | 16.455 | 16.400 | 7.50 | 6.516 | 42.463 | 0.237 | −0.089 |
Table 3.
Peaks of the four PARAFAC components identified from water samples of the main tributary rivers.
Table 3.
Peaks of the four PARAFAC components identified from water samples of the main tributary rivers.
| Fluorescent Component | Peak Position λEx/Em | Description and Probable Source |
|---|---|---|
| C1 | 260/420 | Humic-like (Photodegradation) [28,29] |
| C2 | 240/240 | -- |
| 240/490 | UVC humus [30] | |
| C3 | 220/300 | Tyrosine fluorescence peak [31] |
| 220/450 | Tyrosine fluorescence peak of the visible region [31] | |
| 280/300 | Tryptophan [32] | |
| 280/450 | Humic-like acid [32] | |
| C4 | 260/270 | -- |
| 260/530 | Tryptophan-like [30] |
Table 4.
Correlation matrix of hydrochemical factors and fluorescence indices.
| TitleHydrochemical Ions | TDS | HCO3− | Cl− | SO42− | Mg2+ | Ca2+ | K+ | Na+ | FI | BIX | HIX |
|---|---|---|---|---|---|---|---|---|---|---|---|
| TDS | 1 | 0.736 ** | 0.546 * | 0.945 ** | 0.908 ** | 0.898 ** | 0.677 ** | 0.793 ** | −0.248 | −0.577 * | 0.43 |
| HCO3− | 1 | 0.505 | 0.546 * | 0.511 | 0.581 * | 0.676 ** | 0.600 * | −0.261 | −0.708 ** | 0.568 * | |
| Cl− | 1 | 0.394 | 0.304 | 0.366 | 0.164 | 0.597 * | 0.089 | −0.364 | 0.469 | ||
| SO42− | 1 | 0.932 ** | 0.873 ** | 0.559 * | 0.750 ** | −0.133 | −0.418 | 0.289 | |||
| Mg2+ | 1 | 0.818 ** | 0.589 * | 0.638 * | −0.212 | −0.437 | 0.153 | ||||
| Ca2+ | 1 | 0.602 * | 0.814 ** | −0.381 | −0.32 | 0.172 | |||||
| K+ | 1 | 0.47 | −0.116 | −0.764 ** | 0.362 | ||||||
| Na+ | 1 | −0.117 | −0.338 | 0.152 | |||||||
| FI | 1 | 0.01 | −0.17 | ||||||||
| BIX | 1 | −0.710 ** | |||||||||
| HIX | 1 |
‘*’ Significant levels pvalues are all lower than 0.05 (p < 0.05); ‘**’ Significant levels pvalues are all lower than 0.01 (p < 0.01).
© 2018 by the authors. Licensee MDPI, Basel, Switzerland. This article is an open access article distributed under the terms and conditions of the Creative Commons Attribution (CC BY) license (http://creativecommons.org/licenses/by/4.0/).
Share and Cite
MDPI and ACS Style
Zhang, H.; Zhang, F.; Song, J. Analysis of Hydrochemical Characteristics and Three-Dimensional Fluorescence Spectra in the Semi-Arid Ebinur Lake Watershed, Xinjiang, China. Water 2018, 10, 426. https://doi.org/10.3390/w10040426
AMA Style
Zhang H, Zhang F, Song J. Analysis of Hydrochemical Characteristics and Three-Dimensional Fluorescence Spectra in the Semi-Arid Ebinur Lake Watershed, Xinjiang, China. Water. 2018; 10(4):426. https://doi.org/10.3390/w10040426
Chicago/Turabian StyleZhang, Haiwei, Fei Zhang, and Jia Song. 2018. "Analysis of Hydrochemical Characteristics and Three-Dimensional Fluorescence Spectra in the Semi-Arid Ebinur Lake Watershed, Xinjiang, China" Water 10, no. 4: 426. https://doi.org/10.3390/w10040426
Note that from the first issue of 2016, this journal uses article numbers instead of page numbers. See further details here.