A Semi Risk-Based Approach for Managing Urban Drainage Systems under Extreme Rainfall
by
 , and
, and
Carlos Salinas-Rodriguez
1,2,* ,
,
Berry Gersonius
1,2,
Chris Zevenbergen
1,
David Serrano
1 and
Richard Ashley
1,2 1
Flood Resilience Chair Group, Water Science and Engineering Department, IHE-Delft Institute for Water Education, 2611 AX Delft, The Netherlands
2
Cooperative Research Centre for Water Sensitive Cities, Monash University, Clayton, VIC 3800, Australia
*
Author to whom correspondence should be addressed.
Water 2018, 10(4), 384; https://doi.org/10.3390/w10040384
Submission received: 4 January 2018
/
Revised: 6 March 2018
/
Accepted: 21 March 2018
/
Published: 26 March 2018
(This article belongs to the Special Issue Sponge Cities: Emerging Approaches, Challenges and Opportunities)
Abstract
:Conventional design standards for urban drainage systems are not set to deal with extreme rainfall events. As these events are becoming more frequent, there is room for proposing new planning approaches and standards that are flexible enough to cope with a wide range of rainfall events. In this paper, a semi risk-based approach is presented as a simple and practical way for the analysis and management of rainfall flooding at the precinct scale. This approach uses various rainfall events as input parameters for the analysis of the flood hazard and impacts, and categorises the flood risk in different levels, ranging from very low to very high risk. When visualised on a map, the insight into the risk levels across the precinct will enable engineers and spatial planners to identify and prioritise interventions to manage the flood risk. The approach is demonstrated for a sewer district in the city of Rotterdam, the Netherlands, using a one-dimensional (1D)/two-dimensional (2D) flood model. The risk level of this area is classified as being predominantly very low or low, with a couple of locations with high and very high risk. For these locations interventions, such as disconnection and lowering street profiles, have been proposed and analysed with the 1D/2D flood model. The interventions were shown to be effective in reducing the risk levels from very high/high risk to medium/low risk.
1. Introduction
Over the last decades, changes in frequency and intensity of severe rainfall events have been consistently associated with changes in weather and climate [1,2,3]. Urbanisation will amplify the projected changes in heavy rainfall due to the urban heat island effect [4,5,6]. Understanding the changes in severe rainfall events is of importance, particularly for the estimation of impacts on society, economics, and the environment [7]. Among other sectors, this poses a challenge to urban drainage management, when considering that drainage systems will have to deal with increased frequency and volume of stormwater flows [8,9,10,11,12]. Traditionally, drainage systems have been designed as a collection of grey infrastructure that, in most cases, will not be able to cope with such changes in stormwater flows. The main purpose of these collector networks may not be flood protection; it is to capture the runoff from the early part of rainfall events with highest pollutant loads, and conveying this to wastewater treatment plants. It is common for collector networks to overflow during episodes of heavy rainfall and for shallow water to flow along the street for a short duration (few minutes to hours). One of the main causes for the occurrence of urban flooding is the limited capacity of the drainage system, which, under extreme rainfall conditions, may result in flow being discharged to the catchment surface where it interacts with the incoming overland flow. In such cases, water runs to natural or constructed storage or runs along the surface using the major system components (i.e., above ground drainage components) [13].
Design standards for drainage systems specify the performance that is expected in terms of capturing and conveying runoff water. Although the performance of drainage systems varies between countries, there is a common agreement as to how the required performance should be defined, and some actions have been taken to formulate general design guidelines to serve to the international community (e.g., ISO/CD 20325 [14]). The conventional design of urban drainage systems is often based on the definition of a return period, T, which corresponds to the frequency with which an event occurs [15], and assuming a certain probability of occurrence of the event of 1/T per year [16]. Design standards for drainage systems rarely include severe rainfall events, other than considering what happens when the drainage system is exceeded (e.g., BS EN752 [16]).
Planning collector networks (i.e., the minor drainage system) in order to manage severe rainfall events may result in having uneconomical infrastructure, and most of the times water will flow above ground as a result of the limited storage/conveyance capacity of the system when compared with the flows during severe rainfall events. The major drainage system typically comprises roads, footpaths, and natural ground depressions, as well as smaller water courses. This system can convey flood water over significant distances causing flooding at locations away from the point where the network capacity is exceeded [15]. This means that intra-urban flooding is a complex aggregate of different components, like the physical process of flooding, the use of floodplains, and the people and infrastructures that influence or are subject to flooding and its impacts [17]. This, in turn, adds considerable complexity to the analysis and management of flood risk in urban areas [18].
The need for managing the drainage system (as a whole) by taking into consideration a broader range of rainfall events has become more evident. While design events for collector networks are typically in the range of 1 to 10 years return period, exceedance events may be in the range of 50 to 100 years return period, with extreme events being even higher, in the range of 100 to 1000 years return period. Contrary to the design events, managing exceedance flows and flood waters for a certain frequency of occurrence (or magnitude of rainfall) is not straightforward, and setting an acceptable threshold value has proven to be difficult [19,20]. This is because the adoption of a rigid threshold/criterion might not be feasible in practice, especially when it has to be implemented for the city or drainage area/catchment as a whole. This particularly applies to existing urban areas, where exceedance flows have not yet been managed proactively. In these areas, the management of exceedance using a rigid threshold/criterion could lead to excessive adaptation cost, for example, when streets or building blocks have to be adapted in order to meet the proposed threshold/criterion. For new developments it is common practice to establish management criteria for building in low-risk/safe areas. However, when there are large catchments, these can generate hazardous flooding, for which structural works, such as protection channels or embankments are being built, associated with higher design standards (e.g., 100 years return period).
In spite of the practical difficulties in managing exceedance flows and flood waters, there is a call for adaptation of infrastructure and the spatial layout of built up areas to reduce economic losses, particularly in relation to extreme events [10,21,22,23,24,25]. Various approaches are available for understanding (the need for) and assessing adaptation actions, with many of these requiring an analysis of the impacts of rainfall (or other climate-related) events. Risk assessment is a standard approach that can be defined as the process of identifying, evaluating, selecting, and implementing adaptation actions to reduce risk to human health and ecosystems [12,26,27]. As explained in Zhou et al. [27], performing a risk assessment relies on the identification of the hazards, exposure, and vulnerabilities. Generally, hazards describe the external loadings in terms of return period, and exposure and vulnerabilities describe the spatial distribution of social groups and properties that are susceptible to impacts [28,29]. Difficulties in performing a risk assessment relate to the high level of uncertainties associated with its constituent components, assigning probabilities to different climate change and socio-economic scenarios, and valuing the impacts and costing the various adaptation actions [30,31].
As the standards-based approach (i.e., set return periods) has limitations in dealing with severe rainfall events and the risk-based approach is mainly applied for large scale adaptation projects (e.g., to manage coastal or river flooding), there is an opportunity to suggest a complementary approach. The objective of this paper is to demonstrate an approach that uses a risk matrix, and thereby takes advantage of some of the strengths of both the standards-based and risk-based approaches. From this, it is possible to introduce a guidance tool for defining the priority in taking adaptation actions in order to reduce the risk of intra-urban flooding. In the following sections, first the rationale behind the approach is described through a comparison of the standards-based and risk-based approach (Section 2). Then, the semi risk-based approach, including the concept of a risk matrix, is explained in a step-by-step manner (Section 3). The characteristics of the case study and model set up (Spaanse Polder in Rotterdam, The Netherlands) are presented in Section 4, followed by the application of the approach to this case study in Section 5. The paper ends with a reflection on both the approach and the case study, and conclusions.
2. Rationale
This section provides an overview of two well-established approaches for the design and analysis of drainage systems: the standards-based and the risk-based approach.
The standards-based approach is focused on keeping the system functioning for a certain design value, as the magnitude of the load, usually with small return periods. The design value (e.g., for rainfall intensity) is, in many cases, prescribed in regulations or design guidelines, which means that the need for stakeholder involvement (e.g., in setting acceptable threshold values) is limited. The analysis of the system functioning is done in a deterministic way, and for this analysis, the single design value is used. The approach aims to optimise the performance of the (minor) drainage system for a single objective (e.g., no water on streets), without considering the efficiency of investments to manage the potential impacts; as it does not weigh the benefits of interventions, in terms of reduced impacts, against the investment costs [32].
The risk-based approach incorporates the outcomes of both flood hazard and impact assessments, which allows for the comparison of different interventions based on their expected impacts [16]. Therefore, a risk-based approach helps to make informed choices after the analysis of benefit and costs of several alternative interventions. Usually, the benefit is the reduction of the expected annual damage (EAD). This corresponds to the average annual consequences that can be expressed in monetary terms representing the expected persons or properties affected by flooding. In practice, flood risk reduction is also used to refer to a reduction in water level, to a decrease in flood probability, to a reduced area at risk, or to fewer potential flood losses [33]. Contrary to standard-based approaches, the risk-based approach requires the participation of experienced stakeholders for configuring the probabilities and impacts to be included in the analysis. This approach is analytically costly and therefore not standard practice in analysis of the performance of drainage systems. There may also be a lack of information regarding the impact data and its relationship to various geographical scales (from catchment to precinct). Although some countries like The Netherlands, are developing standardized information for this.
Both of the approaches, based on standards and the analysis of risk, provide some advantages and disadvantages when undertaking an analysis of system performance. The aforementioned characteristics are considered for comparison in Table 1: type of analysis; the objective; the requirement of investment; the economic guidance; the involvement of stakeholders; and, the extent of practice.
This paper introduces a complementary approach to those above for working with a range of rainfall events, including extreme events. As the proposed approach builds upon the characteristics of both the standards-based and the risk-based approaches, it is termed the semi risk-based approach. This approach is intended to facilitate good housekeeping practices, which is aimed at tackling higher risk areas in the short term, while postponing the consideration of adaptation of medium risk areas to a later stage. This should be informed by the process of taking advantage of opportunities for mainstreaming adaptation, which will emerge from the interaction of investment cycles for different urban systems (roads, green spaces, social systems) [34,35]. The semi risk-based approach aims to provide decision support to the planning and urban design process and guidance for identifying adaptation actions, in terms of (interventions for) critical locations (i.e., hotspots).
The rationale for the semi risk-based approach can be derived from the mathematical relationship between risk, probability and consequences. This relationship has been explained from three perspectives by Klijn et al. [36], as shown in Figure 1. These authors represent risk as a function of the probability of flooding and the consequences, which are (in turn) determined by the exposure and vulnerability of the receptors (e.g., buildings and roads). A matrix representation, as proposed by the semi risk-based approach, is a straightforward way to describe this [37]. In the so-called risk matrix, the rows represent the probability (i.e., the frequency of occurrence) of flooding and the columns represent the severity of the consequences. The approach is coined semi-quantitative when one axis (usually probability) is based on a qualitative scale, while the other axis (usually consequences) is based on a qualitative scale [38]. This approach requires relative judgments to categorise the consequences, according to their (perceived) severity. This is often done by considering object-based vulnerabilities in terms of the type of objects or functions exposed to flooding. This is the most significant simplification of the (strict) risk-based approach, which quantifies the values at risk by using depth-damage curves [39]. The justification of this simplification is commonly the lack of quantitative information, such as about the flood damages resulting from rainfall flooding [40].
As discussed by Wall [37], the two parameters (probability and consequences) must be complemented by a third one, being the decision maker preference. This parameter describes how the decision maker values the possible outcomes representing the consequences. Risk cannot be quantified/qualified without the knowledge of how much the decision maker desires to avoid the different outcomes. This points to the need for a third dimension (or axis) to what is a two-dimensional matrix. In practice, this is accounted for by color-coding and/or scoring the cells of the risk matrix. Wall [37] demonstrates with mathematical relationships that if the color-codes and/or scores are not determined by the decision maker, then these do not represent risk and are meaningless. Furthermore, engagement with the decision maker and other stakeholders helps to increase their risk awareness. This also supports the process to engage more widely to access potentially less costly adaptation actions, as well as adaptation opportunities that are provided by urban (re)development and infrastructure investments.
In recent years, the understanding of the best ways to manage urban drainage has advanced in understanding and perspectives with different approaches emerging from research (e.g., [34,35]). However, this knowledge has not been taken up in practice and implementation of these good practices has been slow [41].
3. Semi Risk-Based Approach
The semi risk-based approach provides information and guidance for engineers and urban planners for defining the priority in which to take adaptation actions in anticipation of severe rainfall events. The proposed approach is based on the hydrological and hydraulic modelling of drainage systems using various rainfall events. The approach supports the identification of (cost-) effective interventions based upon the adaptation opportunities provided at specific locations that are at risk of flooding. In doing so, it promotes good housekeeping on the part of the drainage authority and/or municipality, along with other relevant stakeholders. The approach is set out below in a number of sequential steps.
3.1. Step 1. Selection of Events
The drainage system is subject to stress by hydrological drivers, being the range of possible rainfall events. Determining the probability/magnitude of rainfall events to be included in the analysis is the starting point of the semi risk-based approach. This should be done by the relevant stakeholders, such as the drainage authority, municipality, and others, like critical infrastructure providers, using a bottom-up assessment (also stress test). As stated by AGWA, the purpose of a stress test is to define the vulnerabilities of the system and to evaluate their occurrence within a certain range of magnitude of drivers, such as rainfall probability and/or intensity [42]. The selection of rainfall events, or classes of events, has to be made by the stakeholders by considering the local climate and other conditions, which is not usually straightforward. When historical records are available, it is possible to know how the system has previously responded to rainfall events, or at least the design event. This provides some indication of how to set the magnitude of rainfall relevant for the location. As a consequence of climate change, however, severe rainfall events will become increasingly common as well as increasingly intense. To reduce the significance of climate change uncertainty, the analysis can be executed by using fixed magnitudes of rainfall events. These represent a certain range of probabilities now and in the future, and should be defined according to local conditions. These pre-defined events will be used in the next step to model and map potential flooding.
3.2. Step 2. Modelling and Hazard Mapping
Modelling has an important role in understanding the performance of the minor drainage system, when considering its interaction with the urban terrain. It also provides understanding of where and how floodwaters are likely to collect and flow across the urban landscape, how fast they might rise and fall, and how frequent [43]. The role of modelling comprises the transition from raw data to analysed data and modelling outcomes, such as hazard maps [44]. Urban drainage modelling specifically involves the simulation of hydrological conditions, which is used for the analysis of the whole of drainage system response under these conditions and subsequently for analysing interventions. Therefore, the different rainfall events defined in the previous step need to be modelled and analysed to obtain improved knowledge about the functioning of the drainage system. Input data for this step include the temporal description of the rainfall event (i.e., hyetograph), a hydrological and hydraulic model of the drainage system, a digital elevation model (DEM), and parameter descriptions for the water exchange between the one-dimensional (1D) and two-dimensional (2D) model. The outcomes comprise a range of flood hazard maps that show the locations of inundation and simulated maximum water depths that are associated with the defined rainfall events. These hazard maps are used in the next step to develop risk maps, which form the baseline for the identification and assessment of interventions (step 4 and 5).
3.3. Step 3. Risk Categorization and Mapping
The flood hazard maps provide information on the areas susceptible to flooding based on the frequency of occurrence of the defined rainfall events. In this step, their frequency of occurrence is combined with the severity of flood damages, which can also be considered in different classes, such as: nuisance, minor damage, moderate damage, and major damage (adapted from [45]). The classification scheme for severity should be developed by the decision maker/stakeholders, and should preferably consider object-based vulnerability. Here, the classes could vary according to the type of object (building, road, etc.) and/or the function of the object (house, metro station, hospital, etc.). The classes might also take into account thresholds for the depth of flooding. This type of information is important, because e.g., 10 cm of water depths may be tolerable for some houses, but critical for metro stations or hospitals. However, the classification scheme will not typically consider vulnerability in terms of the values at risk and does not need detailed data about the impacts. The latter sets the semi risk-based approach apart from the strictly risk-based approach, and hence it might be considered to be a more (but not entirely) qualitative approach. The classification of severity requires inherently subjective judgments and/or arbitrary decisions about how to group the range of consequences into classes. Wall [37] notes that labels for the classes of probability and consequences use terms that vary from one application to the next, and that the meaning of these labels is open to interpretation. The need for subjective judgments, and the potential for inconsistencies in making such judgments, implies that there may be no entirely objective way to fill out a risk matrix [46].
The combination of frequency and severity gives an indication of the flood risk of an area. Different combinations of frequency and severity can be presented in a risk matrix. This is a matrix with several classes of frequency for its columns and several classes of severity or impact for its rows (see Figure 2). This associates a level of risk and/or some risk management action (based upon the tolerability of risk) with each row-column pair [46]. As for the frequency and severity classes, it is the role of the stakeholders to decide upon the definition of tolerable risk levels, and most importantly, upon the need for risk management actions. The risk matrix helps the stakeholders in identifying how a particular level of risk can be managed. For example, a (very) low risk, e.g., related to water on streets, would likely be tolerated by the stakeholders, whereas a (very) high risk, e.g., related to flooding of critical infrastructure, could be unacceptable. It is preferable to set up a stakeholder engagement process when deciding upon the tolerable levels of risk, and how this should be defined. This process should bring together the key stakeholders with a responsibility in managing flood risk, including the private sector, such as critical infrastructure providers. Through the engagement process, the negotiated risk matrix becomes meaningful for the stakeholders and local conditions. It also increases commitment for the implementation of risk management actions. The stakeholder process could be designed based on different approaches that are described elsewhere (e.g., [47]).
3.4. Step 4. Selection of Interventions
The levels of risk are the starting point for the selection of interventions. This is part of the engagement process with stakeholders. Stakeholder involvement is essential to better capture the specifics of the local context and it will also expand the available range of interventions to include options such as lowering street profiles or disconnecting areas from the collector network. The risk matrix and risk map provide the stakeholders with the information and guidance that is needed to define a timeline for interventions based on the tolerability of a level of risk. Specifically, it enables them to take account of the development dynamics in urban areas, such as the maintenance and renewal of infrastructure, buildings and public spaces [32]. In areas with (very) high risk (red colour), interventions are required most urgently, given the occurrence of severe damages. This indicates that these interventions have, in many cases, to be implemented in the short-term, often independent of any adaptation opportunity (i.e., mainstreaming). This is because adaptation opportunities will mostly occur in the medium term (next 5 to 30 years). The selection of interventions for areas with a medium risk (orange colour) is more challenging. In these areas, the damage that is caused is not so severe that it demands urgent action, and for that same reason the available budget is constrained. Here, a more detailed analysis may be required for the selection process, including the specific expertise of stakeholders (e.g., spatial planners). By sharing investment agendas, the stakeholders involved should aim to take advantage of adaptation opportunities that are provided by the dynamics of other urban systems, such as road maintenance. This could lead to cost savings on the implementation of interventions. In this case, there may be evidence from the analysis allowing for the postponement of the design and selection of interventions (to deal with a medium risk) to a later stage when the adaptation opportunity arises.
3.5. Step 5. Repetition and Refining
The semi risk-based approach is iterative in that it involves the repetition of steps 2 to 4 until the level of risk is lowered to a tolerable level. By doing this, the design or modifications of the drainage system (as a whole) can be undertaken in the most affordable manner. The involvement of stakeholders representing different sectors is desirable, particularly during steps 3 and 4 of the approach. Their involvement throughout the iterative process increases awareness among them about the effectiveness of possible interventions, and, in turn, secures feedback on the design that may result in innovative ways to manage flooding. This is because stakeholders have a better understanding of the area being studied and may think of interventions that are outside the engineer’s normal practices [49].
As part of the ongoing research collaboration with the City of Rotterdam, a drainage system was selected as a way to test the proposed approach. Rotterdam is a city with particular interest on developing new ways of managing urban flooding, and therefore it makes available relevant information for undertaking case studies.
4. Case Study and Model Set Up
4.1. Case Study and Stakeholder Involvement
Spaanse Polder is one of the 42 districts of Rotterdam, located in the northwest of the city. The district comprises a low-lying polder which covers a drainage area of 190 hectares with twenty-seven types of land use. This area is an industrial park that has been developed in the 1920s and further densified in the 1980s and 1990s. Almost 30% of the land use is unpaved surfaces covered by green space, whereas paved areas comprise both open paved and closed paved covered 70% of land use. A few green spaces are situated adjacent to open watercourses and along linear infrastructure like roads [50]. There is only one major road in the area running in the North-South direction. Figure 3 shows the location of the case study area.
Over the past two decades severe rainfall events have occurred in the area, which have led to water on the streets with the capacity of the drainage system being exceeded. In July of 2005, the area was subject to a severe rainstorm causing around 70 cm of water on the streets, which led to the saturation of the drainage system [50]. There were in total 170 affected buildings, including basements, households, and commercial buildings. As for the flooding mechanisms, pluvial flooding has been found as the main source of the problems. The following factors have worsened the impacts of these heavy rainfall events:
- The district has a high percentage of imperviousness (around 70% of the area) due to the dense urbanization. As a consequence, the hydrologic response to these heavy rainfall events is very fast and translates almost immediately into high runoff peaks.
- There are no storage facilities in which the rainwater can be collected, so surface runoff drains directly into the drainage system, causing flooding when extreme rainfall occurs.
- Under design rainfall conditions, rainwater is transported to the wastewater treatment plant by means of a pumping system. Under more severe rainfall conditions, an excess of stormwater is pumped out of the system towards the river Maas. However, the pump capacity is limited, and when the water volumes exceed this capacity, water is drained out of the system to surface water bodies.
The City of Rotterdam was involved in the case study as a partner of the Cooperative Research Centre for Water Sensitive Cities. Their involvement consisted mainly of the participation of two experts (a program manager and a policy advisor) in various research meetings. They provided advice on the development of the approach, as well as feedback on the results of its application. They also assisted in collecting relevant data, the 1D flood model and grey literature. A comprehensive process for stakeholder involvement was beyond the scope of the case study, which was the demonstration of the semi risk-based approach. It is recommended, however, that such a process is set-up within the proposed policy development trajectory on managing flood impacts.
4.2. Model Set Up
Simulation of the urban drainage system was performed using PCSWMM, which is an urban drainage modelling package with a GIS system providing a user-friendly interface [52]. The 1D drainage model simulates the pipe flow and the 2D overland flow model simulates the surface flow. The interaction between the two models occurs via connection nodes or structures, like manholes and open channels. The flood hazard extent has been assessed for the selected rainfall events, using this 1D-2D coupled model. The DEM was taken from the Dutch National System AHN2 with 0.5 m × 0.5 m of resolution. Using such resolution helped identify the occurrence of surface water in detail. In addition, the quality of the model is represented by the physical characteristics of e.g., land cover map and 1D sewerage network model developed from GIS database of sewer assets. Further data collection (e.g., water levels in an actual event in the channel) is required to improve predictions and even then, unless the event is of sufficient rarity, its validity for model verification could be questioned.
4.2.1. Overland Flow (2D)
PCSWMM performs 2D calculations by discretizing the 2D domain into a mesh consisting of various cells. In this case, the grid is adapted to specific details. In general, a grid size of 5 m for the main blocks, 1 m use for streets, and 0.5 m for small alleys or corridors. Each cell is represented by a 2D node, whose invert elevation is represented by the average bottom (or ground) elevation of that cell. All of the 2D nodes are connected to their adjacent nodes by 2D conduits or rectangular open channels. In order to preserve continuity, the surface areas of the nodes are usually small and the surface area in each cell is assigned to the 2D conduits connected to the node. The overland flow is spread according to the Shallow Water Equations (SWE) in two dimensions, including continuity and momentum. The routing step use in the model is 6 s, and the manning range from 0.012 to 0.025, according to the type of area.
4.2.2. Sewer Network (1D)
The 1D drainage model consisted of 637 manhole nodes, seven external weir nodes, and two boundary nodes (which serve as drainage outlets) connected by 691 pipes. The discharge into the system is computed as a function of rainfall and runoff factors. The runoff from built-up areas come into the (minor) drainage system collected through sub-catchments, assigned for each of the nodes, and generated in the 1D drainage model. As flow increases, water can flow out to the surface through the connections. Depending on the flow conditions, the 1D-2D coupled model allows water to flow back into the (minor) drainage system.
5. Results
The semi risk-based approach has been applied to Spaanse Polder in Rotterdam, the Netherlands. The focus of this application was on the demonstration of the approach as a guidance tool for defining the priority in taking adaptation actions to reduce the risk of intra-urban flooding.
5.1. Step 1. Selection of Events
For the case study (Spaanse Polder), the following intensities of rainfall were selected in consultation with the City of Rotterdam: 20, 40, 60, and 80 mm per hour. This broad range of events has been selected to obtain an understanding of how the drainage system responds to different pressures (i.e., rainfall intensities). According to the Dutch National Standards, the design event corresponds to 19.6 mm per hour. Here, the (design) performance of the minor drainage system was assessed with the 20 mm/h event. From this assessment, it was found that the minor drainage system has insufficient conveyance capacity in a number of locations, leading to water on the streets. This gave an initial indication of where flooding might be expected to occur for the more severe rainfall events.
5.2. Step 2. Modelling and Hazard Mapping
Simulation of events provided the water depths and velocities for the study area. Figure 4a shows the flood hazard extent for the design rainfall (i.e., 20 mm). It shows that a few areas have water on the streets. Whereas, the hazard map for the extreme rainfall (i.e., 80 mm) indicates that water on the streets occurs all across the sewer district (Figure 4b). This could be expected as the minor drainage system has not been designed to cope with such extreme rainfall. When combining the results of the model with land use information, the impacts have been initially categorized using a binary approach for determining inundation conditions (i.e., flooded or not flooded). However, the selection of the risk category requires consideration of the water depth, as the limits between different categories are defined by water depth (i.e., 5 and 10 cm for the case study), as can be seen in the following section. Results from the simulation are used for the risk categorization in the next step.
5.3. Step 3. Risk Categorization and Mapping
The hazard maps for the four rainfall events were combined with the impacts that were derived from a land use map, to obtain a single map with areas of (in) tolerable flood risk, using the risk matrix from Figure 4. As a first (sub) step, a limited number of objects/functions were considered for the severity classes: buildings, roads/access and power supply. This narrow focus resulted from the homogeneous land use of the case study area, being an industrial area. Almost all of the buildings in Spaanse Polder have an industrial function, like a garage, loading area, or storage area. For more heterogeneous areas, it is recommended that differentiation of the types of objects or functions is important, like houses, metro stations, and hospitals.
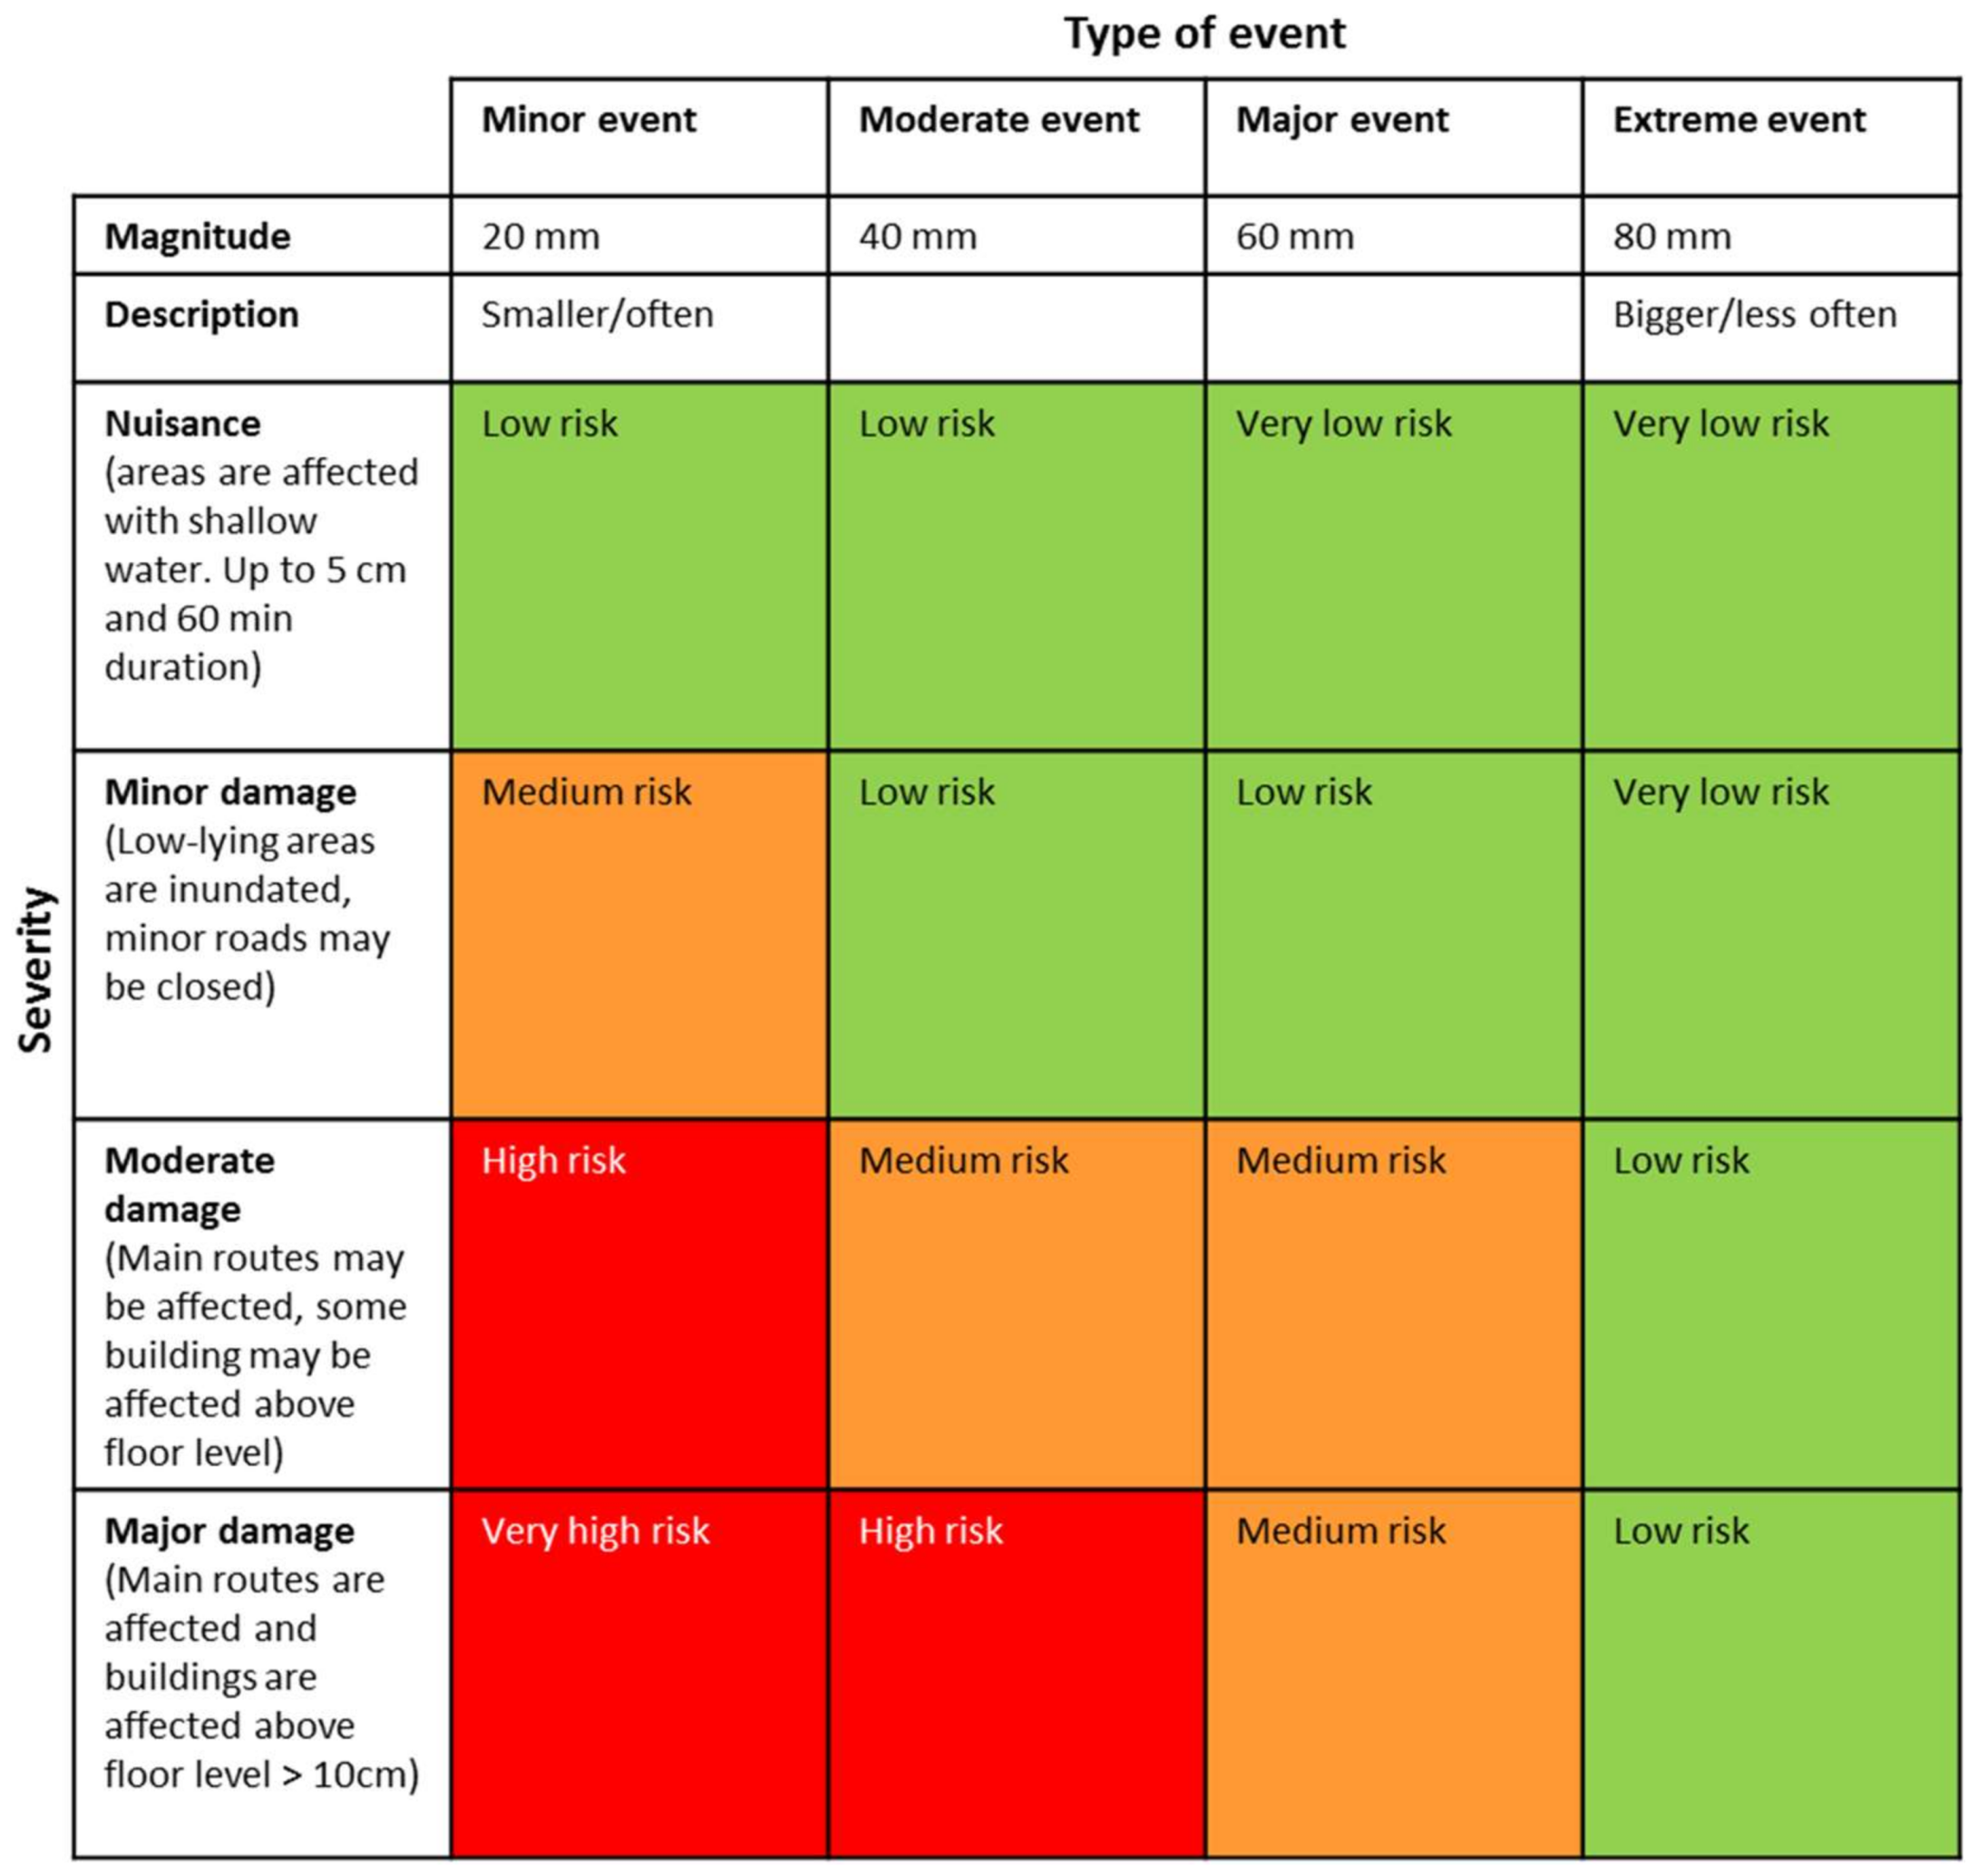
For the three objects/functions, a description of the consequences was developed together with the City of Rotterdam. For this case study, four classes of severity of the consequences were considered to be sufficient for the objects and functions being studied. The labels for these classes were: nuisance, minor damage, moderate damage, and major damage. Table 2 gives the descriptions per severity class and object/function. As can be observed from Table 2, criteria related to both exposure (being the depth of flooding) and vulnerability (being the type of object/function at risk, together with some critical threshold for damage or outage) have been used for the qualification of the severity. The velocity and duration of flooding were such that these criteria (for exposure) were not deemed to be relevant for the case study. That is the flow velocities were less than 1.1 m/s and the duration of flooding was less than 60 min. The descriptions per object/function have also been aggregated into general descriptions, as given in Figure 5 and below. In the development of the descriptions, the City of Rotterdam has learned from the good practices of the City of Melbourne [45], which is also a partner in of the CRC for Water Sensitive Cities.
The classes of rainfall intensities and severity were subsequently combined to obtain different subjective levels of risk, ranging from very low to very high risk. The lowest class of severity corresponds to nuisance, and the levels of risk that have been associated with this class were low risk and very low risk. Here, shallow water is allowed to flow across land surfaces; this means up to 5 cm of water and up to 60 min in duration. These flows will cause nuisance for the occupants, but all the services and business activities will continue to function. The next class corresponds to minor damage, and three levels of risk have been assigned to this class: very low risk for the extreme event, low risk for the major and moderate events, and medium risk for the minor event. This severity class indicates that low-lying areas are inundated, with some minor roads potentially being closed and flood water flowing into some backyards. The third category corresponds to moderate damage, and has been assigned three levels of risk: low risk for the extreme event, medium risk for the major and moderate events and high risk for the minor event. Within this class, main traffic routes may be affected as well as some buildings above the ground floor level. The most severe class has been described as major damage, where buildings may be inundated by more than 10 cm of water. In addition, some main routes and utility services may be impacted, which could lead to a closure to traffic or utility service interruptions. This class has been associated with four levels of risk, ranging from a low risk for the extreme event to a very high risk for the minor event.
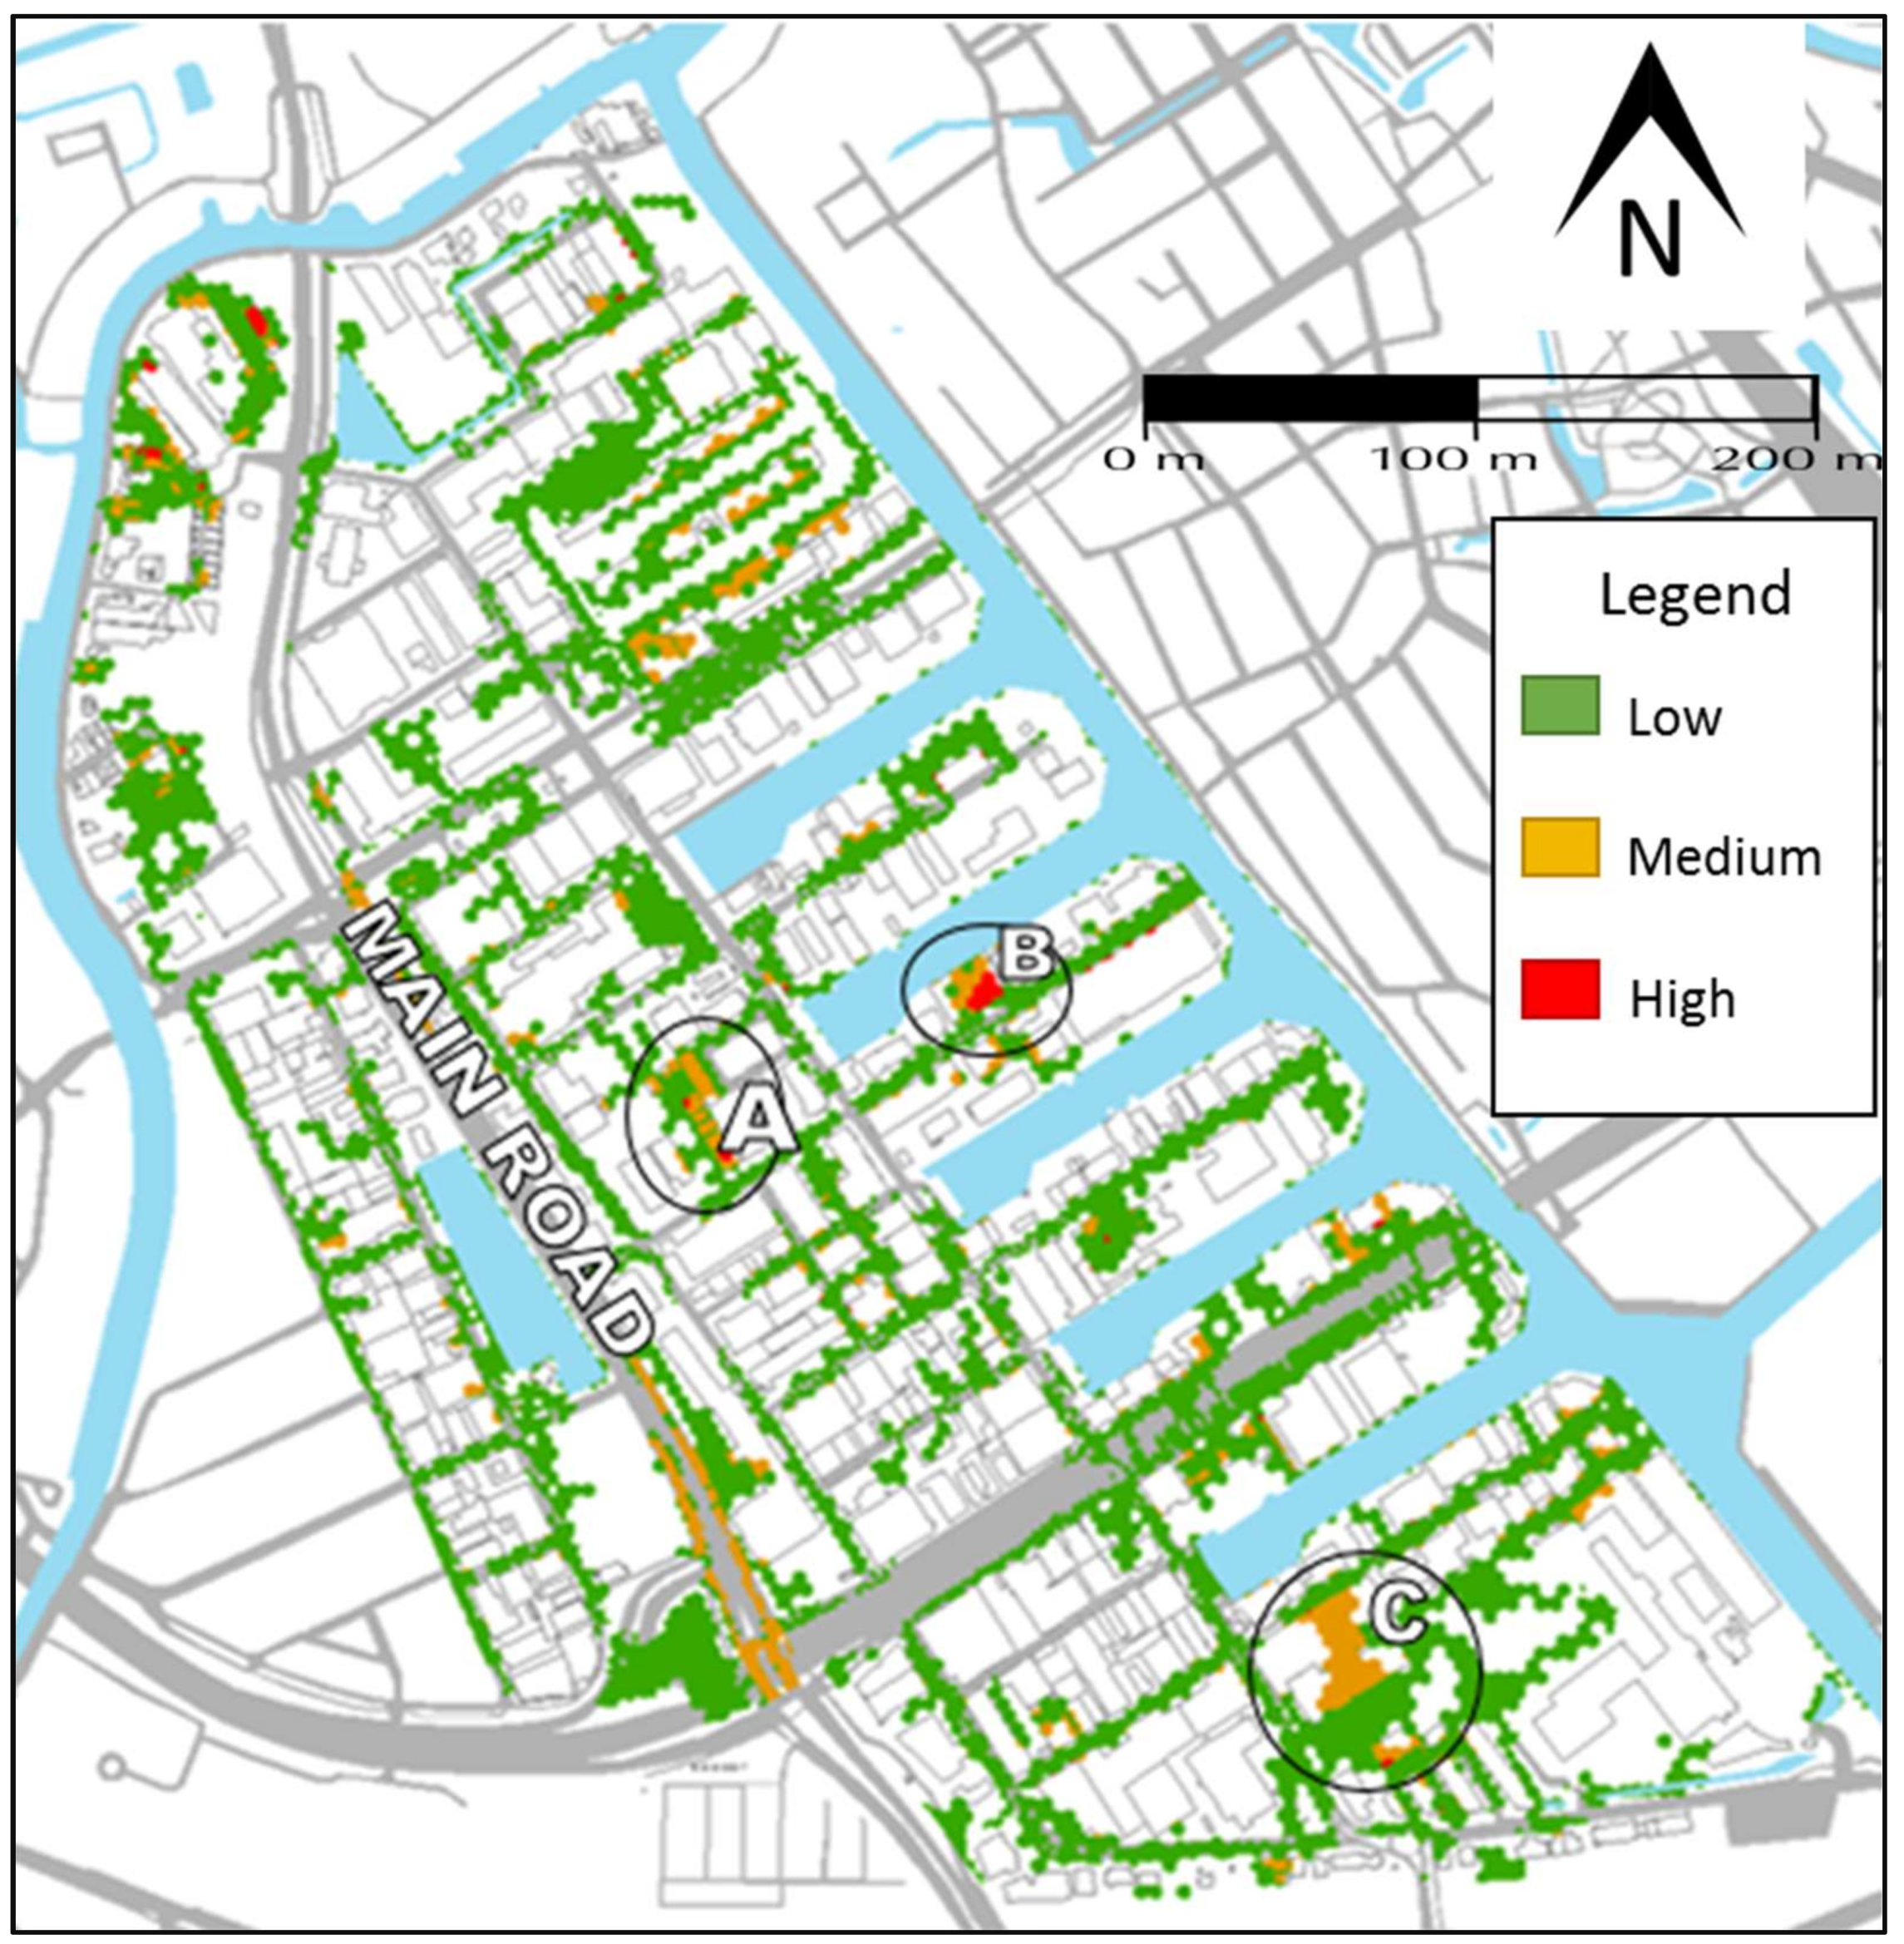
The levels of risk translated to a risk map of the sewer district in accordance with the combinations of frequency and severity are given in Figure 5. This was done by overlapping the four hazard maps with one another in GIS, placing the map for the extreme event at the bottom. The resulting risk map, as shown in Figure 5, has a few areas with high and very high risk, requiring attention for identifying and selecting interventions to reduce the flood risk to a tolerable level, being either medium or (very) low risk. These areas are marked with A, B, and C in Figure 6. The main traffic route is affected, but most of the areas of Spaanse Polder are classified as very low or low risk. As a rough validation step, a site visit has been made to the areas with the highest risk to obtain an understanding of the flow of water on streets. In this regard, it is noted that the area located in the northern most corner is a private precinct, which was not accessible for a site visit. Through the research meeting, the experts from the City of Rotterdam furthermore confirmed the identified areas as being exposed to flooding.
5.4. Step 4. Selection of Interventions
Following the risk categorization and mapping, a short list of interventions was proposed as a way to improve the current situation for the areas that are most at risk. This has considered the characteristics of the topography, type of construction, type of property, and the connection (or rather, distance) to the open water system. The aim for selecting the interventions was their potential in lowering the risk level to a tolerable level. The following interventions were considered:
- Disconnection from the drainage system. This can be done in the areas near to open water bodies, such as canals.
- Lowering the profile of streets. By lowering specific streets more water can be stored within the street profile or can be diverted to a temporal storage, such as a green space. This appears most favourable in (large) open spaces, like parking areas.
- Flood proofing of buildings. Placing physical barriers in front of a building for preventing water flowing into the structure. This intervention can be realised at the building scale and with a low investment cost.
The interventions were selected as the result of a consultation with experienced professionals and stakeholders, who helped to define promising actions to be taken.
5.5. Step 5. Repetition of Step 2 to 4 and Refinement
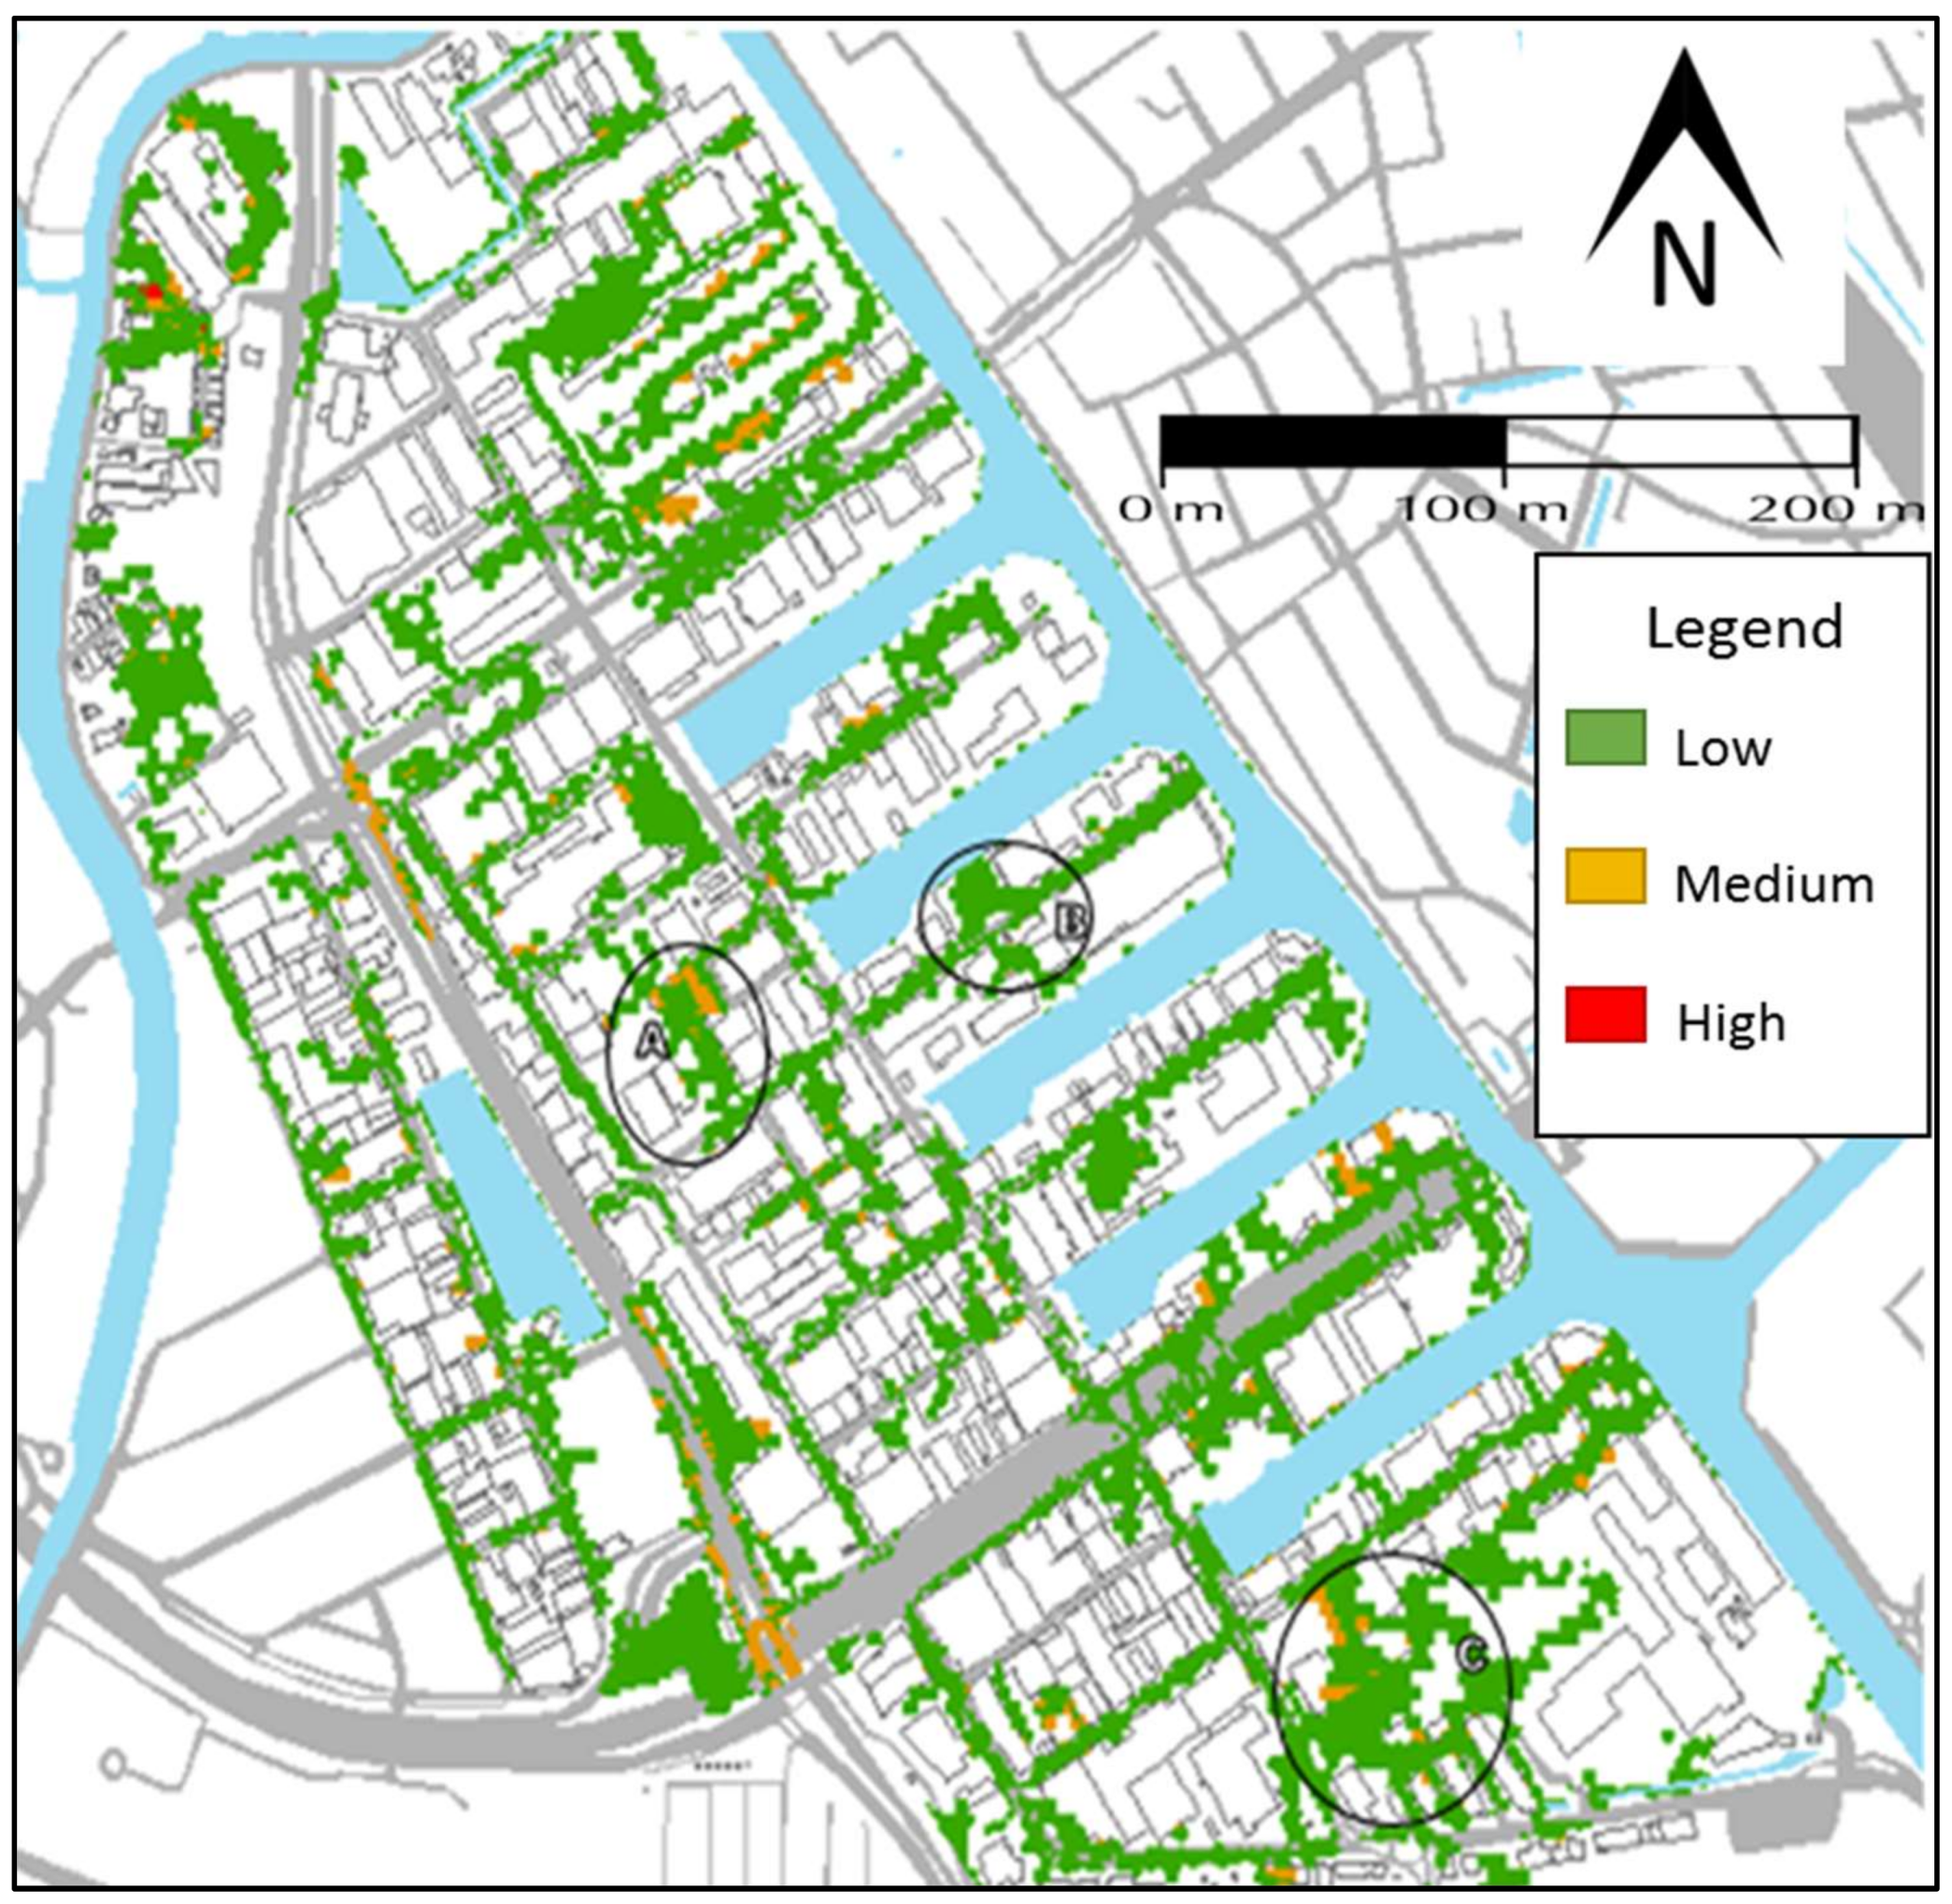
The proposed interventions were first modelled individually to check their performance and effects on reducing flooding or its impacts. The interventions that were included in the simulation/analysis were: changes in the street profile (in zone C), disconnection of areas (in zone B), and flood-proofing buildings (in zone A). As the affected areas are small and relatively far from each other, the effect of the interventions proved to be very local, but nonetheless positive in reducing the risk level. Subsequently, all of the interventions were combined and their effect was analysed and translated into a risk map with the interventions in place (Figure 7).
In zone A, flood proofing of buildings reduced the level of risk from very high to low, although there is a small area where the risk has not changed (medium risk). In zone B, the disconnection of the area has been effective as the level of risk has been reduced from high to low. By this intervention, water is no longer running into the (minor) drainage system, but directly to the open water system that was located at the border of the neighbourhood. The intervention proposed in zone C shows that lowering the profile of streets is effective in reducing the level of risk from medium to low. In this area, the change in street profile was modelled in combination with lowering the parking area, so that it can retain flood water.
6. Discussion
The discussion is presented with respect to the model, the approach, and the application using the case study.
6.1. Reflections on the Model
The computational domain of the model presents limitations that can be analysed. Some of the aspects include: the boundaries, friction map, grid resolution, the equations, the program, and physical domain. In this case, different options were selected. One change in the settings in PCSWMM (e.g., dynamic wave to diffusion wave equations) would slightly vary the results in the flood extent and depth. First, boundaries of the model are chosen according to the area of study. There is no initial level and discharge exchange. As a result, the depth of water remains the same inside and outside the area. Second, the friction map is selected according to the surfaces: paved, unpaved, sloped, and flat roofs, the Manning values are averaged for each type of surface. Third, the irregular grid uses different sizes of polygons according to the specific area, for instance, roads are smaller than buildings. After manipulation of the DEM, it takes an average value for each polygon, which can generate some changes in the surface. Fourth, the equations used to solve the water movement in the surface are the Shallow Water Equations in two dimensions, which means that the analysis excludes the acceleration term in the vertical axis and it is considered as a full dynamic model. It is convenient because the water level (z) is smaller when compared with the flood extent area (x, y). [53]. It is also possible to simulate using the diffusion wave equations to reduce the computational time of the model, but this would not then use the acceleration and pressure terms [54]. Each of these factors are assumptions that set limits to the model.
In the physical domain, the velocity is interpreted according to the characteristics of the study area: terrain and type of flood. First, the terrain is low-lying land, with elevations varying from −0.5 m to 1 m above Dutch National Datum (i.e., NAP). This is one of the main reasons for simplifying the hazard maps to exhibit water depth only. Second, another reason is related to the type of flood. In this case, pluvial flood, which starts from rainfall events. Then, the velocities are lower when compared to the velocities from a fluvial (river) flood. Although, it is advisable to include also fluvial and coastal flood in the model simulation for a complete representation.
In terms of the impacts, it is possible to consider the buildings, pedestrians, and/or vehicles. First, the representation of the ground levels without the physical representation of the buildings suggests which structures will have problems of water coming into properties. The walls or hard boundaries of the buildings could modify the path of the flood. However, due to the low velocities that remain in a range of 0 to 1.1 m/s, and shallow depths, this is not considered. In order to improve the accuracy of the simulation it would be useful to include in the DEM the elevation of the property thresholds (e.g., 10 cm). Second, the pedestrians. If the study area had velocities in the range 1.17 to 3.17 m/s, when a person feels unsafe, the vulnerability for the pedestrians will increase [55,56]. Third, the vehicles. In Figure 6, there are some places that could present difficulties for driving such as A, B or the main road. However, the multiplication of velocity and water depth does not represent a stability problem according to the proposed AR&R draft stability criteria for stationary vehicles (e.g., equation of stability for small vehicles ) [57].
Additionally, there is lack of field data to calibrate and validate the flood extension of the model. In the absence of data for the study area (e.g., satellite images, eye-witness map of actual flood events), it is advisable for stakeholders to recognize and verify the places flooded. However, this is not physical validation of the water extent and depth, which should be determined, for example, by varying the computational domain of the model (e.g., friction coefficient), to compare it statistically with a historical event, and changing it until there is the best approximation to observations [58]. Nevertheless, this 1D-2D model could be used as a reference for 1D/1D a fast assessment model [59] [60]. The calibration coefficient of the weirs for the connection in 1D to 2D is another factor that can modify the flood map with steady or unsteady flow [61]. In the same way, the process to convert rainfall to runoff can be further elaborated [62], for example the connections of the roofs that go directly to the sewer network can be included. Regarding the storage capacity of the sewer network, the manholes use a maximum volume of 1 m3.
6.2. Reflections on the Approach
Standards-based approaches are most common practice in designing drainage systems. These approaches require the definition of specific levels of service in order to assure the serviceability of the system under such conditions, generally linked to a single objective (e.g., conveyance of runoff). In contrast, risk-based approaches have been extensively used in flood and coastal risk management. A risk-based approach requires extensive work on the impacts/consequences, focused on economic values of vulnerable objects [21]. For flood or coastal risk analyses, typically significant resources are made available for the analysis as well as data from studies that authorities have already conducted. These approaches have not often been used for drainage systems [21], mainly due to a lack of information regarding the consequences for the objects/functions affected and the scale of any affected areas. This points to the need to incorporate (into practice) new ways of planning and designing drainage systems that facilitate the analysis of the impacts from rainfall events in a simple and practical way. A potential way to do this is the adoption of the semi risk-based approach. This approach overcomes the resource and data constraints of the strict risk-based approach by qualitatively describing object-based vulnerabilities (instead of quantifying the values at risk). A qualitative scale is used to distinguish between the most severe and less severe consequences for the objects/functions. A quantitative scale is applied only to the probabilities. Although the risk matrix is only an approximate tool, the analysis and interpretations to underpin management decisions are a significant improvement over the standard-based approach as the impacts are taken into account.
Although it requires fewer resources and data, the semi risk-based approach still requires a rigorous analysis. The involvement of the decision maker/stakeholders in the analysis is crucial for the outcomes (i.e., the levels of risk) to be meaningful. This is because the risk is determined by the decision maker preferences over the possible values of the outcomes, and these preferences should be incorporated in the development of the risk matrix [37]. In addition, the process to involve stakeholders will help to increase their risk awareness. The semi risk-based approach visualizes the level of risk in an area with a risk matrix and risk map. This mapping is helpful when involving stakeholders, other than engineers, because they can observe where and how the flood impacts occur. The risk matrix and risk map can also be useful instruments for spatial planning, such as for the zoning of different land uses according to the (potential) level of risk. This is particularly relevant for decision makers (e.g., urban planners) who need to take decisions on how to deal with flood risk in new or redevelopments.
An advantage of the semi risk based approach is that it facilitates the connection of interventions with adaptation opportunities. By defining the tolerable risk levels in a more flexible way, the management of flood risk in an area can be connected with the adaptation opportunities [32]. These are opportunities that may occur at a localised and small scale in order to intervene in the development process. Such fit-for-purpose interventions can facilitate the transformation of an entire area at higher scale level, by the aggregation of many smaller interventions. The connection with adaptation opportunities is also facilitated because the tolerable levels of risk give an indication about the timing (i.e., prioritization) of interventions. Those interventions for dealing with (very) high risk areas require implementation in the short-term, while other interventions (i.e., for medium risk areas) could be postponed to the mid-term or even longer. Such interventions, in particular, can be timed to coincide with other investments in an area. In contrast to this, establishing rigid thresholds (tolerable levels) for the probability or risk, such as set return periods, may lead to over-dimensioned interventions that will require excessive, stand-alone investments.
A further advantage of the semi risk-based approach is that it does not consider monetary values at risk. As shown by Thaler et al. [63], risk-based approaches tend to contribute to distribute the investments to locations with high-value properties, leaving the poor unprotected or less protected from the same hazard. This is because investments are prioritized based on their benefit-cost ratio (from highest to lowest). As the semi risk-based approach does not use a benefit-cost rationale, it is less likely to give rise to social injustice.
The limitations of the use of risk matrices have been identified by Cox [46], and these also apply for its use for drainage systems. This includes the following limitations. Risk matrices can assign the same level of risk to quantitatively very different risks. They can even wrongly assign higher qualitative ratings to quantitatively smaller risks. This is particularly the case if some of the consequence severities are associated with large variances in severity. Thirdly, the classes provided by risk matrices do not necessarily support efficient decision making on investments in risk management measures. This is because the approach does quantify/monetise the impacts or the potential benefits (being the reduction in the impacts). Lastly, the classifications of severity cannot be made objectively and these classifications, along with the outputs (i.e., levels of risk) require subjective interpretation.
Regarding its use in urban drainage, we have identified the time needed for the flood modelling as a potential limitation. In particular, this may be substantial for the 2D model. Furthermore, there is potential for the improvement of the approach by considering all types of flooding in the analysis. This may prove beneficial for urban areas located in coastal zones, for example, because the effects of the interaction of different sources happen at the same time, when considering that there may be consequences from extensive fluvial floods, the breaching of coastal defenses without good warning, urban areas flooded by intensive and sudden rainstorm events, leading to rapid runoff and high flood water velocities, and floods in small steep catchments [33]. This is especially important in contexts where different sources of flooding are present, like in Rotterdam.
6.3. Reflections on the Case Study
Having most of its area covered by pervious surfaces, Spaanse Polder does not offer much room for implementing alternative solutions without changing the nature of the surfaces extensively [46]. However, by tackling the problem in a localised way, first at urban catchment level and then at a precinct level, the neighbourhood problems from overflowing water from the drainage system on to the streets can be tackled. Considering that there are three main areas where the biggest damages occur (zones A, B and C in Figure 4), and that these are not directly connected, the interventions can be implemented independently. Moreover, as the interventions are proposed at small scale, they are likely to be affordable, especially if they are associated with some ongoing works in other urban systems, like the renovation of street surface or changes in land use or building situation, which can result in reducing the cost of the interventions [33,64].
As shown in Figure 4a, the interventions needed for the standards-based approach have a different focus to that identified using the range of rainfall events used for the semi risk-based approach. The results from the standards-based approach do not always necessitate the need to intervene, whereas the results from the semi risk-based approach highlight the localised hot spots. This may lead to investment in areas that are not those most affected by extreme events. In some areas, the effect of the proposed interventions has been shown to provide limited reduction of water on the streets (i.e., flood proofing buildings in Area A). As urban drainage systems degrade with time, this type of analysis should be undertaken recurrently, so that results can be updated for the capacity of coping with impacts, and to propose new interventions when needed.
Financing of the interventions shown to be effective in the analysis process illustrated here is often difficult due to the allocation of responsibilities and the willingness or ability to pay. Some interventions, like changing the profile of streets, is the responsibility of the municipality or the competent authority, whereas flood proofing or disconnection responsibilities are not as clear, especially in an area that is mainly industrial and for which the benefits of the interventions are not necessarily evident to the residents. The City of Rotterdam has defined a new strategy for opportunistic investment, meaning that they are able to defer the interventions that are proposed in this work until a mainstreaming opportunity appears in the area. This also means that this approach may not be adopted as regulation, but rather be kept as one of the ways for assessing adaptation needs.
Some drawbacks of the approach may be identified. Firstly, the approach does not provide any indication about the economic benefit of the selected interventions. This is because the priorities are assigned by the defined risk levels (the matrix in Figure 2) that focus the investments to the high-risk locations. Secondly, the approach is dependent on the time that is needed for the modelling of the drainage system. Finally, the involvement of stakeholders depends on the context of application. As explained before, the definition of magnitude of events and risk tolerance is mainly decided in consultation with stakeholders, and therefore their participation becomes very important for the proper understanding of the context and occurrence of flood risk.
7. Conclusions
A semi risk-based approach for urban flood assessment and response has been presented as a simple way of supporting the process of decision making about the location for implementing the possible interventions according to the risk level defined in consultation with relevant stakeholders. The approach defines priority of actions depending upon the urgency highlighted in the analysis (Step 3 and Step 4). The approach has been shown here to be feasible and simple to apply without the need for the extensive analysis of the economics behind the selection of interventions.
The semi-quantitative risk-based approach helps to structure the analysis across a broad range of rainfall events in a simple way and to comprehensively illustrate the results for the stakeholders. The latter helps to facilitate engagement of stakeholders in the design process. It is helpful for raising the awareness about the occurrence of extreme rainfall events among non-technical stakeholders. Although extreme events are usually considered to be a threat, they may also represent an opportunity to implement change in practice, encouraging decision makers to take urgent actions and to adopt a long-term perspective [65]. This, however, requires a change in the current practice of managing urban drainage systems by incorporating the innovation that is needed to deal with extreme rainfall and the exceedance flows that are generated as the result of such events [19].
Although the case study presented here does not demand extensive research of possible interventions, mainly because of its industrial nature, it has shown the usefulness of the approach. Further use and evaluation of the approach is needed in order to gain more evidence of its application when dealing with extreme rainfall and/or other sources of flooding.
Acknowledgments
This paper has been written in the framework of the CRC Water Sensitive Cities, in which the authors participate in the project ‘B4.2: Socio-Technical Resilience in Water Sensitive Cities—Adaptation across Spatial and Temporal Scales’. The authors thank the collaboration and support provided by the City of Rotterdam for this research. PCSWMM v5.4 software used for 1D-2D modelling was provided by Computational Hydraulics Education through an educational grant. The authors thank Zohre Naderi and Virdiyana Yuser for their contribution during their M.Sc. studies.
Author Contributions
The paper is based on the results from the research of Carlos Salinas-Rodriguez. Carlos Salinas-Rodriguez, Berry Gersonius, Chris Zevenbergen, and Richard Ashley contributed equally in the production of the present manuscript; David Serrano helped to improve the paper.
Conflicts of Interest
The authors declare no conflict of interest.
References
- IPCC. Climate Change 2013: The Physical Science Basis. Contribution of Working Group I to the Fifth Assessment Report of the Intergovernmental Panel on Climate Change; Cambridge University Press: Cambridge, UK, 2013; p. 1535. [Google Scholar]
- Fischer, E.M.; Knutti, R. Observed heavy precipitation increase confirms theory and early models. Nat. Clim. Chang. 2016, 6, 986–991. [Google Scholar] [CrossRef]
- Willems, P.; Olsson, J.; Arnbjerg-Nielsen, K.; Beecham, S.; Pathirana, A.; Gregersen, I.B.; Madsen, H. Impacts of Climate Change on Rainfall Extremes and Urban Drainage Systems; IWA Publishing: London, UK, 2012. [Google Scholar]
- Westra, S.; Fowler, H.J.; Evans, J.P.; Alexander, L.V.; Berg, P.; Johnson, F.; Kendon, E.J.; Lenderink, G.; Roberts, N.M. Future changes to the intensity and frequency of short-duration extreme rainfall. Rev. Geophys. 2014, 52, 522–555. [Google Scholar] [CrossRef]
- Willems, P.; Olsson, J.; Arnbjerg-Nielsen, K.; Beecham, S.; Pathirana, A.; Gregersen, I.B.; Madsen, H. Impacts of climate change on rainfall extremes and urban drainage systems: A review. Water Sci. Technol. 2013, 68, 16–28. [Google Scholar] [CrossRef]
- Pathirana, A.; Denekew, H.B.; Veerbeek, W.; Zevenbergen, C.; Banda, A.T. Impact of urban growth-driven landuse change on microclimate and extreme precipitation—A sensitivity study. Atmos. Res. 2014, 138, 59–72. [Google Scholar] [CrossRef]
- Shinyie, W.L.; Ismail, N.; Jemain, A.A. Semi-parametric Estimation for Selecting Optimal Threshold of Extreme Rainfall Events. Water Res. Manag. 2013, 27, 2325–2352. [Google Scholar] [CrossRef]
- Arnbjerg-Nielsen, K. Quantification of climate change effects on extreme precipitation used for high resolution hydrologic design. Urban Water J. 2012, 9, 57–65. [Google Scholar] [CrossRef]
- Butler, D.; McEntee, B.; Onof, C.; Hagger, A. Sewer storage tank performance under climate change. Water Sci. Technol. 2007, 56, 29–35. [Google Scholar] [CrossRef] [PubMed]
- Zhou, Q.; Panduro, T.E.; Thorsen, B.J.; Arnbjerg-Nielsen, K. Adaption to Extreme Rainfall with Open Urban Drainage System: An Integrated Hydrological Cost-Benefit Analysis. Environ. Manag. 2013, 51, 586–601. [Google Scholar] [CrossRef] [PubMed] [Green Version]
- Olsson, J.; Amaguchi, H.; Alsterhag, E.; Dåverhög, M.; Adrian, P.E.; Kawamura, A. Adaptation to climate change impacts on urban storm water: A case study in Arvika, Sweden. Clim. Chang. 2013, 116, 231–247. [Google Scholar] [CrossRef]
- Mailhot, A.; Duchesne, S. Design Criteria of Urban Drainage Infrastructures under Climate Change. J. Water Res. Plan. Manag. 2010, 136, 201–208. [Google Scholar] [CrossRef]
- Maksimović, Č.; Prodanović, D.; Boonya-Aroonnet, S.; Leitão, J.P.; Djordjević, S.; Allitt, R. Overland flow and pathway analysis for modelling of urban pluvial flooding. J. Hydraul. Res. 2009, 47, 512–523. [Google Scholar] [CrossRef]
- ISO. ISO/CD 20325 Service Activities Relating to Drinking Water Supply and Wastewater Systems—Guidelines for Stormwater Management in Urban Areas; ISO: Geneva, Switzerland, 2009. [Google Scholar]
- CIRIA. C635 Designing for Exceedance in Urban Drainage—Good Practice; CIRIA: London, UK, 2014. [Google Scholar]
- BS EN 752. Drain and Sewer Systems Outside Buildings; NBS: Newcastle, UK, 2008.
- Sayers, P.; Meadowcroft, I. RASP-A Hierarchy of Risk-Based Methods and Their Application; HR Wallingford: Wallingford, UK, 2005. [Google Scholar]
- Kellagher, R.; Sayers, P.; Counsell, C. Developing a risk-based approach to urban flood analysis. In Proceedings of the 11th International Conference on Urban Drainage, Edinburgh, UK, 31 August–5 September 2008. [Google Scholar]
- CIRIA. Managing Urban Flooding from Heavy Rainfall (Encouraging the Uptake of Designing for Exceedance)—Literature Review; CIRIA: London, UK, 2014. [Google Scholar]
- Mugume, S.N.; Butler, D. Evaluation of functional resilience in urban drainage and flood management systems using a global analysis approach. Urban Water J. 2017, 14, 727–736. [Google Scholar] [CrossRef]
- Kirshen, P.; Caputo, L.; Vogel, R.M.; Mathisen, P.; Rosner, A.; Renaud, T. Adapting Urban Infrastructure to Climate Change: A Drainage Case Study. J. Water Res. Plan. Manag. 2015, 141, 04014064. [Google Scholar] [CrossRef]
- Kleidorfer, M.; Mikovits, C.; Jasper-Toennies, A.; Huttenlau, M.; Einfalt, T.; Rauch, W. Impact of a Changing Environment on Drainage System Performance. Procedia Eng. 2014, 70, 943–950. [Google Scholar] [CrossRef]
- Pregnolato, M.; Ford, A.; Glenis, V.; Wilkinson, S.; Dawson, R. Impact of Climate Change on Disruption to Urban Transport Networks from Pluvial Flooding. J. Infrastruct. Syst. 2017, 23, 04017015. [Google Scholar] [CrossRef]
- Rosbjerg, D. Optimal adaptation to extreme rainfalls in current and future climate. Water Res. Res. 2017, 53, 535–543. [Google Scholar] [CrossRef]
- Löwe, R.; Urich, C.; Domingo, N.S.; Mark, O.; Deletic, A.; Arnbjerg-Nielsen, K. Assessment of urban pluvial flood risk and efficiency of adaptation options through simulations—A new generation of urban planning tools. J. Hydrol. 2017, 550, 355–367. [Google Scholar] [CrossRef]
- Jones, R.N. An environmental risk assessment/management framework for climate change impact assessments. Nat. Hazards 2001, 23, 197–230. [Google Scholar] [CrossRef]
- Zhou, Q. A Review of Sustainable Urban Drainage Systems Considering the Climate Change and Urbanization Impacts. Water 2014, 6, 976–992. [Google Scholar] [CrossRef]
- The World Bank. Risk and Opportunity. Managing Risk for Development; The World Bank: Washington, DC, USA, 2013. [Google Scholar]
- UNISDR. UNISDR Terminology on Disaster Risk Reduction; UNISDR: Geneva, Switzerland, 2009. [Google Scholar]
- Dessai, S.; Hulme, M. Does climate adaptation policy need probabilities? Clim. Policy 2004, 4, 107–128. [Google Scholar] [CrossRef]
- Olsen, A.S.; Zhou, Q.; Linde, J.J.; Arnbjerg-Nielsen, K. Comparing Methods of Calculating Expected Annual Damage in Urban Pluvial Flood Risk Assessments. Water 2015, 7, 255–270. [Google Scholar] [CrossRef] [Green Version]
- Gersonius, B.; Nasruddin, F.; Ashley, R.; Jeuken, A.; Pathirana, A.; Zevenbergen, C. Developing the evidence base for mainstreaming adaptation of stormwater systems to climate change. Water Res. 2012, 46, 6824–6835. [Google Scholar] [CrossRef] [PubMed]
- Salinas Rodriguez, C.N.; Ashley, R.; Gersonius, B.; Rijke, J.; Pathirana, A.; Zevenbergen, C. Incorporation and application of resilience in the context of water-sensitive urban design: Linking European and Australian perspectives. Wiley Interdiscip. Rev. Water 2014, 1, 173–186. [Google Scholar] [CrossRef]
- Haasnoot, M.; Kwakkel, J.H.; Walker, W.E.; ter Maat, J. Dynamic adaptive policy pathways: A method for crafting robust decisions for a deeply uncertain world. Glob. Environ. Chang. 2013, 23, 485–498. [Google Scholar] [CrossRef]
- Lansey, K. Sustainable, robust, resilient, water distribution systems. In Proceedings of the WDSA 2012: 14th Water Distribution Systems Analysis Conference, Adelaide, Australia, 24–27 September 2012. [Google Scholar]
- Klijn, F.; Kreibich, H.; De Moel, H.; Penning-Rowsell, E. Adaptive flood risk management planning based on a comprehensive flood risk conceptualisation. Mitig. Adapt. Strateg. Glob. Chang. 2015, 20, 845–864. [Google Scholar] [CrossRef]
- Wall, K.D. The Trouble with Risk Matrices; DRMI Working Papers Ongoing Research; Naval Postgraduate School: Monterey, CA, USA, 2011. [Google Scholar]
- Emblemsvåg, J.; Endre Kjølstad, L. Qualitative risk analysis: Some problems and remedies. Manag. Decis. 2006, 44, 395–408. [Google Scholar] [CrossRef]
- Martins, R.; Leandro, J.; Djordjević, S. Influence of sewer network models on urban flood damage assessment based on coupled 1D/2D models. J. Flood Risk Manag. 2016. [Google Scholar] [CrossRef]
- Spekkers, M.H.; Clemens, F.H.L.R.; Ten Veldhuis, J.A.E. On the occurrence of rainstorm damage based on home insurance and weather data. Nat. Hazards Earth Syst. Sci. 2015, 15, 261–272. [Google Scholar] [CrossRef]
- Butler, D.; Ward, S.; Sweetapple, C.; Astaraie-Imani, M.; Diao, K.; Farmani, R.; Fu, G. Reliable, resilient and sustainable water management: The Safe & SuRe approach. Glob. Chall. 2017, 1, 63–77. [Google Scholar]
- Alliance for Global Water Adaptation. Climate Resilient Investment/Climate Risk Informed Decision Analysis; AGWA: Amsterdam, The Netherlands, 2016. [Google Scholar]
- Melbourne Water. Flood Management Strategy-Port Phillip and Westernport; Melbourne Water: Melbourne, Australia, 2015. [Google Scholar]
- Price, R.K.; Vojinovic, Z. Urban flood disaster management. Urban Water J. 2008, 5, 259–276. [Google Scholar] [CrossRef]
- Melbourne Water. Draft Flood Management Strategy Port Phillip and Westernport; Melbourne Water: Melbourne, Australia, 2015. [Google Scholar]
- Cox, L.A.T. What‘s wrong with risk matrices? Risk Anal. 2008, 28, 497–512. [Google Scholar] [PubMed]
- Van Herk, S.; Zevenbergen, C.; Ashley, R.; Rijke, J. Learning and Action Alliances for the integration of flood risk management into urban planning: A new framework from empirical evidence from The Netherlands. Environ. Sci. Policy 2011, 14, 543–554. [Google Scholar] [CrossRef]
- Elmontsri, M. Review of the strengths and weaknesses of risk matrices. J. Risk Anal. Crisis Response 2014, 4, 49–57. [Google Scholar] [CrossRef]
- Arnbjerg-Nielsen, K. Past, present, and future design of urban drainage systems with focus on Danish experiences. Water Sci. Technol. 2011, 63, 527–535. [Google Scholar] [CrossRef] [PubMed]
- Rain Gain Project. Fine-Scale Rainfall Measurement and Prediction to Enhance Urban Pluvial Flood Management. 2013. Available online: http://www.raingain.eu/sites/default/files/fs2-gen-spaansepolder.pdf (accessed on 30 January 2016).
- GoogleMaps. Available online: https://www.google.nl/maps/place/Spaanse+Polder,+Rotterdam (accessed on 25 January 2016).
- PCSWMM, version 5.4; Computational Hydraulics International: Guelph, ON, Canada, 2013.
- Martins, R.; Leandro, J.; Chen, A.S.; Djordjević, S. A comparison of three dual drainage models: Shallow water vs local inertial vs diffusive wave. J. Hydroinform. 2017, 19, 331–348. [Google Scholar] [CrossRef]
- Costabile, P.; Costanzo, C.; Macchione, F. Performances and limitations of the diffusive approximation of the 2-d shallow water equations for flood simulation in urban and rural areas. Appl. Numer. Math. 2017, 116, 141–156. [Google Scholar] [CrossRef]
- Martínez-Gomariz, E.; Gómez, M.; Russo, B. Experimental study of the stability of pedestrians exposed to urban pluvial flooding. Nat. Hazards 2016, 82, 1259–1278. [Google Scholar] [CrossRef] [Green Version]
- Martínez-Gomariz, E.; Gómez, M.; Russo, B.; Djordjević, S. Stability criteria for flooded vehicles: A state-of-the-art review. J. Flood Risk Manag. 2016, 11, S817–S826. [Google Scholar] [CrossRef]
- Cox, R.J.; Shand, T.D.; Blacka, M.J. Revision Project 10: Appropriate Safety Criteria for Vehicles; Report Number: P10/S2/020; Australian Rainfall and Runoff (AR&R): Sydney, Australia, 2011.
- Bennett, N.D.; Croke, B.F.; Guariso, G.; Guillaume, J.H.; Hamilton, S.H.; Jakeman, A.J.; Pierce, S.A. Characterising performance of environmental models. Environ. Model. Softw. 2013, 40, 1–20. [Google Scholar] [CrossRef]
- Leandro, J.; Djordjević, S.; Chen, A.S.; Savić, D.A.; Stanić, M. Calibration of a 1D/1D urban flood model using 1D/2D model results in the absence of field data. Water Sci. Technol. 2011, 64, 1016–1024. [Google Scholar] [CrossRef] [PubMed]
- Leandro, J.; Chen, A.S.; Djordjević, S.; Savić, D.A. Comparison of 1D/1D and 1D/2D coupled (sewer/surface) hydraulic models for urban flood simulation. J. Hydraul. Eng. 2009, 135, 495–504. [Google Scholar] [CrossRef]
- Rubinato, M.; Martins, R.; Kesserwani, G.; Leandro, J.; Djordjević, S.; Shucksmith, J. Experimental calibration and validation of sewer/surface flow exchange equations in steady and unsteady flow conditions. J. Hydrol. 2017, 552, 421–432. [Google Scholar] [CrossRef]
- Chang, T.J.; Wang, C.H.; Chen, A.S. A novel approach to model dynamic flow interactions between storm sewer system and overland surface for different land covers in urban areas. J. Hydrol. 2015, 524, 662–679. [Google Scholar] [CrossRef] [Green Version]
- Thaler, T.; Fuchs, S.; Priest, S.; Doorn, N. Social justice in the context of adaptation to climate change—Reflecting on different policy approaches to distribute and allocate flood risk management. Reg. Environ. Chang. 2017, 18, 305–309. [Google Scholar] [CrossRef]
- Veerbeek, W.; Ashley, R.M.; Zevenbergen, C.; Rijke, J.; Gersonius, B. Building Adaptive Capacity For Flood Proofing In Urban Areas Through Synergistic Interventions. In Proceedings of the WSUD 2012: Water Sensitive Urban Design; Building the Water Sensiitve Community; 7th International Conference on Water Sensitive Urban Design; Engineers Australia: West Perth, Australia, 2012; p. 127. [Google Scholar]
- Keath, N.A.; Brown, R.R. Extreme events: Being prepared for the pitfalls with progressing sustainable urban water management. Water Sci. Technol. 2009, 59, 1271–1280. [Google Scholar] [CrossRef] [PubMed]
Figure 1.
Risk-based approach from three perspectives: “flooding probability, exposure determinants and vulnerability of receptors” Source: Klijn et al., 2015 [36].
Figure 1.
Risk-based approach from three perspectives: “flooding probability, exposure determinants and vulnerability of receptors” Source: Klijn et al., 2015 [36].

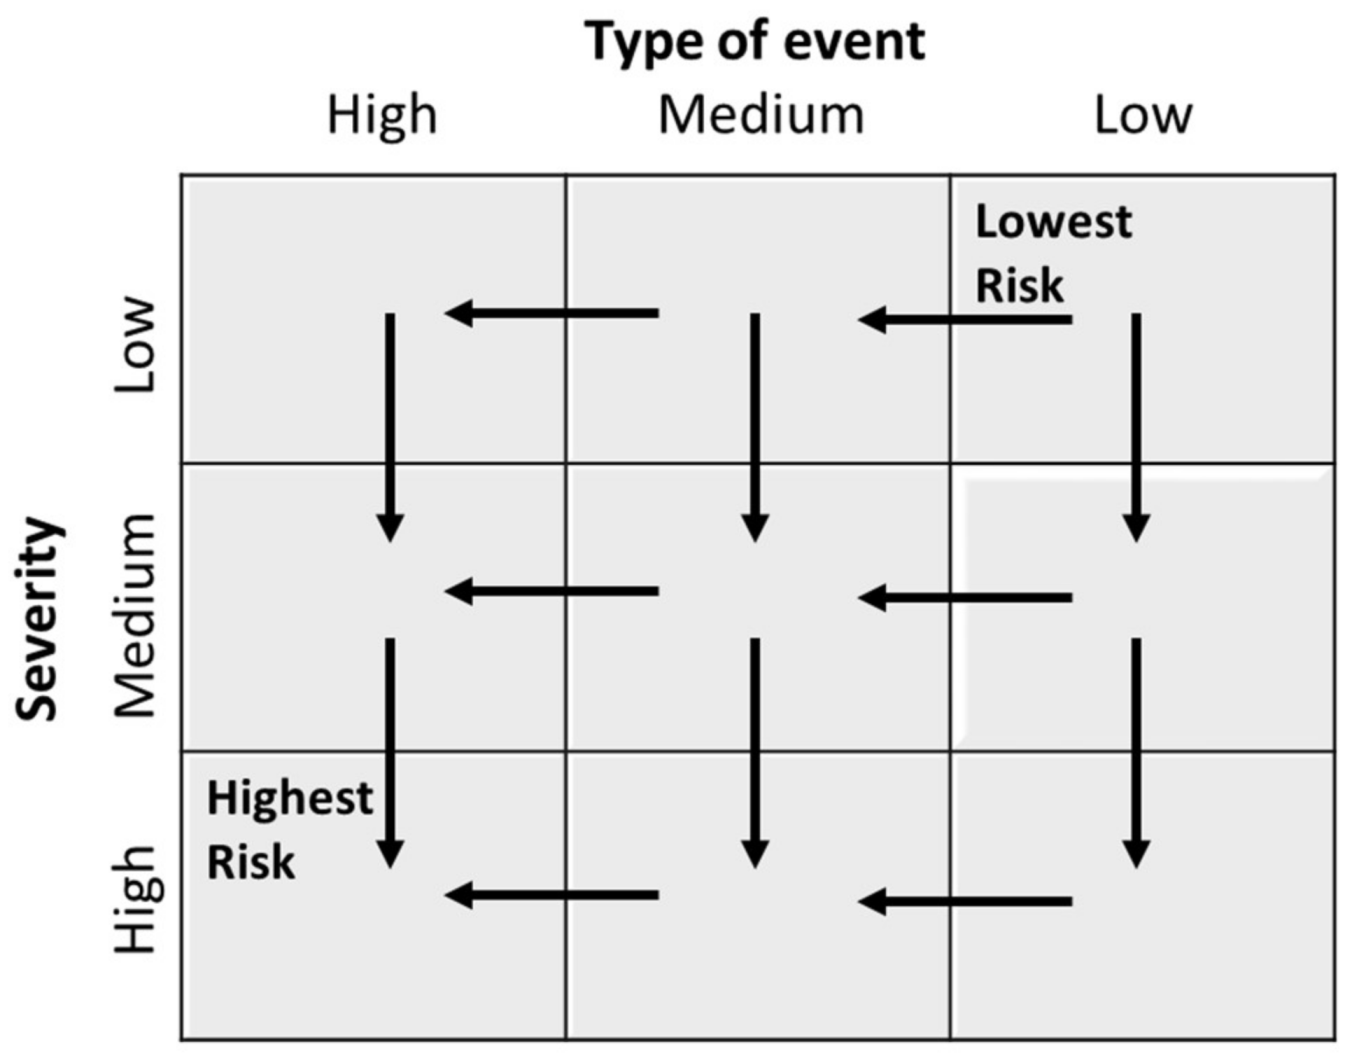
Figure 2.
Risk matrix, general example. The axes are related with the consequence severity (y), and probability/type of event (x). The arrows represent the directions from lower risk regions to higher risk regions. Adapted from Elmontsri [48].
Figure 2.
Risk matrix, general example. The axes are related with the consequence severity (y), and probability/type of event (x). The arrows represent the directions from lower risk regions to higher risk regions. Adapted from Elmontsri [48].

Figure 3.
Location of Spaanse Polder. Source: Google Maps, 2016 [51].
Figure 3.
Location of Spaanse Polder. Source: Google Maps, 2016 [51].

Figure 4.
Flood map for Spaanse Polder for (a) the 20 mm event and (b) the 80 mm event.

Figure 5.
Risk matrix, developed for the case study of Spaanse Polder.

Figure 6.
Risk map of Spaanse Polder. A, B, and C are medium to high risk locations.

Figure 7.
Effect of actions taken in most affected areas in Spaanse Polder. A, B and C are the locations were the risk has been reduced low risk after interventions.
Figure 7.
Effect of actions taken in most affected areas in Spaanse Polder. A, B and C are the locations were the risk has been reduced low risk after interventions.


Table 1.
Comparison between standard and risk-based approaches.
| Characteristic | Standard-Based Approach | Risk-Based Approach |
|---|---|---|
| Type of analysis | Deterministic: single design value | Probabilistic: values with different probability |
| Objective | Functioning/performance of (minor) drainage system | Optimization of benefits/costs |
| Economic guidance | No insight into efficiency (i.e., into benefits/costs) | Looks for the economic optimum (i.e., optimum of benefits/costs) |
| Stakeholder involvement | Limited need for stakeholder involvement | Needs experienced stakeholders |
| Use in practice for urban drainage | Standard practice for small scale (precinct) drainage systems | Not common for small scale (precinct) drainage systems |
Table 2.
Description of the consequences per object/function.
| Severity Class | Buildings | Roads/Access | Power Supply |
|---|---|---|---|
| Nuisance | Low lying areas (e.g., parking lots or back-yards) are affected: up to 5 cm of water | Low lying areas (e.g., green spaces) next to roads are affected: up to 5 cm of water | Not applicable |
| Minor damage | Buildings are affected below the floor level | Minor roads are affected: more than 5 cm of water | Transmission stations are affected: up to 10 cm (no outage) |
| Moderate damage | Buildings are affected at the floor level: up to 10 cm of water | Main roads are affected: more than 5 cm of water | Transmission stations are affected above 10 cm (outage) |
| Major damage | Buildings are affected above 10 cm | Major roads are affected: more than 5 cm of water | Substations are affected above 25 cm (outage) |
© 2018 by the authors. Licensee MDPI, Basel, Switzerland. This article is an open access article distributed under the terms and conditions of the Creative Commons Attribution (CC BY) license (http://creativecommons.org/licenses/by/4.0/).
Share and Cite
MDPI and ACS Style
Salinas-Rodriguez, C.; Gersonius, B.; Zevenbergen, C.; Serrano, D.; Ashley, R. A Semi Risk-Based Approach for Managing Urban Drainage Systems under Extreme Rainfall. Water 2018, 10, 384. https://doi.org/10.3390/w10040384
AMA Style
Salinas-Rodriguez C, Gersonius B, Zevenbergen C, Serrano D, Ashley R. A Semi Risk-Based Approach for Managing Urban Drainage Systems under Extreme Rainfall. Water. 2018; 10(4):384. https://doi.org/10.3390/w10040384
Chicago/Turabian StyleSalinas-Rodriguez, Carlos, Berry Gersonius, Chris Zevenbergen, David Serrano, and Richard Ashley. 2018. "A Semi Risk-Based Approach for Managing Urban Drainage Systems under Extreme Rainfall" Water 10, no. 4: 384. https://doi.org/10.3390/w10040384
Note that from the first issue of 2016, this journal uses article numbers instead of page numbers. See further details here.