Article

Effects of Reclaimed Water Irrigation on Microbial Diversity and Composition of Soil with Reducing Nitrogen Fertilization

1
Farmland Irrigation Research Institute, Chinese Academy of Agricultural Sciences, Xinxiang 453003, China
2
Key Laboratory of High-efficient and Safe Utilization of Agriculture Water Resources of CAAS, Xinxiang 453003, China
3
Graduate University of Chinese Academy of Agricultural Sciences, Beijing 100081, China
4
Department of Agroecology, Faculty of Science and Technology, Aarhus University, Blichers Allé 20, DK-8830 Tjele, Denmark
*
Author to whom correspondence should be addressed.
Water 2018, 10(4), 365; https://doi.org/10.3390/w10040365
Submission received: 11 February 2018 / Revised: 9 March 2018 / Accepted: 19 March 2018 / Published: 23 March 2018

Abstract

:
Reclaimed water (RW) is an alternative water resource that has been utilized all over the world, but its environmental effects are not fully understood. Soil biodiversity is an important indicator of soil tolerance and resilience. In the present study, the impact of RW irrigation on the microbial community diversity and chemical properties of topsoil was investigated by monitoring nitrogen (N) rates. Tomato plants were grown on plots which had been irrigated with reclaimed water for 5 years with varying levels of N fertilization (N270, 270 kg ha−1; N216, 216 kg ha−1; N189, 189 kg ha−1; and N135, 135 kg ha−1). Soil bacterial community composition was analyzed by PCR amplification of the 16S rDNA gene and Illumina MiSeq high-throughput sequencing technology of a total of 770,066 quality sequences. The results showed that long-term RW irrigation altered the bacterial composition of soil in an N-dependent manner. RW irrigation increased the abundances of Gemmatimonadetes, Actinobacteria, Firmicutes, and Nitrospirae in soils. The Chao, ACE, and H indices revealed no significant difference under RW irrigation with varying levels of N fertilization. The tomato yield and partial factor productivity from applied N for RN216 increased significantly under RW irrigation with reducing N fertilization. RW irrigation increased the yield of tomato and the abundance of functional microorganisms, which eventually improved the practice of irrigating with reclaimed municipal wastewater. Meanwhile, the potential environmental and health risks of long-term RW irrigation warrant further investigation.

1. Introduction

The diversity and composition of soil microbial communities directly affects soil ecosystems and nutrient cycling [1]. Appropriate community structure, with diversity and high variability of microorganisms, is an important factor for sustaining ecosystems and ensuring soil productivity [2,3]. Reclaimed water (RW) contains considerable amounts of inorganic substances, such as heavy metals and salts that may have negative effects on agro-ecosystems [4]; however, it is also enriched in organic matter, nitrogen (N), phosphorus and other nutrients [5]. The well-planned utilization of RW can reduce the need for fertilizer application and improve soil fertility [6,7,8]. Microbial diversity may be significantly altered by RW irrigation, which in turn can affect soil fertility and ecosystem balance [9,10]. The effects of elevated N input on biota and biogeochemical cycles have been the focus of many studies [11]. Increasing the N input to soils can have various adverse effects on soil quality in agriculture [12], including a decrease in microbial functional diversity [13]. Long-term fertilizer experiments have shown that soil microbial biomass and community composition respond differently to N fertilization [14], although Daquiado et al. [1] indicated that long-term fertilization had no significant effect on soil microbial community structure in paddy soil.
Characterizing the shifts in soil microbial community structure and diversity under different agricultural measures can lead to development of better management practices for agro-ecosystems [15]. The analysis of bacterial communities in soil can provide insight into the characteristics of soil under RW irrigation. The recent development of high-throughput sequencing (HTS) technology has enabled the evaluation of the soil microbial communities to take a leap forward (i.e., 16S rRNA gene amplification coupled with HTS read length allowing maximal detection of microorganisms). HTS has been used to investigate microbial ecology under fertilization and RW irrigation, including the effects of secondary soil salinization and acidification due to high N application rates on bacterial community composition [16]. Bacterial community structure and biochemical cycling capacity of contaminants in wetlands were shown to be altered under RW irrigation [17]. Research has further shown negative effects on microbial activity as a result of N amendment [18].
At present, a critical gap in our knowledge is how the overall bacterial community structure responds to anthropogenic N topdressing under RW irrigation. The effects of RW irrigation on the diversity and composition of soil bacterial community is not known with reducing N fertilization. Moreover, the effects of RW irrigation with reducing N fertilization on the phylogenetic and taxonomic responses of microbial communities based on HTS technology have not been focused upon. The main objectives of this study were (1) to investigate the factors influencing bacterial community composition and diversity under RW irrigation with reducing N fertilization; (2) to evaluate how the bacterial community variation is influenced by environmental factors; and (3) to select the reasonable N fertilization pattern under RW irrigation with reducing N fertilization.

2. Materials and Methods

2.1. Experimental Design

The experiment was carried out in greenhouses at the Agriculture Water and Soil Environment Field Science Research Station, China (35°19′ N, 113°53′ E, elevation 73.2 m), in the continental monsoon climate area of the temperate zone. The site has an annual mean air temperature of 14.1 °C, with a precipitation of 588.8 mm, an annual sunshine duration of 2398.8 h, and 210 d frost-free period. The soil chemical properties of total nitrogen (TN), total phosphorus (TP) and organic matter (OM) were 0.85, 1.16 and 19.90 g kg−1, respectively. The soil pH was 8.00, density was 1.40 g cm−3, and soil texture was silty clay loam. GBS-fushi 1 tomato (Solanum lycopersicum) was used as the plant material. Tomato plots were subjected to continuous RW irrigation and N fertilization for 5 years, and arranged in a randomized complete block design with two factors. The first factor was nitrogen fertilizer treatment with four levels: N 270 (local fertilization rate: 270 kg ha−1), N216 (20% reduction in N fertilizer application: 216 kg ha−1), N189 (30% reduction in N fertilizer application: 189 kg ha−1), and N135 (50% reduction in N fertilizer application: 135 kg ha−1). Urea (46% N) was applied as the N fertilizer in the experiment. The second factor was the type of irrigation water, with two levels, either clean water (C) or reclaimed water (R). Thus, there were 8 treatments (CN270, CN216, CN189, CN135, RN270, RN216, RN189, and RN135), each with a total of three replications consisting of 15 m2 plots, in total 24 plots. The reclaimed test water was taken from the Camel Bay sewage treatment plant after secondary treatment, a source of municipal sewage. The basic properties of RW we have applied were in full compliance with the requirements of the standards for irrigation water quality of China (GB 5084-2005). The quality of RW we have applied was similar to other municipal RW used in China. The water quality results are shown in Table 1. GBS-fushi 1 tomatoes were planted in the plots at a density of 4.5 × 10⁴ plants ha−1 in early March, with a planting distance of 0.3 m, and a row spacing of 0.75 m. The irrigation method was surface drip irrigation, each treatment was irrigated 6 times and the volume of water irrigated was equivalent to 3736 m3 ha−1 during the whole growing period, the same in all treatments.

2.2. Water and Soil Analyses

Water quality indices included nitrate nitrogen (NO3-N), ammonium nitrogen (NH4+-N), total nitrogen (TN), and total phosphorus (TP), which were determined with a flow analyzer (Bran Luebbe AA3, Bran Luebbe Gmbh, Norderstedt, Germany); permanganate index (chemical oxygen demand, CODMn), which was determined with a COD analyzer; pH, which was measured with a pH acidity meter (PHS-1, Shanghai, China); and electrical conductivity (EC), which was measured using a conductivity meter.
Soil samples were collected during the tomato harvest period on 24 June 2015. Each sample consisted of 9 cores (diameter 2.7 cm) from the top 20 cm of soil that were immediately mixed to one composite sample representing one plot. After removing residual roots from soil samples, the samples were placed in a sterilized fluoroethylene plastic bag, which was sealed and placed in a refrigerator at 4 °C, and then taken to the laboratory. A fraction of each sample for microbial community analysis was stored at −20 °C until DNA extraction (<14 d), and other fraction was used to determine soil physical and chemical indices after air-drying. Samples were air-dried at room temperature, and ground with a porcelain mortar and pestle to pass through a 2-mm sieve. Soil pH was measured with a pH acidity meter (PHS-1, Shanghai, China) in deionized water at a soil-to-solution mass ratio of 1:2.5. Soil organic matter (SOM) content was determined according to Bao [19] by the oxidation volumetric method for the determination of potassium dichromate. Soil TN and TP were determined with a flow analyzer. EC of soil was measured using a conductivity meter (DDB-303A, Shanghai, China) in extracts of soil pastes (1:5 soil-to-water ratios).

2.3. DNA Extraction and PCR Amplification

Total soil DNA was extracted with the Power Soil DNA Isolation kit (MO BIO, Carlsbad, CA, USA), according to the instruction manual. Amplifications were conducted in triplicate using the primers F338 (TACGGRAGGCAGCAG) and R806 (AGGGTATCTAATCCT) that target the V3-V4 region of the 16S rRNA gene that yields accurate phylogenetic information [20] and should have few biases against any bacterial taxa [21]. The reaction system was as follows: 12.5 μL 2 × KAPA HiFi HotStart ReadyMix (Takara Bio Inc., Kusatsu, Japan), 0.5 μL Index i7 Primer (10 μM), 0.5 μL Index i5 Primer (10 μM), and 10.0 ng DNA template. The following standard thermal profile was used for all PCRs: pre-denaturation at 95 °C for 3 min; denaturation at 95 °C for 30 s, annealing at 55 °C for 30 s, and prolongation at 72 °C for 30 s, 27 cycles; final prolongation at 72 °C for 10 min; and cooling at 10 °C.
We used a 10 ng sequencing library, and two-way sequencing was conducted by MiSeq Reagent Kit v3 of Illumina MiSeq; 2 × 300 bp data were obtained. Sequences were analyzed using the Mothur [22] and QIIME [23] software packages. Sequences shorter than 200 bp, or those which contained ambiguities and homo-polymer stretches of more than 8 bases, were removed. After quality filtering, 770,066 reads were obtained from all samples, with a mean of 32,086 reads per sample. The representative sequences of the operational taxonomic units (OTUs) were acquired by the OTU analysis method of the Mothur default with a similarity level of 97% [24].
UniFrac is a phylogenetic metric that calculates the phylogenetic distance between pairs of communities based on branch length overlap, which is well-suited for quantifying shifts in highly diverse microbial communities [25]. Shannon (H) index was calculated to identify the changes of bacterial diversity; the ACE and Chao indices were calculated to identify the changes of bacterial richness. Phylotypes were selected at the 97% sequence similarity level and taxonomic identity was determined using the ribosome database project (RDP) scheme [26].

2.4. The Plant Biomass and Yield of Tomato

The plant biomass and yield of tomato were measured during harvest stage. Harvested plants were washed with deionized water, oven-dried at 70 °C, and weighed for plant biomass. Forty tomato plants in the middle of each plot were selected for yield test. The yield (total weight) of tomatoes was assessed separately for each plot. Partial factor productivity from applied N (PFPN) was used to evaluate the soil N fertilization rates in the experiment. PFPN (kg kg−1) = Tomato yield/nitrogen rate.

2.5. Statistical Analysis

A taxonomic tree was generated using MEGAN5 v.5.7.1 [27]. Chao, Shannon, Simpson, and Coverage indices were calculated using the QIIME software 1.7.0 (https://qiime.org). One-way analyses of variance (ANOVA) and two-way ANOVA comparisons were performed using SPSS Statistics 17.0 (IBM Company, Armonk, NY, USA). The level of significance used for all statistical tests was p ≤ 0.05. Redundancy analyses (RDA) were conducted with CANOCO (Version 4.5, Microcomputer Power Company, Ithaca, NY, USA). Other statistical analyses were performed using R version 2.8.1 (https://www.r-project.org).

3. Results

3.1. Changes in Soil Chemical Properties under RW Irrigation

Physical and chemical indices of soils under RW irrigation with different rates of N fertilization are shown in Table 2. Irrigation with RW significantly decreased soil TN content (p < 0.05) at N270 and N189, and soil TP content (p < 0.05) at N270 and N135. Soil TP did not differ between CW and RW irrigated soil for other treatments (p > 0.05), meanwhile there was no significant difference in soil TN and TP contents between different N levels under CW or RW irrigation (p > 0.05). Irrigation with RW significantly decreased SOM (p < 0.05) at N270, while SOM contents of other treatments showed no difference between CW and RW irrigation at the same N level (p > 0.05). The contents of soil EC and NO3-N at higher N-level was significantly higher than that of low-N level under RW irrigation (p < 0.05). The NO3-N content had no significant difference between RW irrigation and CW irrigation at the same N level (except N270). As compared to CW irrigation, RW irrigation significantly decreased (p < 0.05) the soil pH at the same N level. Reducing N fertilization significantly increased (p < 0.05) the soil pH under RW or CW irrigation. Based on two-way ANOVA, the results showed that N fertilization and the interaction of irrigation water type and N fertilization had significant effects on soil NO3-N, EC and pH (p < 0.01).

3.2. Soil Bacterial Community Richness and Diversity under RW Irrigation

The Shannon-Wiener index reflects microbial diversity in samples. A curve can be generated based on this index at different sequencing depths for each sample to reflect the microbial diversity of each sample for different sequencing quantities. A flat curve indicates that the amount of sequencing data is sufficiently large to reflect the vast majority of microbial species in the sample [28]. The curve for soil samples with different nitrogen levels under RW irrigation flattened at a cutoff of 0.03, indicating that most microbial species in the samples were represented (Figure S1).
Based on operational taxonomic units (OTUs), changes in soil bacterial diversity under RW irrigation with different N levels were analyzed (Table 3). OTUs of soil bacteria from group CN135 were higher than those of CN270 (p < 0.05), but did not differ from those of other treatments (p > 0.05). Chao and ACE, H, and Simpson indices reflect species richness, diversity and dominance, respectively. The OTU richness estimated by the Chao and ACE indices was elevated compared with the OTUs observed [29]. Chao, ACE and H indices were higher for CN135 than for CN270 (p < 0.05), but did not differ among other treatments. Chao, ACE and H indices had no significant difference between RW and CW irrigation at the same N level. Reducing N fertilization revealed no significant effects on bacterial diversity and richness under RW or CW irrigation. The Simpson index of CN135 was significantly lower than that of CN189, but did not differ among other treatments. The Coverage index was >96%. The type of irrigation water, N fertilization, or their interaction had no significant effect on the ACE, Chao, H and Simpson indices, but the Coverage index was significantly affected by N fertilization.
OTU was highly significantly positively correlated (p < 0.01) with ACE, Chao, and H indices (Table 4), while ACE was positively correlated (p < 0.01) with the Chao and H indices. Chao was positively correlated (p < 0.01) with the H index. On the other hand, H was negatively correlated with the Simpson (p < 0.01) and Coverage (p < 0.05) indices. The pH was significant negatively correlated with EC (p < 0.01), while NO3-N was positive correlated with EC (p < 0.05). NO3-N was negative correlated with soil pH (p < 0.01). TP was positively correlated with EC (p < 0.05) and OM (p < 0.01). TN was positively correlated with SOM and TP (p < 0.01).

3.3. Taxonomic Evaluation of Bacteria under RW Irrigation by HTS

To obtain a higher-resolution view of community composition, the relative abundances of species in the 24 samples were graphically depicted in a heat map. Based on genus and abundance information at the phylum level, we calculated the relative abundance of each bacterial community in total samples, where those with low abundance (<1%) were combined as ‘Other’. Samples between RW and CW irrigation with different N fertilization rates showed variable community abundance, although some similarities were also observed (Figure 1). At the phylum level, the unweighted pair group method with arithmetic means (UPGMA) clusters of soil bacterial communities revealed an obvious difference between RW and CW irrigation, and no significant differences among different N fertilization treatments. Soils from the 24 samples were dominated (>5%) by Proteobacteria (49.4%), Bacteroidetes (16.7%), Gemmatimonadetes (12.1%), and Actinobacteria (11.4%).
At the genus level, there were 48 and 53 genera under CW or RW irrigation with different N fertilization rates, respectively, while 41 genera were common to both types of irrigation (Figure 2). In the RDP sequence data, the 36th, 37th, 40th, 43rd, 45th, 47th, 48th, 49th, 50th, 51st, 52nd and 53rd genera (i.e., Agromyces, Rhodospirillales_unclassified, NB1−I_unclassified, Plesiocystis, Flavobacterium, Arenimonas, Devosia, Marinobacter, 0319-7L14_unclassified, unclassified Alteromonadaceae_unclassified, TM7-1_unclassified, and Zhouia) were abundant in RW treatments (Figure 2a). On the other hand, the 37th, 40th, 41st, 42nd, 45th, 47th and 48th genera (i.e., Sphingomonas, Sphingomonadaceae_unclassified, Luteimonas, Ellin6067_unclassified, Sphingobacteriaceae_unclassified, Chromatiaceae_unclassified, and Chromobacterium) were abundant in CW treatments (Figure 2b). Sphingobacterium, Pseudomonas, Vibrio, Corynebacterium and others have been isolated from low nutrition environments. Sphingopyxis alaskensis is a representative oligotrophic bacterium that functions in the biodegradation of aromatic compounds [30]; Flavobacterium and Arenimonas are pathogenic bacteria.

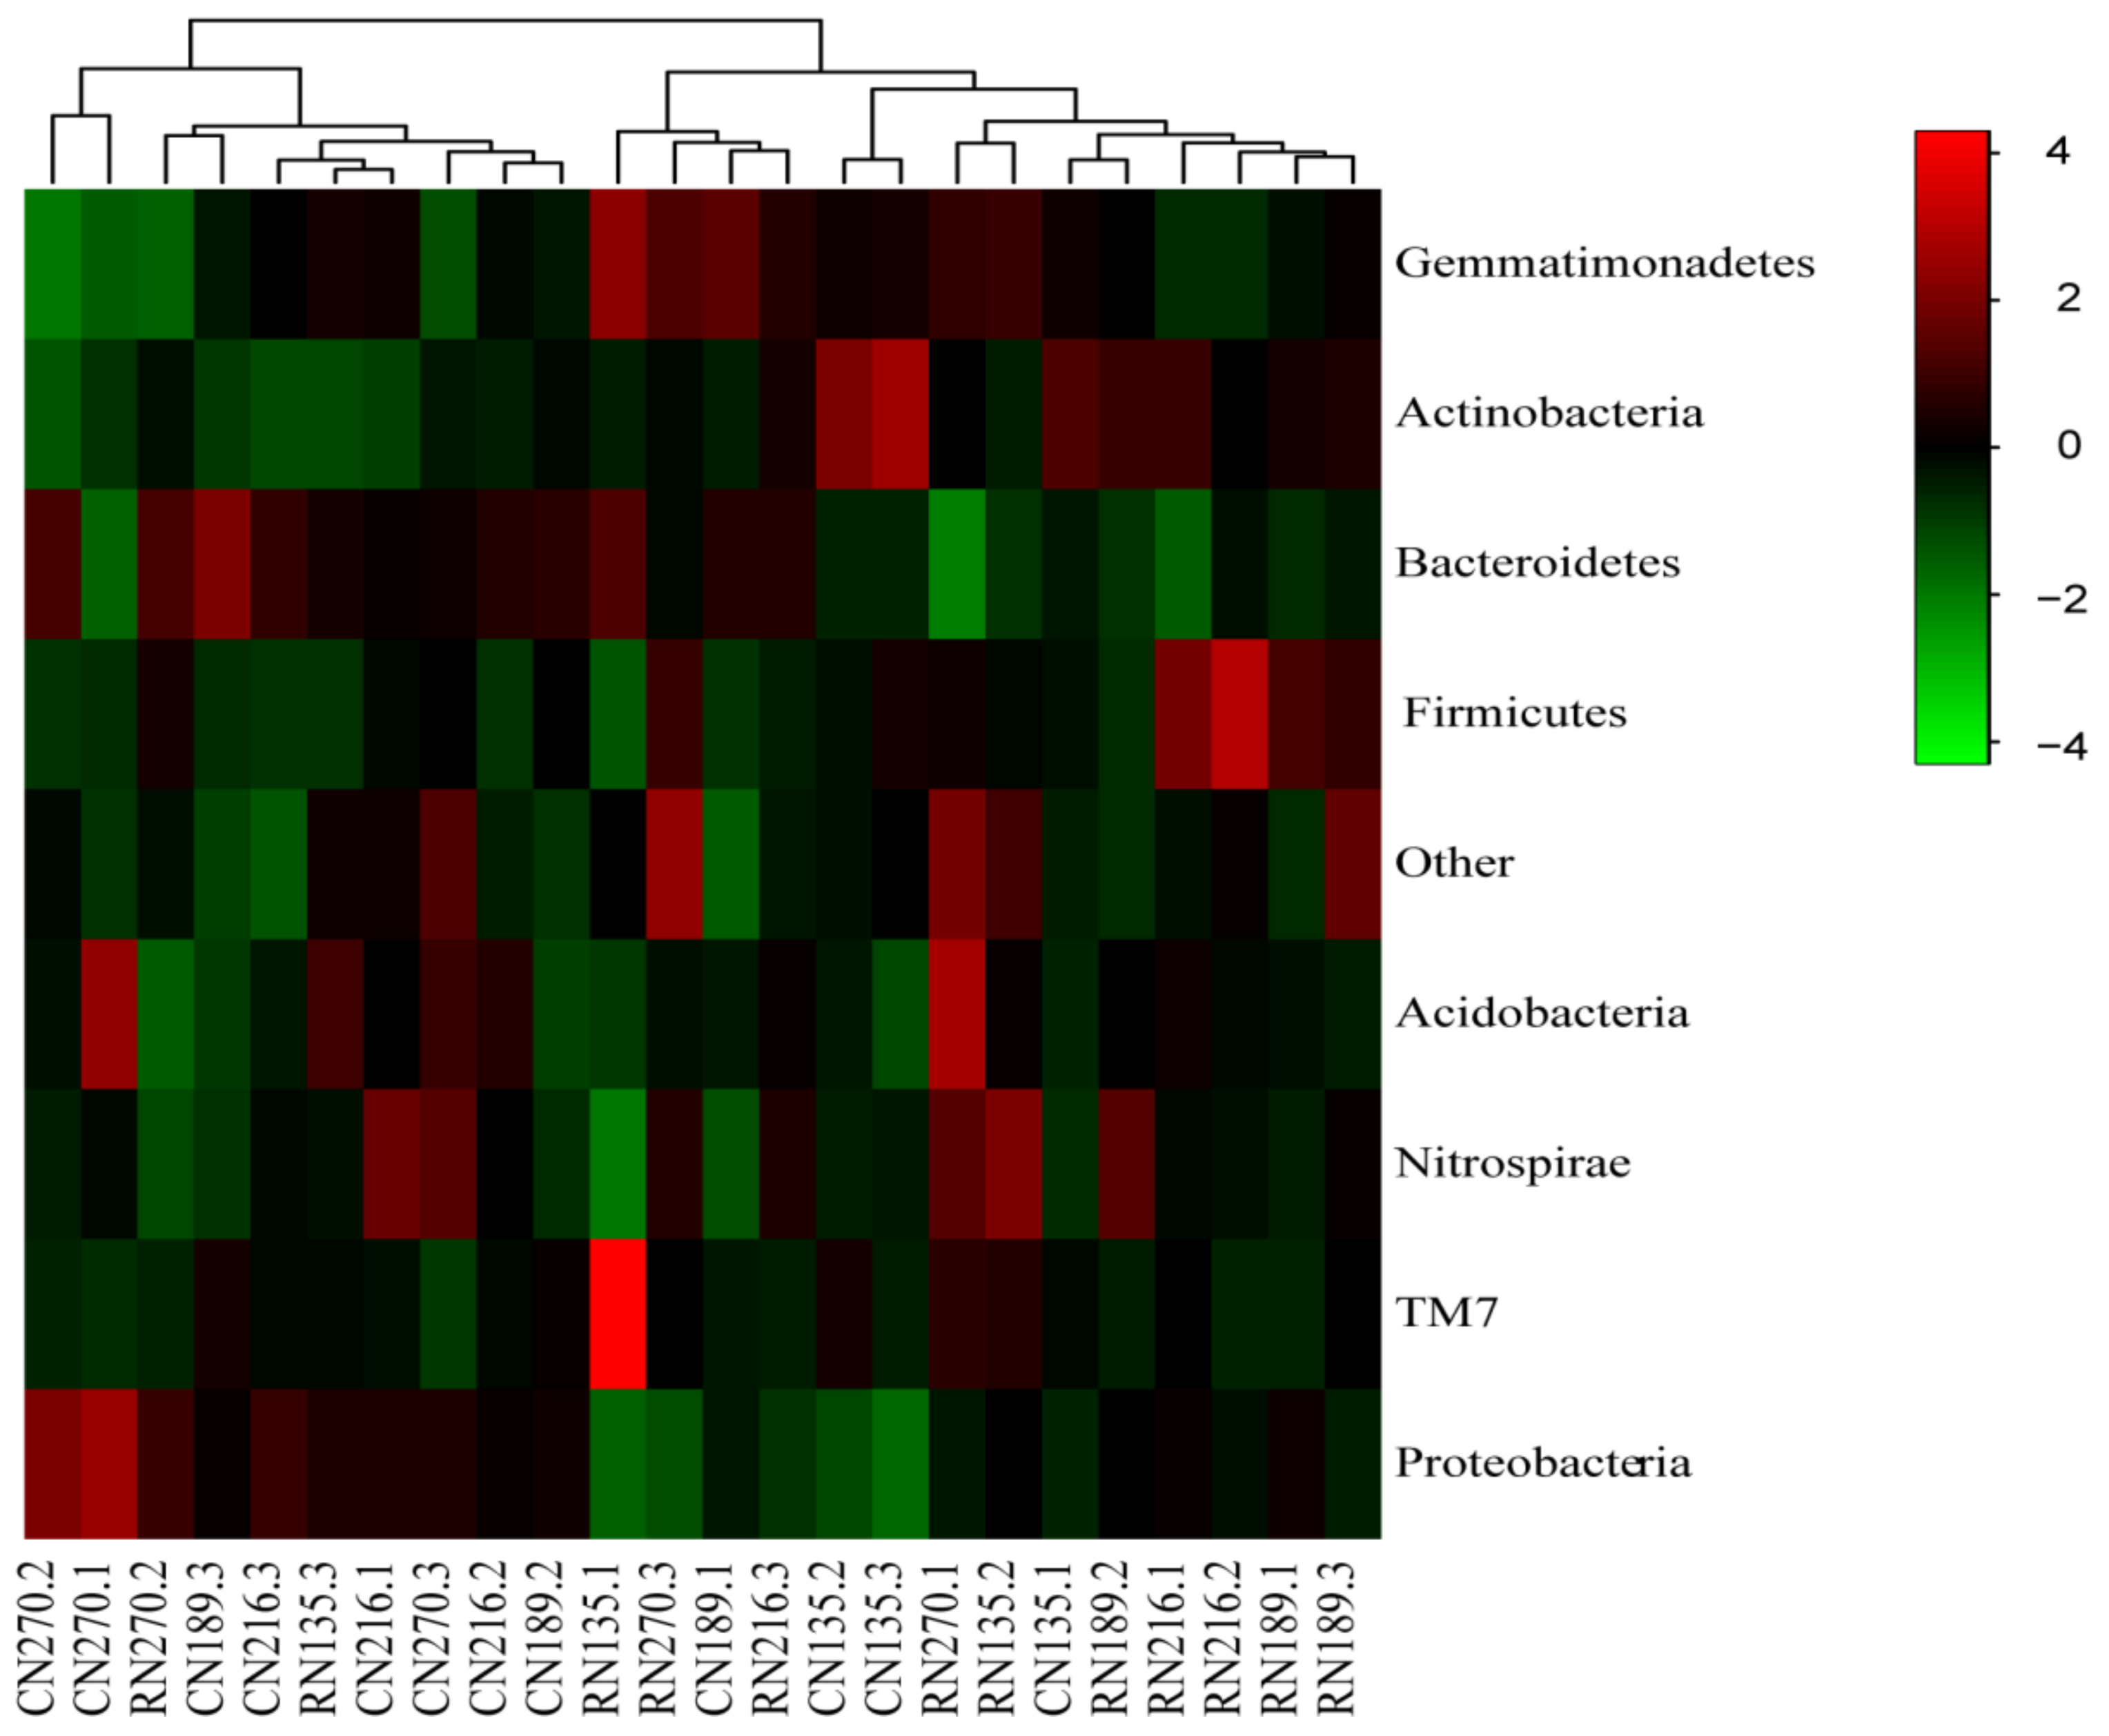
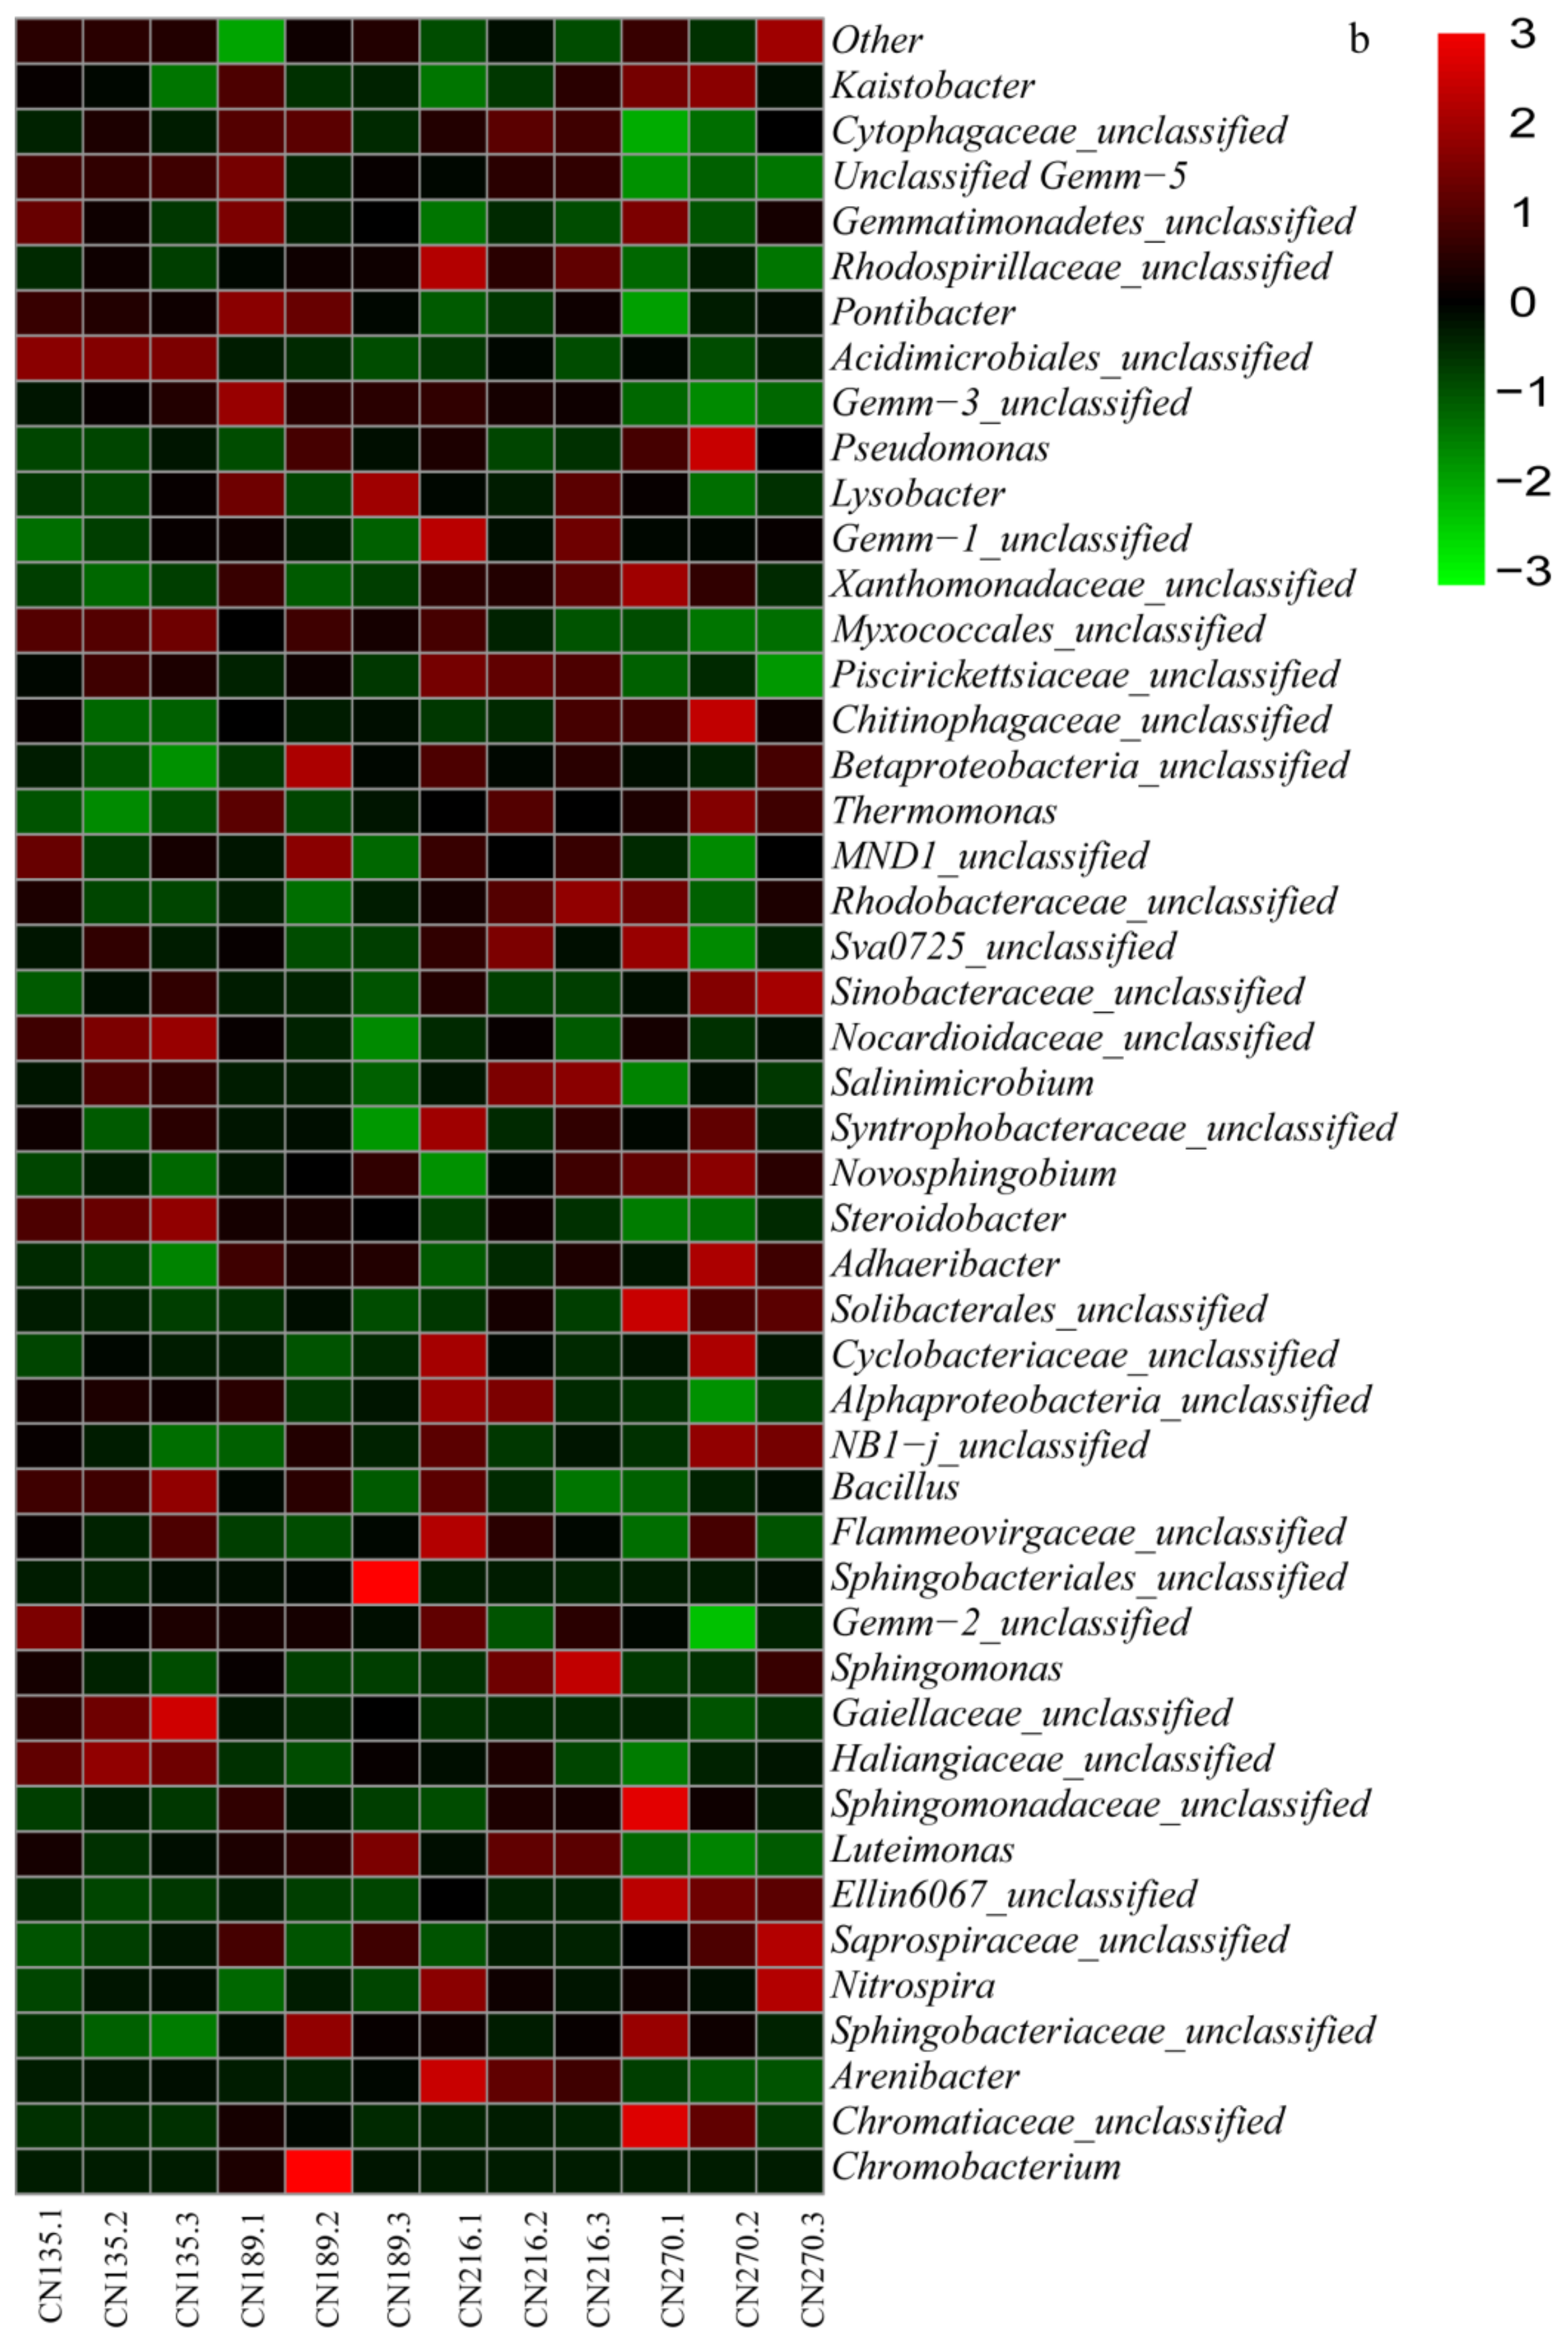
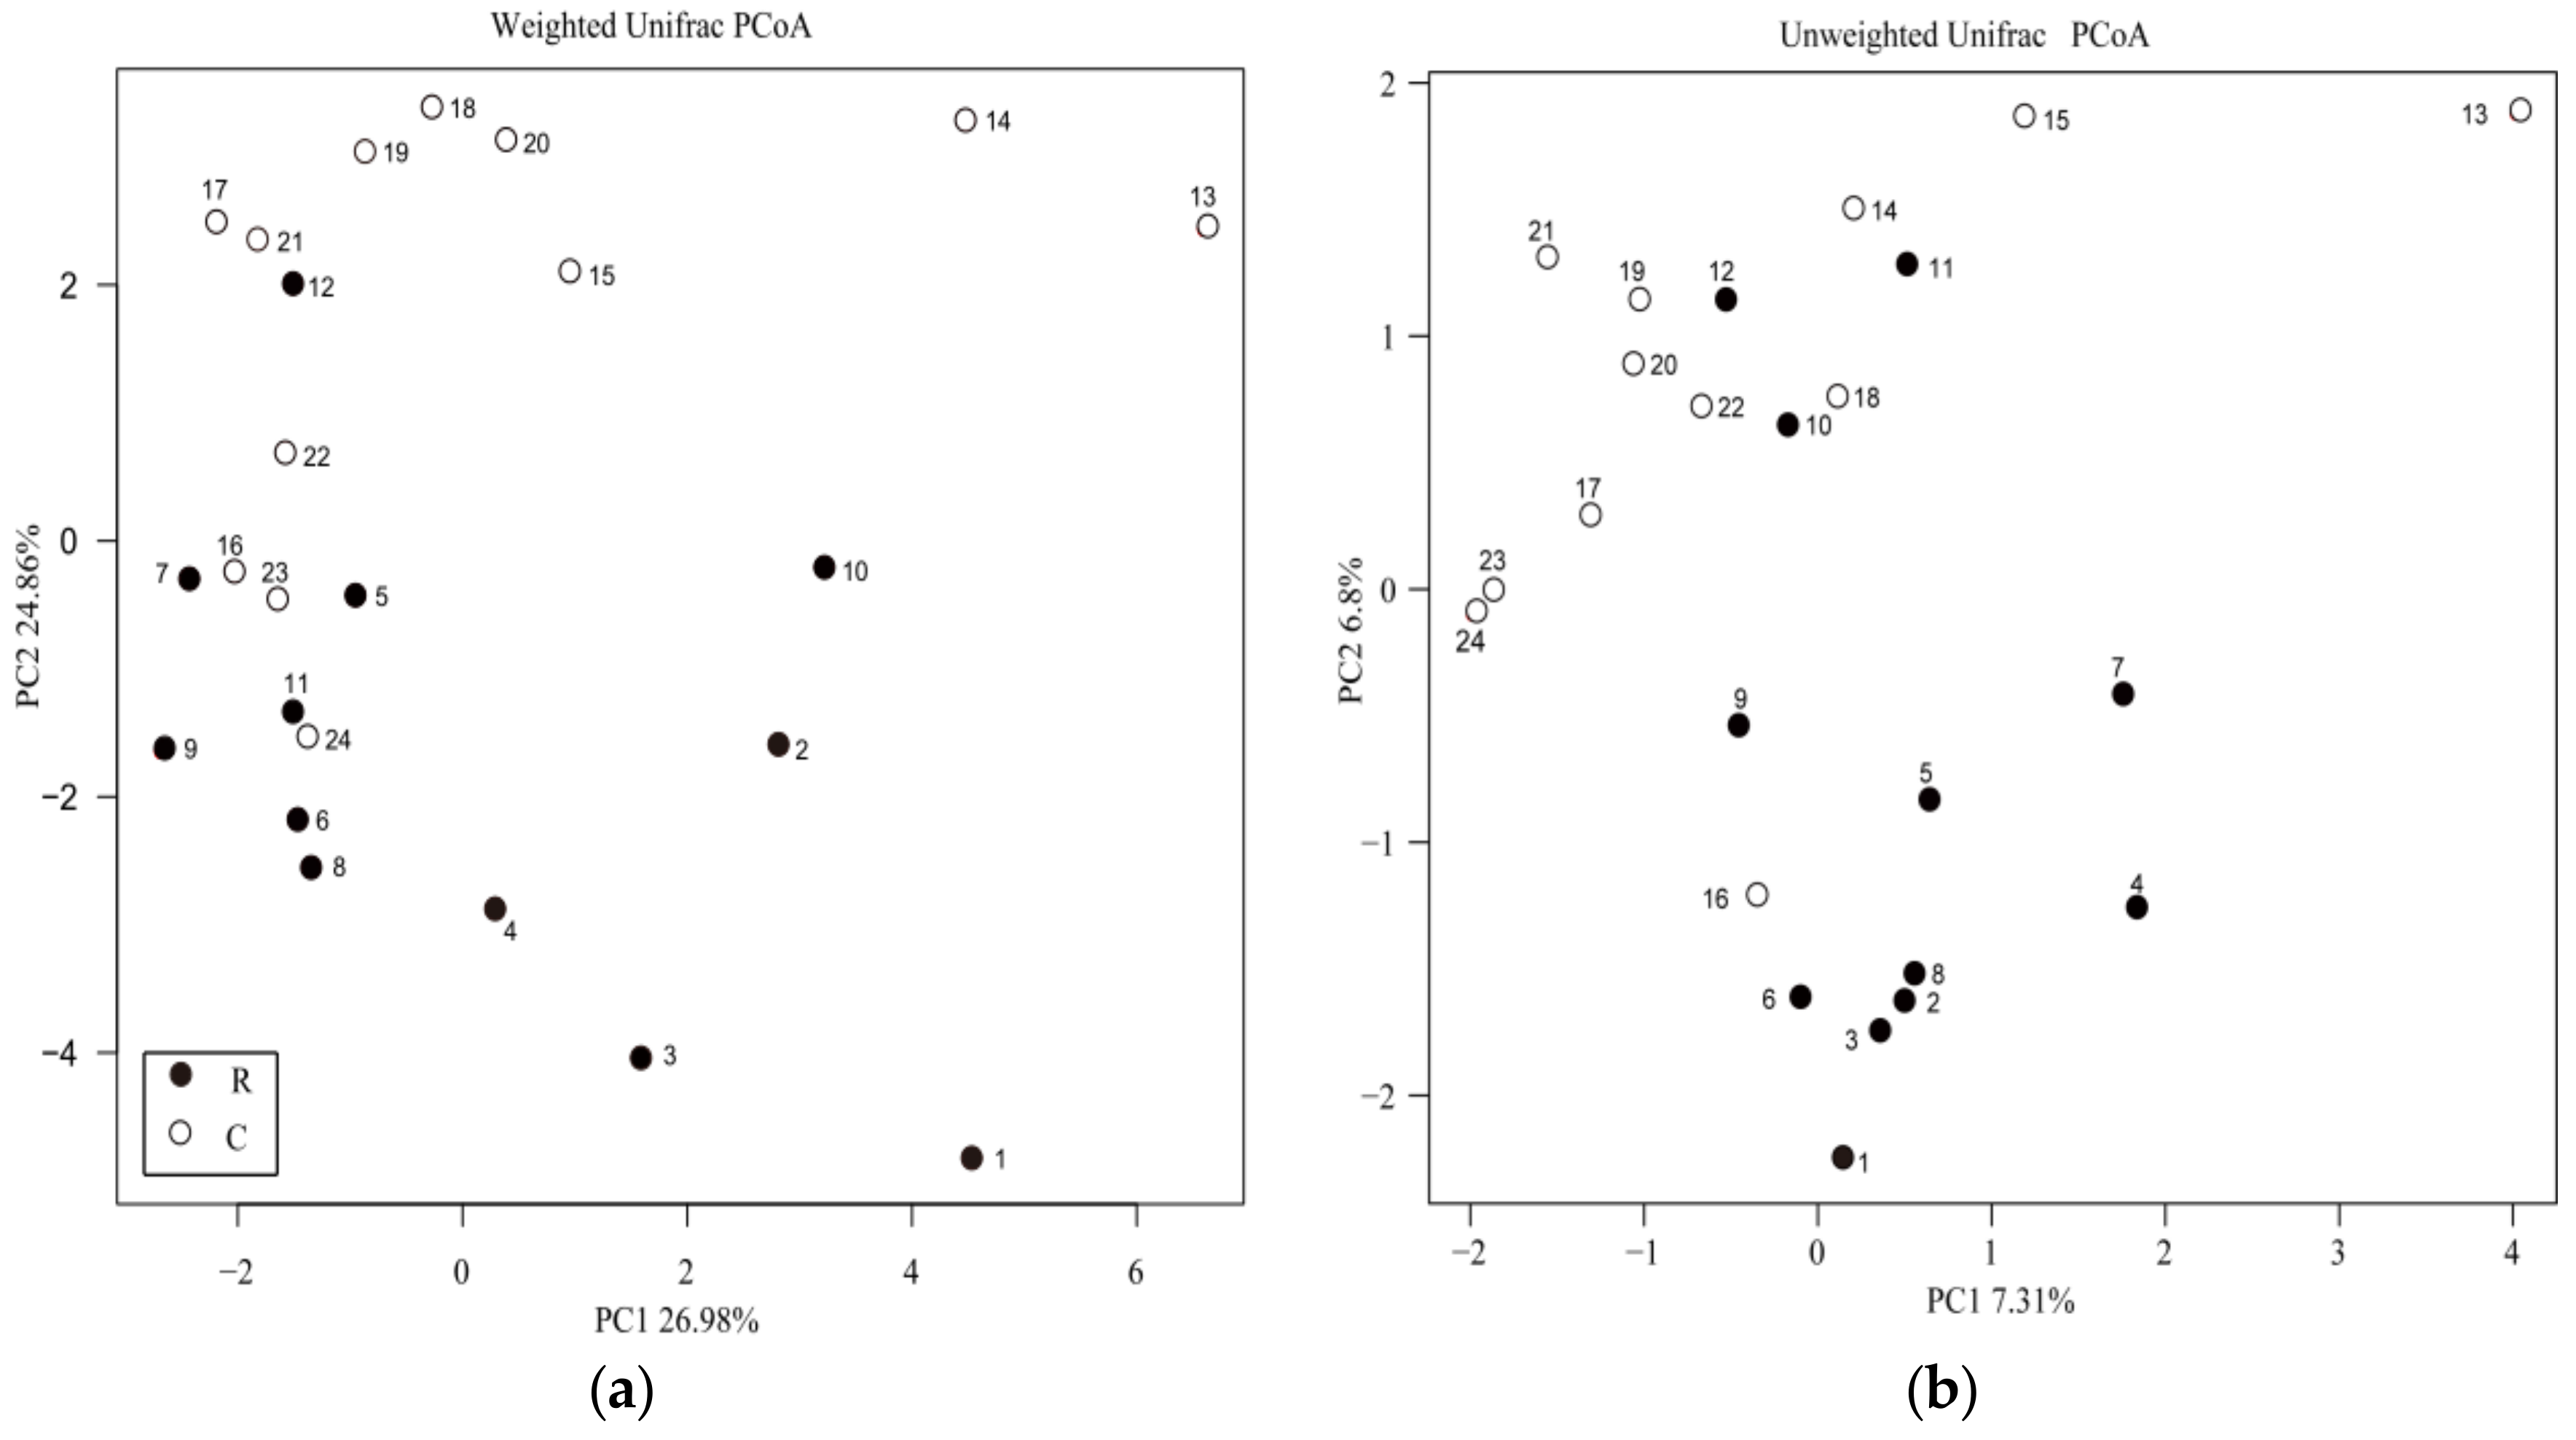
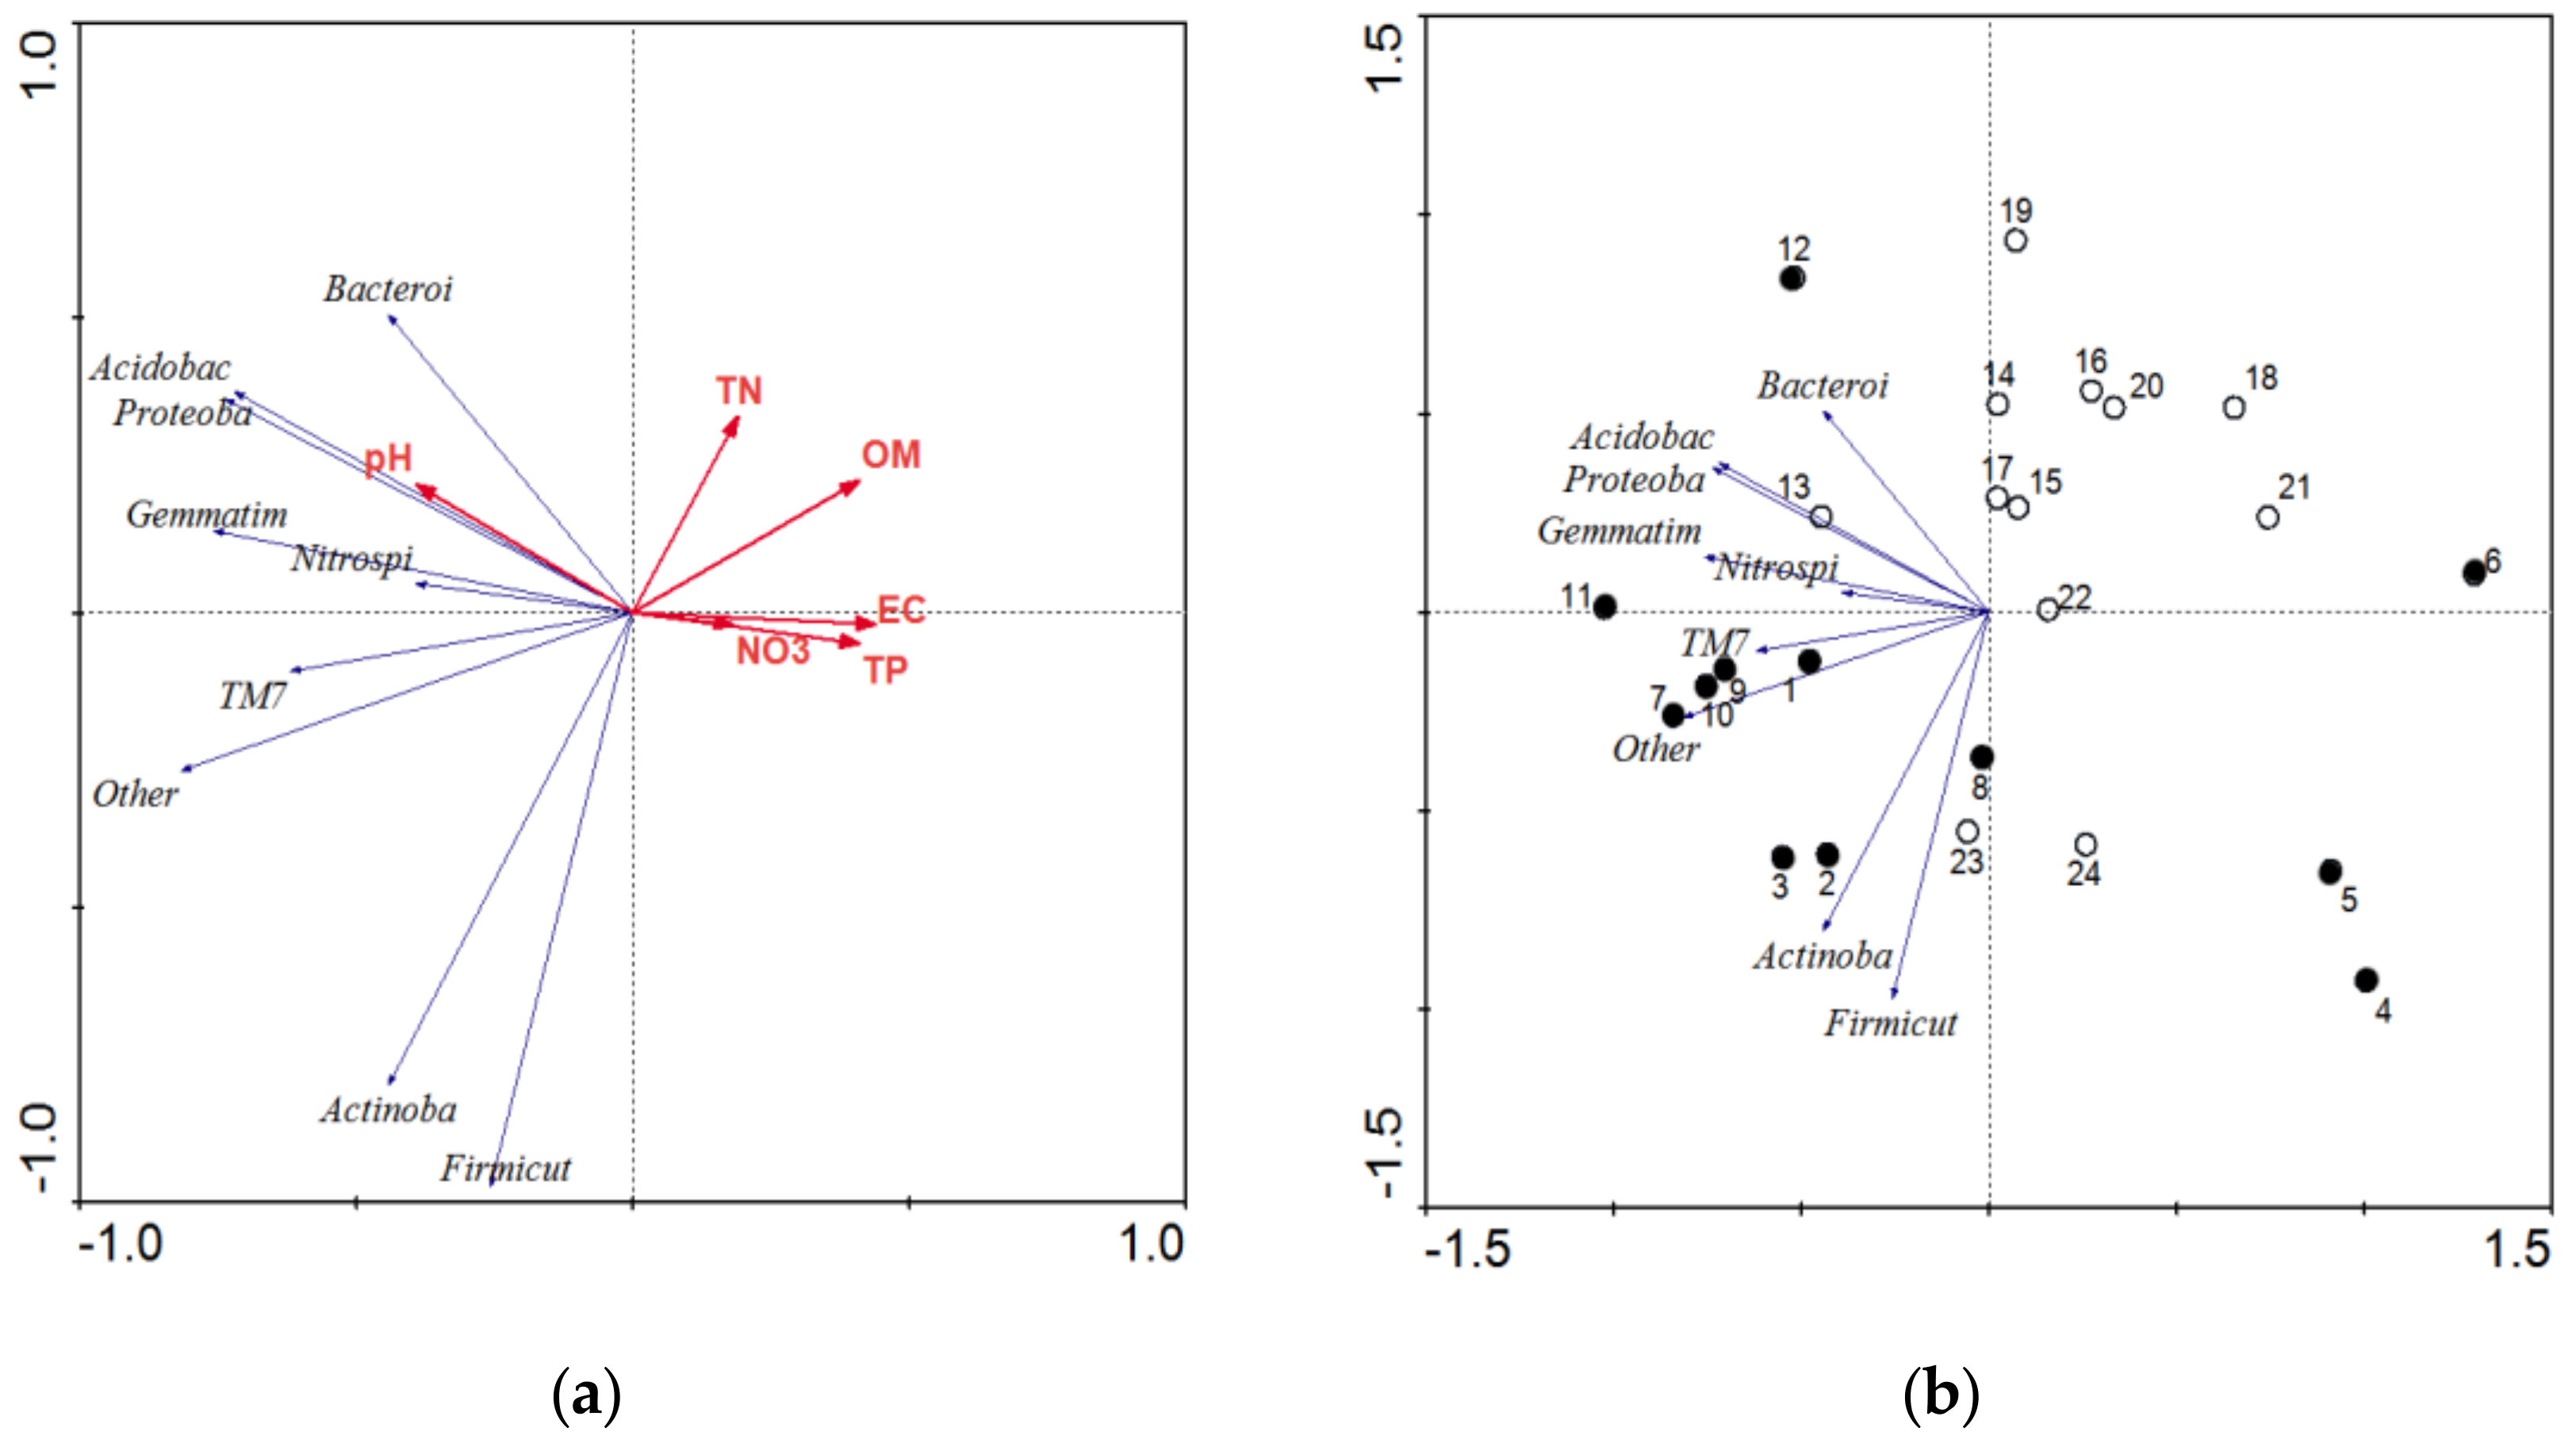
3.4. Phylogenetic Analysis of Soil Bacterial Community Composition and Structure under RW Irrigation

Results of the weighted and unweighted UniFrac principal coordinates analysis (PCoA) based on genetic distance revealed that samples irrigated with RW or CW clustered more closely than N fertilization, although a few samples irrigated with CW clustered with RW irrigated samples (Figure 3). On the first principal component axis (PC1), samples irrigated with RW and CW over a long period of time were mainly distributed in the positive and negative directions, respectively, based on the unweighted PCoA (Figure 1). On the second principal component axis (PC2), samples irrigated with RW and CW over a long period of time were mainly distributed in the negative and positive directions, respectively (Figure 3).
Soil microbial community distribution differed between the two types of water irrigation, suggesting that metabolic functions also vary depending on the conditions. The first axis significantly explained 35.5% of the variation (p < 0.01), which was correlated with EC, TP, NO3-N, pH and OM (Figure 4a). The second axis significantly explained 28.3% of the variation (p < 0.01), which was correlated with TN. It was indicated that the second axis to some extent may characterize the TN (Figure 4a). The community structure of Nitrospirae, Gemmatimonadetes, Firmicutes, Proteobacteria, and Actinobacteria were significantly influenced by reclaimed water irrigation, and the community structure of Bacteroidetes was significantly influenced by clean water irrigation; the Acidobacteria, Bacteroidetes, and Proteobacteria were significantly influenced by soil pH (Figure 4b).

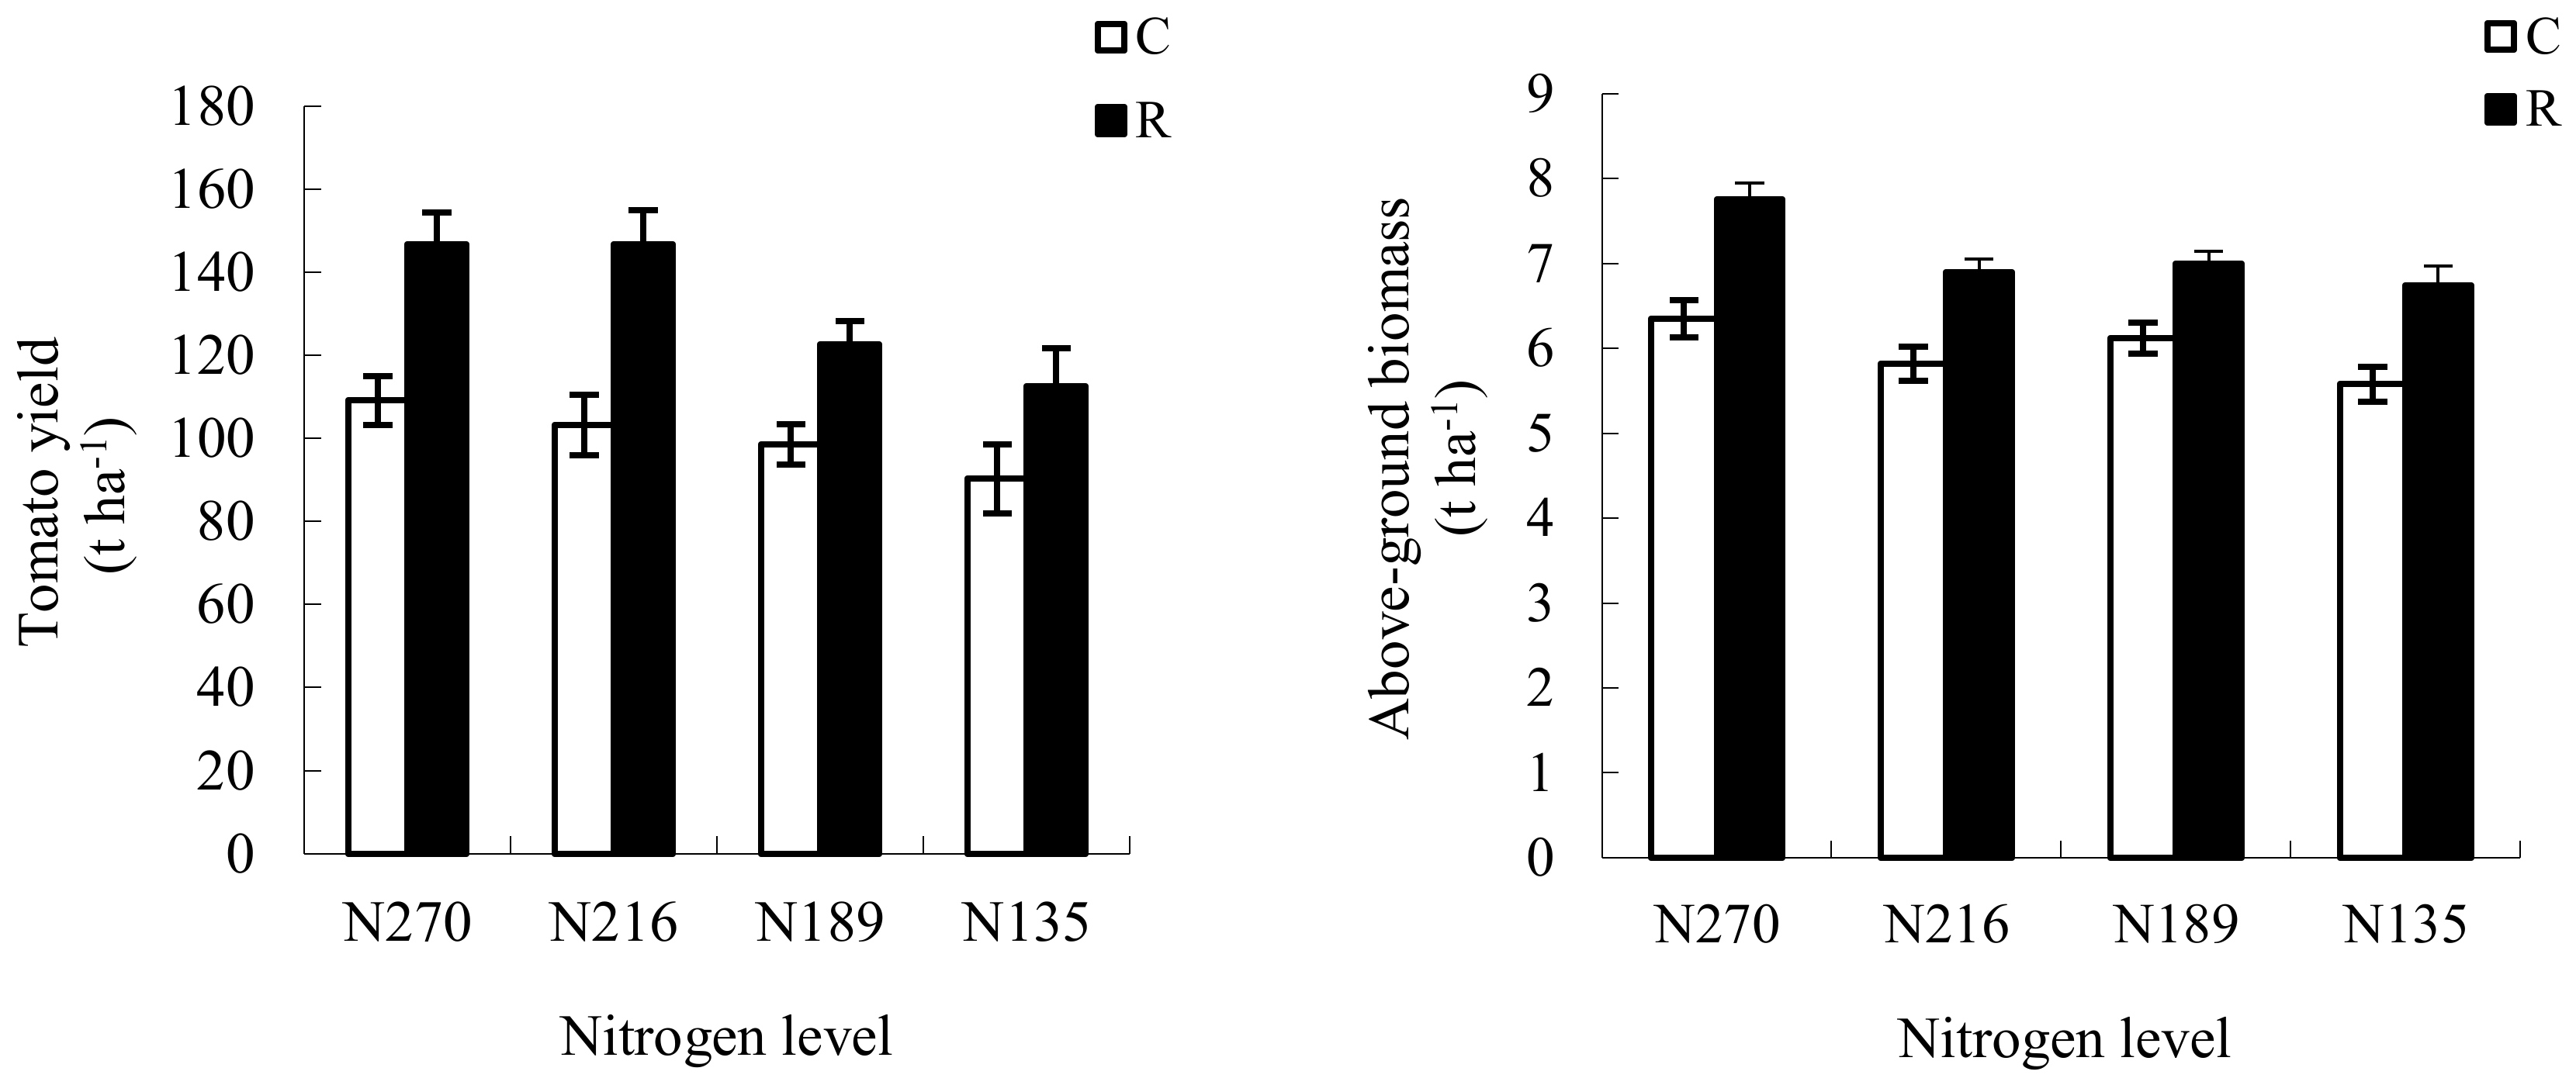
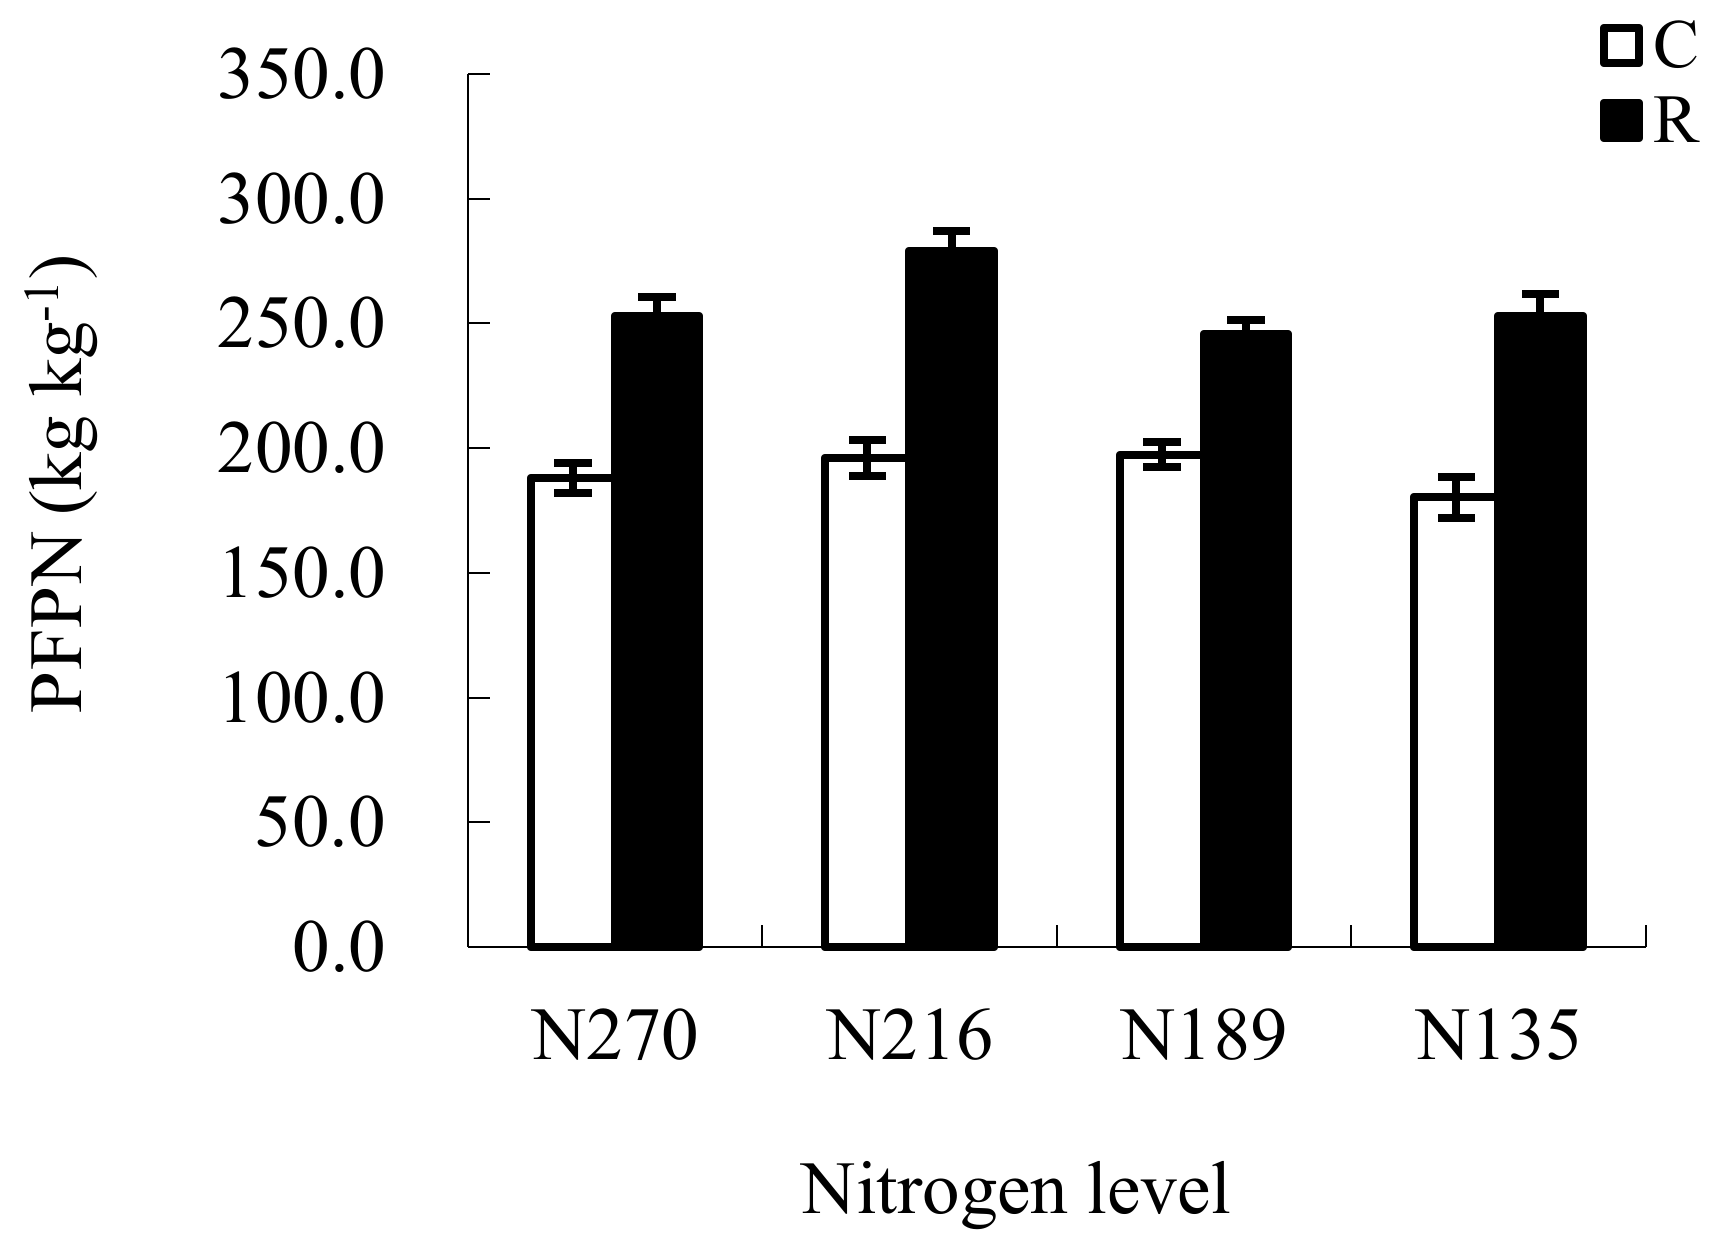
3.5. Changes in Tomato Yield and Partial Factor Productivities from the Applied N (PFPN) under RW Irrigation

Significant differences (p < 0.05) were found in tomato yield and biomass under reclaimed water irrigation with different N fertilization rates (Figure 5). Comparing with clean water irrigation, biomass and yield of tomato under RW irrigation with suitable N fertilization increased significantly. The tomato plant biomass of RN270 was significantly higher than that of RN216, RN189 and RN135, and the yield of RN270 and RN216 was significantly higher than that of RN189 and RN135. However, the tomato yield revealed no significant differences between RN270 and RN216. Compared with RN270, the PFPN of RN216 increased significantly under RW irrigation (Figure 6), with the yield of RN216 being highest. Compared with the conventional N fertilization, the yield and PFPN of RN216 were significantly improved under RW irrigation, suggesting that RN216 can be an optimal planting pattern for agricultural reclamation with reducing N fertilization under RW irrigation.

4. Discussion

4.1. Changes in Soil Chemical Properties under RW Irrigation

The TN contents of N270 and N189 were significantly higher under CW irrigation than under RW irrigation (p < 0.05). Whereas SOM did not differ between two types of irrigation with the same N fertilization rate (except N270). Total organic carbon content in soil is affected by water quality but not water quantity [10]. The NO3-N content had no significant difference between RW irrigation and CW irrigation at the same N level (except N270). Long-term RW irrigation effectively improved soil organic carbon and the N pool, which would reduce the amount of fertilizer required; however, the effects of short-term irrigation are not obvious [7,31]. RW irrigation significantly increased soil pH, which is in accordance with other authors [8,9], and can be attributed to the additional input of exchangeable cations, especially sodium contained in irrigation water [32]. The soil pH was affected not only by the N fertilization, but also by the interaction of N level and irrigation water type [8,16].

4.2. Effects of RW Irrigation on Soil Bacterial Diversity

Soil microbial diversity is mainly influenced by soil type [33], fertilization regimen [34], and irrigation method [10]. In turn, differences in taxonomic and functional diversity between microbial communities can feed back into changes in soil and ecosystem processes [35,36]. In the present study, reducing N fertilization revealed no significant effects on bacterial diversity and richness under CW or RW irrigation, which is in agreement with Fierer et al. [26]. Conversely, N accumulation caused a decline in biodiversity by stimulating the expansion of nitrophilous species and competitive exclusion of other species [37]. As previously reported [38], these results suggest that reasonable long-term fertilization can increase soil microbial community structure and diversity.
High N fertilization was found to result in secondary salinization and acidification of soil and caused environmental stress, thereby limiting bacterial growth [16]. Proteobacteria were the main pathogenic bacteria group under long-term RW irrigation, followed by conditional pathogenic bacteria such as Flavobacterium and Aeromonas. Therefore, long-term RW irrigation can lead to soil pollution, which may have repercussions for human health.
The increase in the abundance of Gemmatimonadetes, Actinobacteria, Firmicutes, and Nitrospirae in soils irrigated with RW suggests a higher resistance to this treatment mediated by copiotrophic organisms. Changes in soil microbial community structure may alter soil physicochemical characteristics [39]. Gemmatimonadetes have an important role in denitrification [40], and Actinobacteria participate in the decomposition of SOM and carbohydrates, and assimilation of inorganic nitrogen [41].

4.3. Effects of RW Irrigation on Soil Bacterial Community Strcture and Composition

Soil microorganisms play a critical role in the ecosystem [42]. Proteobacteria were the main taxonomic group under RW irrigation with reduced nitrogen fertilization, followed by Bacterioidetes, Gemmatimonadetes, Actinobacteria and Acidobacteria. Collectively, their abundance accounted for over 93% of total soil bacteria; thus, these phyla reflect the major composition of the soil bacterial community under RW irrigation. Proteobacteria are one of the most abundant phyla in soils irrigated with RW or CW, and most members of this group carry out nitrogen fixation as an adaptive measure [43]. However, we found that changes in environmental conditions (water quality and fertilization) had no obvious effect on the distribution and relative abundance of Proteobacteria, although some differences may have been present at lower taxonomic levels [38].
Results of the weighted and unweighted UniFrac PCoA showed that samples clustered more closely under RW or CW irrigation than nitrogen fertilization, indicating that soil bacterial community structure is altered significantly by RW irrigation, as reported by others [31,44]. Unweighted UniFrac PCoA of different N fertilization conditions revealed that soil bacterial community composition changed obviously with decreasing N fertilization rate under RW irrigation, which is consistent with the results of another study [16]. At the same nitrogen level, RW irrigation promoted the growth of oligotrophic bacteria (mainly Actinobacteria) as compared to CW irrigation, which was likely due to the provision of organic carbon and other elements, as is suggested by the simultaneous increase in the activity of oligotrophic bacteria [45,46]. Compared to eutrophic bacteria, oligotrophic bacteria can utilize a variety of substrates, including some toxins, as a source of nutrients [47].
It was previously supposed that the effectiveness of N and carbon are major factors influencing oligotrophic and copiotrophic bacterial variation, since bacterial community structure was extremely responsive to N topdressing [38,48] and the qualities of irrigation water [4]. Soil pH also affected the overall bacterial community composition in some ecosystems [14,49,50]. Our results indicated that soil bacterial community structure is more strongly influenced by the type of irrigation water than by N fertilization.

4.4. Effects of RW Irrigation on Tomato Yield and PFPN

Plant biomass is one of the important indicators to measure yield. The tomato plant biomass of RN270 was significantly higher than that of RN216, RN189, and RN135. However, the yield of RN270 was significantly lower than that of RN216 and RN189, the PFPN of RN270 was lower, the tomato yield and PFPN of RN216 was highest, which was due to the fact that reasonably reducing N fertilization stimulated the microbial activity, changed the soil biochemical characteristics, and improved soil nitrogen use efficiency [51]. The RN270 treatment resulted in an increased growth of plant at the expense of tomato yield [52]. The tomato yield and PFPN could be increased significantly under RW irrigation with reducing N fertilization.

5. Conclusions

Bacterial community composition and structure in soils was significantly altered by RW irrigation with reduced N fertilization, which was due to the changes in the physiochemical properties of the soil. RW decreased soil pH at a higher N-level, compared to CW irrigation. Compared to CW irrigation, the relative abundances of Gemmatimonadetes, Actinobacteria, Firmicutes, and Nitrospirae were increased in soils irrigated with RW; soil bacterial community richness and diversity revealed no significant effect under RW irrigation with various N fertilization rates. Soil bacterial community composition is more strongly influenced by the type of irrigation water than by N fertilization. The tomato yield and partial factor productivity from applied N for RN216 was increased significantly under RW irrigation.

Supplementary Materials

The following are available online at https://www.mdpi.com/2073-4441/10/4/365/s1, Figure S1: Shannon-Wiener curve of soils with different nitrogen levels under reclaimed water irrigation (cutoff = 0.03).

Acknowledgements

The authors would like to extend their sincere gratitude to the Agriculture Water and Soil Environment Field Science Research Station, China, for the permission to carry out the research. This research was supported by the Central Public-interest Scientific Institution Basal Research Fund (Farmland Irrigation Research Institute, CAAS, FIRI2017-13) and by the National Natural Science Foundation of China (Grant No. 51679241, 51709265). We are also grateful to other anonymous reviewers for their valuable comments on the manuscript.

Author Contributions

The research presented here was carried out in collaboration among all authors. Wei Guo, Xuebin Qi and Ping Li conceived the idea and designed the study; Wei Guo conducted the data analysis and prepared the first draft of the manuscript. Yatao Xiao, Yan Zhang and Zhijuan Zhao participated in sampling and laboratory experiments. Mathias Neumann Andersen, Xuebin Qi and Ping Li provided important advice on the concept of the methodology and the writing of the manuscript.

Conflicts of Interest

The authors declare no conflict of interest.

References

  1. Daquiado, A.R.; Kuppusamy, S.; Kim, S.Y.; Kim, J.H.; Yoon, Y.E.; Kim, P.J.; Oh, S.H.; Kwak, Y.S.; Lee, Y.B. Pyrosequencing analysis of bacterial community diversity in long-term fertilized paddy field soil. Appl. Soil Ecol. 2016, 108, 84–91. [Google Scholar] [CrossRef]
  2. Cardinale, B.J.; Srivastava, D.S.; Duffy, J.E.; Wright, J.P.; Downing, A.L.; Sankaran, M.; Jouseau, C. Effects of biodiversity on the functioning of trophic groups and ecosystems. Nature 2006, 443, 989–992. [Google Scholar] [CrossRef] [PubMed]
  3. Costa, A.L.; Paixão, S.M.; Caçador, I.; Carolino, M. CLPP and EEA profiles of microbial communities in salt marsh sediments. J. Soil Sediments 2007, 7, 418–425. [Google Scholar] [CrossRef]
  4. Frenk, S.; Hadar, Y.; Minz, D. Resilience of soil bacterial community to irrigation with water of different qualities under Mediterranean climate. Environ. Microbiol. 2014, 16, 559–569. [Google Scholar] [CrossRef] [PubMed]
  5. Angin, I.; Yaganoglu, A.V.; Turan, M. Effects of long-term wastewater irrigation on soil properties. J. Sustain. Agric. 2005, 26, 31–42. [Google Scholar] [CrossRef]
  6. Lubello, C.; Gori, R.; Nicese, F.P.; Ferrini, F. Municipal-treated wastewater reuse for plant nurseries irrigation. Water Res. 2004, 38, 2939–2947. [Google Scholar] [CrossRef] [PubMed]
  7. Xu, J.; Wu, L.S.; Chang, A.C.; Zhang, Y. Impact of long-term reclaimed wastewater irrigation on agricultural soils, A preliminary assessment. J. Hazard. Mater. 2010, 183, 780–786. [Google Scholar] [CrossRef] [PubMed]
  8. Adrover, M.; Farrus, E.; Moya, G.; Vadell, J. Chemical properties and biological activity in soils of Mallorca following twenty years of treated wastewater irrigation. J. Environ. Manag. 2012, 95, S188–S192. [Google Scholar] [CrossRef] [PubMed]
  9. Qian, Y.L.; Mecham, B. Long-term effects of recycled wastewater irrigation on soil chemical properties on golf course fairways. Agron. J. 2005, 97, 717–721. [Google Scholar] [CrossRef]
  10. Bastida, F.; Torres, I.F.; Romero-Trigueros, C.; Baldrian, P.; Vetrovský, T.; Bayona, J.M.; Alarcón, J.J.; Hernández, T.; García, C.; Nicolás, E. Combined effects of reduced irrigation and water quality on the soil microbial community of a citrus orchard under semi-arid conditions. Soil Biol. Biochem. 2017, 104, 226–237. [Google Scholar] [CrossRef]
  11. Ramirez, K.S.; Craine, J.M.; Fierer, N. Consistent effects of nitrogen amendments on soil microbial communities and processes across biomes. Glob. Chang. Biol. 2012, 18, 1918–1927. [Google Scholar] [CrossRef]
  12. Lassaletta, L.; Billen, G.; Grizzetti, B.; Anglade, J.; Garnier, J. 50 year trends in nitrogen use efficiency of world cropping systems, the relationship between yield and nitrogen input to cropland. Environ. Res. Lett. 2014, 9, 105011. [Google Scholar] [CrossRef]
  13. Shen, W.S.; Lin, X.G.; Gao, N.; Zhang, H.Y.; Yin, R.; Shi, W.M.; Duan, Z.Q. Land use intensification affects soil microbial populations, functional diversity and related suppressiveness of cucumber Fusarium wilt in China’s Yangtze River Delta. Plant Soil 2008, 306, 117–127. [Google Scholar] [CrossRef]
  14. Geisseler, D.; Scow, K.M. Long-term effects of mineral fertilizers on soil microorganisms—A review. Soil Biol. Biochem. 2014, 75, 54–63. [Google Scholar] [CrossRef]
  15. Ge, Y.; Zhang, J.B.; Zhang, L.M.; Yang, M.; He, J.Z. Long-term fertilization regimes affect bacterial community structure and diversity of an agricultural soil in Northern China. J. Soil Sediments 2008, 8, 43–50. [Google Scholar] [CrossRef]
  16. Shen, W.S.; Ni, Y.Y.; Gao, N.; Bian, B.Y.; Zheng, S.N.; Lin, X.G.; Chu, H.Y. Bacterial community composition is shaped by soil secondary salinization and acidification brought on by high nitrogen fertilization rates. Appl. Soil Ecol. 2016, 108, 76–83. [Google Scholar] [CrossRef]
  17. Huang, X.R.; Xiong, W.; Liu, W.; Guo, X.Y. Effect of reclaimed water effluent on bacterial community structure in the Typha angustifolia L. rhizosphere soil of urbanized riverside wetland, China. J. Environ. Sci. 2017, 55, 58–68. [Google Scholar] [CrossRef] [PubMed]
  18. Liu, L.; Greaver, T.L. A global perspective on belowground carbon dynamics under nitrogen enrichment. Ecol. Lett. 2010, 13, 819–828. [Google Scholar] [CrossRef] [PubMed]
  19. Bao, S.D. Soil and Agro-Chemical Analysis Methods; China Agriculture Press: Beijing, China, 2000; pp. 25–38. (In Chinese) [Google Scholar]
  20. Liu, Z.; Lozupone, C.; Hamady, M.; Bushman, F.; Knight, R. Short pyrosequencing reads suffice for accurate microbial community analysis. Nucleic Acids Res. 2007, 35, e120. [Google Scholar] [CrossRef] [PubMed]
  21. Bergmann, G.; Bates, S.; Eilers, K.; Lauber, C.; Caporaso, J.; Walters, W. The under-recognized dominance of Verrucomicrobia in soil bacterial communities. Soil Biol. Biochem. 2011, 43, 1450–1455. [Google Scholar] [CrossRef] [PubMed]
  22. Schloss, P.D.; Westcott, S.L.; Ryabin, T.; Hall, J.R.; Hartmann, M.; Hollister, E.B.; Lesniewski, R.A.; Oakley, B.B.; Parks, D.H.; Robinson, C.J.; et al. Introducing mothur, open source, platform-independent, community-supported software for describing and comparing microbial communities. Appl. Environ. Microbiol. 2009, 75, 7537–7541. [Google Scholar] [CrossRef] [PubMed]
  23. Fierer, N.; Pena, A.G.; Goodrich, J.K.; Gordon, J.I.; Huttley, G.A.; Kelley, S.T.; Knights, D.; Koenig, J.E.; Ley, R.E.; Lozupone, C.A.; et al. QIIME allows analysis of high-throughput community sequencing data. Nat. Methods 2010, 7, 335–336. [Google Scholar]
  24. Edgar, R.C. Search and clustering orders of magnitude faster than BLAST. Bioinformatics 2010, 26, 2460–2461. [Google Scholar] [CrossRef] [PubMed]
  25. Hamady, M.; Lozupone, C.; Knight, R. Fast UniFrac, Facilitating high-throughput phylogenetic analyses of microbial communities including analysis of pyrosequencing and PhyloChip data. ISME J. 2010, 4, 17–27. [Google Scholar] [CrossRef] [PubMed]
  26. Fierer, N.; Lauber, C.L.; Ramirez, K.S.; Zaneveld, J.; Bradford, M.A.; Knight, R. Comparative metagenomic, phylogenetic and physiological analyses of soil microbial communities across nitrogen gradients. ISME J. 2012, 6, 1007–1017. [Google Scholar] [CrossRef] [PubMed]
  27. Hadidi, M.E.; Ruscheweyh, H.J.; Huson, D.H. Improved metagenome analysis using MEGAN5. In Joint, 21st Annual International Conference on ISMB and 12th ECCB; ISCB: Bethesda, MD, USA, 2013; Volume 4. [Google Scholar]
  28. Ondov, B.D.; Bergman, N.H.; Phillippy, A.M. Interactive metagenomic visualization in a Web browser. BMC Bioinform. 2011, 12, 385. [Google Scholar] [CrossRef] [PubMed]
  29. Aldrete-Tapia, A.; Escobar-Ramírez, M.C.; Tamplin, M.L.; Hernández-Iturriaga, M. High-throughput sequencing of microbial communities in Poro cheese, an artisanal Mexican cheese. Food Microbiol. 2014, 44, 136–141. [Google Scholar] [CrossRef] [PubMed]
  30. Ostrowski, M.; Fegatella, F.; Wasinger, V.; Guihaus, M.; Corthals, L.G.; Cavicchioli, R. Cross-species identification of proteins from proteome profiles of the marine oligotrophic ultramicrobacterium, Sphingopyxis alaskensis. Proteomics 2004, 4, 1779–1788. [Google Scholar] [CrossRef] [PubMed]
  31. García-Orenes, F.; Caravaca, F.; Morugán-Coronado, A.; Roldán, A. Prolonged irrigation with municipal wastewater promotes a persistent and active soil microbial community in a semiarid agroecosystem. Agric. Water Manag. 2015, 149, 115–122. [Google Scholar] [CrossRef]
  32. Gelsomino, A.; Badalucco, L.; Ambrosoli, R.; Crecchio, C.; Puglisi, E.; Meli, S.M. Changes in chemical and biological soil properties as induced by anthropogenic disturbance, a case study of an agricultural soil under recurrent flooding by wastewaters. Soil Biol. Biochem. 2006, 38, 2069–2080. [Google Scholar] [CrossRef]
  33. Bach, E.M.; Baer, S.G.; Meyer, C.K.; Six, J. Soil texture affects soil microbial and structural recovery during grassland restoration. Soil Biol. Biochem. 2010, 42, 2182–2191. [Google Scholar] [CrossRef]
  34. Xun, W.B.; Xu, Z.H.; Wei, L.; Ren, Y.; Huang, T.; Ran, W.; Wang, B.R.; Shen, Q.R.; Zhang, R.F. Long-term organic-inorganic fertilization ensures great soil productivity and bacterial diversity after natural-to-agricultural ecosystem conversion. J. Microbiol. 2016, 54, 611–617. [Google Scholar] [CrossRef] [PubMed]
  35. Sylvia, D.M.; Fuhrmann, J.J.; Hartel, P.; Zuberer, D.A. Principles and applications of soil microbiology. New Age Int. 1998, 34, 11–68. [Google Scholar]
  36. Waldrop, M.P.; Balser, T.C.; Firestone, M.K. Linking microbial composition to function in a tropical soil. Soil Biol. Biochem. 2000, 32, 1837–1846. [Google Scholar] [CrossRef]
  37. Bobbink, R.; Hicks, K.; Galloway, J.; Spranger, T.; Alkemade, R.; Ashmore, M.; Bustamante, M.; Cinderby, S.; Davidson, E.; Dentener, F.; et al. Global assessment of nitrogen deposition effects on terrestrial plant diversity, a synthesis. Ecol. Appl. 2010, 20, 30–59. [Google Scholar] [CrossRef] [PubMed] [Green Version]
  38. Zeng, J.; Liu, X.J.; Song, L.; Lin, X.G.; Zhang, H.Z.; Shen, C.C.; Chu, H.Y. Nitrogen fertilization directly affects soil bacterial diversity and indirectly affects bacterial community composition. Soil Biol. Biochem. 2016, 92, 41–49. [Google Scholar] [CrossRef]
  39. Becerra-Castro, C.; Lopes, A.R.; Vaz-Moreira, I.; Silva, E.F.; Manaia, C.M.; Nunes, O.C. Wastewater reuse in irrigation, a microbiological perspective on implications in soil fertility and human and environmental health. Environ. Int. 2015, 75, 117–135. [Google Scholar] [CrossRef] [PubMed]
  40. Guo, Y.H.; Gong, H.L.; Guo, X.Y. Rhizosphere bacterial community of Typha angustifolia L. and water quality in a river wetland supplied with reclaimed water. Appl. Microbiol. Biotechnol. 2015, 99, 2883–2893. [Google Scholar] [CrossRef] [PubMed]
  41. Häni, H.; Siegenthaler, A.; Candinas, T. Soil effects due to sewage sludge application in agriculture. Fertil. Res. 1995, 43, 149–156. [Google Scholar] [CrossRef]
  42. Van Der Heijden, M.G.A.; Bardgett, R.D.; Van Straalen, N.M. The unseen majority, soil microbes as drivers of plant diversity and productivity in terrestrial ecosystems. Ecol. Lett. 2008, 11, 296–310. [Google Scholar] [CrossRef] [PubMed]
  43. Liu, J.J.; Sui, Y.Y.; Yu, Z.H.; Yu, S.; Chu, H.Y.; Jin, J.; Liu, X.B.; Wang, G.H. High throughput sequencing analysis of biogeographical distribution of bacterial communities in the black soils of northeast China. Soil Biol. Biochem. 2014, 70, 113–122. [Google Scholar] [CrossRef]
  44. Guo, W.; Andersen, M.N.; Qi, X.B.; Li, P.; Li, Z.Y.; Fan, X.Y.; Zhou, Y. Effects of reclaimed water irrigation and nitrogen fertilization on the chemical properties and microbial community of soil. J. Integr. Agric. 2017, 16, 679–690. [Google Scholar] [CrossRef]
  45. Fierer, N.; Bradford, M.A.; Jackson, R.B. Toward an ecological classification of soil bacteria. Ecology 2007, 88, 1354–1364. [Google Scholar] [CrossRef] [PubMed]
  46. Huang, Y.S.; Shen, F.T. Bioprospecting of facultatively oligotrophic bacteria from non-rhizospheric soils. Appl. Soil Ecol. 2016, 108, 315–324. [Google Scholar] [CrossRef]
  47. Tada, Y.; Kobata, T.; Nakaoka, C. A simple and easy method for the monitoring of environmental pollutants using oligotrophic bacteria. Lett. Appl. Microbiol. 2001, 32, 12–15. [Google Scholar] [CrossRef] [PubMed]
  48. Ramirez, K.S.; Lauber, C.L.; Knight, R.; Bradford, M.A.; Fierer, N. Consistent effects of nitrogen fertilization on soil bacterial communities in contrasting systems. Ecology 2010, 91, 3463–3470. [Google Scholar] [CrossRef] [PubMed]
  49. Lauber, C.L.; Hamady, M.; Knight, R.; Fierer, N. Pyrosequencing-based assessment of soil pH as a predictor of soil bacterial community structure at the continental scale. Appl. Environ. Microbiol. 2009, 75, 5111–5120. [Google Scholar] [CrossRef] [PubMed]
  50. Li, J.; Cooper, J.M.; Lin, Z.A.; Li, Y.; Yang, X.; Zhao, B. Soil microbial community structure and function are significantly affected by long-term organic and mineral fertilization regimes in the North China Plain. Appl. Soil Ecol. 2015, 96, 75–87. [Google Scholar] [CrossRef]
  51. Truu, M.; Truu, J.; Heinsoo, K. Changes in soil microbial community under willow coppice: The effect of irrigation with secondary-treated municipal wastewater. Ecol. Eng. 2009, 35, 1011–2010. [Google Scholar] [CrossRef]
  52. Zhu, J.H.; Li, X.L.; Zhang, F.S.; Li, J.L.; Christie, P. Response of greenhouse tomato and pepper yields and nitrogen dynamics to applied compound fertilizers. Pedosphere 2004, 14, 213–222. [Google Scholar]
Figure 1. Relative abundance of bacterial phyla in soils under reclaimed water and clean water irrigation with reducing nitrogen fertilization based on 16S rRNA gene amplicons. Columns and lines were clustered based on Bray-Curtis diversity measures. The transverse and longitudinal represent sample information and species annotation information, respectively. The clustering trees on the top of the diagram represent samples. The heat map represents Z values for relative abundance of the bacterial community in each row when dealing with standardization.
Water 10 00365 g001
Figure 2. Relative abundance of bacterial genera in soils under reclaimed water (a) and clean water (b) irrigation with reducing nitrogen fertilization based on 16S rRNA gene amplicons. We calculated the relative abundance of each genus in total samples, where those with low abundance (<1%) were combined as Other.
Water 10 00365 g002aWater 10 00365 g002b
Figure 3. The differences of bacterial community structure in soils under reclaimed water and clean water irrigation were analyzed by the principal coordinates analysis (PCoA) of weighted UniFrac (a) and unweighted UniFrac (b) based on distance matrix. The solid circles (R) and hollow circles (C) represent samples in soils under reclaimed water and clean water irrigation, respectively.
Water 10 00365 g003
Figure 4. Redundancy analysis (RDA) diagram illustrating (a) the relationship between bacterial community (relative abundance of phyla) with environmental factors and (b) the relationship between bacterial community with samples in soils under reclaimed water and clean water irrigation. The environmental factors and bacterial community are indicated by red arrows and blue arrows, respectively. The samples are indicated by different shapes. RDA analysis was conducted by CANOCO software (Version 4.5, Microcomputer Power Company, Ithaca, NY, USA).
Water 10 00365 g004
Figure 5. Tomato yield and biomass under reclaimed water irrigation with different N fertilization rates. The solid square (R) and hollow square (C) represent samples in soils irrigated with reclaimed water and clean water, respectively. N270, 270 kg ha−1 nitrogen addition; N216, 216 kg ha−1 nitrogen; N189, 189 kg ha−1 nitrogen; N135, 135 kg ha−1 nitrogen.
Water 10 00365 g005
Figure 6. The partial factor productivity from applied nitrogen (PFPN) under reclaimed water irrigation with different N fertilization rates. PFPN represents Tomato yield/nitrogen rate. The solid square (R) and hollow square (C) represent samples in soils irrigated with reclaimed water and clean water, respectively.
Water 10 00365 g006
Table 1. Physical and Chemical characteristics of irrigation water in the study 1).
IndexNO3-NNH4+-NTNTPCuCdCr
(mg L−1)(mg L−1)(mg L−1)(mg L−1)(mg L−1)(µg L−1)(µg L−1)
CW1.70.863.92.880.0050.686.38
RW20.6211.1145.142.940.023.3320.08
RMI----1.010.0100
IndexCODMnpHECKNaCaMg
(mg L−1) (ds m−1)(mg L−1)(mg L−1)(mg L−1)(mg L−1)
CW7.867.520.630.8853.810.2111.0
RW13.377.41.75.81178.641.7335.7
RMI605.5–8.51–2----
1) CW, clean water; RW, reclaimed water; RMI, Recommended maximum concentrations from standards for irrigation water quality of China (GB 5084-2005). NO3-N, nitrate nitrogen; NH4+-N, ammonium nitrogen; TN, total nitrogen; TP, total phosphorus; Cu, copper; Cd, cadmium; Cr, chromium; CODMn, chemical oxygen demand (permanganate index); pH, water pH value; EC, electrical conductivity.
Table 2. Soil chemical properties under clean (C) or reclaimed (R) water irrigation with different nitrogen fertilization rates.
Treatments 1)TNg kg−1TPg kg−1OM 2) g kg−1NO3-N mg kg−1EC μs cm−1pH 3)C/N 4)
CN2701.48 ± 0.21a1.88 ± 0.08a33.32 ± 1.97a55.04 ± 3.94c812.00 ± 22.91cd8.63 ± 0.03b13.06
RN2700.97 ± 0.06c1.65 ± 0.06b24.45 ± 0.83b109.77 ± 10.08a978.33 ± 67.88b8.41 ± 0.02d14.62
CN2161.30 ± 0.03ab1.80 ± 0.03a33.04 ± 2.67a73.62 ± 12.28b970.00 ± 38.12b8.55 ± 0.03c14.74
RN2161.15 ± 0.05bc1.92 ± 0.13a32.52 ± 3.10a78.63 ± 1.96b1061.00 ± 26.21a8.33 ± 0.02e16.40
CN1891.45 ± 0.26a1.87 ± 0.02a33.23 ± 1.35a83.46 ± 6.78b711.67 ± 57.73de8.66 ± 0.01c13.29
RN1890.95 ± 0.01c1.64 ± 0.12a29.94 ± 3.35a97.13 ± 0.85b805.00 ± 32.19cd8.54 ± 0.02b18.28
CN1351.21 ± 0.01bc1.93 ± 0.10a32.65 ± 0.62a52.05 ± 0.14c706.00 ± 34.39de8.74 ± 0.05a15.65
RN1351.08 ± 0.12bc1.63 ± 0.01b28.86 ± 3.00a60.73 ± 0.06c746.00 ± 34.39de8.57 ± 0.01c15.50
Significance based on two-way analysis of variance (ANOVA) (F value)
W (water)36.44 **22.47 **18.58 **3.7612.23 **4.29
N (nitrogen)0.5421.912.9443.14 **71.67 **25.98 **
W × N4.02 *8.07 **3.33 *73.22 **88.99 **34.20 **
1) C, clean water irrigation; R, reclaimed water irrigation; N270, 270 kg ha−1 nitrogen addition; N216, 216 kg ha−1 nitrogen; N189, 189 kg ha−1 nitrogen; N135, 135 kg ha−1 nitrogen. 2) OM, soil organic matter. 3) pH, soil pH value. 4) C/N, soil carbon and nitrogen ratio. The different lowercase letters in the same column indicate statistically significant (p < 0.05) differences among different treatments (Duncan’s test), and the values are mean ± standard error (n = 3). **, * Significance at the p < 0.01, p < 0.05, respectively.
Table 3. Changes in soil bacterial diversity based on OTU under reclaimed water irrigation with different N fertilization rates 1).
TreatmentsOTUsACEChaoShannon(H)SimpsonCoverage
CN2702544b3157.07b3402.55b6.84b0.002414ab0.9820a
RN2702894ab3724.00ab3995.85ab6.99ab0.001985ab0.9744ab
CN2162971ab3820.15ab4099.65ab6.99ab0.002006ab0.9665b
RN2162726ab3561.71ab3754.39ab6.94ab0.002036ab0.9681b
CN1893067ab3886.37ab4162.58ab6.97ab0.002641a0.9688b
RN1892881ab3816.72ab4085.08ab6.98ab0.001888ab0.9682b
CN1353387a4294.39a4605.83a7.10a0.001777b0.9724ab
RN1353057ab3995.39ab4295.40ab6.99ab0.002077ab0.9748ab
Significance based on two-way analysis of variance (ANOVA) (F value)
W (water) 0.0050.0230.0001.6790.183
N (nitrogen) 1.8591.8912.2740.9014.164 *
W × N 0.8560.8842.5742.0380.851
1) OTUs, operational taxonomic units; ACE, abundance-based coverage estimator; Chao, richness estimate for an OTU definition; Shannon, Non-parametric Shannon diversity index; Simpson, the Simpson index; Coverage, the Coverage index. * Significance at the p < 0.05.
Table 4. Correlations between soil microbial diversity and chemical properties under reclaimed water irrigation.
OTUACEChaoShannonSimpsonCoverageEC (ds/m)pHNO3-N (mg/kg)OM (g/kg)TP (g/kg)TN (g/kg)
OTU1.00
ACE0.985 **1.00
Chao0.980 **0.991 **1.00
Shannon0.803 **0.833 **0.834 **1.00
Simpson−0.144−0.225−0.214−0.585 **1.00
Coverage−0.224−0.300−0.316−0.406 *0.2151.00
EC (ds/m)−0.024−0.055−0.0810.0310.245−0.2661.00
pH0.1200.1150.1460.033−0.0110.232−0.814 **1.00
NO3-N (mg/kg)−0.017−0.054−0.0620.0090.125−0.0710.820 *−0.719 **1.00
OM (g/kg)0.1120.0950.0980.0130.173−0.3500.1150.064−0.2351.00
TP (g/kg)−0.005−0.089−0.08−0.0760.207−0.0980.443 *−0.3230.1510.552 **1.00
TN (g/kg)−0.097−0.204−0.171−0.2750.3230.1770.1930.0870.1110.554 **0.572 **1.00
**, * Significance at the p < 0.01, p < 0.05, respectively.

