Flow Velocity Effects on Fe(III) Clogging during Managed Aquifer Recharge Using Urban Storm Water


1
Key Laboratory of Groundwater Resources and Environment, Ministry of Education, Jilin University, Changchun 130021, China
2
College of Environment and Resources, Jilin University, Changchun 130021, China
*
Author to whom correspondence should be addressed.
Water 2018, 10(4), 358; https://doi.org/10.3390/w10040358
Submission received: 19 February 2018
/
Revised: 13 March 2018
/
Accepted: 20 March 2018
/
Published: 22 March 2018
(This article belongs to the Special Issue Water Recycling via Aquifers)
Abstract
:Storm water harvesting and storage has been employed for nearly a hundred years, and using storm water to recharge aquifers is one of the most important ways to relieve water scarcity in arid and semi-arid regions. However, it cannot be widely adopted because of clogging problems. The risk of chemical clogging is mostly associated with iron oxyhydroxide precipitation; anhydrous ferric oxide (HFO) clogging remains a problem in many wellfields. This paper investigates Fe(III) clogging levels at three flow velocities (Darcy velocities, 0.46, 1.62 and 4.55 m/d). The results indicate that clogging increases with flow velocity, and is mostly affected by the first 0–3 cm of the column. The highest water velocity caused full clogging in 35 h, whereas the lowest took 53 h to reach an stable 60% reduction in hydraulic conductivity. For the high flow velocity, over 90% of the HFO was deposited in the 0–1 cm section. In contrast, the lowest flow velocity deposited only 75% in this section. Fe(III) deposition was used as an approximation for Fe(OH)3. High flow velocity may promote Fe(OH)3 flocculent precipitate, thus increasing Fe(III) deposition. The main mechanism for a porous matrix interception of Fe(III) colloidal particles was surface filtration. Thus, the effects of deposition, clogging phenomena, and physicochemical mechanisms, are more significant at higher velocities.
1. Introduction
Water scarcity is a significant and growing problem in many arid regions across the globe. Storm water harvesting and storage has existed for nearly a hundred years, and is a promising approach to combatting water scarcity in arid and semi-arid regions, where natural groundwater replenishment is slow compared to groundwater exploitation. In these areas, water resource usage is near the limits of sustainability, and the requirement to recycle water and ensure appropriate reuse is becoming critical [1]. Aquifer recharge using storm water runoff has been used for more than a century in the United States [2]. A regional network of distributed storm water collection-managed aquifer recharge (MAR) projects could increase groundwater supplies while contributing to improved groundwater quality, flood mitigation, and stakeholder engagement [3].
Although using storm water aquifer recharge has many advantages, it cannot be widely implemented because of clogging problems [4], of which there are four principal types [5]:
- chemical, including precipitation of elements (such as iron or aluminum), aquifer matrix dissolution, and temperature;
- physical, including suspended solids, interstitial fines migration, unintentional fracturing of the aquifer, and formation damage that occurs during bore construction;
- mechanical, including entrained air/gas binding;
- biological, including algae growth, and the presence of iron or sulfate reducing bacteria.
Although clogging is associated with each of these factors, physical clogging is by far the most common, occurring in 70% of cases [6]. Mechanisms for a porous matrix to intercept suspended or colloidal particles include surface and cake filtration, straining or size exclusion, and physical, chemical, and biological processes [7].
The risk of iron clogging is mostly associated with its oxyhydroxide precipitation [8]. Iron clogging has been a recurring problem in the Atlantis wellfields since the 1990s, resulting in reduced borehole yields [9]. The presence of iron in the groundwater is of concern due to clogging of production boreholes [10,11], and although deeper groundwater is naturally reducing, organic carbon content may be contributing to the intensity of clogging [12]. Recovery boreholes close to injection boreholes may clog due to iron(hydr)oxides, which are produced by the mixing of water sources [13]. Li et al. used field bromide breakthrough data to infer a heterogeneous distribution of hydraulic conductivity through inverse transport modeling, and determined the solid phase Fe(III) content by postulating a negative correlation with hydraulic conductivity [14]. Heterogeneities can lead to a large localized accumulation of mineral precipitates and biomass, increasing the likelihood of pore clogging.
The effects of flow rates on clogging have been widely studied. The most important parameters for mechanical clogging are particle concentration in the moving water, seepage velocity, aspect ratio, particle properties, and pore channel geometry [15]. Mays et al. analyzed 43 experiments with a simplified version of the single-parameter O’Melia & Ai clogging model, and showed a consistent correlation with fluid velocity [16]. Physicochemical influences on deposition rate, and therefore sand texture clogging, is more significant at low flow rates [17]. Thompson et al. found biological clogging to be the dominant clogging process at lower injection rates [18]. Membrane filtration index (MFI) tests examine decreases in hydraulic conductivity due to physical clogging, but use high flow rates [19]. However, the vertical translocation of fine particles will cease after some time, and will reach a certain depth depending on the input concentration of solids the and flow rate, both of which affect the deposition rate [15]. There have been many studies of either iron, or flow rates in relation to clogging, but few studies examined both.
This paper presents experimental data for Fe(III) filtration at three flow rates through vertical laboratory columns filled with quartz sand. The experiment aims to: (1) quantify the reduction in permeability; (2) develop a better understanding of the dynamics of vertically translocated, seepage entrained Fe(III) when driven through fine quartz sand; and (3) explore Fe(III) clogging mechanisms.
2. Materials and Methods
2.1. Experimental Apparatus
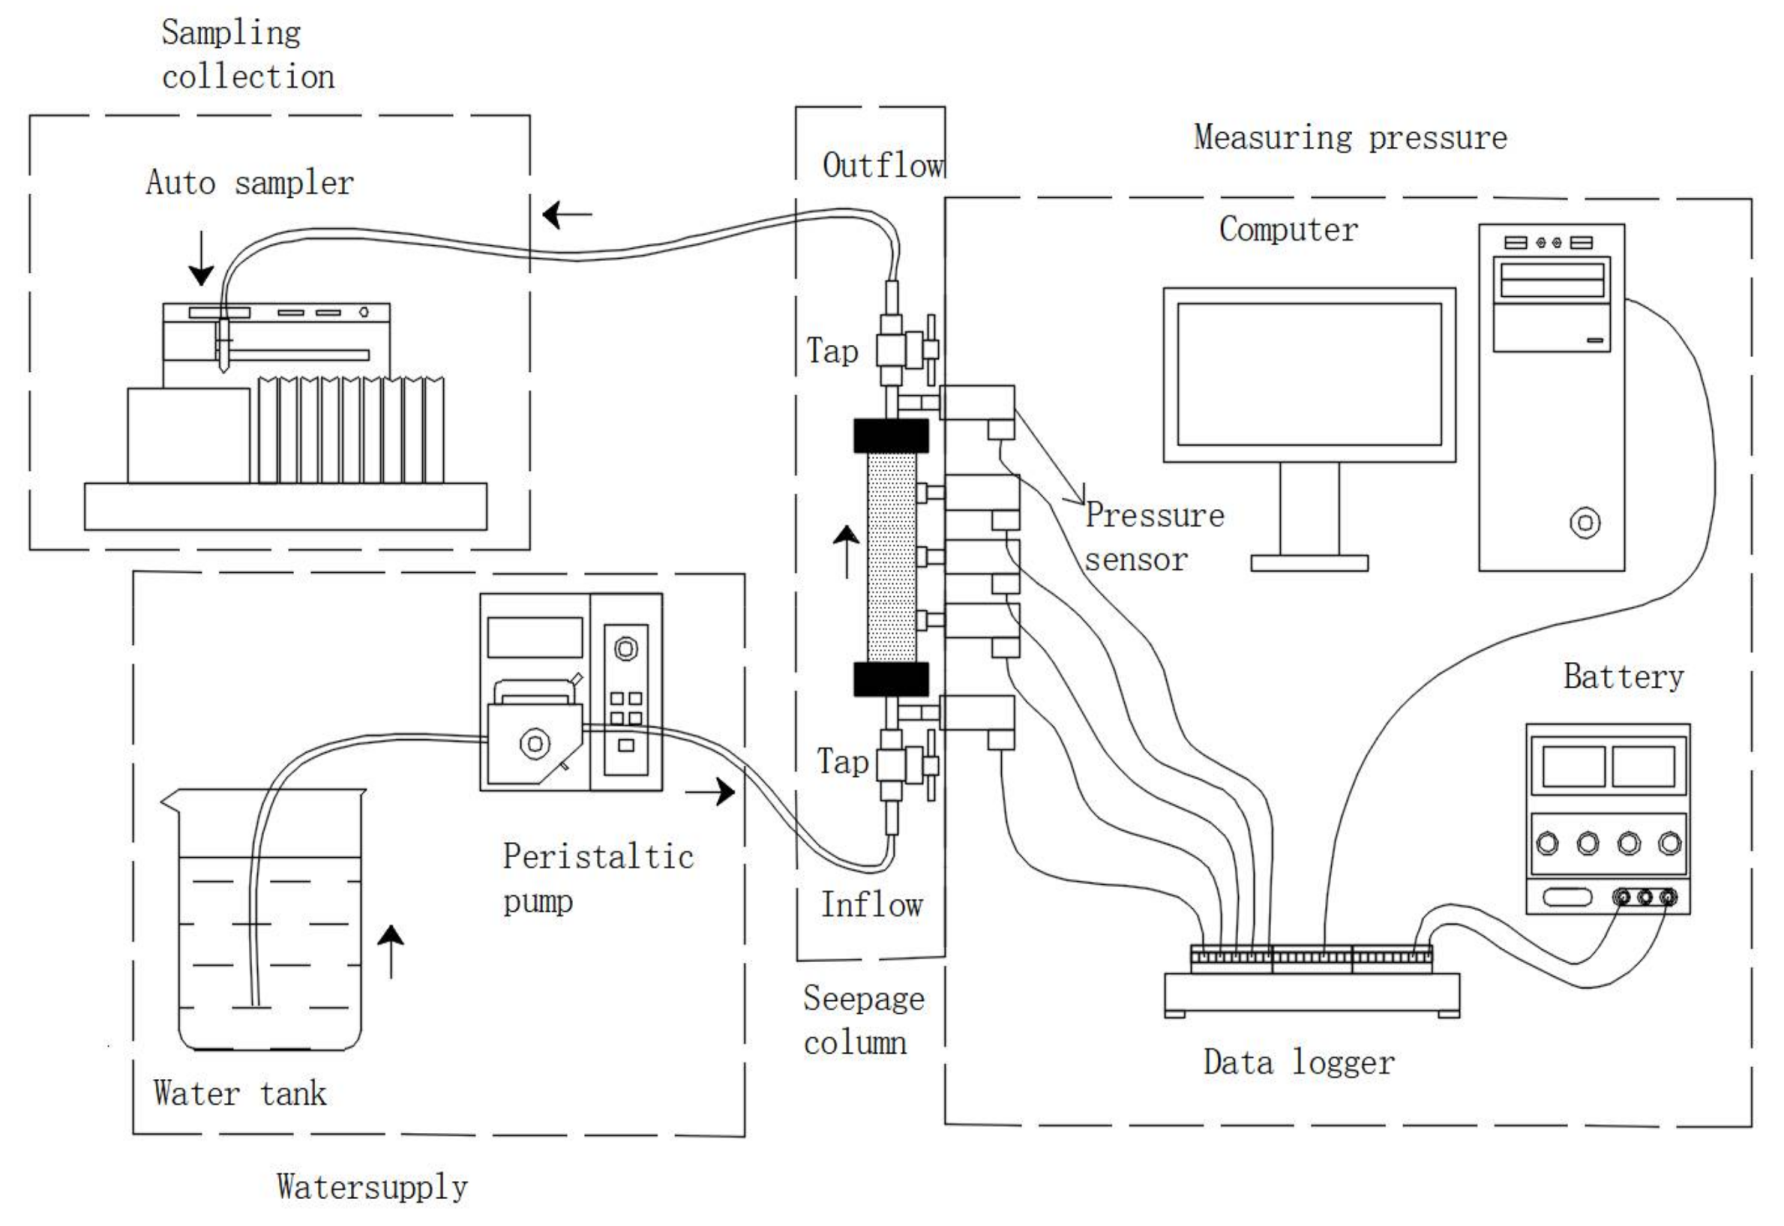
Column infiltration studies using treated water have been widely used to study physical, biological and chemical clogging [1,20]. Figure 1 shows a schematic representation of the columns used in the experiment. The system comprised four parts connected with poly-fuoroalcoxy tubing, including water supply, seepage column, water pressure transducers, and water sample collector. The columns were made from clear Plexiglas (16 cm long and 2.0 cm internal diameter). Gauze meshes placed inside the end caps supported the aquifer material, and helped spread the input solution laterally throughout the columns. 5 g sand was placed inside the column and compacted to a height of 1 cm. Each column was packed with 80 g sand, giving a density of sand of around 1.6 g/cm3.
The columns were packed with pure fine quartz sand, median particle diameter ≈0.163 mm. Columns were packed with sand in 1 cm increments according to its natural density (1.6 g/cm3). Inlet flow rates were set to 0.3, 1.0 and 3 mL/min, which correspond to Darcy flow velocity (VD) 0.46, 1.62 and 4.55 m/d, respectively. The water pumped into the column was a solution of pure FeCl3·6H2O (>99%) and ultrapure water, with Fe(III) concentration = 3.0 mg/L, and pH 7, adjusted using a 25% ammonia solution (NH3·H2O).
A peristaltic pump (BT100-1F, Longer Precision Pump Co., Ltd., Baoding, China) was used to continuously feed the water through the columns from bottom to top.
Clogging development and resulting decrease in hydraulic conductivity was monitored using pressure transducers (model A-10, WIKA, Klingenberg, Germany) which were connected to a data logger. Transducers were placed along the columns at 5 cm intervals, with a space of 3 cm at the top and the bottom. The pressure transducers provided pressure heads at different points along the columns and at the inlet and outlet.
2.2. Column Hydraulic Properties
Clogging refers to pore occlusion in topsoil [21] due to various chemical, physical, and biological processes that jointly diminish the infiltration capacity of the basin by reducing topsoil’s hydraulic conductivity (K) over time [22]. For constant injection rate, clogging manifests as an increased hydraulic head in the infection bore. The time-dependent hydraulic conductivity in different locations of sand columns can be expressed as (Darcy’s law)
where (m3/day) is the flow rate, (m) is the column length between any two pressure transducers, (m) is the difference in hydraulic head between the two points along the column, and (m) is the inner diameter of the column. K was defined for different locations in the sand columns as K1 (0–3 cm from the column inlet), K2 (3–8 cm), K3 (8–13 cm), K4 (13–16 cm) and K (0–16 cm). The experiment terminated when Q decreased by 90% for any K location.
Sand porosity was calculated from the ratios of the volume of injected water compared to that of the column, and was found to be 0.4 for all experimental columns.
2.3. Analytical Measurements
Samples of input and output water were taken daily to record Fe(III) content changes. Parameters pH, temperature, and Eh were measured daily using a pH/ISE Meter (MP523-01, Shanghai San-Xin Instrumentation Inc., Shanghai, China). Fe(III) concentration in the input and output water was measured daily using an UV-VIS Spectrophotometer (T6, Beijing Purkinje General Instrument Co., Ltd., Beijing, China).
The pressure transducers were scanned every 30 s, and the average value recorded every 10 min. Fe(III) effluent samples were generally collected every 50 min, although this frequency was increased for some experiments where permeability reduced too rapidly.
2.4. Column Dismantling
At the experiment conclusion, sand in the columns was sampled at 1 cm intervals. The sand samples were immersed in concentrated hydrochloric acid and shaken vigorously to dissolve Fe(III) clogging material into the 12.27 mol/L acid, and the Fe(III) ion concentration derived.
3. Results and Discussion
3.1. Hydraulic Conductivity Changes
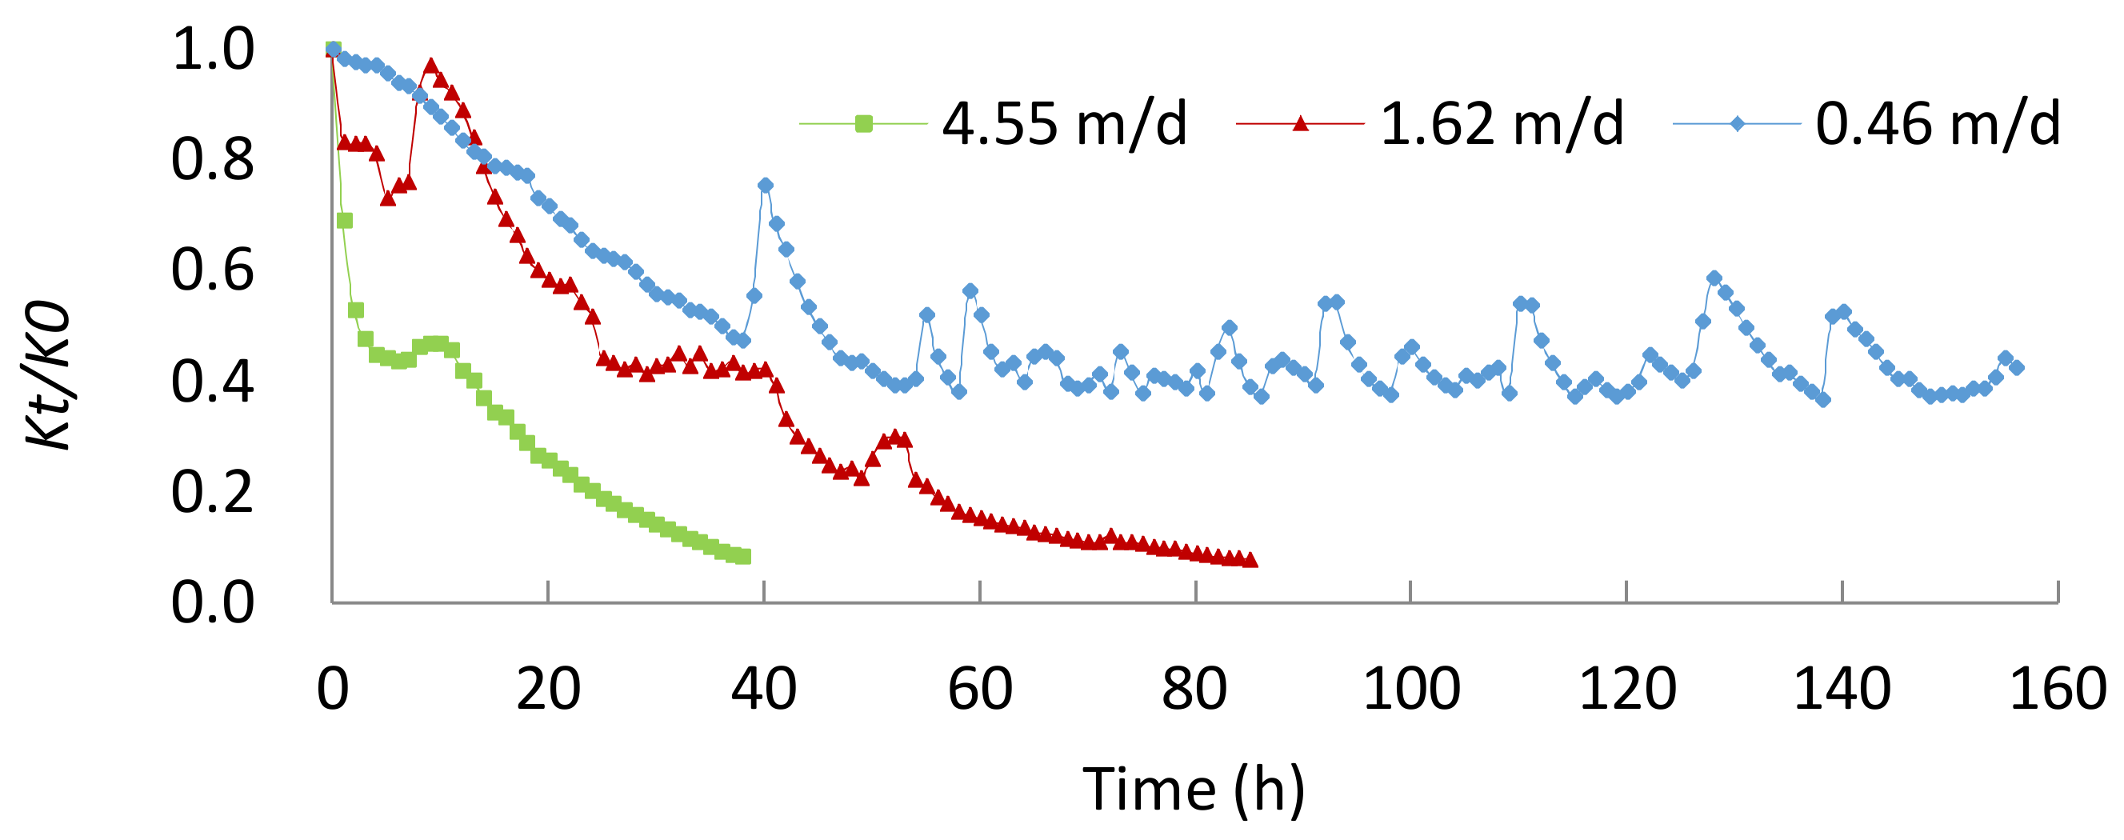
Hydraulic conductivity changes were calculated as the permeability ratio (Kt/K0), where Kt is the instantaneous hydraulic conductivity (m/d). Figure 2 shows the column permeability ratio decline for the three different inlet velocities.
Higher inlet velocity exhibits faster decrease of permeability. K reduced by 90% after 35 h for VD = 4.55 m/d, 90% after 75 h for VD = 1.62 m/d, and 61% after 52 h for VD = 0.46 m/d. For the latter (VD = 0.46 m/d), K stabilized after 52 h, and remained at ≈40% of its initial value. Decreased hydraulic conductivity means column clogging has occurred; higher inlet velocity produced faster and more significant clogging, with clogging tending to stabilize for the slowest flow rate.
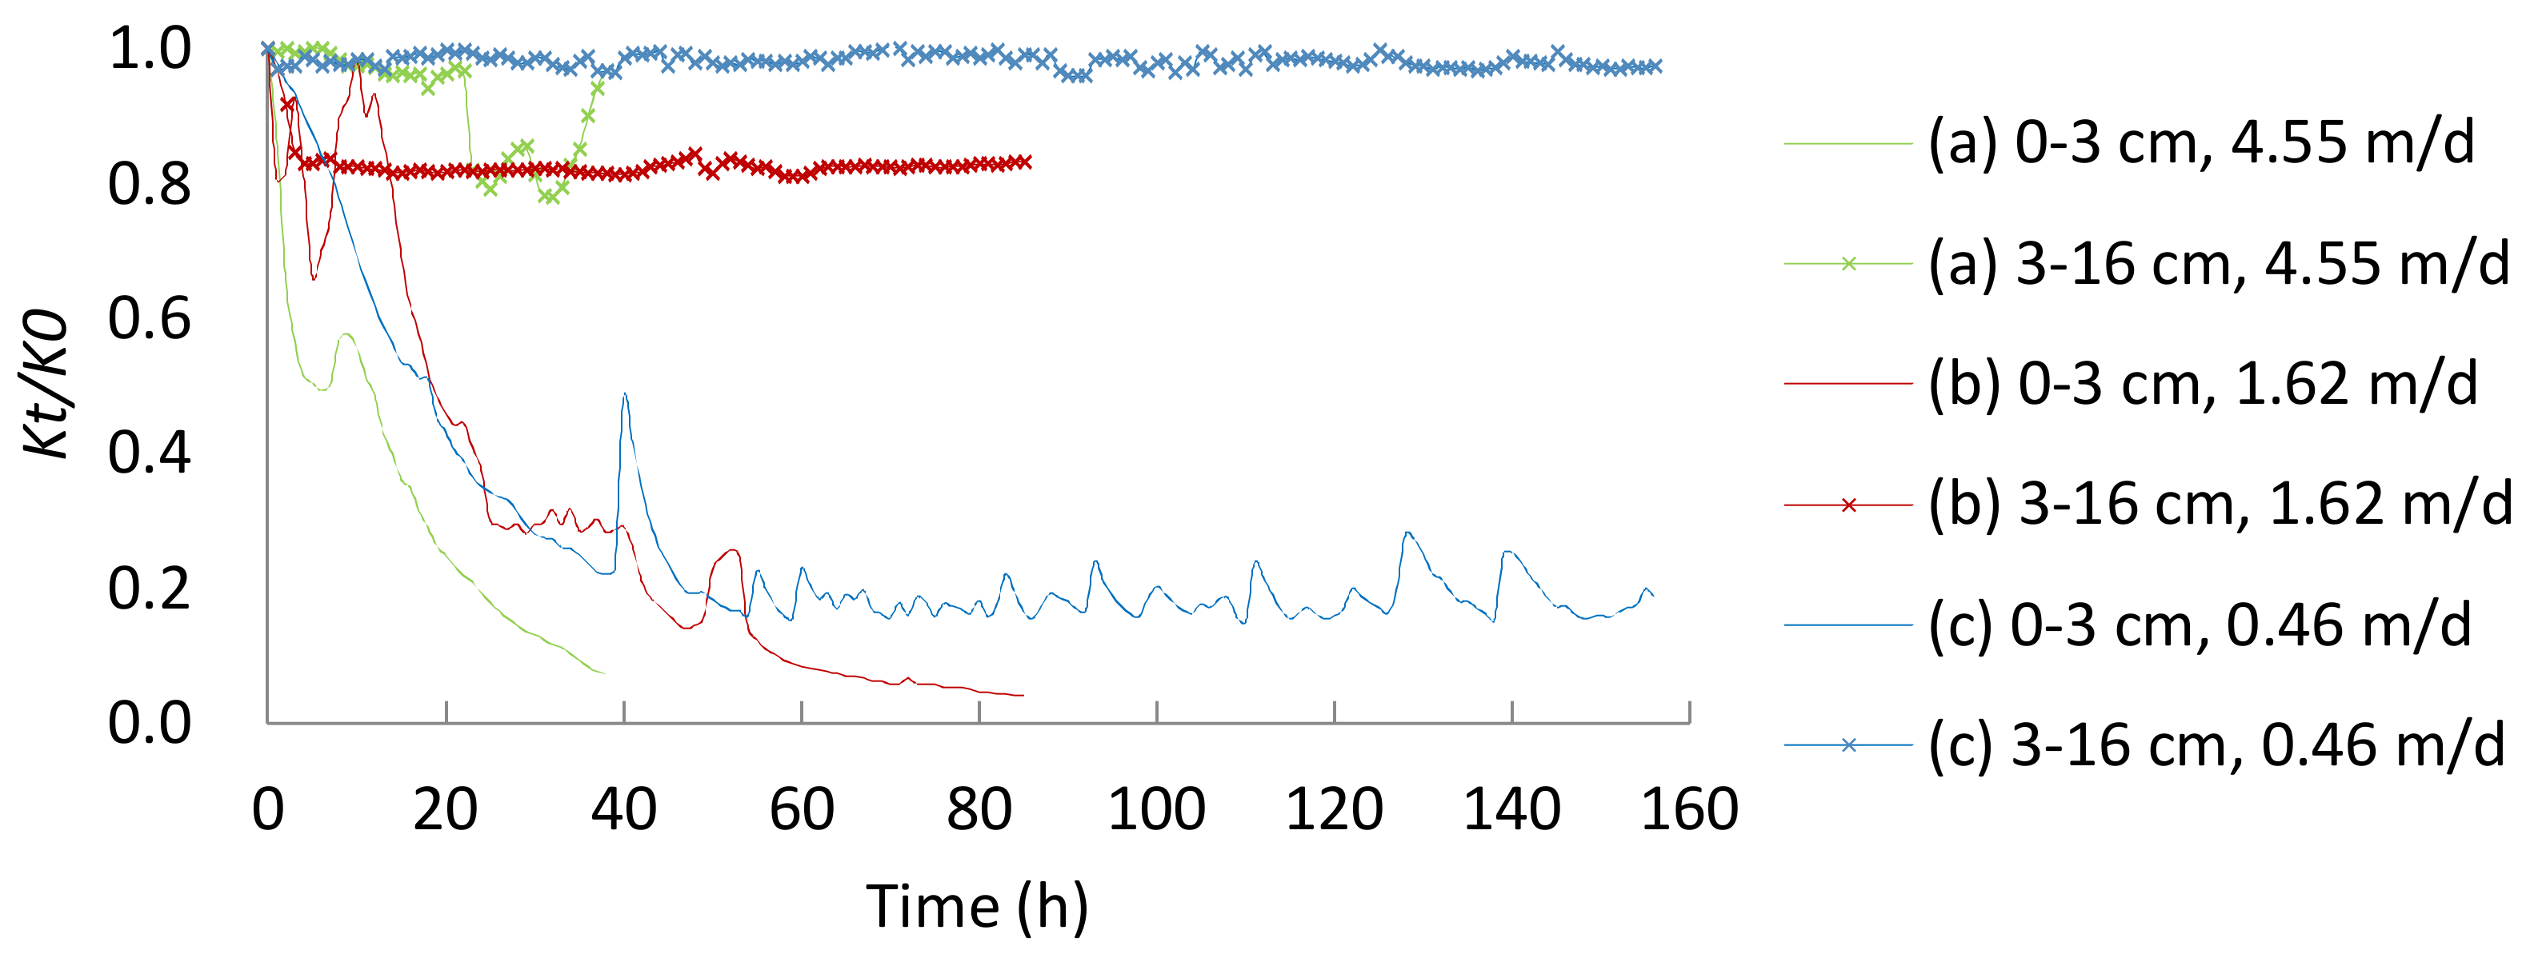
Importantly, K over the whole column is only a function of time, whereas real K is a function of time and depth [15]. To compare hydraulic conductivity levels at different column locations, we considered the change of hydraulic conductivity between the column inlet (0–3 cm) and the remaining part of the column (3–16 cm), as shown in Figure 3.
Permeability decrease for the column inlet was similar to the whole column changes (compare Figure 2 and Figure 3), hence hydraulic conductivity changes mostly occurred in the inlet. The large hydraulic conductivity reduction in the inlet section (Figure 3) shows that this part of column had become clogged, which is consistent with the conclusions of Faber et al. (2016) and Tian et al. (2016) for suspended solid particle clogging in porous media [15,23]. Hydraulic conductivity in the inlet section decreased most rapidly for VD = 4.55 m/d (K reduced by 90% after 34 h). The reduction trends for VD = 1.62 and 0.46 m/d were similar for up to 50 h, with K reduced by ~80% from their initial value. Subsequently, VD = 1.62 m/d continued to decrease, reaching a 90% reduction after 57 h, whereas VD = 0.46 stabilized around at an 80% reduction.
In the remaining part of column (3–6 cm), the change of hydraulic conductivity was slower and limited to a much smaller range. The lower flow velocity (VD = 0.46m/d) shows very little change, whereas VD = 1.62 m/d decreased by ~16% over the first 3 h, then stabilized at an ~18% reduction. The highest flow velocity (VD = 4.55 m/d) was relatively unchanged to ~23 h, rapidly reduced by ~20% for ~15 h, and subsequently raised back to its initial value afterwards. The inlet section also shows a peak at 5–9 h, which suggests that the 3–16 cm section wave may be the result of clogging material from the inlet section moving into the 3–16 cm section, and then passing through to the outlet.
3.2. Mass Deposition
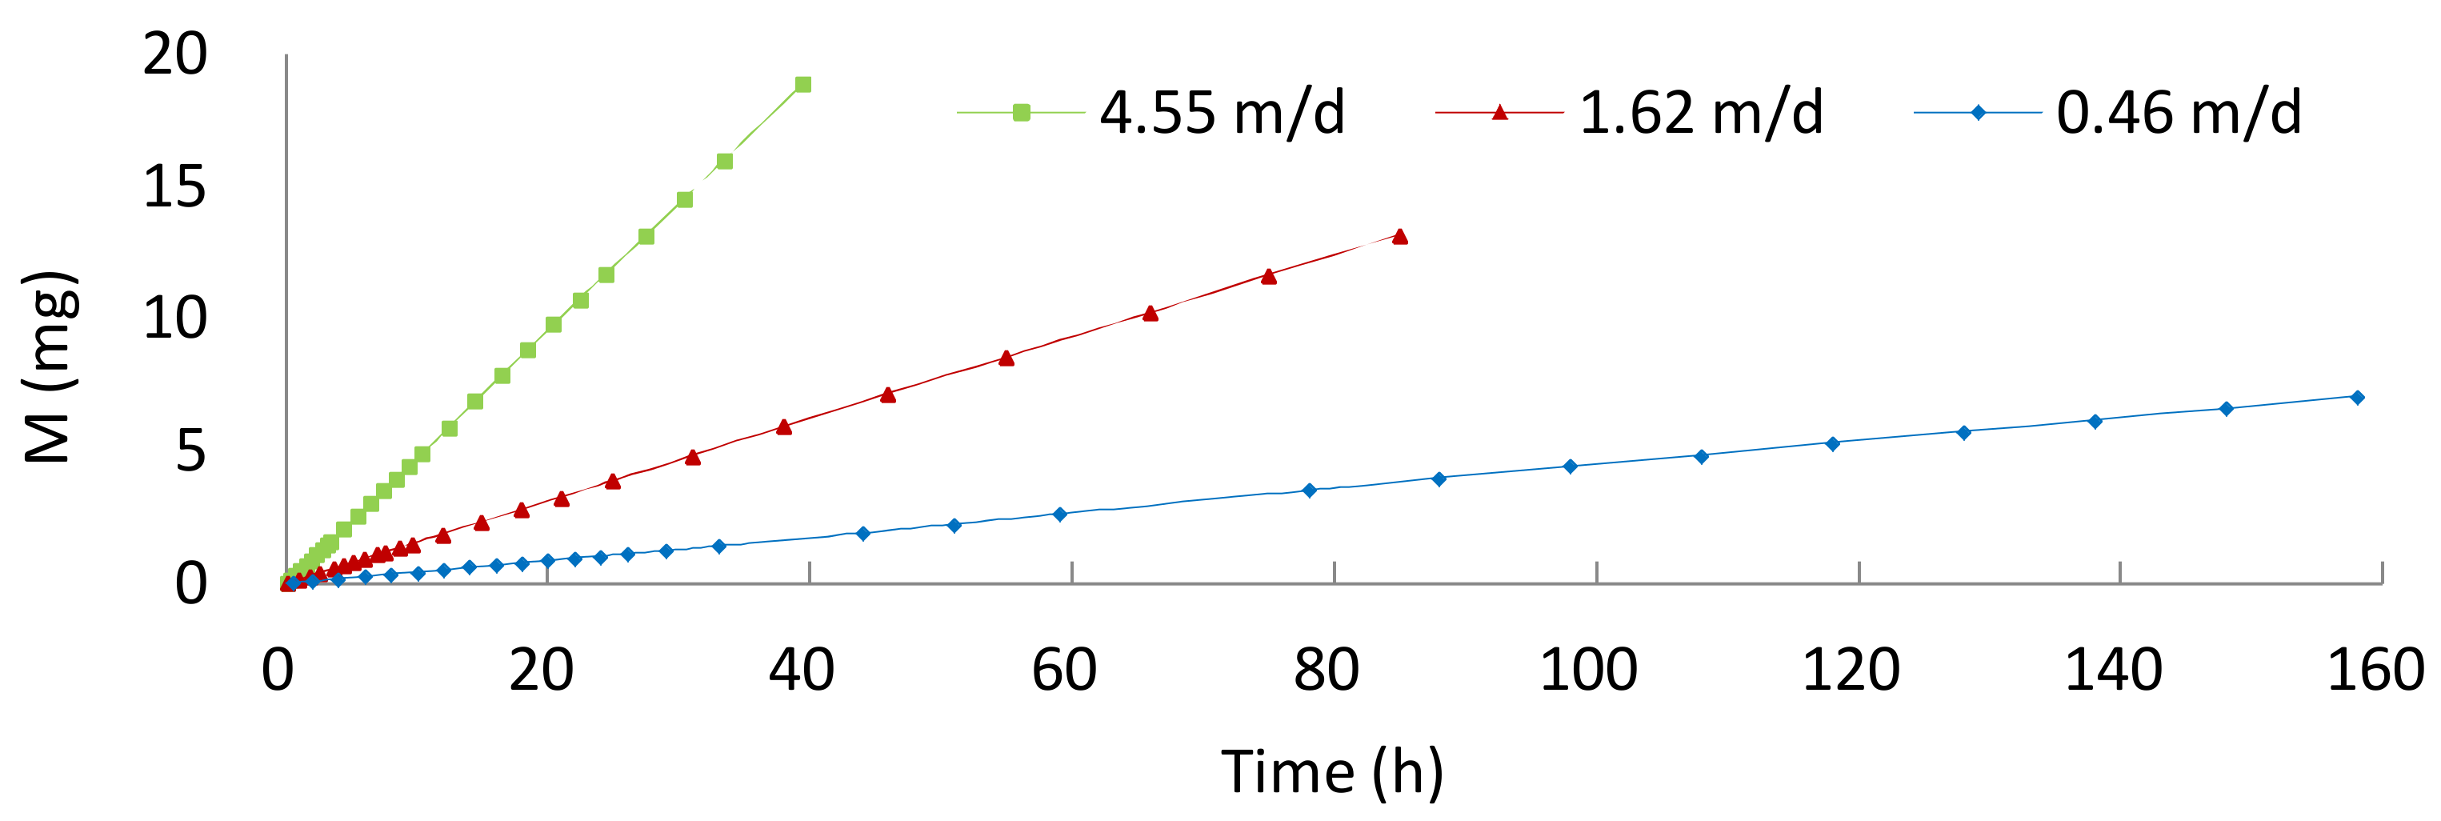
The mass retained in the column, M(t), was estimated from the difference between inlet and outlet concentrations,
where is the time the measurements; N is the total number of measurements; and are the initial and measurements Fe(III) volume concentration. The result was as shown in Figure 4.
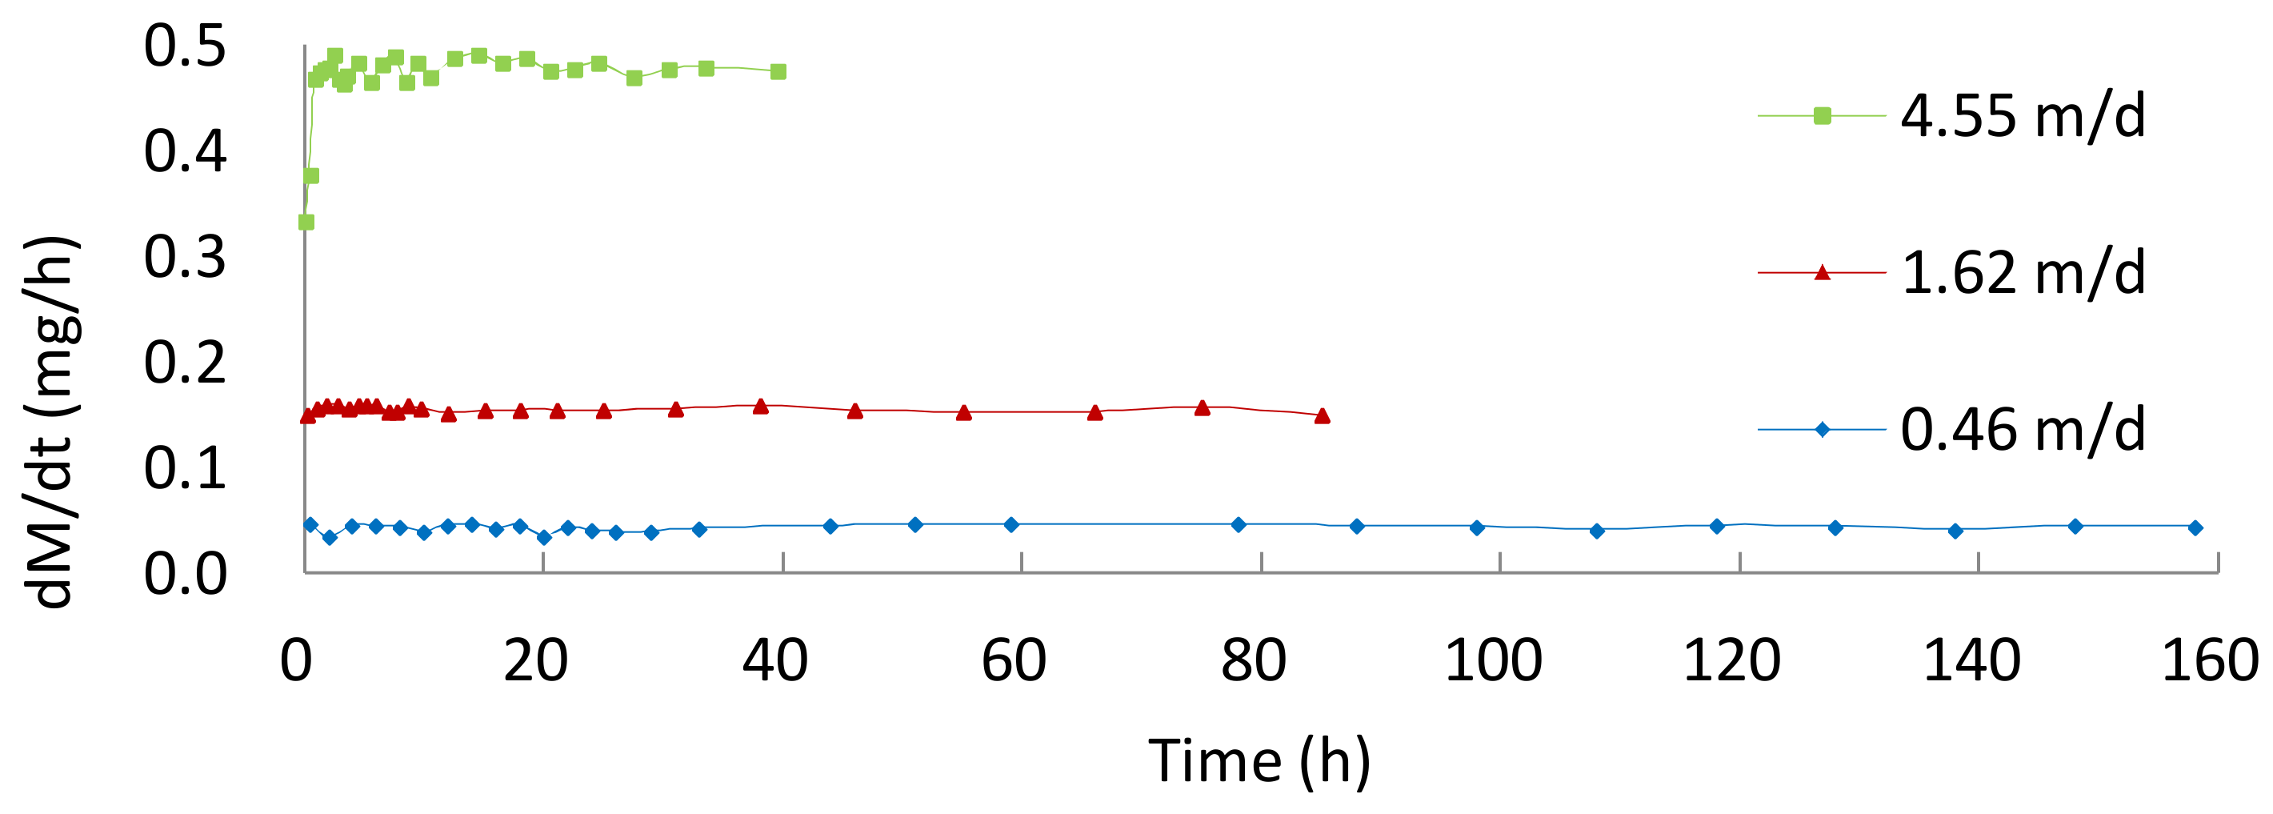
Fe(III) deposition increased with time for all flow velocities in a more or less linear fashion, and flow velocity was strongly positively-correlated with deposition rate, as shown in Figure 5. The mass deposition rate, dM/dt, stabilized at 0.48, 0.15 and 0.05 mg/h for VD = 4.55, 1.62 and 0.46 m/d, respectively, although there was a slight downward trend for the VD = 4.55 m/d case, which decreased by 0.006 mg/h after 24 h.
Eliassen demonstrated that deposition rate becomes zero at saturation, i.e., no further suspended materials are deposited in the porous matrix [24]. However, this experiment showed that none of the flow rates reached saturation of deposition, because a constant concentration of Fe(III) was continuously pumped into columns under the experimental condition of constant flow rate.
In conducted experiments, the fact that the mass deposition rate did not drop to zero may be due to the volume concentration of Fe(III) measured at the outlet of the column. The deposition is not only a function of time, but also with spatial position of the column.
The mass deposit distribution was also obtained by dismantling the column at the conclusion of the experiment; it is expressed as mass ratio:
where MT is the total Fe(III) mass in the column at the end of the experiment, and MSi is the Fe(III) mass in section Si.
Thus, we took two measurements of total Fe(III) mass: MT, obtained by dismantling the column, and MC, calculated from inlet and outlet Fe(III) concentrations. Generally, the MT < MC, due to mass loss on the tube wall (in the current study the relative error, σ, was less than 5%). We also calculated MA, the total input Fe(III) over the whole experiment. Table 1 and Figure 6 show the various mass measurements.
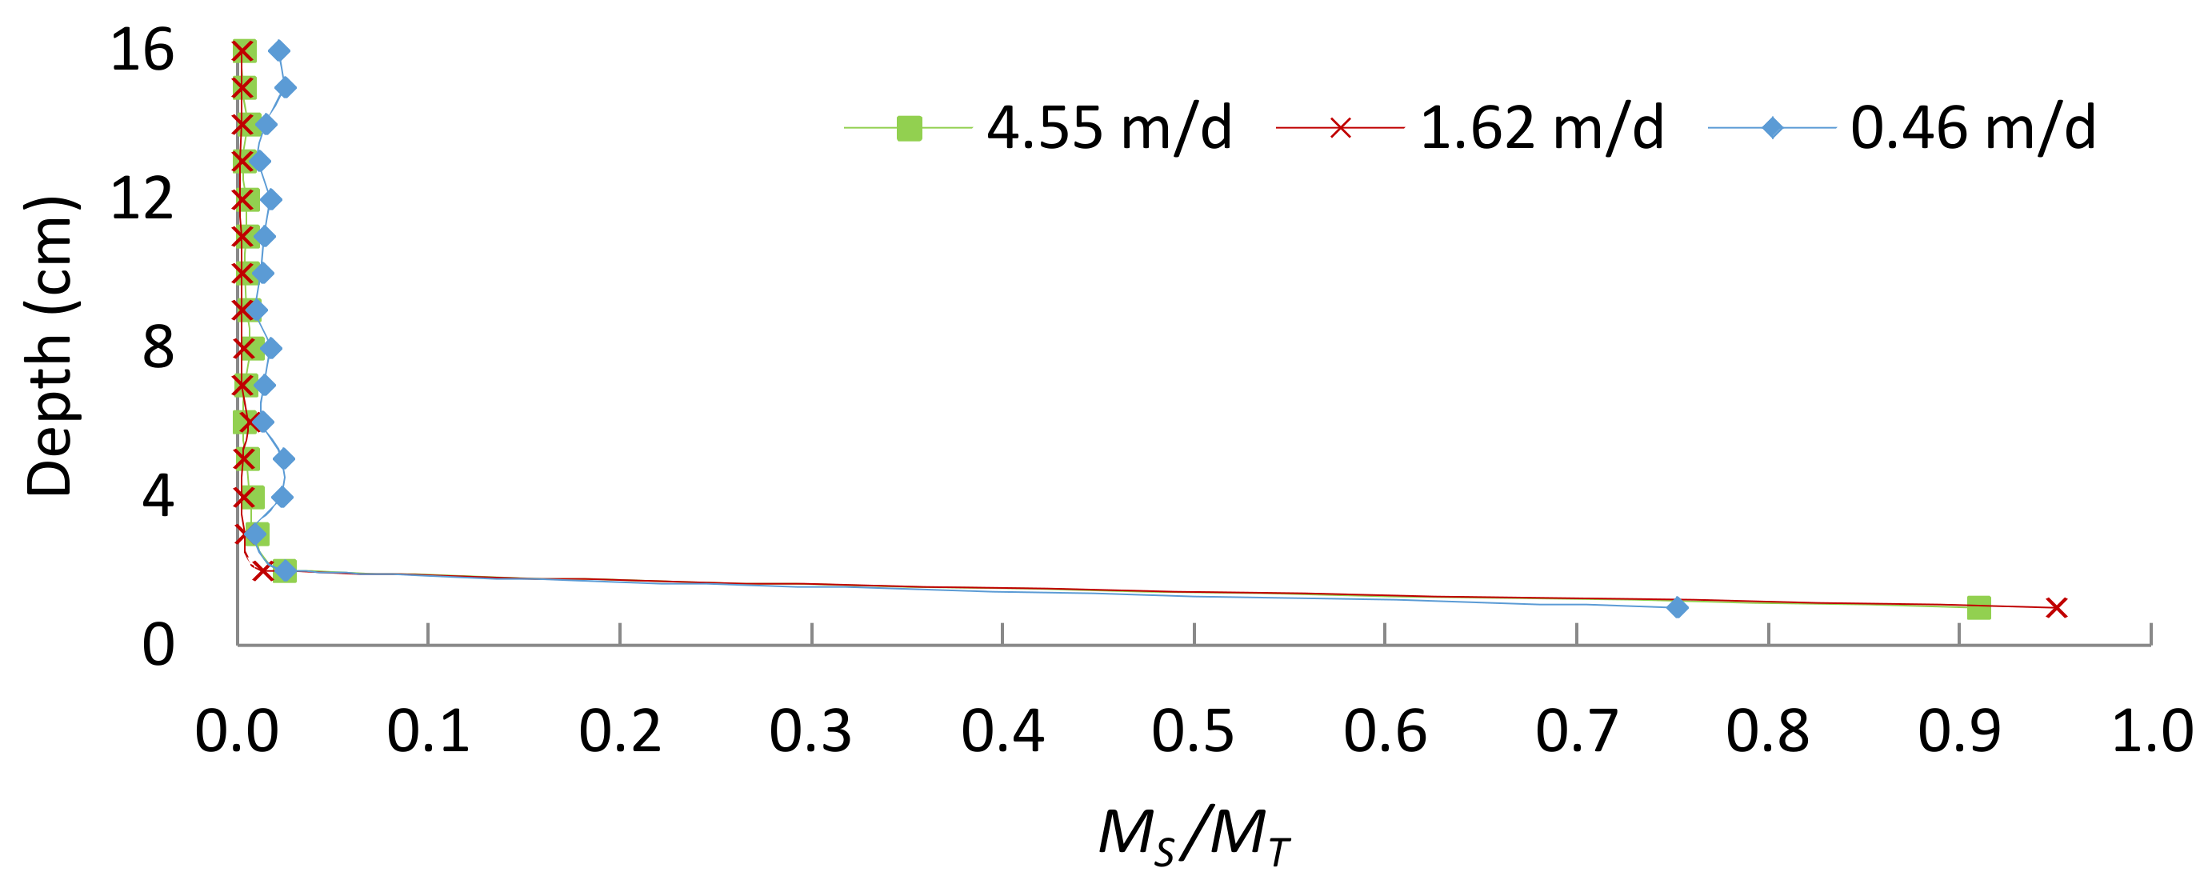
Most Fe(III) was deposited within 0–1 cm, i.e., the inlet section. For VD = 4.55 and 1.62 m/d, over 90% Fe(III) deposition occurred in that section, whereas VD = 4.55 has 75% Fe(III) deposition within that section. For suspended particles, retention rates are higher at a low flow velocity because the hydrodynamic forces exerted by the flow are insufficient to overcome attractive forces, and subsequently transport the particles [25]. The current study shows Fe(III) retention for lower VD was less than for higher VD, which is the opposite of suspended particle retention; the main reason for this is that high velocity promotes Fe(III) flocculation.
3.3. Fe(III) Clogging Mechanism
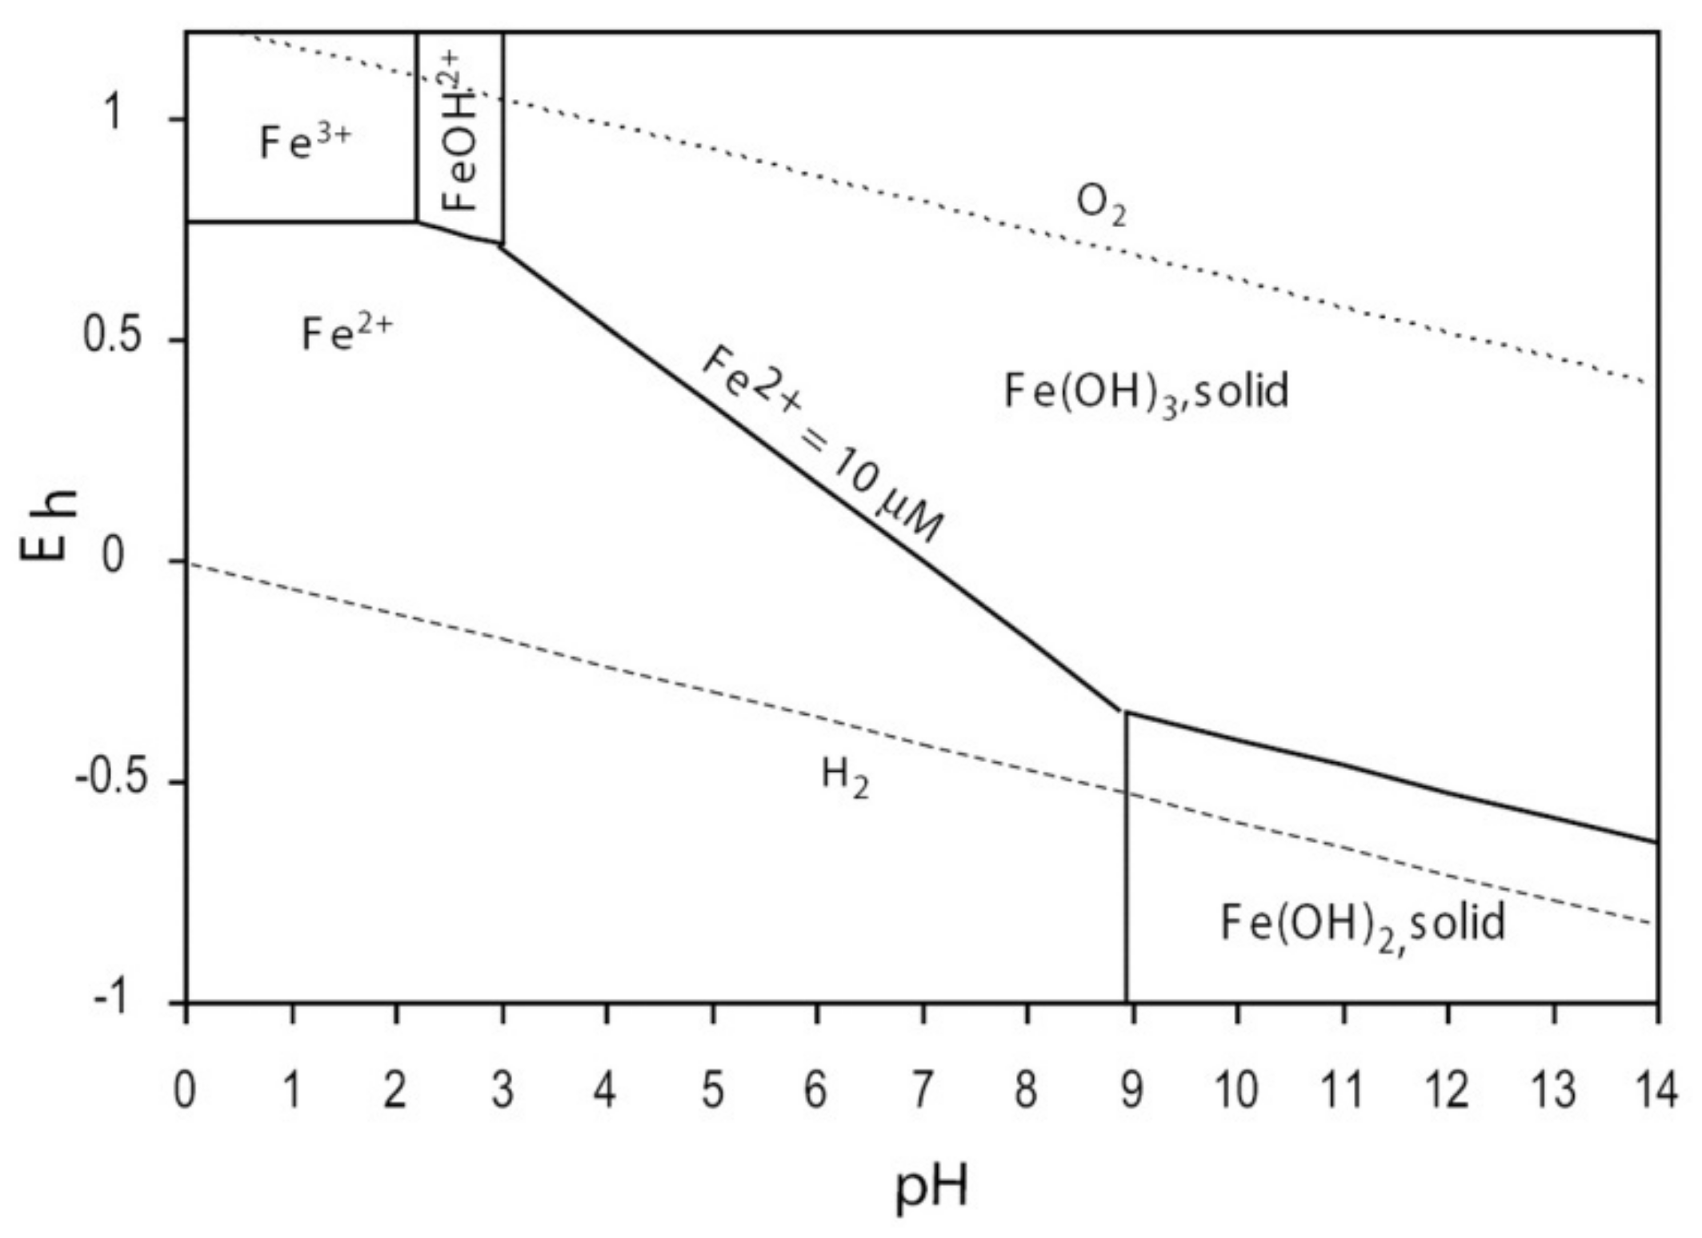
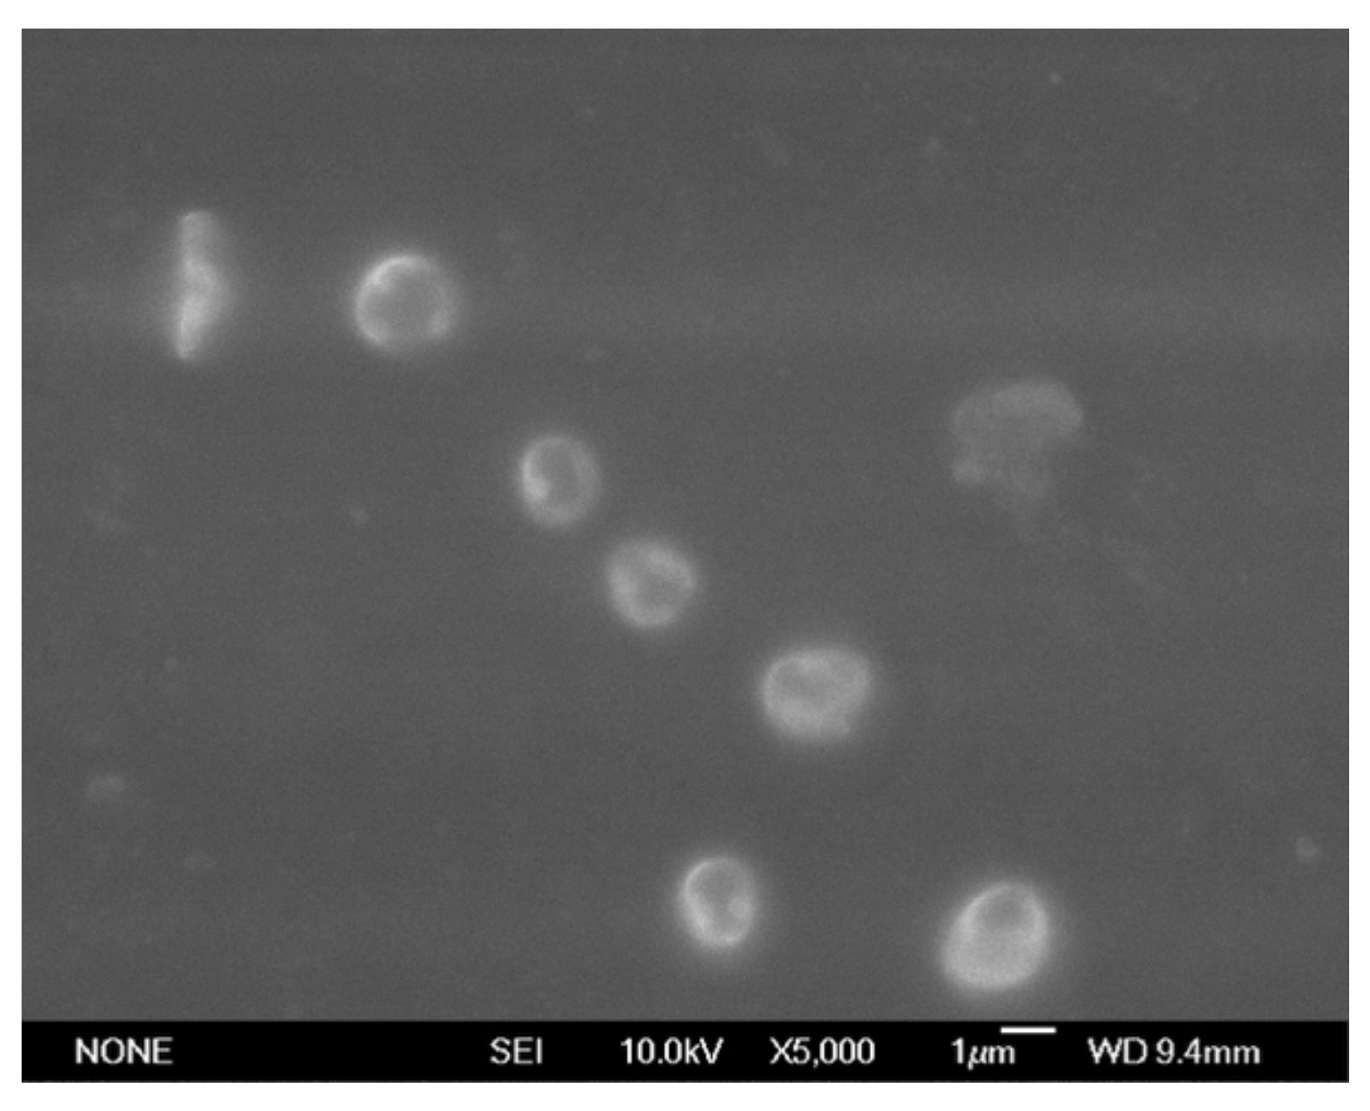
The experiments were conducted with recharge water of pH 7 and Eh = 0.4 V. The Pourbaix diagram (Figure 7) [26] shows that Fe(III) is as precipitated as Fe(OH)3 under the experimental condition. Therefore, we used Fe(OH)3 to approximate Fe(III) in liquid. Furthermore, there was virtually no influence of atmospheric oxygen during the rest of the experiment process. Figure 8 shows that Fe(III) in the recharge water manifested as colloidal particles, with approximate diameter = 1 μm.
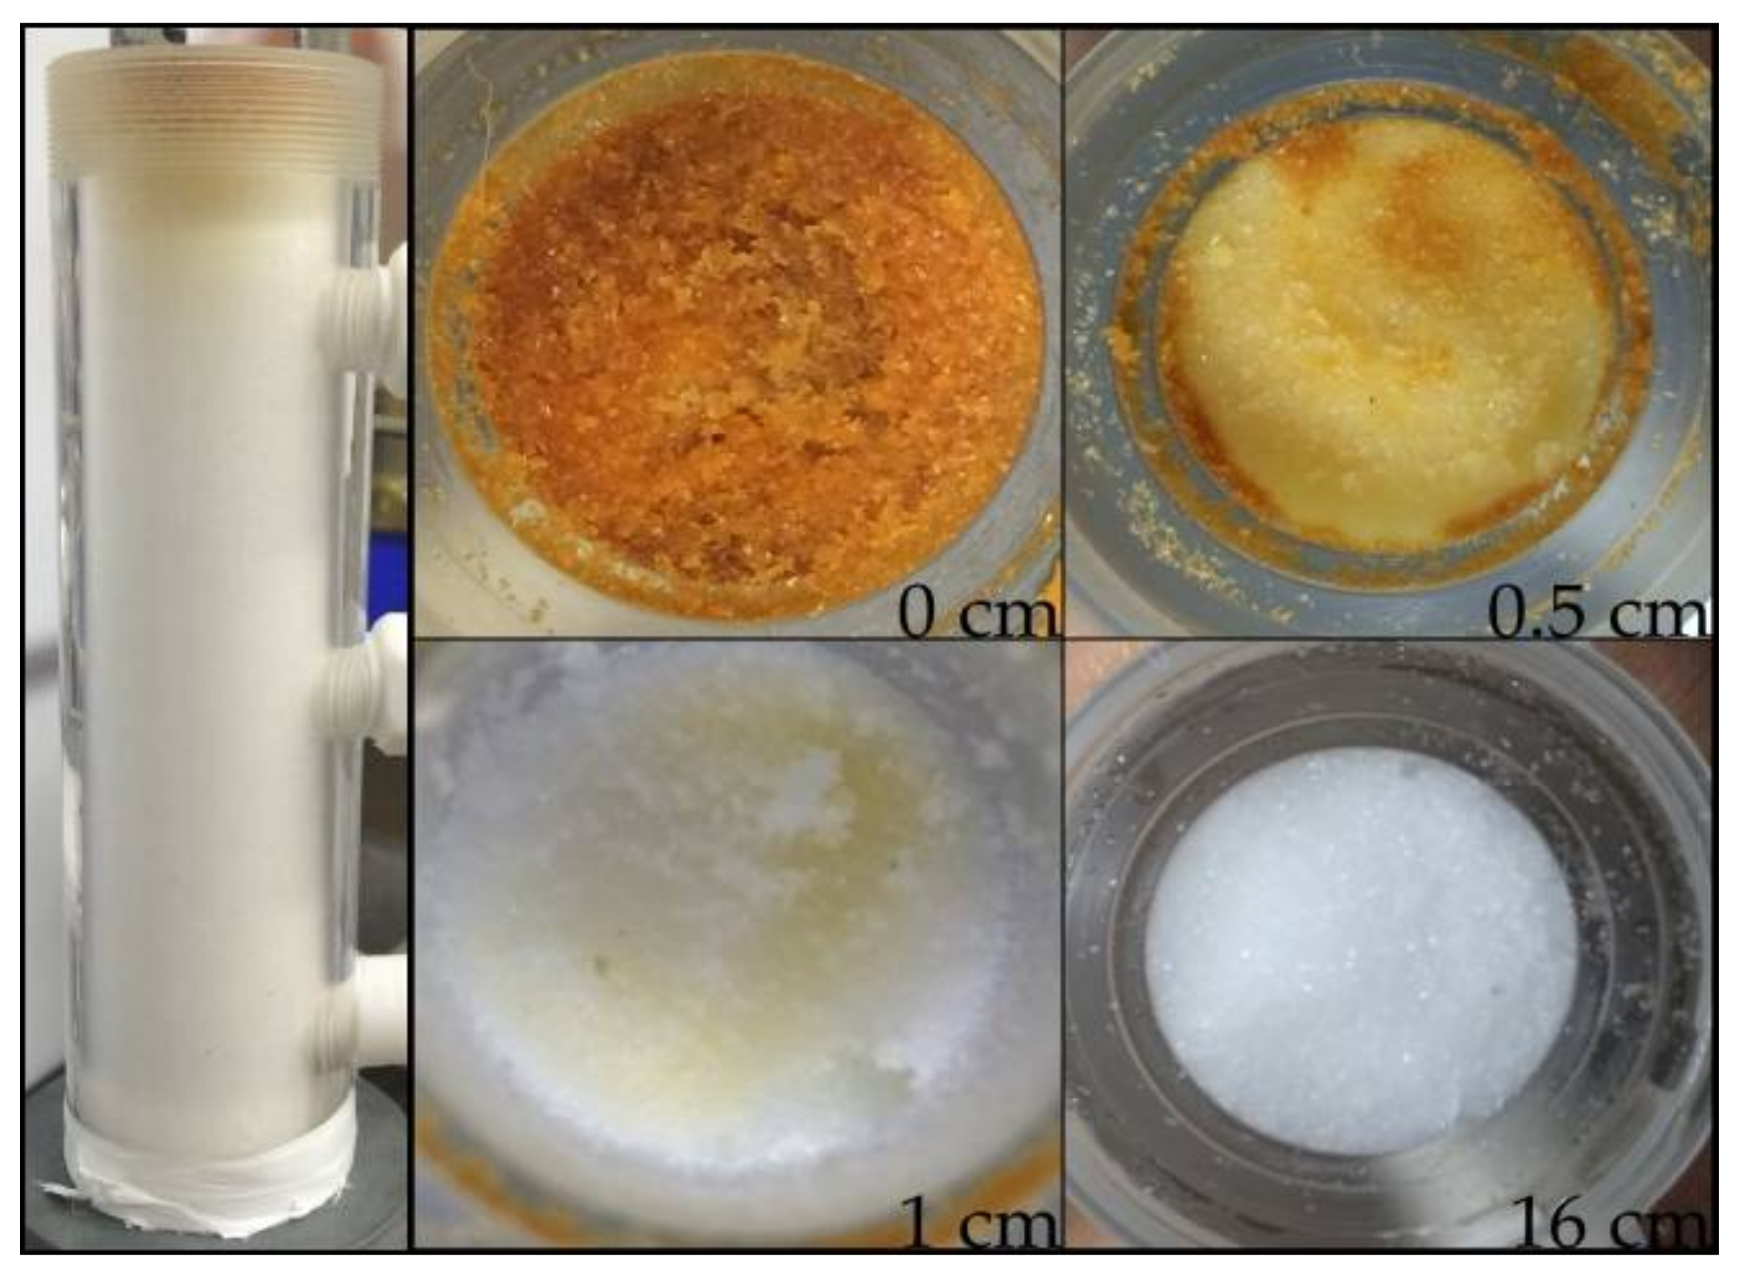
Figure 9 shows that most Fe(III) was intercepted between 0–0.5 cm from the column inlet, with >75% Fe(III) deposition within 0–1 cm. Since most Fe(III) was intercepted on the surface of the inlet port of the column, the main mechanism by which the porous matrix to intercepted Fe(III) colloidal particles was surface filtration. Fe(OH)3 particles may also also be deposited on previously retained particles present on the surface of the porous matrix.
Thus, the Fe(OH)3 particles trend to find and occupy all mechanical and physicochemical retention sites until the porous medium becomes clogged [17]. Therefore, the surface of the column’s hydraulic conductivity reduced rapidly, and underwent significant clogging in a short period of time. The porous matrix retention-capacity is limited by available sites for mechanical filtration; hence after a rapid reduction, hydraulic conductivity would enter a stable period and clogging would reach saturation.
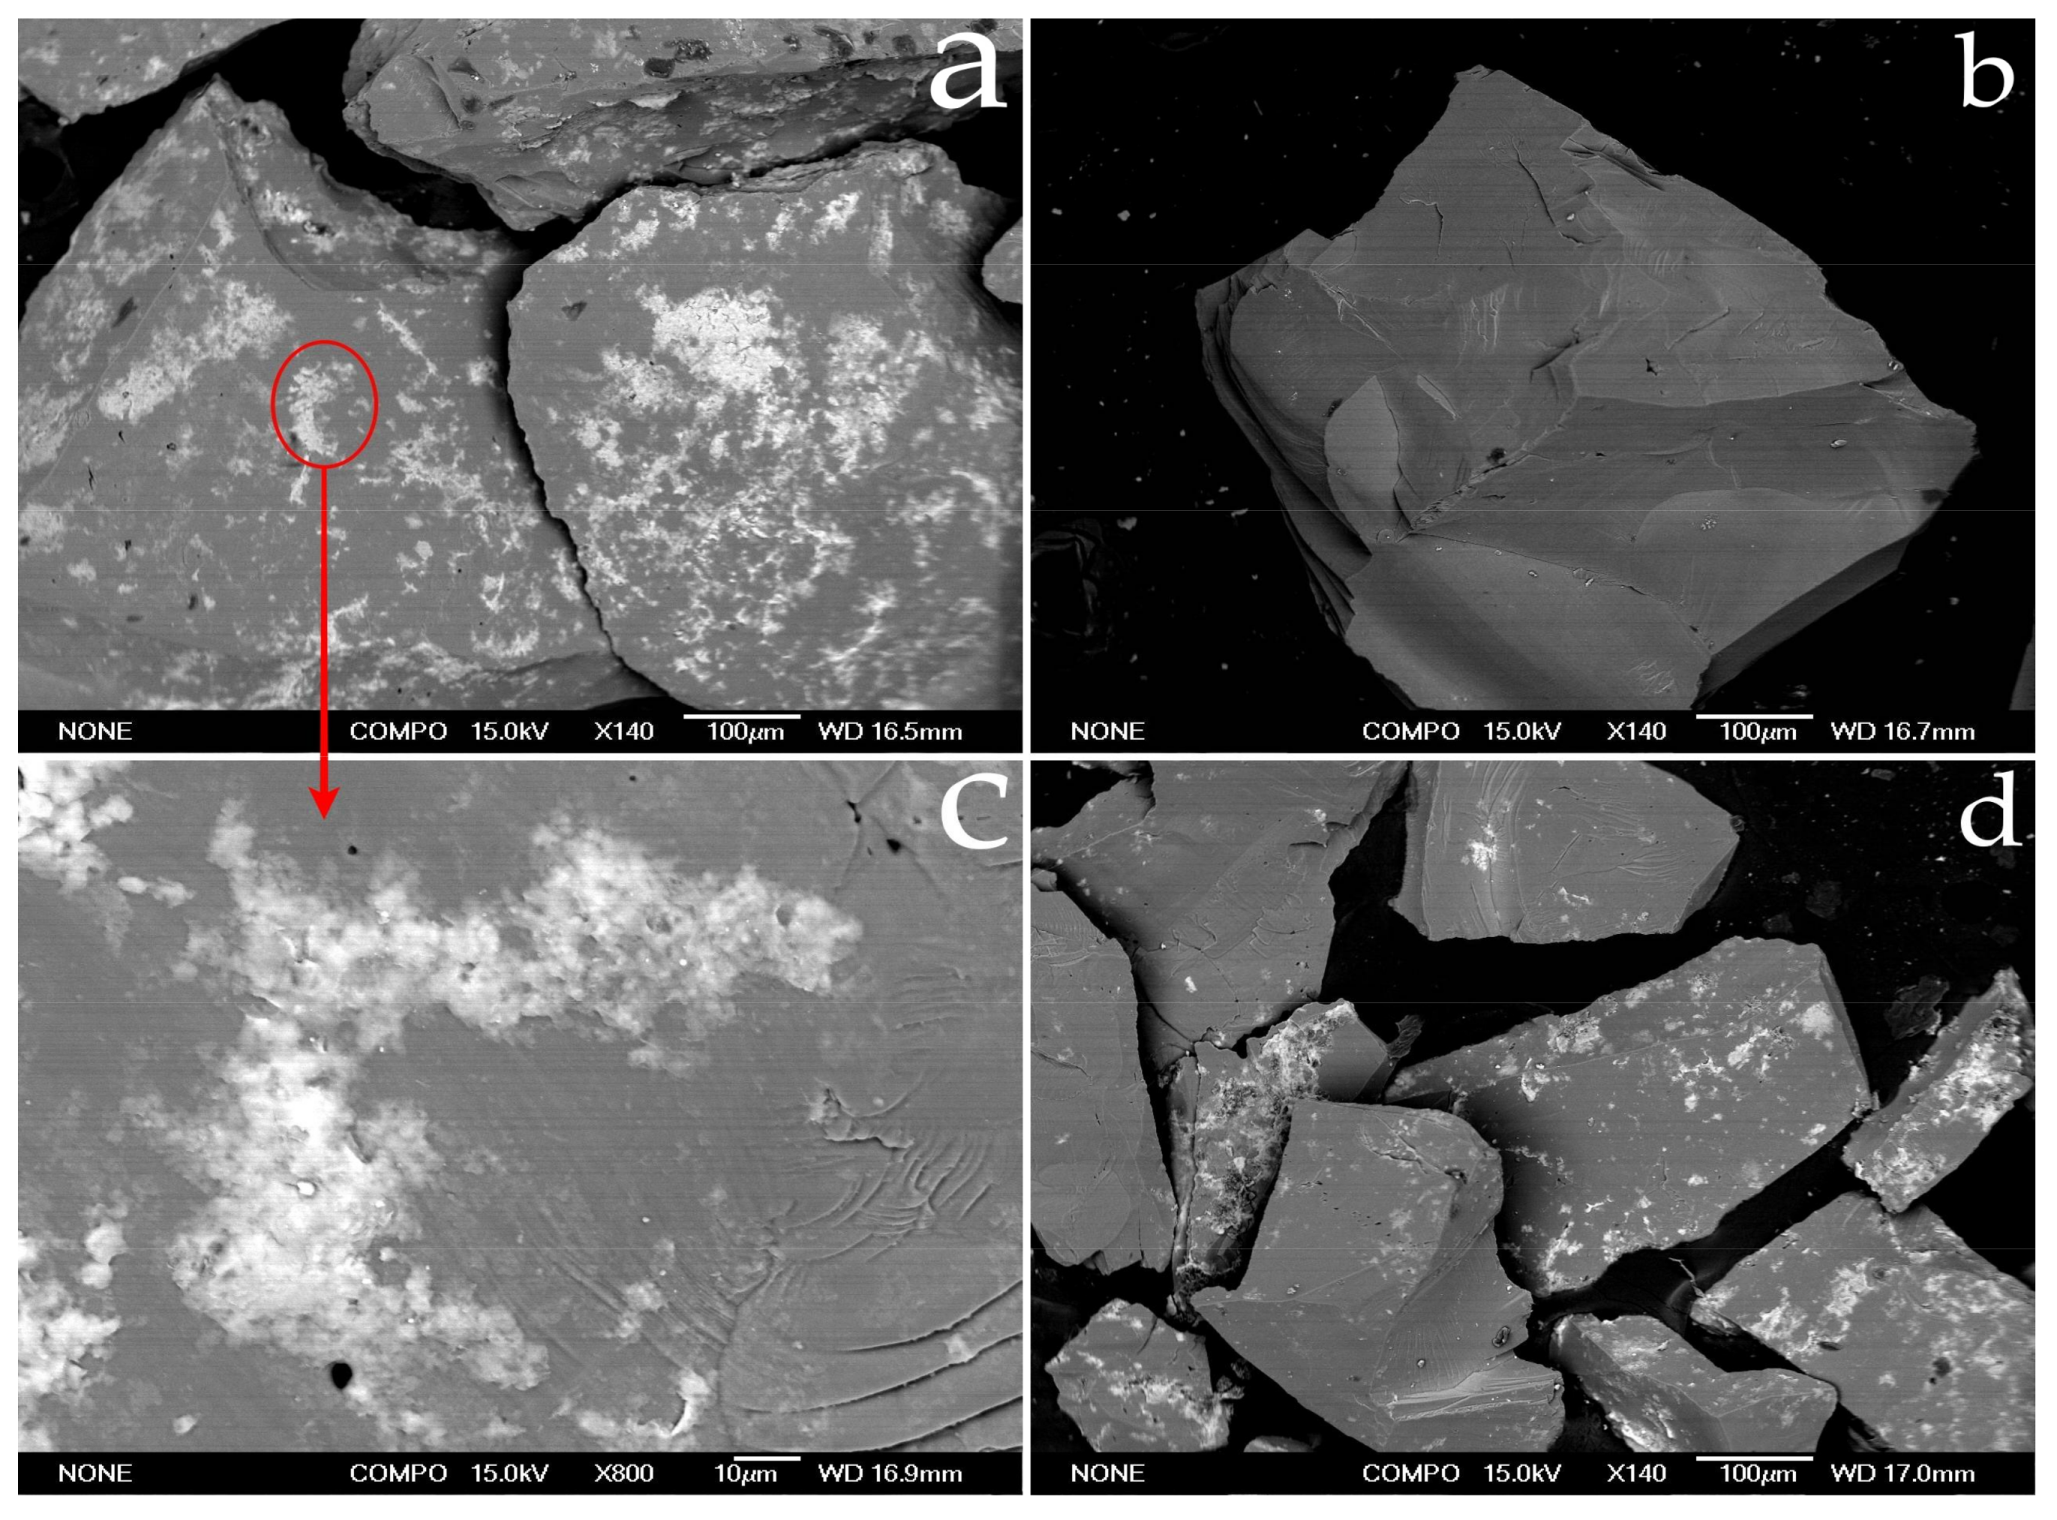
Figure 10 shows scanning electron micrographs (SEM) photographs of the fine quartz sand at the column inlet and outlet after the experiment. Figure 10a shows the overall sand morphology. The sand is heavily coated with Fe(OH)3, shaped like (Figure 10c). Outlet sand (Figure 10b) has significantly less surface coating than inlet sand. The coated area for low VD (Figure 10d) was significantly smaller than high VD. Since Fe(III) in the recharge water was in the form of an Fe(OH)3 colloid, it underwent orthokinetic flocculation in the experiment, influenced by three dynamical factors: Brownian motion, flow shear, and differential settling. Flow shear causes orthokinetic flocculation, with colloidal particle size approximately 1μm. A dynamic equation described orthokinetic flocculation of discrete particles [27],
where, j are size grades of the flocculent; and are numerical concentrations of i, j, respectively; and are radii of i, j grade flocs respectively; and is the velocity gradient in a laminar flow.
The root mean square (RMS) of the velocity gradient [28],
where is the dissipation level of flow due to viscous shear; μ is dynamic viscosity.
Since G is velocity gradient, the rate of change in the total concentration of particles with time due to orthokinetic flocculation would increase with the effect of different laboratory devices on particle size distribution over a wide range of shear (G = 4–102 s−1), and showed that mean particle diameter increased with G for low shear rates (G < 20 s−1) [28].
In the current study, high flow velocity created good conditions for Fe(III) colloidal particles to collide with each other, increasing the number and diameter of Fe(OH)3 particles. Therefore, physicochemical mechanisms, and particularly orthokinetic flocculation, significant influences flow velocity.
4. Conclusions
This paper presents experimental research investigating Fe(III) clogging processes for different flow velocities, and related effect on hydraulic conductivity. The study also highlighted the interaction of flow velocity effects on deposition and clogging dynamics. Some important conclusions are as follows:
- (1)
- The form of Fe(III) in recharge water was Fe(OH)3 particles, which occupied the pore spaces of the inlet surface, leading to porous clogging. The main mechanism for the porous matrix intercept of Fe(OH)3 colloidal particles was surface filtration.
- (2)
- Deposition rates and porous media clogging depend on flow velocity. Increased flow velocity caused increased deposition and reduced hydraulic conductivity, i.e., increased clogging.
- (3)
- Physicochemical mechanisms, particularly orthokinetic flocculation, had severely affected by flow velocity. Higher velocities could promote Fe(OH)3 particle flocculent precipitation, increasing Fe(III) deposition mass, and hence decreasing hydraulic conductivity.
Acknowledgments
This work was supported by the National Natural Science Foundation of China (Grant Nos. 41472213, 41602077).
Author Contributions
All authors are participants in the research projects described in this paper. The experiments were conducted, and this manuscript prepared, primarily by Hexuan Zhang and Xinqiang Du, with revisions by Xueyan Ye and Ying Lu.
Conflicts of Interest
The authors declare no conflict of interest.
References
- Rinckpfeiffer, S.; Ragusa, S.; Sztajnbok, P.; Vandevelde, T. Interrelationships between biological, chemical, and physical processes as an analog to clogging in aquifer storage and recovery (ASR) wells. Water Res. 2000, 34, 2110–2118. [Google Scholar] [CrossRef]
- Stephens, D.B.; Miller, M.; Moore, S.J.; Umstot, T.; Salvato, D.J. Decentralized Groundwater Recharge Systems Using Roofwater and Storm-water Runoff. J. Am. Water Resour. Assoc. 2012, 48, 134–144. [Google Scholar] [CrossRef]
- Beganskas, S.; Fisher, A.T. Coupling distributed storm-water collection and managed aquifer recharge: Field application and implications. J. Environ. Manag. 2017, 200, 366–379. [Google Scholar] [CrossRef] [PubMed]
- Wang, Z.; Du, X.; Yang, Y.; Ye, X. Surface clogging process modeling of suspended solids during urban storm-water aquifer recharge. J. Environ. Sci. 2012, 24, 1418–1424. [Google Scholar] [CrossRef]
- Martin, R. (Ed.) Clogging Issues Associated with Managed Aquifer Recharge Methods; IAH Commission on Managing Aquifer Recharge: Adelaide, Australia, 2013. [Google Scholar]
- Dillon, P.J.; Hickinbotham, M.R.; Pavelic, P. Review of International Experience in Injecting Water into Aquifers for Storage and Reuse; National Conference Publication (Institution of Engineers, Australia): Barton, Australia, 1994; pp. 13–14, 16–19. [Google Scholar]
- Mcdowell-Boyer, L.M.; Hunt, J.R.; Nicholas, S. Particle Transport through Porous Media. Water Resour. Res. 1986, 22, 1901–1921. [Google Scholar] [CrossRef]
- Houben, G.J. Iron oxide incrustations in wells. Part 1: Genesis, mineralogy and geochemistry. Appl. Geochem. 2003, 18, 927–939. [Google Scholar] [CrossRef]
- Bugan, R.D.H.; Jovanovic, N.; Israel, S.; Tredoux, G.; Genthe, B.; Steyn, M.; Allpass, D.; Bishop, R.; Marinus, V. Four decades of water recycling in Atlantis (Western Cape, South Africa): Past, present and future. Water SA 2016, 42, 577–594. [Google Scholar] [CrossRef]
- Houben, G.J.; Weihe, U. Spatial distribution of incrustations around a water well after 38 years of use. Groundwater 2010, 48, 53–58. [Google Scholar] [CrossRef]
- Houben, G.J. The influence of well hydraulics on the spatial distribution of well incrustations. Groundwater 2006, 44, 668–675. [Google Scholar] [CrossRef] [PubMed]
- Tredoux, G.; Genthe, B.; Steyn, M.; Engelbrecht, J.F.P.; Wilsenach, J.; Jovanovic, N. An assessment of the Atlantis artificial recharge water supply scheme (Western Cape, South Africa). WIT Trans. Ecol. Environ. 2009, 127, 403–413. [Google Scholar]
- Voudouris, K. Artificial Recharge via Boreholes Using Treated Wastewater: Possibilities and Prospects. Water 2011, 3, 964–975. [Google Scholar] [CrossRef]
- Li, L.; Steefel, C.I.; Kowalsky, M.B.; Englert, A.; Hubbard, S.S. Effects of physical and geochemical heterogeneities on mineral transformation and biomass accumulation during biostimulation experiments at Rifle, Colorado. J. Contam. Hydrol. 2010, 112, 45–63. [Google Scholar] [CrossRef] [PubMed]
- Faber, S.; Al-Maktoumi, A.; Kacimov, A.; Al-Busaidi, H.; Al-Ismaily, S.; Al-Belushi, M. Migration and deposition of fine particles in a porous filter and alluvial deposit: Laboratory experiments. Arabian J. Geosci. 2016, 9, 293. [Google Scholar] [CrossRef]
- Mays, D.C.; Hunt, J.R. Hydrodynamic Aspects of Particle Clogging in Porous Media. Environ. Sci. Technol. 2005, 39, 577–584. [Google Scholar] [CrossRef] [PubMed]
- Mesticou, Z.; Kacem, M.; Dubujet, P. Coupling Effects of Flow Velocity and Ionic Strength on the Clogging of a Saturated Porous Medium. Transp. Porous Media 2016, 112, 265–282. [Google Scholar] [CrossRef]
- Thompson, A.R.; Stotler, R.L.; Macpherson, G.L.; Liu, G. Laboratory Study of Low-Flow Rates on Clogging Processes for Application to Small-Diameter Injection Wells. Water Resour. Manag. 2015, 29, 5171–5184. [Google Scholar] [CrossRef]
- Hutchinson, A.S. Estimation and Quantification of Injection Well Clogging, Tucson, Arizona. Master’s Thesis, University of Arizona, Tucson, AZ, USA, 1993. [Google Scholar]
- Du, X.; Wang, Z.; Ye, X. Potential Clogging and Dissolution Effects During Artificial Recharge of Groundwater Using Potable Water. Water Resour. Manag. 2013, 27, 3573–3583. [Google Scholar] [CrossRef]
- Kandra, H.; Mccarthy, D.; Deletic, A. Assessment of the Impact of Stormwater Characteristics on Clogging in Stormwater Filters. Water Resour. Manag. 2014, 29, 1031–1048. [Google Scholar] [CrossRef]
- Pedretti, D.; Barahona-Palomo, M.; Bolster, D.; Fernàndez-Garcia, D.; Sanchez-Vila, X.; Tartakovsky, D.M. Probabilistic analysis of maintenance and operation of artificial recharge ponds. Adv. Water Resour. 2012, 36, 23–35. [Google Scholar] [CrossRef]
- Nan, T.; Shao, J.; Cui, Y. Column test-based features analysis of clogging in artificial recharge of groundwater in Beijing. J. Groundw. Sci. Eng. 2016, 4, 88–95. [Google Scholar]
- Eliassen, R. An Experimental and Theoretical Investigation of the Clogging of a Rapid Sand Filter. Ph.D. Thesis, Massachusetts Institute of Technology, Cambridge, MA, USA, 1935. [Google Scholar]
- Bennacer, L.; Ahfir, N.D.; Alem, A.; Wang, H. Coupled Effects of Ionic Strength, Particle Size, and Flow Velocity on Transport and Deposition of Suspended Particles in Saturated Porous Media. Transp. Porous Media 2017, 118, 251–269. [Google Scholar] [CrossRef]
- Kappler, A.; Straub, K.L. Geomicrobiological cycling of iron. Rev. Mineral. Geochem. 2005, 59, 85–108. [Google Scholar] [CrossRef]
- Zhu, Z. Theory on Orthokinetic Flocculation of Cohesive Sediment: A Review. J. Geosci. Environ. Prot. 2014, 2, 13–23. [Google Scholar] [CrossRef]
- Serra, T.; Colomer, J.; Logan, B.E. Efficiency of different shear devices on flocculation. Water Res. 2008, 42, 1113–1121. [Google Scholar] [CrossRef] [PubMed]
Figure 1.
Experimental column set up.

Figure 2.
Permeability in the porous medium for three flow velocities.

Figure 3.
Permeability at different locations for flow velocities (VD).

Figure 4.
Total deposited mass in the column.

Figure 5.
Mass deposition rate (slope of the curves from Figure 4).
Figure 5.
Mass deposition rate (slope of the curves from Figure 4).

Figure 6.
Deposition distribution along the column.

Figure 7.
Pourbaix diagram for Fe(II), Fe(III), O2 and H2 calculated with Fe2+ concentration of 10 μM.
Figure 7.
Pourbaix diagram for Fe(II), Fe(III), O2 and H2 calculated with Fe2+ concentration of 10 μM.

Figure 8.
Scanning electron micrographs of iron oxide particles in the recharge water.

Figure 9.
Porous matrix iron oxide particles interception for different sections.

Figure 10.
Scanning electron micrographs of the porous matrix from column inlet and outlet sections after the experiment: (a) inlet, VD = 1.62 m/d; (b) outlet, VD = 1.62 m/d; (c) close view of the indicated region in (a); and (d) inlet, VD = 0.46 m/d, the white material covered stand is iron oxide.
Figure 10.
Scanning electron micrographs of the porous matrix from column inlet and outlet sections after the experiment: (a) inlet, VD = 1.62 m/d; (b) outlet, VD = 1.62 m/d; (c) close view of the indicated region in (a); and (d) inlet, VD = 0.46 m/d, the white material covered stand is iron oxide.


Table 1.
Mass ratios in the column.
| Flow Velocity | 4.55 m/d | 1.62 m/d | 0.46 m/d |
|---|---|---|---|
| MA(mg) | 19.54 | 13.77 | 7.67 |
| Mc (mg) | 18.86 | 13.17 | 7.07 |
| MT (mg) | 18.13 | 12.98 | 6.99 |
| σ | 0.04 | 0.01 | 0.01 |
| MT/MA | 0.93 | 0.94 | 0.91 |
| 0–1 cm VM | 0.91 | 0.95 | 0.75 |
| 1–16 cm VM | 0.09 | 0.05 | 0.25 |
© 2018 by the authors. Licensee MDPI, Basel, Switzerland. This article is an open access article distributed under the terms and conditions of the Creative Commons Attribution (CC BY) license (http://creativecommons.org/licenses/by/4.0/).
Share and Cite
MDPI and ACS Style
Du, X.; Zhang, H.; Ye, X.; Lu, Y. Flow Velocity Effects on Fe(III) Clogging during Managed Aquifer Recharge Using Urban Storm Water. Water 2018, 10, 358. https://doi.org/10.3390/w10040358
AMA Style
Du X, Zhang H, Ye X, Lu Y. Flow Velocity Effects on Fe(III) Clogging during Managed Aquifer Recharge Using Urban Storm Water. Water. 2018; 10(4):358. https://doi.org/10.3390/w10040358
Chicago/Turabian StyleDu, Xinqiang, Hexuan Zhang, Xueyan Ye, and Ying Lu. 2018. "Flow Velocity Effects on Fe(III) Clogging during Managed Aquifer Recharge Using Urban Storm Water" Water 10, no. 4: 358. https://doi.org/10.3390/w10040358
Note that from the first issue of 2016, this journal uses article numbers instead of page numbers. See further details here.