
Contributions of Vascular Burden and Amyloid Abnormality to Cognitive Decline in Memory Clinic Patients
Abstract
Background:
Alzheimer’s disease pathology and vascular burden are highly prevalent and often co-occur in elderly. It remains unclear how both relate to cognitive decline.
Objective:
To investigate whether amyloid abnormality and vascular burden synergistically contribute to cognitive decline in a memory clinic population.
Methods:
We included 227 patients from Maastricht and Aachen memory clinics. Amyloid abnormality (A+) was defined by CSF Aβ42 using data-driven cut-offs. Vascular burden (V+) was defined as having moderate to severe white matter hyperintensities, or any microbleeds, macrohemorrhage or infarcts on MRI. Longitudinal change in global cognition, memory, processing speed, executive functioning, and verbal fluency was analysed across the A-V-, A-V+, A+V-, A+V+ groups by linear mixed models. Additionally, individual MRI measures, vascular risk and vascular disease were used as V definitions.
Results:
At baseline, the A+V+ group scored worse on global cognition and verbal fluency compared to all other groups, and showed worse memory compared to A-V+ and A-V- groups. Over time (mean 2.7+ – 1.5 years), A+V+ and A+V- groups showed faster global cognition decline than A-V+ and A-V- groups. Only the A+V- group showed decline on memory and verbal fluency. The A-V+ group did not differ from the A-V- group. Individual MRI vascular measures only indicated an independent association of microbleeds with executive functioning decline. Findings were similar using other V definitions.
Conclusions:
Our study demonstrates that amyloid abnormality predicts cognitive decline independent from vascular burden in a memory clinic population. Vascular burden shows a minor contribution to cognitive decline in these patients. This has important prognostic implications.
INTRODUCTION
Alzheimer’s disease (AD) and vascular pathology are highly prevalent in older populations, and often co-exist [1–3]. AD is characterized by abnormal amyloid-β (Aβ) and tau biomarker levels in cerebrospinal fluid (CSF) and key measures of vascular burden include white matter hyperintensities (WMH), microbleeds and infarcts on MRI [4]. AD biomarker abnormality as well as vascular burden are associated with cognitive decline [5–7] and progression to dementia [8, 9]. However, the influence of combined presence of AD biomarker abnormality and vascular burden on the prognosis of memory clinic patients remains unclear [10].
Only few longitudinal studies have investigated how vascular pathology influences amyloid-related cognitive decline, and findings are contradictory. A recent study by Yassi et al. [11] has suggested a greater global cognitive decline when both amyloid pathology and MRI vascular burden (WMH, infarcts, or micro-infarcts) are present in memory clinic patients, while others did not find this synergistic effect of amyloid and MRI vascular burden (WMH and infarcts) [7, 12]. Other measures such as vascular risk factors (e.g. hypertension, hypercholesterolemia, and diabetes) and vascular disease (e.g., coronary artery disease, myocardial infarction) are also important to consider. Some of these vascular measures, as part of the Framingham Risk Score (FRS), have been shown to contribute to greater cognitive decline in combination with amyloid pathology in cognitively normal persons [13, 14]. Inconsistent findings across these studies may result from differences in measures of vascular burden and amyloid, study population, and follow-up duration.
The current AD AT(N) biomarker framework [15] allows the incorporation of other markers, such as vascular burden, that is ATV(N) [16, 17]. To date, it remains unclear what constitutes an optimal definition of V and how it is associated with cognitive decline. Knowledge on how combined and individual vascular markers influence AD-related cognitive decline will provide novel insights into the potential added value of V in the AD biomarker framework and is important for improving the prognosis of memory clinic patients and prevention of cognitivedecline.
Our primary aim was to investigate how combined and single measures of vascular burden on MRI influence cognitive decline in relation to amyloid abnormality in a memory clinic population. We used microbleeds, WMH, infarcts and hemorrhages as measures of vascular burden and CSF amyloid-β42 (Aβ42) as measure of amyloid accumulation. We hypothesized that the presence of both vascular burden and amyloid abnormality is associated with greater cognitive decline as compared to amyloid or vascular burden separately. We also assessed the individual associations of MRI vascular burden and amyloid abnormality on cognitive decline. In secondary analyses, we compared the main findings to those in persons without dementia and using two other definitions of vascular burden, i.e. vascular risk factors and vascular disease.
METHODS
Participants
We included memory clinic patients with subjective cognitive decline (SCD), mild cognitive impairment (MCI), or dementia from the RWTH Aachen Memory Database from the University Hospital (Germany) and the Maastricht BioBank Alzheimer Center Limburg (BB-ACL) (The Netherlands) study. Patients were included if there was baseline data available on CSF Aβ42, vascular MRI ratings, and neuropsychological measures at baseline and at least one cognitive follow-up visit. Exclusion criteria were baseline age <45 years and cognitive impairment caused by other than neurodegenerative or cerebrovascular disease (e.g., post-traumatic, post-infectious, chronic-inflammatory). The study was approved by the local ethics committees (EK 018-19 for Aachen, METC 09-3-037, METC 09-3-038, and METC 15-4-100 for Maastricht) and conducted according to The Code of Ethics of the World Medical Association (Declaration of Helsinki).
Clinical assessment
All patients were assessed through standard protocol procedures at each site, including neurological and psychiatric assessment, medical history, and neuropsychological examination. Information on medical history was provided by the patients or their informal caregivers, and included, amongst others, vascular risk factors such as hypertension, hypercholesterolemia, and diabetes (type 1 and type 2), as well as vascular diseases such as coronary artery stenosis, carotid artery disease and myocardial infarction. Medication usage was also provided.
Neuropsychological examination was performed according to routine protocols at each site. For the current study, we selected measurements of global cognition, as well as measures categorized a priori within four cognitive domains: memory, processing speed, executive functioning, and verbal fluency. Global cognition was measured either with the Mini-Mental State Examination (MMSE; RWTH Aachen and BB-ACL) [18] or with the Montreal Cognitive Assessment (MoCA; only RWTH Aachen) [19]. If MMSE scores were unavailable (10%), MoCA scores were converted to MMSE scores [20]. Memory was measured by the CERAD-NAB-Plus wordlist delayed recall and recognition [21] in RWTH Aachen and the Dutch version of the Auditory Verbal Learning Task (AVLT) delayed recall and recognition in BB-ACL [22]. Processing speed was measured by either the CERAD Trail Making Test A (TMT-A) [21, 23] or by the Concept Shifting Task A (CST-A; only BB-ACL) [24]. Executive functioning was measured by The Trail Making Test B (TMT-B) and Concept Shifting Task B (CST-B) [21, 23, 24]. To measure verbal fluency, the one-minute animals semantic verbal fluency test was used in both cohorts [21, 25]. For all tests, raw scores were converted to Z-scores using validated standardized age, sex, and education adjusted test norms as used in clinical practice for both memory clinics [21–27]. Z-scores below –5 and above 5 were rounded to –5 and 5, respectively, to avoid extreme outliers in cognitive performance.
Baseline clinical diagnoses were established by specialized medical doctors in the memory clinics. Persons were classified as SCD when being referred to the memory clinic with subjective cognitive complaints but without showing objective cognitive impairments on neuropsychological assessment [28]. A diagnosis of MCI was made according to the criteria of Petersen [29] and a clinical diagnosis of dementia was based on the Diagnostic and Statistical Manual of Mental Disorders, Fourth Edition (DSM-IV) criteria. Cognitive testing was performed at baseline and up to five years of follow-up. At the BB-ACL site, structural follow-ups were performed at 1, 2, 3, and 5 years, whereas at RWTH Aachen follow-ups were dependent on clinical referral.
CSF AD biomarker assessment
Levels of Aβ42, phosphorylated tau 181 (p-tau), and total tau (t-tau) were obtained from the CSF as part of clinical routine, using lumbar puncture. For both centers, peptide and protein levels were measured by Fujirebio Innotest enzyme-linked immunosorbent assays (ELISA; Innogenetics, Ghent, Belgium). To allow comparison of biomarker abnormality between the cohorts, cut-offs were determined by Gaussian mixture modelling [30] for each center: Aβ42 < 722 pg/ml and p-tau>54 pg/ml for RWTH Aachen hospital, and Aβ42 < 773 pg/ml and p-tau>65 pg/ml for BB-ACL. Persons were classified as A+ when having abnormal Aβ42 levels and as A- when having normal Aβ42 and p-tau levels. We excluded persons with abnormal p-tau levels from the A- group (n = 36) for this group to represent a control group with normal AD biomarkers.
MRI assessment
All persons underwent either a 1.5T (RWTH Aachen only) or 3T MRI scan (RWTH Aachen and BB-ACL) including both T1 and T2 weighted, as well as FLAIR images, in accordance with the study protocol at each site. Images were assessed by two experienced independent raters blinded to clinical information, using validated semi-qualitative visual rating scales. Average values of the raters were reported. We used the Scheltens scale for assessment of medial temporal atrophy (MTA) with a score ranging from 0–4 [31], the Koedam scale for assessment of posterior atrophy with a score ranging from 0–3 [32], and the Fazekas scale for rating WMH with a score ranging from 0–3 [33]. The total count of cortical and subcortical microbleeds, ischemic strategic and non-strategic infarcts and intracranial macrohemorrhage were also determined. Persons were classified as V+ if they had a Fazekas score ≥2 [34], or one or more cortical or subcortical microbleeds, strategic or non-strategic infarcts, or intracranial macrohemorrhage. If none of the above was present, persons were classified as V-. Persons were excluded from analysis if more than one MRI vascular burden marker was missing.
Patient classifications
In our main analyses, all persons were classified in AVMRI subgroups based on presence of amyloid abnormality (A) and MRI vascular burden (V): 1) no amyloid abnormality and no MRI vascular burden (A-V-); 2) only MRI vascular burden (A-V+); 3) only amyloid abnormality (A+V-); and 4) both amyloid abnormality and MRI vascular burden (A+V+). In secondary analyses, we used two additional vascular definitions: vascular risk (Vrisk) and vascular disease (Vdisease). For vascular risk, Vrisk+ indicated the current presence of either hypertension, hypercholesterolemia, diabetes, or medication use for these conditions. For vascular disease, Vdisease+ indicated the current presence of either coronary artery disease, carotid artery stenosis, past myocardial infarction, past vascular surgery, or use of antithrombotics.
Statistical analyses
Pearson chi-squared (for dichotomous variables) and ANOVA (for continuous variables) were used to compare baseline characteristics between the four AVMRI groups based on amyloid abnormality and MRI vascular burden. To this end, Aβ42, p-tau, and t-tau levels, and microbleed count were log transformed due to their skewed distributions.
Subsequently, linear mixed models were used to predict slopes of cognitive decline. This is an often used method for longitudinal data and is well-known for handling irregular time intervals and missing data [35, 36]. We assessed slopes of global cognition, memory, processing speed, executive functioning, and verbal fluency within the four AVMRI groups, by including time x group interactions in the model. In secondary analyses, two other definitions of V were used, i.e., vascular risk factors (Vrisk) and vascular disease (Vdisease).
Additionally, to investigate the role of individual factors of MRI vascular burden, we performed linear mixed models including interactions of WMH and microbleeds presence (total and cortical microbleeds) with Aβ42 abnormality in the prediction of cognitive decline in all domains. We did not include the presence of infarcts, macrohemorrhages, and subcortical microbleeds in the individual analyses, as the prevalence in our sample was low (7.5%, 0.9%, and 4.8% respectively). Results for main analyses were also reported after Bonferroni correction.
As a sensitivity analysis, we repeated our analyses only in persons without dementia (SCD and MCI) and investigated potential differences between diagnostic groups by exploring interactions between the AVMRI groups and diagnostic group on cognitive decline. In addition, in our main analyses, we used memory recognition decline as extra outcome, as dysfunction in memory retrieval is common in persons with vascular burden [37]. All linear mixed model analyses used the restricted maximum likelihood (REML) method. The variables of interest and covariates baseline age, sex, and education years were added as fixed effects, and person-specific intercepts and slopes were added as random effects. All analyses were performed using SPSS Statistics version 26.0 software (IBM, Armonk, NY, USA) and with significance levels set at p < 0.05.
RESULTS
Sample characteristics
Our total sample consisted of 227 persons with a mean age of 66.2 years (SD = 9.1), of whom 64% were male. At baseline, 28% had SCD, 51% had MCI, and 21% had a diagnosis of dementia. Of the total sample, 49% was recruited from the BB-ACL (53% SCD, 43% MCI, 4% dementia), and 51% from the RWTH Aachen (4% SCD, 59% MCI, 37% dementia). Mean follow-up time was 2.7 years (SD = 1.5, range 1–5 years). From all persons with SCD and MCI at baseline (n = 181), 20 patients (11%) progressed to dementia at follow-up. From all with SCD at baseline (n = 64), 11 patients (17%) progressed to MCI.
Baseline characteristics for the AVMRI groups are shown in Table 1. Persons were youngest (59.7, SD = 8.4) in the A-V- group and the oldest (72.7, SD = 6.9) in the A+V+ group (p < 0.001). Patients in the group without Aβ pathology and vascular burden (A-V-) most often had SCD (61.8%), whereas MCI was most common in the other groups (A-V+: 57.1%, A+V-: 63.2%, A+V+: 51.0%, p < 0.001). Dementia was more common in the A+V+ group (41.2%) compared to the other groups (A-V-: 4.4%, A-V+: 9.5%, A+V-: 24.1%, p < 0.001). Besides Aβ42, other CSF AD biomarkers, i.e., p-tau and t-tau, were also more abnormal in the A+V- and A+V+ groups, compared to the A-V+ and A-V- groups (p < 0.001). Aβ42 levels were lower, thus more abnormal, in the A+V+ group compared to the A+V- group (p = 0.01). Of all persons showing amyloid abnormality, 70% also had abnormal p-tau levels, both in the A+V- and A+V+ group. MTA was more severe in the A+V+ group compared to all other groups (p < 0.001).
Table 1
Study participants’ characteristics per AVMRI group
| N | A-V- | A-V+ | A+V- | A+V+ | p | ||||
| N | 227 | 68 (30.0%) | 21 (9.3%) | 87 (38.3%) | 51 (22.5%) | ||||
| Age | 227 | 59.7 (8.4)b,c,d | 66.2 (7.7)a,d | 67.8 (7.7)a,d | 72.7 (6.9)a,b,c | < 0.001 | |||
| Gender, male | 227 | 48 (70.6%) | 15 (71.4%) | 50 (57.5%) | 32 (62.7%) | 0.33 | |||
| Education y | 227 | 11.4 (3.2) | 11.9 (3.7) | 12.5 (3.5) | 11.8 (3.6) | 0.27 | |||
| Diagnosis | SCD | 227 | 42 (61.8%)b,c,d | 7 (33.3%)a,c,d | 11 (12.6%)a,b | 4 (7.8%)a,b | < 0.001 | ||
| MCI | 23 (33.8%)c | 12 (57.1%) | 55 (63.2%)a | 26 (51.0%) | 0.004 | ||||
| Dementia | 3 (4.4%)c,d | 2 (9.5%)d | 21 (24.1%)a,d | 21 (41.2%)a,b,c | < 0.001 | ||||
| CSF Aβ42 (pg/ml) | 227 | 1128.7 (282.8)c,d | 1141.6 (275.0)c,d | 531.1 (134.4)a,b,d | 470.7 (132.4)a,b,c | < 0.001 | |||
| CSF p-tau (pg/ml) | 227 | 41.6 (11.1)c,d | 44.2 (10.6)c,d | 83.4 (41.4)a,b | 83.7 (35.5)a,b | < 0.001 | |||
| CSF t-tau (pg/ml) | 227 | 209.0 (91.4)c,d | 249.1 (119.6)c,d | 500.1 (308.3)a,b | 492.2 (301.9)a,b | < 0.001 | |||
| MTA | Score | 211 | 0.7 (0.8)c,d | 0.9 (0.7)d | 1.1 (0.8)a,d | 1.8 (0.9)a,b,c | < 0.001 | ||
| >2 | 5 (8.1%)d | 1 (5.0%)d | 8 (9.6%)d | 18 (39.1%)a,b,c | < 0.001 | ||||
| Koedam | Score | 226 | 0.25 (0.37)b,c,d | 0.62 (0.59)a | 0.60 (0.66)a,d | 0.81 (0.62)a,c | < 0.001 | ||
| WMH Fazekas | Score | 227 | 0.8 (0.4)b,d | 1.4 (0.7)a,c,d | 0.7 (0.5)b,d | 1.8 (0.8)a,b,c | < 0.001 | ||
| > = 2 | – | 10 (47.6%) | – | 30 (58.8%) | 0.38 | ||||
| Microbleeds | Cortical | Count | 210 | 0.0 (0.1)b,d | 0.9 (2.6)a,c,d | 0.0 (0.1)b,d | 3.8 (10.0)a,b,c | < 0.001 | |
| > = 1 | – | 5 (25.0%) | – | 24 (47.1%) | 0.09 | ||||
| Subcortical | Count | 210 | 0.0 (0.1)d | 0.3 (1.1)c | 0.0 (0.0)b,d | 0.4 (1.3)a,c | < 0.001 | ||
| > = 1 | – | 2 (10.0%) | – | 8 (15.7%) | 0.54 | ||||
| Infarct | Strategic | > = 1 | 227 | – | 6 (28.6%) | – | 2 (3.9%) | 0.002 | |
| Non-strategic | – | 4 (19.0%) | – | 5 (9.8%) | 0.28 | ||||
| Macrohaemorrhage | > = 1 | 227 | – | 0 (0.0%) | – | 2 (3.9%) | 0.36 | ||
| Hypertension | 227 | 29 (42.6%) | 15 (71.4%) | 43 (49.4%) | 29 (56.9%) | 0.10 | |||
| Dyslipidemia | 227 | 17 (25.0%) | 8 (38.1%) | 33 (37.9%) | 18 (35.3%) | 0.36 | |||
| Diabetes | 227 | 12 (17.6%) | 1 (4.8%) | 11 (12.6%) | 9 (17.6%) | 0.43 | |||
| Vascular disease | 227 | 16 (23.5%) | 9 (42.9%) | 33 (37.9%) | 20 (39.2%) | 0.16 |
Numbers represent in Mean (SD) for continuous variables or N (%) for dichotomous variables. Differences between groups were tested with ANOVA for continuous variables and Chi-Squared for dichotomous variables. Log transformations were performed for testing AD biomarkers (Aβ42, p-tau, and t-tau), atrophy (MTA and Koedam) and microbleeds due to skewed distributions. Hypertension, dyslipidemia, diabetes, and vascular disease were considered present based on diagnosis or medication use extracted from medical history. Significancep < 0.05:acompared to AD-V-,bcompared to AD-V+,ccompared to A+V-,dcompared to A+V+. AD is defined based on amyloid pathology; V is defined based on MRI vascular burden. AD, Alzheimer’s disease; SD, standard deviation; SCD, subjective cognitive decline; MCI, mild cognitive impairment; MTA, medial temporal atrophy; WMH, white matter hyperintensities.
Table 2
Cognitive performance per AVMRI group
| A-V- | A-V+ | A+V- | A+V+ | p | ||
| MMSE N | 68 | 18 | 87 | 49 | ||
| (range 0–30) | Baseline | 27.92 [27.22–28.62]c,d | 27.51 [26.32–28.71]d | 26.36 [25.80–26.93]a,d | 24.85 [24.04–25.65]a,b,c | < 0.001 |
| Slope (per year) | –0.26 [–0.68–0.16]c,d | –0.17 [–0.95–0.61]c,d | –1.37 [–1.76 – –0.98]a,b | –1.38 [–1.94 – –0.81]a,b | < 0.001 | |
| Memory | N | 55 | 18 | 51 | 26 | |
| Delayed recall | Baseline | –0.55 [–0.95–0.15]c,d | –0.92 [–1.55–0.28]d | –1.65 [–2.03–1.26]a | –1.87 [–2.44–1.30]a,b | < 0.001 |
| (Z-score) | Slope (per year) | –0.04 [–0.13–0.05] | 0.05 [–0.10–0.20] | –0.12 [–0.22–0.02] | –0.09 [–0.25–0.07] | 0.27 |
| Processing | N | 44 | 12 | 28 | 14 | |
| speed | Baseline | –0.52 [–0.93–0.12] | –0.74 [–1.39–0.08] | –0.38 [–0.83–0.08] | –0.37 [–1.03–0.28] | 0.83 |
| (Z-score) | Slope (per year) | 0.16 [0.05–0.26] | 0.14 [–0.06–0.33] | 0.00 [–0.14–0.14] | –0.07 [–0.27–0.13] | 0.12 |
| Executive | N | 41 | 10 | 20 | 9 | |
| functions | Baseline | –0.51 [–0.95–0.07] | –0.42 [–1.16–0.32] | 0.01 [–0.55–0.57] | –0.01 [–0.81–0.79] | 0.51 |
| (Z-score) | Slope (per year) | 0.08 [–0.02–0.17] | 0.18 [0.00–0.37] | 0.01 [–0.14–0.15] | –0.18 [–0.39–0.02] | 0.06 |
| Verbal | N | 52 | 18 | 50 | 25 | |
| fluency | Baseline | –0.23 [–0.52–0.05]c,d | –0.49 [–0.94–0.05]d | –0.81 [–1.08–0.54]a,d | –1.39 [–1.79–0.98]a,b,c | < 0.001 |
| (Z-score) | Slope (per year) | 0.00 [–0.08–0.08] | –0.03 [–0.16–0.11] | –0.12 [–0.21 – –0.03] | 0.00 [–0.14–0.15] | 0.27 |
Numbers represent in B [CI] as predicted by linear mixed modelling adjusted for baseline age, education years and gender, and cohort as random factor. Significancep < 0.05:acompared to A-V-,bcompared to A-V+,ccompared to A+V-,dcompared to A+V+. A is defined by amyloid abnormality; V is defined based on MRI vascular burden. Bold text indicates a significant increase or decrease compared to 0. MMSE, Mini-Mental State Examination.
Regarding MRI vascular burden, more severe WMH and a higher number of cortical microbleeds were present in the A+V+ group compared to the A-V+ group (p = 0.02 andp = 0.006, respectively). In contrast, strategic infarcts were more often present in the A-V+ group compared to the A+V+ group (p = 0.002). Presence of macrohemorrhages as well as prevalence of vascular risk factors and vascular disease also did not differ across groups (Table 1).
Cognition in AVMRI groups
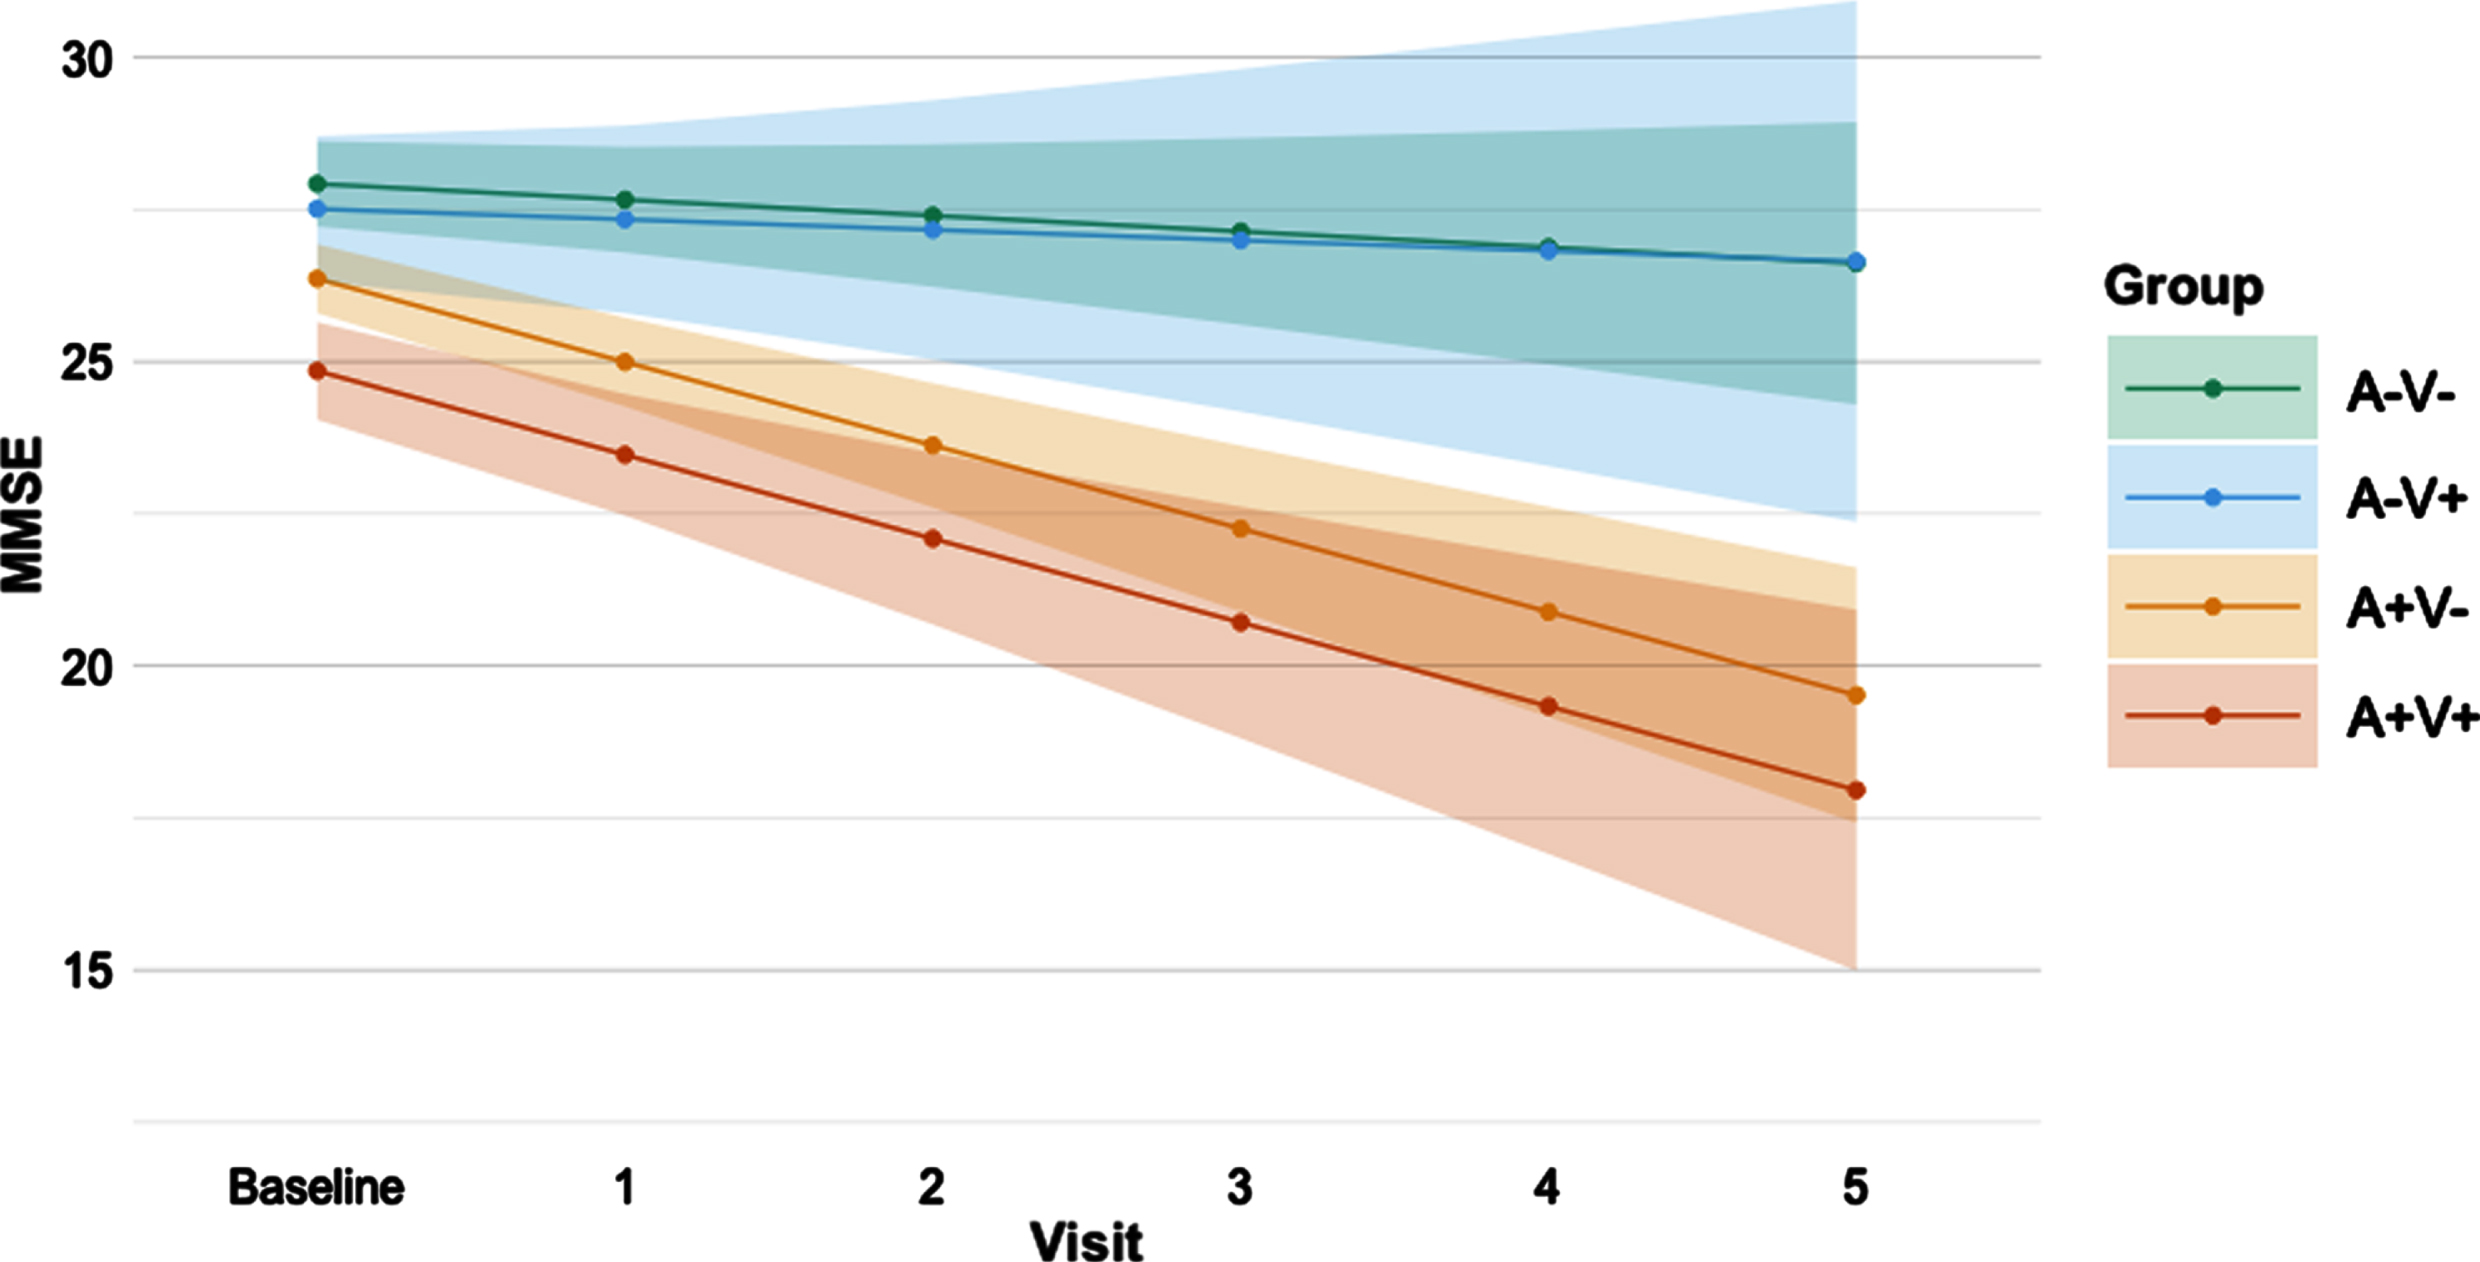
Results on baseline cognition and cognitive decline in the AVMRI groups are shown inTable 2. At baseline, the A+V- and the A+V+ groups performed consistently worse than the A-V- group on MMSE (p = 0.001 andp < 0.001 respectively), memory (bothp < 0.001), and verbal fluency (p = 0.006 andp < 0.001 respectively) tests. The A+V+ group also performed worse than the A-V+ group on these tests (MMSE:p < 0.001, memory:p = 0.03, verbal fluency:p = 0.003). On MMSE and verbal fluency tests, the A+V+ group performed worse than the A+V- group (MMSE:p = 0.002, verbal fluency:p = 0.02).∥When assessing cognitive decline over time, both the A+V- and A+V+ groups showed decline on the MMSE (bothp < 0.001), with steeper decline compared to the A-V- (p < 0.001 andp = 0.002 respectively) and A-V+(p = 0.008 andp = 0.02 respectively) groups (Fig. 1). The A+V- group also showed decline in memory (p = 0.02) and verbal fluency (p = 0.01), but this was not significantly different from the other groups. In none of these analyses, the A-V+ differed from the A-V- group. Additionally, none of the groups showed decline in the processing speed and executive functioning domains. An improved processing speed score over time (p = 0.004), however, was seen within the A-V- group. When correcting for multiple comparisons (Bonferroni correction) results remained essentially the same, except for thepost-hoc tests indicating difference in MMSE decline between the A-V+ and A+V+ group, the memory and verbal fluency decline in the A+V groups and the baseline verbal fluency difference between the A+V- and A+V+ groups.
Fig. 1
Predicted decline in MMSE score over time per AVMRI group. Predicted MMSE values from baseline to 5 years follow-up based on linear mixed modelling slopes per AVMRI group. A is defined by amyloid abnormality; V is defined by MRI vascular burden. Error bars indicate the 95% confidence interval. MMSE, Mini-Mental State Examination.
Individual vascular MRI markers, amyloid abnormality, and cognitive decline
To investigate the role of the individual MRI vascular marker in the definition of vascular burden, we tested interactions between individual vascular MRI markers (WMH and microbleeds) and amyloid abnormality on cognitive decline. Results are shown inTable 3. For MMSE, memory, processing speed, and executive functioning, none of the individual vascular markers showed interactions with amyloid abnormality in their effect on cognitive decline. We found that amyloid abnormality was associated with decline on MMSE and processing speed tests and tended to be associated with decline in memory and executive functioning (Table 3). Furthermore, microbleeds were only associated with decline in executive functioning. WMH was not related to cognitive decline in any domain. In addition, an interaction of microbleeds with amyloid abnormality was found in the effect on verbal fluency decline (p = 0.02). Only persons with amyloid abnormality and without microbleeds showed verbal fluency decline (B = –0.12, CI [–0.20– −0.4],p = 0.005). Surprisingly, this verbal fluency decline was greater than in persons with both pathologies (p = 0.02) or persons without pathologies (p = 0.03), but similar to persons with only microbleeds (p = 0.75). When specifically investigating cortical microbleeds, which are thought to mainly be involved in AD, the interaction of cortical microbleeds and amyloid on verbal fluency performance was no longer present. Further results remained similar (Supplementary Table 1). When correcting for multiple comparisons (Bonferroni correction), only the independent association between amyloid and MMSE decline remained significant.
Table 3
Associations between individual vascular MRI markers, amyloid abnormality, and their interaction on cognitive decline
| Model | Microbleeds | A+ | Microbleeds xA+ | WMH | A+ | WMH xA+ | ||
| MMSE | N | 206 | 206 | 206 | 223 | 223 | 223 | |
| (range 0–30) | Model 1 | B [CI] | 0.47 [–0.37 – 1.31] | –0.60 [–2.37 – 1.17] | –0.55 [–2.39 – 1.30] | –0.07 [–0.86 – 0.73] | –0.58 [–2.01– 0.85] | –0.62 [–2.14 – 0.90] |
| p | 0.27 | 0.50 | 0.56 | 0.87 | 0.42 | 0.42 | ||
| Model 2 | B [CI] | 0.36 [–0.39 – 1.10] | –1.10 [–1.61 – –0.60] | –0.24 [–0.91 – 0.44] | –1.12 [–1.61 – –0.63] | |||
| p | 0.34 | < 0.001 | 0.49 | < 0.001 | ||||
| Memory | N | 141 | 141 | 141 | 150 | 150 | 150 | |
| Delayed recall | Model 1 | B [CI] | 0.14 [–0.13 – 0.41] | –0.09 [–0.48 – 0.31] | –0.02 [–0.43 – 0.39] | –0.04 [–0.25 – 0.17] | –0.15 [–0.44 – 0.14] | 0.07 [–0.25 – 0.39] |
| (Z-score) | p | 0.30 | 0.66 | 0.93 | 0.68 | 0.31 | 0.68 | |
| Model 2 | B [CI] | 0.13 [–0.07 – 0.34] | –0.10 [–0.22 – 0.01] | –0.01 [–0.17 – 0.14] | –0.09 [–0.21 – 0.02] | |||
| p | 0.19 | 0.08 | 0.86 | 0.11 | ||||
| Processing | N | 92 | 92 | 92 | 98 | 98 | 98 | |
| speed | Model 1 | B [CI] | 0.10 [–0.27 – 0.47] | 0.11 [–0.53 – 0.74] | –0.30 [–0.95 – 0.36] | –0.08 [–0.35 – 0.18] | –0.22 [–0.62 – 0.19] | 0.06 [–0.38 – 0.50] |
| (Z-score) | p | 0.61 | 0.74 | 0.37 | 0.53 | 0.29 | 0.79 | |
| Model 2 | B [CI] | 0.00 [–0.30 – 0.31] | –0.17 [–0.33 – –0.02] | –0.06 [–0.27 – 0.15] | 0.16 [–0.32 – –0.01] | |||
| p | 0.99 | 0.03 | 0.56 | 0.03 | ||||
| Executive | N | 74 | 74 | 74 | 80 | 80 | 80 | |
| functions | Model 1 | B [CI] | –0.42 [–0.81 – –0.03] | –0.28 [–0.92 – 0.36] | 0.16 [–0.50 – 0.81] | –0.18 [–0.45 – 0.09] | –0.32 [–0.70 – 0.06] | 0.22 [–0.20 – 0.63] |
| (Z-score) | p | 0.04 | 0.39 | 0.64 | 0.19 | 0.09 | 0.30 | |
| Model 2 | B [CI] | –0.37 [–0.68 – –0.05] | –0.13 [–0.28 – 0.02] | –0.09 [–0.29 – 0.12] | –0.14 [–0.29 – 0.01] | |||
| p | 0.02 | 0.08 | 0.40 | 0.07 | ||||
| Verbal | N | 137 | 137 | 137 | 145 | 145 | 145 | |
| fluency | Model 1 | B [CI] | 0.27 [0.04 – 0.49 | 0.31 [–0.02 – 0.64] | –0.43 [–0.78 – –0.08] | 0.04 [–0.14 – 0.23] | 0.08 [–0.19 – 0.34] | –0.17 [–0.46 – 0.12] |
| (Z-score) | p | 0.02 | 0.07 | 0.02 | 0.65 | 0.58 | 0.25 | |
| Model 2 | B [CI] | – | – | – | –0.03 [–0.17 – 0.11] | –0.07 [–0.17 – 0.04] | ||
| p | – | – | – | 0.70 | 0.20 |
Interaction effects are represented by B [CI], as predicted by linear mixed modelling adjusted for baseline age, education years and gender, and cohort as random factor. Significantp-values are shown in bold text. Model 1 includes the interaction term of the vascular marker (dichotomous) with amyloid abnormality. Model 2, without the interaction term, was executed when the interaction in Model 1 was non-significant. Prevalence of infarcts and macrohemorrhages was too low to perform reliable analyses. MMSE, Mini-Mental State Examination,A+, Aβ42 abnormality; WMH, white matter hyperintensities.
Cognitive decline in the AV groups using different vascular definitions
Next, we used vascular risk factors (Vrisk) or vascular disease (Vdisease) as definitions of vascular burden (V) to investigate whether these definitions were differently associated with cognitive decline. Using these two definitions of vascular burden resulted in similar findings compared to the those using MRI vascular burden (Supplementary Tables 2 and 3). Using vascular risk factors, the A-V- group showed improved scores in executive functioning over time (p = 0.002), with a greater increase when compared to the A-V+(p = 0.02) and A+V- (p = 0.003) groups. An improved score was now also found for processing speed in the A-V+ group (p = 0.04). Furthermore, cognitive decline over time became significant for the A+V+ group in both memory (p = 0.03) and verbal fluency (p = 0.03) domains, whereas the A+V- group no longer demonstrated decline in memory or verbal fluency.∥When vascular groups were defined based on vascular disease, the A+V+ group showed worse verbal fluency scores over time (p = 0.003) and showed a greater decline in verbal fluency scores than A+V- (p = 0.04) and A-V- groups (p = 0.005). Verbal fluency decline in the A+V- group was no longer present. Besides, the A-V- group showed improved scores in executive functioning over time (p = 0.03), as also shown for the vascular risk definition.
Sensitivity analyses
For the main AVMRI group analysis, we examined whether findings were different between diagnostic groups (SCD, MCI, dementia). No significant interaction of diagnostic group with the AVMRI groups or amyloid abnormality was found on cognitive decline in any of the domains. When excluding persons with dementia, results also remained similar (Supplementary Table 4). Only baseline MMSE and verbal fluency scores did not remain significantly different between the A+V+ and A+V- groups and decline in memory and verbal fluency performance was no longer observed in the A+V- group.∥Similarly, for the AVrisk and AVdisease groups, no interactions between the diagnostic group and AV groups were found. When repeating the analyses in individuals without dementia, results again remained similar. Except that for the vascular risk definition, A+V+ did not show decline in memory and verbal fluency, and for the vascular disease definition the difference in MMSE decline between the A-V+ and A+V- was no longer present.∥When repeating analyses with decline in memory recognition as outcome, results remained largely similar to the results of memory delayed recall, except that we found a decline in recognition in both the A+V- and A+V+ group, which we only found in the A+V- group for delayed recall (Supplementary Table 5). In the individual analyses, we similarly did not find any vascular effects on decline in recognition (Supplementary Table 6).
DISCUSSION
We investigated the role of amyloid abnormality and vascular burden in cognitive decline in a memory clinic population and found that amyloid abnormality is the major predictor of decline over time in global cognition, memory, and verbal fluency functioning. Vascular burden on MRI was not associated with cognitive decline and did not aggravate the course of decline in persons with amyloid abnormality. Only microbleeds were shown to influence decline in executive functioning independently from amyloid abnormality, but this effect did not remain after adjustment for multiple testing. When exploring different definitions of vascular burden, using vascular risk factors and vascular disease, amyloid abnormality remained the main predictor for cognitive decline. Decline was not affected by the presence of vascular burden, except for a synergistic association of amyloid abnormality and vascular disease on decline in verbal fluency.
MRI vascular burden, amyloid abnormality, and cognition
We found that that vascular burden in addition to amyloid abnormality was not associated with longitudinal cognitive decline. This is in line with earlier longitudinal findings in both a population-based cohort in cognitively normal elderly using WMH and infarcts as vascular markers [7], and a memory clinic study in persons without dementia with WMH as measure of vascular burden [12]. However, another recent population study suggested a greater cognitive decline in persons with normal cognition, MCI or dementia with both amyloid pathology and MRI vascular burden (infarcts, microinfarcts, WMH) [11]. This contradictory finding may be explained by the difference in setting as a population setting may include younger and healthier participants compared to a memory clinic setting. Other possible explanations could be the longer follow-up (up to 7.5 years), different methods for measuring amyloid and WMH, or the inclusion of microinfarcts and not microbleeds when compared to our study. An explanation for not finding any synergistic effects of AD biomarkers and vascular burden on cognitive decline could be that microbleeds and WMH are byproducts in advanced stages of AD, without accelerating the cognitive decline induced by amyloid. It has indeed been shown that amyloid abnormality precedes increases in WMH [6]. Strictly lobar microbleeds have previously been linked to cerebral amyloid angiopathy (CAA) and is also often present in advanced AD [38, 39], without showing greater cognitive decline compared to AD without CAA [40]. This corresponds with our finding that more WMH and microbleeds were present in the A+V+ group compared to the A-V+ group. This explanation would also be in line with the higher age, proportion of dementia diagnoses, lower CSF Aβ42 levels, and higher MTA and Koedam ratings in the A+V+ group compared to the A+V- group found in our cohort.
As shown in most studies [41], our results demonstrate that amyloid abnormality is independently associated with global cognitive decline. Yet, decline in memory and verbal fluency was only observed in the group with only abnormal amyloid (A+V-). For microbleeds individually, verbal fluency decline was even significantly greater in the only amyloid abnormal group as compared to the group with both amyloid abnormality and microbleeds. A slower memory and verbal fluency decline in more advanced AD stages could be due to floor effects on neuropsychological tests, as the A+V+ group already scored very low on memory and verbal fluency at baseline. MRI vascular burden was not independently associated with cognitive decline, except for an independent association of microbleeds with decline in executive functioning when not correcting for multiple testing. This is in line with studies suggesting that cerebrovascular disease is related to executive functioning in particular [42, 43].
Associations of MRI vascular burden and cognitive decline in elderly are mostly shown in mid-life and population-based studies [44–50]. Within memory clinic and AD research settings, vascular contributions to cognitive decline and related atrophy are less well studied and inconsistent [51]. It is challenging to measure vascular contributions in these settings, as many comorbidities occur at this stage and severe vascular cases are often not referred to memory clinics. Vascular effects on cognitive decline might therefore be less clear in memory clinic settings, especially when compared to the large presence of amyloid abnormality. Additionally, amyloid abnormality and MRI vascular burden often co-exist [1–3], making it difficult to examine what part of cognitive decline is attributed to amyloid abnormality and what part to vascular burden. Only few longitudinal studies accounted for amyloid abnormality when assessing associations of vascular burden and cognitive decline in memory clinic settings. Whereas some of these studies found an independent effect of WMH on cognitive decline [6, 7, 12], only one study found an independent contribution of microbleeds to cognitive decline [52].
At baseline, we found that MMSE and verbal fluency scores were lower when having both amyloid abnormality and vascular burden on MRI as compared to only having amyloid abnormality. This indicates that MRI vascular burden on top of abnormal amyloid affects cognition at baseline, without affecting future cognitive decline. This would be in line with our previous explanation that A+V+ persons are in a more advanced stage of AD at baseline already. This finding is consistent with earlier studies showing that persons with cognitive impairment perform worse on MMSE when both amyloid and WMH are present [53] and worse on verbal fluency tests when both amyloid and microbleeds are present [54]. Other studies could not confirm this in persons with normal cognition or vascular cognitive impairment [55, 56].
Comparison to other vascular definitions
Upon assessing different definitions of vascular burden in relation to amyloid and cognitive decline, our results similarly indicated that vascular risk factors and vascular disease are not associated with cognitive decline while amyloid abnormality is for global cognitive decline. We only showed a synergistic effect of vascular disease and amyloid abnormality on verbal fluency decline.
Previous studies finding associations of vascular risk and vascular disease with cognition are often population-based and mid-life studies [57–59]. This suggests that vascular contributions might be more evident in younger ages and population settings than in memory clinic settings. A similar study in a young population-based sample (mean 56 years) found that AD biomarkers in CSF and vascular risk factors are independently but not synergistically related to global cognitive decline [60]. In line with our study, a previous study focusing on elderly (mean 73 years) found an independent effect of amyloid PET on decline in memory and executive functioning over a 5-year follow-up, but did not find any associations between a vascular composite, combining vascular risks and vascular diseases, and cognitive decline [61]. Some other longitudinal aging studies (mean age > 68) assessed the Framingham risk score (FRS), which combines certain vascular risk factors and vascular disease into a composite risk score. They found a synergistic effect of the FRS and amyloid pathology on global cognitive decline [13, 14]. Including only cognitively healthy participants and the inclusion of demographic risk factors such as age and sex as part of the FRS may have contributed to this finding.
Limitations
Our study is a unique collaboration between two cross-border memory clinics, which enabled us to explore available vascular measures, AD biomarkers, and cognitive decline in different domains after a follow-up of up to 5 years. While our findings can be generalized to other memory clinic populations, our study has several limitations. The frequency of vascular burden may be underestimated in our sample. We recruited participants from the memory clinic with CSF measures available, which may less well reflect cases with vascular burden as compared to amyloid pathology. As in most other memory clinic studies, cases with severe vascular disease (e.g., recent cerebrovascular accident) were not commonly included. Moreover, cognitive decline in our study may be underestimated as patients with severe cognitive decline are more likely to drop out at follow-up, resulting in relatively healthier cases with longer follow-ups being included in our study. Also, follow-up visits at the Aachen center were on clinical indication and therefore less consistent. While linear mixed modelling accounts both for less consistent follow-up visits and loss to follow-up, this could have impacted our findings. Besides, both centers used different, yet similar, cognitive tests. This could have introduced heterogeneity but also reflects clinical routine practice. By selecting one or two tests per cognitive domain, we could have missed different aspects within the domains. The use of more diverse cognitive tests could have helped to capture subtle or specific vascular-related cognitive changes. In addition, using more advanced vascular measures instead of visual rating scales could allow to detect smaller and more specific effects. More advanced vascular measures could be more sensitive to predict cognitive decline like CSF measures of amyloid pathology. The sample size did not allow us to look at each diagnostic group separately, but results remained similar when excluding persons with dementia.
Given the explorative nature of the study and the fact that vascular effects on cognition may be smaller or difficult to detect in memory clinic populations, we corrected only our main analyses for multiple comparisons. Yet, exactp-values of all analyses are reported to allow interpretation with and without correction for multiple comparisons.
CONCLUSIONS
Our study showed that amyloid abnormality is a major predictor of cognitive decline within a memory clinic population, independent from vascular burden. Moreover, vascular burden did not markedly contribute to cognitive decline in memory clinic patients in our cohort. While vascular burden often co-exists with amyloid abnormality, our findings indicate that vascular burden does not improve the prognosis prediction of memory clinic patients when combining it with amyloid measures, and thus might not add prognostic value to the current AT(N) framework. Vascular burden may have a larger impact on cognitive decline in other settings or at younger ages. Future studies with larger sample sizes and persons at early disease stages should explore the role of vascular burden in AD-related cognitive decline and the AT(N) biomarker framework. Samples with a higher representation of vascular burden and more specific and advanced vascular measures are necessary to further explore potential vascular contributions to AD pathophysiology and cognitive decline.
ACKNOWLEDGMENTS
The authors have no acknowledgments to report.
FUNDING
This study was funded by Alzheimer Nederland and Alzheimer Forschung Initiative (cross border grant NL-18002CB), and by Stichting Adriana van Rinsum-Ponsen. The study is also partly supported by the European Union’s Horizon 2020 research and innovation programme under Grant agreement no. 847879 (PRIME, Prevention and Remediation of Insulin Multimorbidity in Europe).
CONFLICT OF INTEREST
The authors declare that they have no conflict of interest.
DATA AVAILABILITY
Data can be obtained upon request based on a research proposal to be approved by both memory clinic centers. Due to privacy regulations and informed consent of the memory clinic patients included in this study, data is not made publicly available in a repository.
SUPPLEMENTARY MATERIAL
[1] The supplementary material is available in the electronic version of this article: https://dx.doi.org/10.3233/ADR-230040.
REFERENCES
[1] | Van Der Flier WM , Skoog I , Schneider JA , Pantoni L , Mok V , Chen CL , Scheltens P ((2018) )Vascular cognitive impairment.Nat Rev Dis Primers 4: ,18003. |
[2] | Kuˇcikien˙e D , Costa AS , Banning LCP , van Gils V , Schulz JB , Ramakers I , Verhey FRJ , Vos SJB , Reetz K ((2022) )The role of vascular risk factors in biomarker-based AT(N) groups: A German-Dutch Memory Clinic Study.J Alzheimers Dis 87: ,185–195. |
[3] | Liu W , Wong A , Law AC , Mok VC ((2015) )Cerebrovascular disease, amyloid plaques, and dementia.Stroke 46: ,1402–1407. |
[4] | Debette S , Schilling S , Duperron M-G , Larsson SC , Markus HS ((2019) )Clinical significance of magnetic resonance imaging markers of vascular brain injury: A systematic review and meta-analysis.JAMA Neurol 76: ,81–94. |
[5] | Kapasi A , Schneider J ((2016) )Vascular contributions to cognitive impairment, clinical Alzheimer’s disease, and dementia in older persons.Biochim Biophys Acta 1862: ,878–886. |
[6] | Dadar M , Camicioli R , Duchesne S , Collins DL ,Initiative AsDN ((2020) )The temporal relationships between white matter hyperintensities, neurodegeneration, amyloid beta, and cognition.Alzheimers Dement (Amst) 12: ,e12091. |
[7] | Vemuri P , Lesnick TG , Przybelski SA , Knopman DS , Preboske GM , Kantarci K , Raman MR , Machulda MM , Mielke MM , Lowe VJ , Senjem ML , Gunter JL , Rocca WA , Roberts RO , Petersen RC , Jack CR Jr , ((2015) )Vascular and amyloid pathologies are independent predictors of cognitive decline in normal elderly.Brain 138: ,761–771. |
[8] | Takeda S , Rakugi H , Morishita R ((2020) )Roles of vascular risk factors in the pathogenesis of dementia.Hypertens Res 43: ,162–167. |
[9] | Azarpazhooh MR , Avan A , Cipriano LE , Munoz DG , Sposato LA , Hachinski V ((2018) )Concomitant vascular and neurodegenerative pathologies double the risk of dementia.Alzheimers Dement 14: ,148–156. |
[10] | Biessels GJ ((2022) )Alzheimer’s disease, cerebrovascular disease and dementia: Lump, split or integrate?.Brain 145: ,2632–2634. |
[11] | Yassi N , Hilal S , Xia Y , Lim YY , Watson R , Kuijf H , Fowler C , Yates P , Maruff P , Martins R ((2020) )Influence of comorbidity of cerebrovascular disease and amyloid-β on Alzheimer’s disease.J Alzheimers Dis 73: ,897–907. |
[12] | Bos I , Verhey FR , Ramakers IH , Jacobs HI , Soininen H , Freund-Levi Y , Hampel H , Tsolaki M , Wallin ÅK , Van Buchem MA ((2017) )Cerebrovascular and amyloid pathology in predementia stages: The relationship with neurodegeneration and cognitive decline.Alzheimers Res Ther 9: ,101. |
[13] | Rabin JS , Schultz AP , Hedden T , Viswanathan A , Marshall GA , Kilpatrick E , Klein H , Buckley RF , Yang H-S , Properzi M , Rao V , Kirn DR , Papp KV , Rentz DM , Johnson KA , Sperling RA , Chhatwal JP ((2018) )Interactive associations of vascular risk and β-amyloid burden with cognitive decline in clinically normal elderly individuals: Findings from the Harvard Aging Brain Study.JAMA Neurol 75: ,1124–1131. |
[14] | Bos I , Vos SJB , Schindler SE , Hassenstab J , Xiong C , Grant E , Verhey F , Morris JC , Visser PJ , Fagan AM ((2019) )Vascular risk factors are associated with longitudinal changes in cerebrospinal fluid tau markers and cognition in preclinical Alzheimer’s disease.Alzheimers Dement 15: ,1149–1159. |
[15] | Jack CR Jr , Bennett DA , Blennow K , Carrillo MC , Dunn B , Haeberlein SB , Holtzman DM , Jagust W , Jessen F , Karlawish J ((2018) )NIA-AA research framework: Toward a biological definition of Alzheimer’s disease.Alzheimers Dement 14: ,535–562. |
[16] | Sachdev PS ((2020) )Developing robust biomarkers for vascular cognitive disorders: Adding ‘V’to the AT (N) research framework.Curr Opin Psychiatry 33: ,148–155. |
[17] | Hampel H , Cummings J , Blennow K , Gao P , Jack CR , Vergallo A ((2021) )Developing the ATX(N) classification for use across the Alzheimer disease continuum.Nat Rev Neurol 17: ,580–589. |
[18] | Folstein MF , Folstein SE , McHugh PR ((1975) )“Mini-mental state”. A practical method for grading the cognitive state of patients for the clinician.J Psychiatr Res 12: ,189–198. |
[19] | Nasreddine ZS , Phillips NA , Bédirian V , Charbonneau S , Whitehead V , Collin I , Cummings JL , Chertkow H ((2005) )The Montreal Cognitive Assessment, MoCA: A brief screening tool for mild cognitive impairment.J Am Geriatr Soc 53: ,695–699. |
[20] | Helmi L , Meagher D , O’Mahony E , O’Neill D , Mulligan O , Murthy S , McCarthy G , Adamis D ((2016) )Agreement and conversion formula between Mini-Mental State Examination and Montreal Cognitive Assessment in an outpatient sample.World J Psychiatry 6: ,358. |
[21] | Luck T , Pabst A , Rodriguez FS , Schroeter ML , Witte V , Hinz A , Mehnert A , Engel C , Loeffler M , Thiery J ((2018) )Age-, sex-, and education-specific norms for an extended CERAD Neuropsychological Assessment Battery— Results from the population-based LIFE-Adult-Study.Neuropsychology 32: ,461. |
[22] | Van Der Elst W ,et al ((2005) )Rey’s verbal learning test: Normative data for 1855 healthy participants aged 24–81 years and the influence of age, sex, education, and mode of presentation.J Int Neuropsychol Soc 11: ,290–302. |
[23] | Schmand B , Houx P , De Koning I ((2003) )Nederlands Instituut van Psychologen.Normen voor stroop kleur-woord tests, trail making test, en story recall van de rivermead behavioural memory test . |
[24] | Van der Elst W , Van Boxtel MP , Van Breukelen GJ , Jolles J ((2006) )The concept shifting test: Adult normative data.Psychol Assess 18: ,424. |
[25] | Diesfeldt H , Van Der Elst W , Jolles J ((2009) )Category fluency (animals, professions) in normal cognitive ageing and dementia.Tijdschr Gerontol Geriatr 40: ,54–71. |
[26] | Schmid NS , Ehrensperger MM , Berres M , Beck IR , Monsch AU ((2014) )The extension of the German CERAD neuropsychological assessment battery with tests assessing subcortical, executive and frontal functions improves accuracy in dementia diagnosis.Dement Geriatr Cogn Disord Extra 4: ,322–334. |
[27] | Aebi C ((2002) )Validierung Der neuropsychologischen Testbatterie CERAD-NP: Eine multi-center studie. Thesis.University of Basel. |
[28] | Jessen F , Amariglio RE , Buckley RF , van der Flier WM , Han Y , Molinuevo JL , Rabin L , Rentz DM , Rodriguez-Gomez O , Saykin AJ , Sikkes SAM , Smart CM , Wolfsgruber S , Wagner M ((2020) )The characterisation of subjective cognitive decline.Lancet Neurol 19: ,271–278. |
[29] | Petersen RC ((2004) )Mild cognitive impairment as a diagnostic entity.J Intern Med 256: ,183–194. |
[30] | Reynolds D ((2009) )Gaussian mixture models. In Encyclopedia of Biometrics , Li SZ, Jain A, eds.Springer US,Boston, MA, pp.659–663. |
[31] | Scheltens P , Leys D , Barkhof F , Huglo D , Weinstein HC , Vermersch P , Kuiper M , Steinling M , Wolters EC , Valk J ((1992) )Atrophy of medial temporal lobes on MRI in“probable” Alzheimer’s disease and normal ageing: Diagnostic value and neuropsychological correlates.J Neurol Neurosurg Psychiatry 55: ,967–972. |
[32] | Koedam EL , Lehmann M , van der Flier WM , Scheltens P , Pijnenburg YA , Fox N , Barkhof F , Wattjes MP ((2011) )Visual assessment of posterior atrophy development of a MRI rating scale.Eur Radiol 21: ,2618–2625. |
[33] | Fazekas F , Chawluk JB , Alavi A , Hurtig HI , Zimmerman RA ((1987) )MR signal abnormalities at 1.5 T in Alzheimer’s dementia and normal aging.Am J Neuroradiol 8: ,421–426. |
[34] | Fazekas F , Barkhof F , Wahlund L , Pantoni L , Erkinjuntti T , Scheltens P , Schmidt R ((2002) )CT and MRI rating of white matter lesions.Cerebrovasc Dis 13: ,31–36. |
[35] | Cnaan A , Laird NM , Slasor P ((1997) )Using the general linear mixed model to analyse unbalanced repeated measures and longitudinal data.Stat Med 16: ,2349–2380. |
[36] | Molenberghs G , Bijnens L , Shaw D ((1997) )Linear mixed models and missing data. In Linear Mixed Models in Practice: A SAS-Oriented Approach , Verbeke G, Molenberghs G, eds.Springer New York,New York pp.191–274. |
[37] | Libon DJ , Price CC , Giovannetti T , Swenson R , Bettcher BM , Heilman KM , Pennisi A ((2008) )Linking MRI hyperintensities with patterns of neuropsychological impairment: Evidence for a threshold effect.Stroke 39: ,806–813. |
[38] | Graff-Radford J , Botha H , Rabinstein AA , Gunter JL , Przybelski SA , Lesnick T , Huston J , Flemming KD , Preboske GM , Senjem ML ((2019) )Cerebral microbleeds: Prevalence and relationship to amyloid burden.Neurology 92: ,e253–e262. |
[39] | Dierksen GA , Skehan ME , Khan MA , Jeng J , Nandigam RNK , Becker JA , Kumar A , Neal KL , Betensky RA , Frosch MP ((2010) )Spatial relation between microbleeds and amyloid deposits in amyloid angiopathy.Ann Neurol 68: ,545–548. |
[40] | Costa AS , Pinho J , Kučikienė D , Reich A , Schulz JB , Reetz K ((2021) )Cerebral amyloid angiopathy in amyloid-positive patients from a memory clinic cohort.J Alzheimers Dis 79: ,1661–1672. |
[41] | Baker JE , Lim YY , Pietrzak RH , Hassenstab J , Snyder PJ , Masters CL , Maruff P ((2017) )Cognitive impairment and decline in cognitively normal older adults with high amyloid-β: A meta-analysis.Alzheimers Dement (Amst) 6: ,108–121. |
[42] | Reed BR , Mungas DM , Kramer JH , Ellis W , Vinters HV , Zarow C , Jagust WJ , Chui HC ((2007) )Profiles of neuropsychological impairment in autopsy-defined Alzheimer’s disease and cerebrovascular disease.Brain 130: ,731–739. |
[43] | Caprihan A , Raja R , Hillmer LJ , Erhardt EB , Prestopnik J , Thompson J , Adair JC , Knoefel JE , Rosenberg GA ((2021) )A double-dichotomy clustering of dual pathology dementia patients.Cereb Circ Cogn Behav 2: ,100011. |
[44] | Akoudad S , Wolters FJ , Viswanathan A , de Bruijn RF , van der Lugt A , Hofman A , Koudstaal PJ , Ikram MA , Vernooij MW ((2016) )Association of cerebral microbleeds with cognitive decline and dementia.JAMA Neurol 73: ,934–943. |
[45] | Li L , Wu D-H , Li H-Q , Tan L , Xu W , Dong Q , Tan L , Yu J-T ,Alzheimer’s Disease Neuroimaging Initiative ((2020) )Association of cerebral microbleeds with cognitive decline: A longitudinal study.J Alzheimers Dis 75: ,571–579. |
[46] | Ding J , Sigurðsson S , Jónsson PV , Eiriksdottir G , Meirelles O , Kjartansson O , Lopez OL , van Buchem MA , Gudnason V , Launer LJ ((2017) )Space and location of cerebral microbleeds, cognitive decline, and dementia in the community.Neurology 88: ,2089–2097. |
[47] | Montandon M-L , Herrmann FR , Garibotto V , Rodriguez C , Haller S , Giannakopoulos P ((2020) )Microbleeds and medial temporal atrophy determine cognitive trajectories in normal aging: A longitudinal PET-MRI study.J Alzheimers Dis 77: ,1431–1442. |
[48] | Boyle PA , Yu L , Fleischman DA , Leurgans S , Yang J , Wilson RS , Schneider JA , Arvanitakis Z , Arfanakis K , Bennett DA ((2016) )White matter hyperintensities, incident mild cognitive impairment, and cognitive decline in old age.Ann Clin Transl Neurol 3: ,791–800. |
[49] | Mortamais M , Artero S , Ritchie K ((2013) )Cerebral white matter hyperintensities in the prediction of cognitive decline and incident dementia.Int Rev Psychiatry 25: ,686–698. |
[50] | Azeem F , Durrani R , Zerna C , Smith EE ((2020) )Silent brain infarctions and cognition decline: Systematic review and meta-analysis.J Neurol 267: ,502–512. |
[51] | van der Vlies AE , Goos JD , Barkhof F , Scheltens P , van der Flier WM ((2012) )Microbleeds do not affect rate of cognitive decline in Alzheimer disease.Neurology 79: ,763–769. |
[52] | Chiang GC , Hernandez JC , Kantarci K , Jack C , Weiner MW ,Alzheimer’s Disease Neuroimaging Initiative ((2015) )Cerebral microbleeds, CSF p-tau, and cognitive decline: Significance of anatomic distribution.Am J Neuroradiol 36: ,1635–1641. |
[53] | Saridin FN , Hilal S , Villaraza SG , Reilhac A , Gyanwali B , Tanaka T , Stephenson MC , Ng SL , Vrooman H , van der Flier WM ((2020) )Brain amyloid β, cerebral small vessel disease, and cognition: A memory clinic study.Neurology 95: ,e2845–e2853. |
[54] | Lim E-Y , Ryu S-Y , Shim YS , Yang D-W , Cho A-H ((2020) )Coexistence of cerebral microbleeds and amyloid pathology in patients with cognitive complaints.J Clin Neurol 16: ,83–89. |
[55] | Marchant NL , Reed BR , DeCarli CS , Madison CM , Weiner MW , Chui HC , Jagust WJ ((2012) )Cerebrovascular disease, beta-amyloid, and cognition in aging.Neurobiol Aging 33: ,e1025–1006.e1036. |
[56] | Park J-H , Seo SW , Kim C , Kim SH , Kim GH , Kim ST , Jeon S , Lee JM , Oh SJ , Kim JS ((2014) )Effects of cerebrovascular disease and amyloid beta burden on cognition in subjects with subcortical vascular cognitive impairment.Neurobiol Aging 35: ,254–260. |
[57] | Ganguli M , Fu B , Snitz BE , Unverzagt FW , Loewenstein DA , Hughes TF , Chang C-CH ((2014) )Vascular risk factors and cognitive decline in a population sample.Alzheimer Dis Assoc Disord 28: ,9. |
[58] | Gottesman RF , Schneider ALC , Zhou Y , Coresh J , Green E , Gupta N , Knopman DS , Mintz A , Rahmim A , Sharrett AR , Wagenknecht LE , Wong DF , Mosley TH ((2017) )Association between midlife vascular risk factors and estimated brain amyloid deposition.JAMA 317: ,1443–1450. |
[59] | Kemppainen N , Johansson J , Teuho J , Parkkola R , Joutsa J , Ngandu T , Solomon A , Stephen R , Liu Y , Hänninen T , Paajanen T , Laatikainen T , Soininen H , Jula A , Rokka J , Rissanen E , Vahlberg T , Peltoniemi J , Kivipelto M , Rinne JO ((2018) )Brain amyloid load and its associations with cognition and vascular risk factors in FINGER Study.Neurology 90: ,e206–e213. |
[60] | Pettigrew C , Soldan A , Wang J , Wang M-C , Arthur K , Moghekar A , Gottesman RF , Albert M ((2020) )Association of midlife vascular risk and AD biomarkers with subsequent cognitive decline.Neurology 95: ,e3093–3103. |
[61] | DeCarli C , Villeneuve S , Maillard P , Harvey D , Singh B , Carmichael O , Fletcher E , Olichney J , Farias S , Jagust W , Reed B , Mungas D ((2019) )Vascular burden score impacts cognition independent of amyloid PET and MRI measures of Alzheimer’s disease and vascular brain injury.J Alzheimers Dis 68: ,187–196. |

